crop residue effects on nitrogen mineralization, microbial biomass, and rice yield in submerged...
TRANSCRIPT

Crop Residue Effects on Nitrogen Mineralization, Microbial Biomass,and Rice Yield in Submerged Soils
A. Clement, J. K. Ladha,* and F.-P. Chalifour
ABSTRACTUrea, crop residues, and green manure are all suitable sources of
N for lowland rice (Oryza saliva L.). However, N sources undergomineralization at different rates, affecting rice N uptake and utilization.Little is known about the effect of the chemical composition of cropresidues on N mineralization and rice performance. Two greenhouseexperiments were conducted to determine the dynamics of N mineral-ization, microbial biomass, and rice N uptake. Twelve treatmentsrepresenting a wide range of crop residue chemical composition and twocontrols (with and without urea) were compared. The N mineralizationpattern ranged from rapid (Sesbania rostata Brem. & Oberm.) toimmobilization at the beginning of the season (Cassia velosa L.).Immediately after incorporation, N mineralization was positively cor-related to crop residue N concentration (r2 = 0.64, significant at P <0.01), and negatively correlated to tannin concentration. However, attillering, the tannin/N ratio was best correlated to the rate of N release(r2 - 0.86, significant at P < 0.01). Grain yield was best predictedby the (lignin + polyphenol)/N ratio (r2 = 0.67, significant at P <0.01). Incorporation of residue into soil generally increased microbialbiomass ninhydrin-reactive N compared with control treatments atthe tillering stage, but not at maturity. Microbial biomass N washighly correlated to soil NH4
+ -N at rice tillering (r2 = 0.76, significantat P < 0.01). The N derived from fertilizer in rice was 35.4% onaverage for residue treatments, which was comparable with that ofthe urea control (33.5%). This study emphasizes the importance ofconsidering the interactions among chemical constituents of crop resi-dues to understand the dynamics of N release and uptake by rice.
ALARGE NUMBER of leguminous plants as well asplant residues are used as green manure (GM) to
substitute for mineral fertilizers in lowland rice produc-tion (Vacchani and Murty, 1964). The most commonlyused GM crops are aquatic species of Sesbania andAeschynomene. Species such as Indigofera tinctoria (L.),Desmanthus virgatus (L.) Wild, and Cajanus cajan (L.)Millsp. have also been tested as dual-purpose crops(forage, grain, and/or GM). Shrubs or trees such asGliriddia septum (Jacq.) WALP, Leucaena leucocephala(Lam.) de Wit, and Cassia velosa (L.) are grown onrice field dikes and their leaf toppings used as GM (Ladhaand Garity, 1994). Unlike mineral fertilizers, plant resi-dues undergo mineralization before N becomes availableto rice. It is important to understand the transformationprocesses of residue N and the factors controlling themto match patterns of N mineralization with rice N uptake.Achieving synchronization of N supply from decompos-ing residue and crop N demand is expected to increasethe overall efficiency of N (McGill and Myers, 1987).
Wide variations in the chemical composition of plant
A. Clement, IRRI/Laval Collaborative Research Project, and F.-P Chali-four, D^partement de phytologie, Faculte des sciences de 1'agriculture etde I'alimentation, Universite Laval, Quebec, G1K 7P4, Canada; andJ.K. Ladha, International Rice Research Inst., P.O. Box 933, Manila,Philippines. Received 30 Nov. 1994. *Corresponding author(IN"%[email protected]")
Published in Soil Sci. Soc. Am. J. 59:1595-1603 (1995).
residues exist. These affect the mineralization and releaseof N. Under upland or nonsubmerged conditions, thefactors related to residue composition that control Nrelease have been identified as initial N content (Con-stantinides and Fownes, 1994), PP/N (Oglesby andFownes, 1992), (L+PP)/N (Fox et al., 1990) and L/N(Melillo et al., 1982). However, factors that controlresidue decomposition under lowland or submerged con-ditions have received little attention. Using low-polyphenol-contentresidues, Becker etal. (1994b) identi-fied L/N as a significant factor controlling N release.
The objective of this study was to compare crop resi-dues representing a wide spectrum of chemical composi-tion (particularly polyphenols and tannins) and to identifyfactors that influence N release, microbial biomass, andrice growth under submerged conditions.
MATERIALS AND METHODSTwo pot experiments (with and without rice) were conducted
under greenhouse conditions at the International Rice ResearchInstitute, Los Banos, Philippines, between July and October1992. Fourteen treatments were included (Table 1). The controltreatments were with and without urea N. Selection of the11 residue treatments was based on differences in chemicalcomposition. In Treatment 4, tannins, as tannic acid (SigmaChemical Co., St. Louis, MO), were added to Sesbania rostrataat the rate of 0.491 g pot"1. This represents an amount thatcan be found in a high-tannin-content species. Plastic containerswere filled with 12 kg of fresh (142 g kg"1 moisture content),sieved (1 cm) Maahas clay soil with the following characteris-tics: pH (1:1 w/v in H2O) 6.6, organic C 14 g kg"1, total N 1.2g kg"1, P (Olsen et al., 1954) 22 g kg"1, and cation-exchangecapacity 23 cmolc kg"1. Pots were submerged 20 d beforeincorporation of residues and kept submerged with a 5-cmwater layer afterward. On 1 July, fresh residues were cut into1-cm pieces and thoroughly mixed with the soil at the rate of0.39 g N por1. This is roughly equivalent to 80 kg N ha '.In the urea control, 0.39 g N pot~' as urea at 5.00 atom %excess 15N was thoroughly mixed with the soil.
In both experiments, treatments were replicated four timesin a randomized complete block design. In Experiment 1, norice was transplanted. Soil samples were collected every weekfor the first 6 wk and then every 2 wk for a total of 16 wk.At each sampling, exchangeable NH4
+-N was determined. Inthe second experiment, on 2 July, three 15-d-old rice seedlings(IR74) were transplanted in each pot, and thinned to twoseedlings after 2 wk. Four replicate pots were sampled attillering, panicle booting, and maturity. At each sampling,total aboveground dry matter, rice N uptake, microbial biomassninhydrin-reactive N, and soil exchangeable NH4-N weredetermined. In addition, grain and straw yields were measuredat maturity.
Abbreviations: DAI, days after incorporation; GM, green manure; Ndff,N derived from fertilizer; L/N, lignin to nitrogen ratio; PP/N, polyphenolto nitrogen ratio; T/N, tannin to nitrogen ratio; (L+T)/N, lignin + tanninto nitrogen ratio; (L + PP)/N, lignin + polyphenol to nitrogen ratio; NUE,nitrogen use efficiency.
1595

1596 SOIL SCI. SOC. AM. J., VOL. 59, NOVEMBER-DECEMBER 1995
Table 1. Treatments and chemical composition of the species studied in Experiments 1 and 2.Tit.
1234567891011121314
Description
No NUreaSesbania rostrataS. rostrata + tanninAeschynomene afrasperaAeschynomene niloticaCajanus cajanCassia velosaDesmanthus virguatusGlyricidia sepiumIndigofera tinctoriaLeucaena leucocephalaS. emerusSorghum bicolor
Plant part
—_LeavesLeavesWhole plantWhole plantLeavesLeavesWhole plantLeavesLeavesLeavesWhole plantLeaves
C
__
474474468460500508480454479484470455
N
__
48.045.225.928.240.832.822.329.655.840.821.630.8
Lignin
__474585
10016078
1161035283
13734
Cellulosee kr~'b Kb
__
159150313282169136364133124130356271
Polyphenols
__2583403633
137243049961820
Tannins
—_
2.22.1
10.06.95.0
22.83.43.33.8
12.82.81.4
Chemical Analysis of Plants and SoilTotal rice plant N was analyzed by the semimicro-Kjeldahl
method (Bremner and Mulvaney, 1982), using a Kjeltec System1026 (Tecator, Sweden). Soil NH4
+-N was extracted with a2 M KC1 solution and determined by distillation and titration.Microbial biomass N in the soil was quantified by a chloroformfumigation-extraction method (Brookes et al., 1985) as modi-fied by Gaunt (1993). Soil sampling was done by inserting asharpened plastic tube (3-cm i.d.) into the pots, down to thebottom, and removing it after blocking the open portion tocreate a suction effect. Two soil samples were collected perpot, and placed in plastic bags. Excess water was removedand plastic bags were closed without air inclusion. Sampleswere kept on ice and processed within 6 h in the lab. Aftermixing the soil in plastic bags, a 20-g sample of the water-saturated soil (water content averaged 400 g kg"1 soil) wasplaced into a 150-mL screw-cap Pyrex tube. Soil was spreadon the surface of the tube and 1 mL of alcohol-free chloroformwas added to the tubes before they were sealed. After a 24-hfumigation, 50 mL of 2 M KC1 were added to the tubes, whichwere shaken for 1 h. Two additional samples were collected,one for the unfumigated set (extracted at the beginning ofthe fumigation period) and one for determination of moisturecontent. Ninhydrin-N (Joergensen and Brookes, 1990) wasmeasured for both fumigated and unfumigated samples. Micro-bial biomass ninhydrin-N was computed by subtracting thevalue of the unfumigated samples from that of the fumigatedsamples.
Total C and N in the residues were analyzed by a drycombustion method with a Perkin-Elmer 2400 CHN analyzer(Perkin Elmer Corp., Norwalk, CT) (Jimenez and Ladha,1993). Lignin and cellulose were determined by the acid deter-gent fiber and acid detergent lignin methods of Goering andVan Soest (1970). Polyphenols were extracted with a solutionof 1% HC1 in methanol and determined using the Folin &Ciocalteu reagent with tannic acid as a standard (Singleton andRossi, 1965). The same extract was used to analyze condensedtannins using the vanillin assay (Broadhurst and Jones, 1978)with +catechin as a standard.
Labeling of Plant ResidueTo measure the recovery of residue N in rice, 15N-labeled
residues were used (Buresh et al., 1982). Residues were en-riched by three foliar applications of 300 mL of 0.01 M 15N(prepared from 99.6 atom % excess I5N urea), containing0.1% (v/v) Tween 80, at weekly intervals. Each species wasfield grown in 1-m2 microplots. The 15N enrichment of residueswas determined by mass spectrometry (VG Model 903, VGIsogas, Middlewich, England) at the Analytical Services Labo-
ratory of IRRI. Prior to incorporation, the atom % excess 15Nof residue ranged between 0.2511 for C. velosa leaves and0.6514 for C. cajan leaves. The NdfF was calculated as
%Ndff = atom % excess 15N (rice) ]atom % excess 15N (urea or residue)]
100
The atom % excess I5N of rice whole-plant samples (above-ground) used in the calculation was the weighted average ofthe atom % excess 15N of straw and grain, calculated as follows(Chalifour and Nelson, 1987):atom % excess 15N (rice) =
[atom % excess 15N (straw) X straw N yield]+ [atom % excess 15N (grain) x grain N yield]
(straw N yield + grain N yield)
Statistical Analyses
In Experiment 1, soil NH/-N in pots was transformed topercentage applied N mineralization. Percentage mineraliza-tion represents the amount of soil NH^-N in the residuetreatment minus that of the no-N control, divided by the amountof N applied as residue amendment and multiplied by 100.Nitrogen use efficiency was calculated as the grain yield in-crease (dry-weight basis) divided by the quantity of N applied(Novoa and Loomis, 1981). The NUE(rel) represents the Nuse efficiency based on the quantity of N mineralized duringthe season:NUE(rel) =
[grain yield (residue or urea) — grain yield (control)](quantity of N applied x % N mineralized at maturity)where residue N mineralized at maturity is derived from empiri-cal N mineralization curves obtained from Experiment 1 (with-out rice plants) at 109 DAI. In the case of the urea control,it was considered that mineralization reached 100%.
The SAS (SAS Institute, 1990) general linear models (GLM)procedure was used for analyses of variance and comparisonamong treatments by the Waller-Duncan Jf-ratio test. Thestepwise multiple regression procedure was used to select themost influential variables by eliminating those highly correlatedamong themselves. All data sets were tested for homogeneityof variances using Bartlett's test (Steel and Torrie, 1980).Transformations were done only when variance was not homo-geneous.

CLEMENT ET AL.: COMPOSITION OF CROP RESIDUES IN SUBMERGED SOILS 1597
80
S1E
eg
o>££
60-
40-
20-
0-
(20)
80-
60-
40-
20-
0
y = -212 + 6.9x - 0.09x2 + 0.00058x3
- (1 .aSXIO-ejx4 + 212 (0.95X) + 5.22^x
m-r • n ny = 71 -0.025X- 70. 1(0.94)"
r2 = 0.94"
C. cajanoto o
CM
Days after incorporationFig. 1. Residue N mineralization of two residue treatments, Experi-
ment 1. Values are means of four replications. Bars indicate stan-dard error of the means.
RESULTSResidue treatments covered a wide range of chemical
composition (Table 1). Carbon was the least variable,with an average of 475 g kg ~'. Nitrogen ranged from 21.6g kg"1 (Sesbania emerus Taub) to 55 g kg"1 (/. tinctoria).Lignin was as low as 34 g kg"1 in sorghum [Sorghumbicolor (L.) Moench] and as high as 160 g kg"1 in C.cajan. Cellulose ranged between 124 and 364 g kg"1.Polyphenols, which include a large number of aromaticcompounds, ranged from <20 g kg"' in 5. emerus to about140 g kg"' in C. velosa. Cassia velosa also had the highestcondensed tannin content (23 g kg"1).
Experiment 1: Pots without PlantsIn all cases but one, residue N mineralization followed
an exponential trend, with the highest rates of mineraliza-tion at the beginning of the season, followed by a gradualdecrease in rates. The only exception was C. velosa,where N immobilization was observed until 30 DAI (Fig.1). For all residue treatments, empirical equations wereused to describe mineralization percentage through time.Exponential equations (% mineralization = a 4- b(DAI)+ c(dDM) were used to fit the data, except for C. velosa,where a more complex relationship was used (Fig. 1).All equations were highly significant (P < 0.001) withr2 values ranging between 0.86 (5. rostrata + tannins)and 0.95 (L. leucocephala).
The rate of N mineralization was computed as thederivative of mineralization percentage equations dividedby 100 and multiplied by the quantity of N applied asresidue. Three major patterns of mineralization rates
S. rostrataC. velosaI. tinctoriaL. leucocephala
Fig.
10 20 30 40Days after incorporation
2. Rate of residue-N mineralization of selected species.
represented by five species (Fig. 2) were found. Indi-gofera tinctoria and 5. rostrata leaves had the fastestrate of mineralization immediately after incorporation.Leucaena leucocephala and 5. emerus had a slower andmore regular release pattern, whereas C. velosa immobi-lized N for the first 14 DAI (Fig. 2). Later in the season,differences among species were reduced, and by 21 DAI,the rate of N mineralization was lower than 5 mg d"'pot"1 in all cases (data not shown). Cassia velosa hadthe highest rate of N mineralization between 30 and 60DAI (Fig. 2). Tannin addition had no significant impacton the N release pattern of 5. rostrata (data not shown).
To provide information on N release, three samplingdates (1, 39, and 71 DAI) were selected for multipleregression analysis. Early mineralization is of particularinterest since most decomposition models are describedby single exponential decay functions, indicating thatdecomposition proceeds at maximum rates immediatelyafter incorporation (Wieder and Lang, 1982). This isillustrated in our case in Fig. 2, the only exception beingC. velosa.
Regression analysis showed that the initial (1 DAI)residue-N mineralization rate was related to a numberof factors, the most important being the positive effectof N concentration (r2 = 0.64, P < 0.01; Table 2).There was also a significant negative effect of (L+PP)/N. Hence a larger (L+PP)/N resulted in a lower Nmineralization rate. Similar negative relationships wereobserved in the case of T/N, L/N, and C/N (Table 2).Multiple regression analysis, however, underlined onlytwo factors: the positive effect of N concentration andthe inhibitory effect of condensed tannins.Rate of N mineralization (1 DAI) =
-8.42 + 10.07(%N)- 9.94(%tannin)r2 = 0.81,P<0.01 [1]
The relationship between chemical composition andmineralization of crop residue was different at 39 DAI.The most significant factor related to N mineralizationrate was T/N (r2 = 0.86, P < 0.01; Table 2). The rate
1598 SOIL SCI. SOC. AM. J., VOL. 59, NOVEMBER-DECEMBER 1995
Table 2. Coefficients of determination of regressions between the chemical composition of crop residue and the rate of mineralizationat 1 and 39 DAIf, grain yield, N use efficiency, and microbial biomass ninhydrin-reactive N. Sign in parentheses indicates negativeslope.
Chemicalcompositionof residues
N, g kg-'lignin, g kg-'cellulose, g kg"1
tannin, g kg"1
PPt, g kg-'C/NLignin/NCellulose/NTannin/NPP/N(lignin + tannin)/N(ligning + PP)/N
Rate of residue-Nmineralization
1 DAI
0.64**(-)0.39*(-)0.21(-)0.40*(-)0.08(-)0.42*(-)0.42*(-)0.26(-)0.49**(-)0.32(-)O.SO**(-)0.61**
39 DAI
(-)0.230.170.010.81**0.40*0.180.200.070.86**0.69**0.310.53**
Total Nyield
0.18(-)0.31(-)0.07(-)0.09(-)0.04(-)0.29(-)0.39*(-)0.14(-)0.16(-)0.13(-)0.43*(-)0.58**
Grainyield
0.30( - )0.40*(-)0.17(-)0.05
0.00(-)0.45*(-)0.55**(-)0.27(-)0.12(-)0.07( - )0.59**(-)0.67**
N useefficiency
0.25(-)0.48**(-)0.12(-)O.IO(-)O.Ol(-)0.37*(-)0.52**(-)0.20(-)0.16( - )0.08(-)0.56**( - )0.65**
Microbial biomass
39 DAI
0.200.00
(-)0.05(-)0.37*(-)0.19(-)0.19(-)0.06(-)0.08(-)O.Sl**(-)0.36*(-)O.IO(-)0.30
109 DAI
0.43*(-)O.Ol(-)0.36*
0.000.02
(-)0.37*(-)0.13(-)0.36*
0.000.00
(-)0.13(-)O.ll
*, ** Significant at the 0.05 and 0.01 probability level, respectively.t DAI = days after incorporation.t PP = polyphenols.
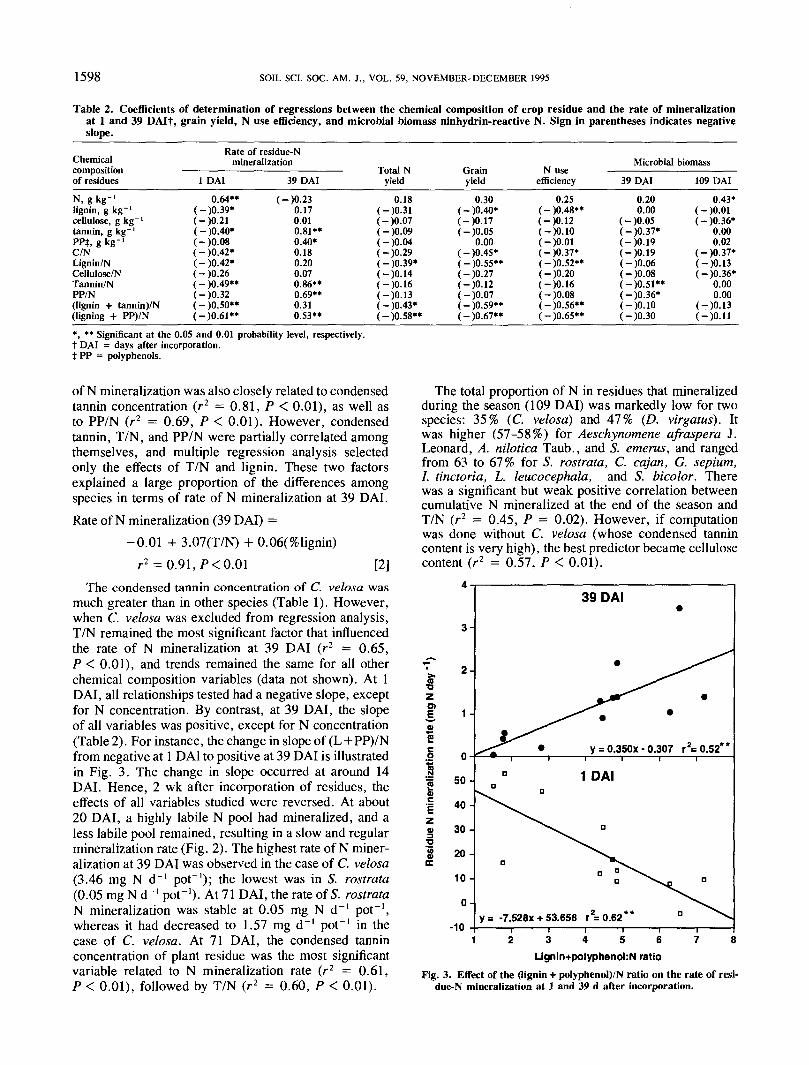
of N mineralization was also closely related to condensedtannin concentration (r2 = 0.81, P < 0.01), as well asto PP/N (r2 = 0.69, P < 0.01). However, condensedtannin, T/N, and PP/N were partially correlated amongthemselves, and multiple regression analysis selectedonly the effects of T/N and lignin. These two factorsexplained a large proportion of the differences amongspecies in terms of rate of N mineralization at 39 DAI.Rate of N mineralization (39 DAI) =
-0.01 + 3.07(T/N) + 0.06(%lignin)r2 = 0.91, P< 0.01 [2]
The condensed tannin concentration of C. velosa wasmuch greater than in other species (Table 1). However,when C. velosa was excluded from regression analysis,T/N remained the most significant factor that influencedthe rate of N mineralization at 39 DAI (r2 = 0.65,P < 0.01), and trends remained the same for all otherchemical composition variables (data not shown). At 1DAI, all relationships tested had a negative slope, exceptfor N concentration. By contrast, at 39 DAI, the slopeof all variables was positive, except for N concentration(Table 2). For instance, the change in slope of (L+PP)/Nfrom negative at 1 DAI to positive at 39 DAI is illustratedin Fig. 3. The change in slope occurred at around 14DAI. Hence, 2 wk after incorporation of residues, theeffects of all variables studied were reversed. At about20 DAI, a highly labile N pool had mineralized, and aless labile pool remained, resulting in a slow and regularmineralization rate (Fig. 2). The highest rate of N miner-alization at 39 DAI was observed in the case of C. velosa(3.46 mg N d~' pot"1); the lowest was in S. rostrata(0.05 mg N d"1 pot"1). At 71 DAI, the rate of 5. rostrataN mineralization was stable at 0.05 mg N d~' pot"1,whereas it had decreased to 1.57 mg d"1 pot"1 in thecase of C. velosa. At 71 DAI, the condensed tanninconcentration of plant residue was the most significantvariable related to N mineralization rate (r2 = 0.61,P < 0.01), followed by T/N (r2 = 0.60, P < 0.01).
The total proportion of N in residues that mineralizedduring the season (109 DAI) was markedly low for twospecies: 35% (C. velosa) and 47% (D. virgatus). Itwas higher (57-58%) for Aeschynomene afraspera J.Leonard, A. nilotica Taub., and S. emerus, and rangedfrom 63 to 67% for S. rostrata, C. cajan, G. septum,I. tinctoria, L. leucocephala, and 5. bicolor. Therewas a significant but weak positive correlation betweencumulative N mineralized at the end of the season andT/N (r2 = 0.45, P = 0.02). However, if computationwas done without C. velosa (whose condensed tannincontent is very high), the best predictor became cellulosecontent (r2 = 0.57, P < 0.01).
•oz01
0)
S§
Ezo>
3-
2-
1 -
50-
40-
30-
20-
10-
0-
-10
39 DAI
y = 0.350X • 0.307 r2=0.52**
1 DAI
y = -7.528X + 53.658 r2=0.62**
3 4 5 6Lignin+polyphenokN ratio
Fig. 3. Effect of the (lignin + polyphenol)/N ratio on the rate of resi-due-N mineralization at 1 and 39 d after incorporation.

CLEMENT ET AL.: COMPOSITION OF CROP RESIDUES IN SUBMERGED SOILS 1599
Table 3. Soil NH4* -N and microbial biomass, grain yield of rice, Ndfft percentage, NUEJ, and NUE(rel)§ as influenced by residueincorporation in Experiment 2.
Treatment!
N o NUreaS. rostrataS. rostrata + tanninA. afrasperaA. niloticaC. cajanC. velosaD. virguatusG. septumI. tinctoriaL. leucocephalaS. emerusS. bicolorCV##, %
Soil NH/-N39 DAT#tt
mg kg-'1.2 fttl.Sef
9.2 cd14.9 bel.Sef3.8 de
42.5 a1.8 ef1.7 ef
20.6 a-c16.2 be14.4 c12.2 c37.1 ab4.9
Microbial biomass N
39 DATttmg ninhydrin-N
2.6 f4.9 ef
13.7 b-d11.5 c-e5.2 ef4.7 ef
29.8 a3.4 f7.4 d-f
15.7 be25.0 ab15.2 b-d22.2 a-c31.7 a26.1
109 DAT
kg'1 soil5.8 a-c5.8 a-c5.9 a-c4.7 be5.4 a-c5.8 ab6.0 a-c5.7 a-c5.1 a-c6.0 ab7.2 a4.8 be4.3 c4.2 be
17.0
Grain yield
gpot-'20.7 e38.6 ab38.2 ab36.3 a-c36.4 a-c36.1 a-c33.8 cd31.0 d31.2 d35.4 be37.3 a-c39.5 a31.0 d38.4 ab7.8
NUE
—— kg rice kg"1
_45.6 ab51.0 a45.5 ab41.4 a-c40.9 be32.2 cd28.9 d33.6 cd40.7 be40.9 be46.8 ab28.7 d43.9 ab16.3
NUE(rel)1 N ——
—45.6 e70.2 c62.3 cd64.7 cd64.5 cd46.4 e71.6 c76.0 be54.0 de67.2 cd89.5 ab47.5 e97.6 a16.1
Ndff
%—
33.5 a-c36.1 a-c36.4 a-c31.5 c37.1 ab32.9 be37.5 ab33.8 a-c33.6 a-c37.8 ab38.8 a33.6 a-c35.5 a-c8.8
t Ndff = N derived from the fertilizer.t NUE = N use efficiency.§ NUE(rel) = N use efficiency computed on the basis of residue or urea N mineralized during the season.1 All N applied before transplanting in residue treatments and urea control at the rate of 0.3927 g pot"1.# DAT = days after transplanting.tt Results are means of four replicates of log data transformed back to original scale.M Within each column, means followed by the same letter do not differ significantly by Waller-Duncan's /f-ratio test (K-ratio = 100).## CV = coefficient of variation.
Experiment 2. Pots with Rice PlantsResidue Nitrogen Release and Rice Nitrogen Uptake
At the tillering stage (39 DAI), N uptake of rice wassignificantly higher with urea (0.400 g N pot"1) thanwith residue treatments (0.175 g N pot~' on average).Nitrogen uptake in the no-N control was 0.173 g pot"1,not significantly different from residue treatments, exceptfor C. cajan, which yielded only 0.06 g N pot"1.
Soil NH|-N differed markedly among treatments at39 DAI (Table 3). Both controls had the lowestNH/-N, with <2 mg N kg"1 soil. Tannin combinedwith 5. rostrata had no significant effect (Table 3).Highest values were found in C. cajan, at 42.5 mg kg"1.
Cajanus cajan also resulted in the lowest number oftillers. Soil NH^-N was negatively correlated to thenumber of tillers (r2 = 0.72, P < 0.01).
At booting stage (71 DAI), N uptake was highest in theurea treatment (0.58 g pot"1), but it was not significantlydifferent from that of L. leucocephala (0.48 g pot"1;Fig. 4), /. tinctoria (0.46 g pot"1), and S. rostrata (0.43g pot"1). Lowest N uptake was measured in the no-Ncontrol (0.28 g por1), followed by C. velosa (0.30 gpot"1; Fig. 4). Nitrogen concentration of incorporatedresidues was most highly correlated to rice N uptake(r2 = 0.35; P = 0.04). The number of tillers of residuetreatments at booting stage was 10% higher, on average,
Q.O)
iuo
0.8
0.7
0.6
0.5
0.3
0.2
0.1
0
Release, urea controlUptake, urea controlRelease, no N controlUptake, no N control
Release, L. leucocephalaRelease, C. velosaUptake, L leucocephalaUptake, C. velosa
30 60 90 120 0 30Days after incorporation
60 90 120
Fig. 4. Comparison of seasonal N uptake and release pattern for (a) control treatments and (b) C. velosa and L. leucocephala.

1600 SOIL SCI. SOC. AM. J., VOL. 59, NOVEMBER-DECEMBER 1995
than during the tillering stage. In the urea treatment, thenumber of tillers decreased by 30% from tillering tobooting, but it was still significantly greater than in theother treatments.
At maturity, N uptake of the urea treatment was stillhighest (0.53 g pot"1). However, it was not significantlydifferent from that of L. leucocephala (0.52 g pot"1).Among residue treatments, C. velosa led to the lowestN uptake (0.41 g pot"1), which was still significantlyhigher than the no-N control (0.27 g pot"1). Nitrogenrelease and N uptake of two extreme residue treatments(represented by C. velosa and L. leucocephala) and twocontrol treatments (no N and urea N) are compared inFig. 4. The mineralization of N from residues was moregradual than that of N from urea, and, early in theseason, N uptake was markedly lower in the residuetreatments than in the urea treatment (Fig. 4). In allcases, N uptake at maturity was less than N release (Fig.4), despite very low soil NH|-N in all treatments (<3mg kg"1) at both booting and maturity. The differenceincludes root N, which was not measured.
Microbial Biomass NitrogenMicrobial biomass ninhydrin-reactive N was signifi-
cantly influenced by treatments (Table 3). At tillering(39 DAI), it was particularly low in both controls, butalso for some residue treatments, such as C. velosa,A. afraspera, A. nllotica, and D. virgatus. It was highestin 5. bicolor and C. cajan treatments (Table 3). Microbialbiomass N was apparently limited by N availability, asindicated by a significant regression with soil NHI-N(r2 = 0.76, P < 0.01). There was a significant but weakrelationship between microbial biomass and the rate ofmineralization of residue N (r2 = 0.38, P = 0.04). TheT/N of residues had an impact on microbial biomass attillering (r2 = 0.51; P = 0.01; Table 2). A significanteffect of the tannin concentration and the PP/N werealso found. At maturity (109 DAI), however, polyphen-ols were not correlated to microbial biomass ninhydrin-N(Table 2).
40
3•a
38-
36-
'>• 34 Hc20 32H
30y = 40.8 -1.28x ^ = 0.673
1 2 3 4 5 6 7 8(Lignin+polyphenol):N ratio
Fig. 5. Relationship between the (lignin + po)yphenol)/N ratio and thegrain yield of rice.
Nitrogen Use EfficiencyNitrogen use efficiency of urea was comparable with
most residue treatments. Compared with urea, only fourresidue treatments resulted in a significantly lower NUE(Table 3). However, if NUE was calculated on the basisof cumulative N released at the end of the season(NUE[rel], a reflection of the actual N input in the systemduring the season), the urea treatment had a lower valuethan 5. bicolor and L. leucocephala (Table 3). The bestpredictor of NUE, in terms of chemical composition,was (L+PP)/N (r2 = 0.65, P < 0.01). The (L+T)/N(r2 = 0.56), the L/N (r2 = 0.52), and the lignin content(r2 = 0.48) were also significant factors (P < 0.01).All chemical composition variables tested for regressionhad a negative impact on NUE (Table 2).
There were no major differences in Ndff percent-age among treatments (Table 3), and relationships withchemical composition variables were weak. The bestpredictor was L/N (r2 = 0.35; P = 0.04). Multipleregression analysis also revealed an additional impact ofpolyphenols.
%Ndff = 35.62 + 0.267(polyphenols)- 0.556(L/N)r2 = 0.51, P = 0.04 [3]
Grain YieldGrain yield was significantly higher in all treatments
that in the no-N control (Table 3). The highest yieldwas measured with L. leucocephala, but it was notsignificantly different from that of the urea control. Addi-tion of tannic acid to 5. rostrata did not have a significantimpact on grain yield. Cassia velosa, D. virgatus, S. em-erus, and C. cajan were the only treatments that hadsignificantly lower yields than urea. There was a weak,nonsignificant relationship between grain yield and resi-due-N mineralization percentage at harvest (r2 = 0.32,P = 0.06). Grain yield was best predicted in terms of(L+PP)/N (r2 =0.67, P< 0.01; Fig. 5). TheL. leuco-cephala treatment was an exception since it resulted inhigh rice yield but only had an average (L+PP)/N (Fig.5). The (L+PP)/N was also best correlated to rice Nuptake (r2 = 0.58, P < 0.01) and total dry matter (r2 =0.54, P < 0.01).
DISCUSSIONThe chemical composition of residues had a strong
effect on N mineralization. Indigofera tinctoria andS. rostrata showed rapid N mineralization immediatelyafter incorporation and reached a constant low level afteronly 2 wk. In most other cases, the initial labile Nmineralization continued for about 20 d. Cassia velosawas an exception, with 2 wk of N immobilization beforegradual mineralization. While it is considered that or-ganic material decomposes less rapidly under anaerobicconditions (Neue and Bloom, 1989), other workers haveobserved this rapid mineralization process (see reviewby Ladha et al., 1992). Crop residues consist of manycomplex compounds, and it is expected that no singlecharacteristic will control N mineralization throughout

CLEMENT ET AL.: COMPOSITION OF CROP RESIDUES IN SUBMERGED SOILS 1601
the season. In this study, we were able to identify anumber of factors that sequentially influenced N mineral-ization.
Clearly, a higher tissue N concentration increasedearly N mineralization. In contrast, condensed tannins,either expressed as a percentage of total dry weight oras T/N, had an inhibitory effect (Table 2). The modeof action of tannins is attributed to protein precipitation(Haslam, 1981), probably including bacterial exoen-zymes involved in organic matter decomposition. Anantimicrobial effect of tannins has also been documented;it includes deprivation of substrates required for micro-bial growth and inhibition of oxidative phosphorylation(Scalbert, 1991).
At 39 DAI, N mineralization had entered anotherstage, with the slope of all correlations involving con-densed tannin and polyphenol becoming positive. Tanninand T/N had the highest coefficients of determination,suggesting that by 39 DAI, release of N from tanninprecipitates was a major factor driving N mineralization.
The L/N ratio was significantly related to early miner-alization rate, grain yield of rice, and NUE (Table 2).Lignin itself does not contain N (Grisebach, 1981). Underupland conditions, lignin or L/N have been found tocontrol decomposition of woody material (Camire et al.,1991; Melillo et al., 1982). Lignin is considered toplay a role in immobilizing N through the formation ofmetastable N-lignin derivatives during decomposition.However, the lignin polymer has been described as inertanaerobically, apparently a consequence of the mechanis-tic requirement for Oa in the biological catalysis of itsdegradation (Zeikus, 1980). Therefore, no significantdecomposition is expected in one crop cycle. The roleof lignin in overall residue decomposition is probablyrelated to its interaction with cellulose and polyphenols.Lignin and cellulose are structurally associated, in woodytissue, with lignin enveloping cellulose fibrils within cellwalls (Cote, 1977). Nitrogen may be trapped within thestructure, along with polyphenols and tannins. In fact,at 109 DAI, we observed that residue stem portionsincorporated in the soil were little decomposed, and insome cases, practically intact.
Polyphenols can react with NO:T-N and integrate itinto more stable organic forms (Azhar et al., 1986).This would only be possible at the soil-water interface,however, where soil is supplied by O2 diffusing in thewater and and NO^" can be formed. Further indicationthat polyphenols act in conjunction with the lignin-cellu-lose complex is that polyphenols considered alone hadlittle predictive value on N mineralization, whereas the(L+PP)/N had a significant predictive value (Table 2).Becker et al. (1994b) obtained comparable results onMaahas clay soil and Fox et al. (1990) in upland soils. Bycontrast, Oglesby and Fownes (1992) found a significantinhibitory effect of polyphenols in an upland soil. Perhapsthat concentration of polyphenols in the soil solutionunder upland conditions can reach a toxic level, sincemuch less dilution occurs than under submerged condi-tions.
Tannic acid is a hydrolyzable tannin, whereas thevanillin assay used in this study measures condensed
tannins. However, there is no evidence that condensedand hydrolyzable tannins would behave differently (Ba-saraba, 1966). It is more likely that tannins will havean effect only if they are intimately mixed with the othercomponents of the residues. In this experiment, addedpurified tannins probably simply dissolved in soil waterand reached low concentrations that are below the toxiclevel. The actual concentration of added tannic acid in ourexperiments was roughly 0.015 g L~' near the reportedminimum inhibitory concentrations for bacteria (Nishi-zawa et al., 1990). Hence, added purified tannins inTreatment 4, which were thoroughly mixed with thesoil, had little influence on the N mineralization patternof 5. rostrata. Microbial biomass ninhydrin-reactive Nwas also not significantly influenced by addition of puri-fied tannins (Table 3). However, the residue tannin con-tent or T/N was significantly related to N mineralizationand microbial biomass ninhydrin-N at 39 DAI (Table2). In the case of a species with very high tannin content,such as C. velosa, tannins may cause N immobilizationshortly after incorporation, and could limit the N mineral-ization percentage in one season.
In Experiment 2, N incorporated as plant residuesresulted in grain yields comparable with that of urea (inmost cases), despite less N mineralized during the season.This underlines both the suitability of residue treatmentsas N fertilizers and the shortcomings of only basal ureaN application. Urea application, with very fast mineral-ization, resulted in overproduction of tillers. Tiller mor-tality was 42% with urea, compared with 10%, on aver-age, with the residue treatments. In addition, soil N wasalready depleted at 39 DAI in the urea treatment.
Early rice growth was clearly inhibited by residueapplication. Tillering was much lower than in the no-Ncontrol, and there was a strong correlation between tillernumber and N uptake at the tillering stage (r2 = 0.97,P < 0.01). The cause of this early inhibition was notdetermined in this study. Possibly, release of organicacids by residues may have inhibited early root and tillerdevelopment (Rao and Mikkelsen, 1977), more so in thepot setup used in our study. Although this early toxicityeffect is documented (SubbaRao, 1988), it does not al-ways occur in the field (Morris et al., 1989), wherelateral water movement and percolation may alleviatethe effect of organic acid formation (Kundu and Ladha,1995).
The significantly higher NUE(rel) values recorded forresidue treatments, compared with the urea control, canbe attributed to better synchronization between the supplyof N by the residue treatments and uptake of N by rice(Fig. 4). The remaining organic N may mineralize duringsucceeding crops. However, under a warm tropical cli-mate and flooded rice conditions, residual effects oforganic amendments are often nonsignificant (Meelu etal., 1992), particularly in the case of readily mineralizedresidues. Ventura and Watanabe (1993), however, didobserve a residual effect on the 10th rice crop after nineGm-rice sequences. Furthermore, Becker et al. (1994a)observed a residual effect on a third crop after incorpora-tion of S. rostrata: rice straw mixtures of favorableL/N in two consecutive rice crops.

1602 SOIL SCI. SOC. AM. J., VOL. 59, NOVEMBER-DECEMBER 1995
Microbial biomass ninhydrin-reactive N in residuetreatments was in most cases higher than in controltreatments at the tillering stage (Table 3). Ocio andBrookes (1990), in upland soils, observed that highermicrobial biomass N follows addition of wheat (Triticumaestivwn L.) straw compared with nonamended soils.The low microbial biomass N value observed in the caseof C. velosa suggests that tannins have an inhibitoryeffect on bacteria, as has been observed in pure cultures(Scalbert, 1991). Regression analyses underlined an in-hibitory effect of the T/N ratio residues on microbialbiomass N at the tillering stage (Table 2).
Gaunt (1993) found indications that under anaerobicconditions, microbial biomass was not controlled by Cavailability, probably due to the low energy requirementsof anaerobic fermentation. In this study, incorporationof C-rich residues increased microbial biomass N inmany cases (Table 3). Nitrogen also appeared limiting,as shown by a significant correlation with soil NH/-N.An early increase in microbial biomass in the case ofresidue addition treatments has the advantage of immobi-lizing N and making it available later in the season. Atthe end of the season, microbial biomass N was indeedlower in most cases of residue incorporation (Table 3).
At maturity, grain yield was best correlated with(L+PP)/N of added residue (Table 2). There was onlyan indirect relationship between grain yield and chemicalcomposition of residues, since chemical composition pri-marily affects N release, which in turn, influences grainyield. It needs to be confirmed that (L+PP)/N can bea useful indicator of yield or residue N mineralizationunder different soil or water management practices.Available evidence so far indicates that the pattern ofGM N mineralization is comparable among differentlowland soils (Becker et al., 1994b). Prediction of ricegrain yield from the chemical composition of incorpo-rated residue would be a useful tool for initial screeningof residues and GM species.
ACKNOWLEDGMENTSThis research work was supported by a Young Canadian
Research Award from the International Development ResearchCenter of Canada (IDRC) to A. Clement and by a NaturalSciences and Engineering Research Council of Canada(NSERC) operating grant (OGP0025224) to P.P. Chalifour.A. Clement also acknowledges the receipt of a NSERC post-graduate scholarship. The authors are grateful to Mr. MelvinGuevarra for assistantship and supervision of field, greenhouse,and lab work.

STEVENSON ET AL.: DINITROGEN FIXATION AT THE LANDSCAPE SCALE 1603