crop-based irrigation operations in nwfp.publications.iwmi.org/pdf/h_11889.pdf · water...
TRANSCRIPT

1
I
PROGRESS REPORT 2
CROP-BASED IRRIGATION OPERATIONS IN NWFP.
I 'i:
‘ c li
“ c /I
c ‘ L
PROGRESS REPORT No. 2: KHARIF 92
ON THE
TECHNICAL ASSISTANCE STUDY
T.A. NO. 1481-PAK
CROP-BASED IRRIGATION OPERATIONS IN THE NWFP
December 28, 1992
Prepared by:
Carlos Garces Tissa Bandaragoda
Pierre Strosser
INTERNATIONAL IRRIGATION MANAGEMENT INSTITUTE LAHORE, PAKISTAN
1
c

c
PROGRESS REPORT No. 2: KHARIF 92 CROP-BASED IRRIGATION OPERATION
TABLE OF CONTENTS
EXECUTIVE SUMMARY
I . I NTRO DUCT1 0 N
II. PROJECT SUPPORT-RELATED ACTIVITIES
2.1 Staffing 2.2 Study Advisory Committee 2.3 Procurement of Equipment 2.4 Interaction with GOP Agencies 2.5 Study Tour
Page
iii
1
2
2 2 3 3 4
111. PROJECT IMPLEMENTATION AND DISCUSSION OF FINDINGS 8
3.1 Lower Swat Canal Irrigation System 8
3.1 .I Planning for Remodelling in LSC 3.1.2 Design Criteria of Remodelling 3.1.3 Operational Considerations 3.1.4 Institutional Issues
a 9 13 15
3.2 Chashma Right Bank Canal Irrigation System 17
3.2.1 Irrigation System Operations 17 3.2.2 Supply and Demand of Irrigation Water 25 3.2.3 Irrigation Facilities 34 3.2.4 Irrigation Institutions 35
3.3 Summary of Season Interventions 44
3.2.5 Economics of Crop-based Irrigation Operations 41
i U
i
c
IV. PROJECT CONSTRAINTS
4 .1 LSC Study Activities 4.2 CRBC Study Activities
V. CONCLUSIONS
5.1 LSC Study 5 . 2 CRBC Study
REFERENCES
TABLES
ANNEXES
1. IlMl Team 2. Minutes of the 3rd SAC Meeting 3. Suggested management interventions 4. Meteorological Data for D.I. Khan
ii
46 46
4 7 4 7
Page
46
47
50
51
5 9
60 6 1 6 5 7 1

c c EXECUTIVE SUMMARY
1 C
iI
The Seasonal Progress Report No. 2 relates to the Kharif 1992 activities of the study undertaken by the International Irrigation Management Institute (IIMI), under the Technical Assistance Agreement No. 1481-Pak. With the project at half-way in its duration and a full agricultural year of field research completed, we now have much improved and validated understanding of how the modernized Chashma Right Bank Canal and Lower Swat Canal Systems are actually being operated.
The work done so far in the design management study in the LSC suggests that a considerable gap exists between the design stage intentions regarding system operations, and the realization of such intentions after the rehabilitation project has been compl.eted. The remodelling of the LSC has been presented as a modernization effort. In effect, only the physical infrastructure has been enhanced in capacity, allowing for a higher water allocation for peak requirements. Modern tile drainage facilities have been installed in part of the command area. However, little attention has been paid to the need to bring about a "modernizing" influence on the social components of the LSC system.
With the above in mind, and given budgetary constraints, we believe that the implementation of a rapid appraisal survey designed to assess the impact of the increased water allocations in this system, will be the most cost-effective way to determine the direction that any future research activities in the area should take. Any more in-depth studies, at this point, seem unrealistic.
With respect to the CRBC system considerable progress was made during the reporting period and the findings reinforce our previously acquired understanding of the systems' current operational practices. The system at main and distributary level continues to operate under a supply-sided mode while farmers are managing their water with a crop-based approach. Hence, there is no relation between the operation at watercourse level vis-a-vis higher levels. The present objective of the agencies --- WAPDA and PID --- is to operate the system based on a narrow range of water elevations that translate into discharges which have no relation with the demand for irrigation water. The result is an excess of water detrimental to the central idea of increased water productivity through a change to crop-based irrigation operations.
One way to move towards more crop-based operations of the canals is to use the easily monitored opening and closure of watercourse outlets by farmers as an indicator of the water requirements. IIMI's data show that farmers are not taking excessive amounts of water and indeed close their outlets when their water demands are met.
The simulation studies have been useful in analyzing the hydraulic behavior of the main canal and in providing different options to overcome design constraints at low discharges as called for under crop-based irrigation operations. The use of simulation techniques is imperative for the development of an operational and maintenance plan for the entire system, once all three stages are active. Therefore, we would like to encourage the agencies to participate more fully i n the application of simulation techniques to the CRBC system for the remainder of the project. Starting with the coming Rabi 92/93 season our modelling studies will be expanded to include the distributaries.
i i i
1 I

c l.2
0 c;
c c
As in the past season, considerable deviation from designed cropping patters was observed with significant changes related to rice and sugarcane areas (increases in the former and decreases i n the latter). Rice yields compared favorably to provincial averages, but showed great variations between farms, watercourse and distributary command areas. Cropping intensity during the Kharif season was only 42 percent as opposed to the designed 60 percent. These differences point to a need to recalculate the required indents at different levels of the system for feedback into operational plans.
Given the results obtained from the monitoring and evaluation undertaken on the CRBC system since project inception, three management interventions have been proposed, to be implemented in the forthcoming two seasons, Rabi 92/93 and Kharif 93. These are: Management schedule for main canal ooeration: The purpose of this intervention is to pilot-test a designed management schedule for more appropriate operation of stage I through real time calculations of hydraulic parameters. Monitoring of targeted discharpes at distributarv level: This management innovation follows from the above. The purpose of this intervention is two fold: i) to pilot-test the operability of the distributaries under targeted discharges conditions, and ii) to upgrade the response of the PID to farmers’ needs. Formation of Water Users Associations: The establishment of these farmers groups will serve the purpose of increasing their organized behavior and will provide a mechanism to enhance their awareness in crop-based irrigation operation matters.
An important project activity took place during this period: a group of four government officials, accompanied by IIMl’s project leader, visited crop-based oriented irrigation systems in Southeastern Spain and Morocco. This visit was in the context of a Study Tour designed for this specific purpose.
The project budgetary constraints mentioned in progress report # 1 have been addressed jointly by the Bank and IIMI. A review and redistribution (at no added cost) of budget line items and contingency provision has helped ease some of the problems. International staff time allocation remains less than desired. To cope with this issue, IIMI has taken advantage of other on-going projects and has increased the interventions of other international staff in project related activities.
With the introduction of management interventions in the third cropping season (Rabi 92/93), less than a full year remains in the project to evaluate and propose follow-up actions. IlMl in collaboration with the operating agencies will explore ways and means to ensure that the management changes introduced during the project, will have long term effects.
i

[I 1. INTRODUCTION
c
I C
1.1
The Seasonal Progress Report No. 2 relates to the Kharif 1992 activities of the study undertaken by the International Irrigation Management Institute (IIMI), under the Technical Assistance Agreement No. 1481-Pak dated 25 July 1991 between IIMI, the Government of the Islamic Republic of Pakistan (GOP), the Government of the North West Frontier Province (GONWFP) of Pakistan, and the Asian Development Bank (ADB). The report is presented in terms of Sec. 8(II) of the Terms of Reference, Schedule I of the TA Agreement, which requires Progress Reports to be issued for each season’s work, indicating among other things, the study activities, seasonal data analysis and interpretation.
This Report follows up on two documents issued previously, IIMI’s Inception Report of 24 October 1991, and Progress Report No.1 of 20 June 1992.
To recapitulate the background given in earlier reports, with the signing of the TA agreement, IIMI started forthwith the inception activities of the study, and after their successful completion was able to capture the onset of the 1991/92 Rabi season for essential data collection work. Pre- Rabi activities were reported in the Inception Report, and the study activities undertaken during the Rabi season were presented in the Progress Report No.1. The results of this season’s work were presented for discussion at the last Study Advisory Committee (SAC) meeting held in Peshawar on 22 September 1992.
Context of Progress ReDort No.2
1.2 Coverage
As mentioned in the earlier reports, the major effort in seasonal data collection continued to focus on the study site at the Chashma Right Bank Canal (CRBC) in D. I. Khan. The activities at the Lower Swat Canal (LSC) site continued to be limited to the institutional study of design manage- ment interactions and of the circumstances that led to the installation of outlet gates and the subsequent decision to remove them, while the study in its original design, continued to concen- trate on the CRBC. Reasons are explained in Sections 3. I and 4.1.
This Progress Report, however, presents in some detail the results of the work done so far in the LSC study component, highlighting the deficiencies of design management interactions in the remodelling of the LSC. This is in keeping with the interests shown by the ADB in this part of IIMl’s study, particularly in view of the current planning work for remodelling the Upper Swat Canal. The Report also covers in detail the study activities in the CRBC, including data collec- tion, some preliminary data analyses and related tentative findings.
1
1 I

Ic
c
~ f I c li:
fr
11. PROJECT SUPPORT RELATED ACTIVITIES
2.1 Staf f ing
The project experienced some staffing difficulties during the reporting period. Since its inception, it has been hard to attract people to work in the D.I.Khan area although salary and perquisites offered are quite attractive and above average for the region.
In order to avoid this difficulty we opted for hiring local people; unfortunately, this strategy did not bring the results expected since the pool of needed expertise is not so readily available. One Field Research Professional and four Field Assistants left during the last six months. A decision was made not to replace the former given that the work load diminished somewhat as many of the initial new activities became routine work. Two of these FAs' positions were replaced twice.
As before, the project drew from other IIMI staff, both local and international, who provided support in activities related to flow measurements, canal simulation, farmers' wurubandi practices and crop-cut yields, among others.
In Annex-1 a list of personnel involved in project activities during this reporting period is provided. Their contribution is hereby acknowledged.
2.2 F t u d v Advisorv Committee
The third Study Advisory Committee meeting was held in Peshawar on September 22, 1992. The meeting was especially requested by ADB's Program Engineer Mr Pieter Smidt to take advantage of his visit to the country during that week. The meeting was well attended with a total of 21 participants.
The objectives of the meeting were three-fold, as follows:
i)
ii)
to review project activities during the past six months;
to present to the committee the proposed management interventions to be undertaken in the forthcoming Rabi 92/93 season', and
to present the workplan for the above mentioned season. iii)
These objectives were met, and the full minutes of the meeting are given in Annex-3. While many important issues were raised during the lively discussion that follow the presentation of the propo- sed innovations (see Annex-4) and the workplan, it is pertinent to draw attention to the following:
' Because the presentation of the proposed management innovations was an integral part of the SAC meeting, and therefore discussed thoroughly, these are not elaborated any further in this report. Instead, the document distributed in the meeting is given in Annex-4.
2
1 I

C
01
G The official name of the Provincial Irrigation Department (PID) is the Irrigation and Public Health Engineering Department,(IPHED). In the report, the names are used interchangeahly. pi
3
- the collaborating agencies -- WAPDA, PID2 and PAD -- will make all efforts to assign some of their staff to participate in the project activities during this coming season and in particular those related to the management innovations.
ADB would like to see the activities related to the simulation model extended, from the current main canal level efforts, down to the distributary level in order to enhance the understanding of the system's operation.
given the present situation at the LSC system it was felt that a Rapid Appraisal of field operations would be very useful. Furthermore, IIMI was urged to finalize, at its earliest convenience, the on-going design-management interactions study of that system.
-
- the SAC committee indicated that steps be taken to speed up the establishment of the long overdue Project Coordination Committee, to oversee regular project activities.
The next SAC meeting will be held during Rabi season 92/93.
2.3 Procurement of Eaubment
Very little activity under this heading can be reported since practically all required equipment has been in place for more than six months.
The only new field equipment purchased during this period relates to modified RBC flumes acquired locally as per specifications provided by IIMI. These flumes are intended to be placed in field channels in order to monitor on-farm flows. Because of the big size of some of the field canals the traditional flume designs had to be modified to fit our specific project needs.
The main features of the flumes are their smaller size (no approach section), making them more portable, and the bigger inlet or outlet "wings" so that they can be fitted easily in the ditches. Six units were ordered for field testing and evaluation.
2.4 Interactions with GOP Aaencies
The study team closely interacted with key WAPDA, Irrigation Dept. and Agriculture Dept. staff in Mardm and D.1. Khan. Several visits were undertaken by IIMl's senior staff to D. 1. Khan, Mardan and Peshawar to meet GONWFP senior staff and to discuss various aspects of study implementation. Meanwhile IIMI's field team at D. I. Khan continued to work in close colla- boration with the operating agency staff.

c!
I C G c c
I "
Since the Progress Report No. 1, the third meeting of the Study Advisory Committee (SAC) was held in Peshawar. Details were given in Section 2.2 above.
IWASRI, as the sponsoring GOP agency mentioned in the PC I1 for this study, was invited to be present at the SAC meeting and also to visit the study area.
As mentioned in the earlier progress report, to f i l l the need of the aborted March briefing meeting in Peshawar with Agriculture officials, arrangements were made to hold a seminar at D. I. Khan for all concerned agency staff including Secretaries of NWFP Irrigation and Agriculture Minis- tries, and GM WAPDA (North). For unavoidable circumstances, this seminar had to be post- poned, and is now planned for early 1993. This will enable the smooth functioning of the PCC.
As part of the project, a study tour for selected GONWFP officials was conducted, details of which are given in Section 2.5 below.
2.5 Studv Tour
A key activity under the project's Term of Reference was the organization of a study tour to familiarize operations personnel of different levels of the different agencies with crop-based irrigation operations. The study tour would focus on other countries with large gravity irrigation systems under wheat andlor rice, where the concept of demand-based irrigation is practiced and where farmers are organized and contribute to the management of the system. Systems where the collection of water charges is an important issue were to be considered as well.
It must be mentioned that the word "demand" as used above is not meant to identify a system where the farmers can request water at any time or in any quantity, but rather to be consistent with the project's goal of better matching the supply and demand for water.
After surveying IIMI's experience to identify countries that met the above criteria, the following locations were considered:
China, Egypt, Sudan, Morocco, South or southeast Spain and Southern France
Inquiries and contacts with pertinent organizations in those countries, narrowed the options to: a) a combined Southeast Spain and Morocco study tour, or b) a study tour to China. In either case, we considered a total of two weeks time.
To dispel the notion that this study tour would be just a " holiday trip" for those participating, we intimated to the potential participants that a trip report would he mandatory. They were provide some guidelines as to the content of the report; for example, that a parallel he drawn between the observed and what is practiced in Pakistan; that comments be made on the applicability of the observed to NWFP, etc.
Given budget and logistic factors a group of four officials, accompanied by an llMI Senior Staff, was fixed as the ideal size for the tour. The ADB was invited to designate a program officer to join the study tour; the Bank, however did not exercise that privilege.
r 4
: o c
c c
I c
II
i I7
Based on IIMI's experience with the project so far, officials in the positions listed below, who had been in close contact with project's activities, were identified as potential participants, among whom four were to be finally selected:
1. 2. 3. Superintending Engineer, PID, Mardan 4. 5 . 6. 7.
Executive Engineer (Remod),PID,CRBC (New area), D.I. Khan Executive Engineer,PlD,CRBC (Paharpur System), D.I. Khan
Executive Engineer, WAPDA, CRBC, D.I. Khan Director Water Management, Agriculture Dept., Peshawar. Deputy Director, Agriculture Extension, D.1. Khan Director WSIP Cell, P&D, Peshawar
IlMI suggested that the participants be chosen through the SAC and that their names be recommended to the concerned GOP Ministry for prompt approval. This was done during the second meeting of the SAC and the individuals in positions nos. 1, 3, 4 and 6 were chosen.
It was planned to undertake the study tour within the first semester of 1992, coinciding with the appropriate cropping calendar of the country or countries to be visited. However, for various reasons ranging from work load of the officials involved to delays in government approvals, the study tour finally got under way during the final week of October.
The study tour schedule is given below:
In Morocco - Oct 24 to 31 - Day one - -Day two -
- Day three -
- Day four -
-Day five - - Day six -
-
-
-Day seven -
Arrival in Morocco Visit with Ministry of Agriculture and Agrarian Reform (Mara) in Rabat (morning) Visit ORMVA of Gharb (afternoon) Continue visit to ORMVA of Gharb Travel to Beni Mellal (late afternoon) Visit ORMVA of Tadla Travel to Marrakesh (in afternoon) Initiate visit to ORMVA of Souss-Massa Visit ORMVA of Souss-Massa (morning) Return to Rabat via Casablanca for debrief at MARA (late afternoon) Departure for Spain
In SDain - Nov 1 TO 7 - Day one - Arrival in Spain -Day two -
- Day three - Visit to WUA Henares in Guadalajara
- Day four -
-Day five - Travel to Murcia (morning)
Visit to Centro Nacional de Tecnologia de Regadios (CENTER) (all day)
Travel to Valencia (mid-afternoon) Visit to WUA Real Acequia de Moncada Visit with Federation of WUA
Visit to WUA Murcia (afternoon)
5 I I " I I
- Day six - Continue visit to Murcia (morning) Return to Madrid (mid-afternoon)
- Day seven - Free/ Departure for Pakistan
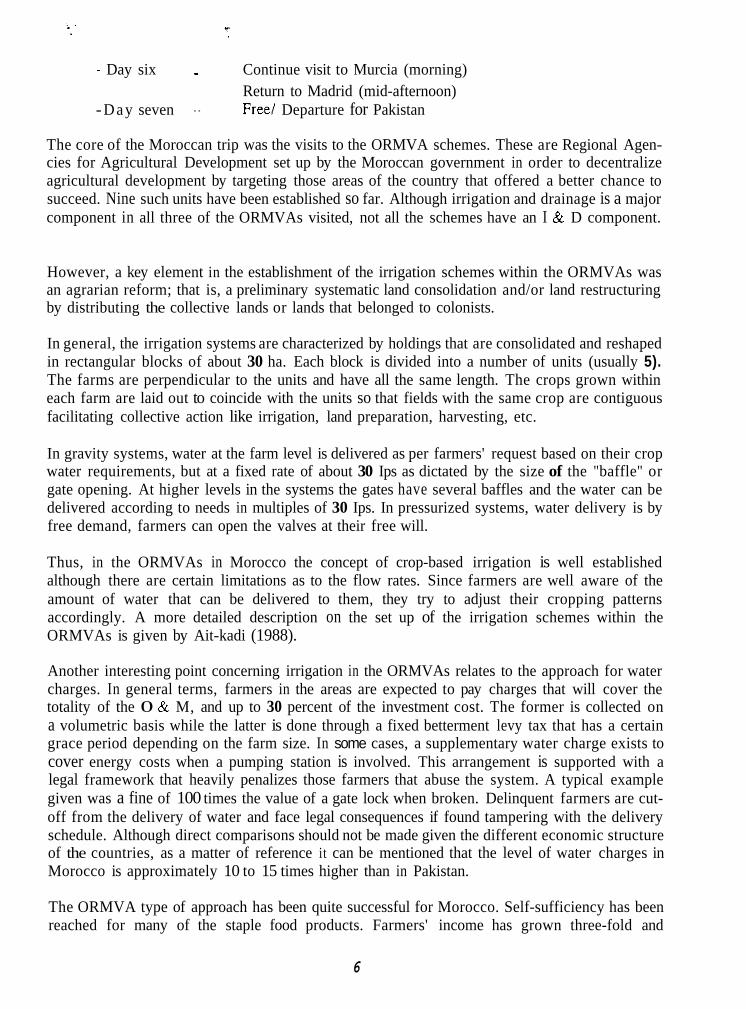
The core of the Moroccan trip was the visits to the ORMVA schemes. These are Regional Agen- cies for Agricultural Development set up by the Moroccan government in order to decentralize agricultural development by targeting those areas of the country that offered a better chance to succeed. Nine such units have been established so far. Although irrigation and drainage is a major component in all three of the ORMVAs visited, not all the schemes have an I & D component.
However, a key element in the establishment of the irrigation schemes within the ORMVAs was an agrarian reform; that is, a preliminary systematic land consolidation and/or land restructuring by distributing the collective lands or lands that belonged to colonists.
In general, the irrigation systems are characterized by holdings that are consolidated and reshaped in rectangular blocks of about 30 ha. Each block is divided into a number of units (usually 5). The farms are perpendicular to the units and have all the same length. The crops grown within each farm are laid out to coincide with the units so that fields with the same crop are contiguous facilitating collective action like irrigation, land preparation, harvesting, etc.
In gravity systems, water at the farm level is delivered as per farmers' request based on their crop water requirements, but at a fixed rate of about 30 Ips as dictated by the size of the "baffle" or gate opening. At higher levels in the systems the gates have several baffles and the water can be delivered according to needs in multiples of 30 Ips. In pressurized systems, water delivery is by free demand, farmers can open the valves at their free will.
Thus, in the ORMVAs in Morocco the concept of crop-based irrigation is well established although there are certain limitations as to the flow rates. Since farmers are well aware of the amount of water that can be delivered to them, they try to adjust their cropping patterns accordingly. A more detailed description on the set up of the irrigation schemes within the ORMVAs is given by Ait-kadi (1988).
Another interesting point concerning irrigation in the ORMVAs relates to the approach for water charges. In general terms, farmers in the areas are expected to pay charges that will cover the totality of the 0 & M, and up to 30 percent of the investment cost. The former is collected on a volumetric basis while the latter is done through a fixed betterment levy tax that has a certain grace period depending on the farm size. In some cases, a supplementary water charge exists to cover energy costs when a pumping station is involved. This arrangement is supported with a legal framework that heavily penalizes those farmers that abuse the system. A typical example given was a fine of 100 times the value of a gate lock when broken. Delinquent farmers are cut- off from the delivery of water and face legal consequences if found tampering with the delivery schedule. Although direct comparisons should not be made given the different economic structure of the countries, as a matter of reference it can be mentioned that the level of water charges in Morocco is approximately 10 to 15 times higher than in Pakistan.
The ORMVA type of approach has been quite successful for Morocco. Self-sufficiency has been reached for many of the staple food products. Farmers' income has grown three-fold and
6

c cl n C E
D
c C
agricultural jobs in those areas increased by a factor five since the start of the ORMVAs. Although these development units cover less than 15 percent of the cultivated lands it has been estimated that they contribute up to 75 percent of the agricultural export receipts of the country, and it is clear that irrigation has played a major role in this effort (personal communication by Jean Verdier).
Because of the time period in which the study tour finally took place the irrigation season in Spain was coming to an end. Therefore, few irrigation-related activities were still going on in the field. Thus, the visit concentrated on meeting with officials representing several types of arrangements of Water Users Associations (WUA).
A striking feature of the WUAs in Spain was the closely knit relationship observed among its members. The associations are largely based on mutual respect of peers and in the strict sharing the abundance or shortage of the water resource. Without exception, the WUAs are constituted to deal & with the management of water. Other irrigated agriculture related activities like extension services, farm mechanization, marketing, etc. are the sole responsibility of individual members. It was the consensus of the members interviewed in the different associations that here lies the key to the rather successful performance of the WUAs.
The WUAs have a simple but efficient organizational set up where members are elected by vote. Normally, the number of votes available to each farmer depend on a sliding scale that diminishes with increasing area. For example, any area less than one hectare gets one vote but an area of 100 ha gets much less than 100 votes.
The associations have established several different mechanisms to deal with delinquent farmers ranging from direct legal action to tribunal courts where decisions made are binding and final. However, representatives contacted were quick to point out that these restraining interventions are hardly needed. In the case of the tribunal set up it was intimated that it does not have to be called upon more than two or three times per year. A farmer that ends up being found guilty in any of these courts suffers more from the social embarrassment attached to it than from the penalty itself. As a matter of reference one of the WUA visited was celebrating is 725th year of its creation.
Water is delivered to the field as per farmers’ request and based on their crops’ requirements; but, as was already explained, any shortage is distributed equally among farmers of a unit. In these units there is an strict rotation very much like warabandi in Pakistan; if a turn is missed the farmer has to wait until the next rotating period. The WUA hire professional staff to assist them in technical and administrative matters but other positions are ad honorem and carry a good deal of prestige. Finally, it is worth mentioning that water charges cover the totality of the 0 & M expenses and quite often investments costs depending on their bargaining position with the government.
The trip report of the participants was not ready for inclusion in this report but it will be annexed to the next progress report.
1 I
111. PROJECT IMPLEMENTATION AND DISCUSSION OF FINDINGS
3.1
The study focussing on design management interactions in the remodelling of the LSC is nearing completion. A Rapid Appraisal to find out the short term effects o f remodelling on system operation and farmer behavior is scheduled for early February 1993, after the canal closure period is over. This was delayed as the designed water delivery was not possible until the completion of the aqueduct in the latter part of 1992. Results of activities conducted so far (reviewing a large number of planning and progress report documents and interviewing officials and farmers) are discussed in the following sections.’
Lower Swat Canal lrrioation Svstem
3.1.1 Planning for Remodelling the LSC
Three main planning documents have served to conceptualize the basis for remodelling of the LSC, and to identify its key design features. They are:
i) Proiect Plannine ReDort (PPRl of Mardan Salinity Control and Reclamation Project - Phase one, prepared by Water and Power Development Authority (WAPDA) with the assistance of Harza Engineering Company, December 1977;
Staff ADDraisal Report (SAR), Salinity Control and Reclamation Project (SCARP) Mardan, January 1 1 , 1979, of the World Bank; and
Final Proiect Plan (FPP), SCARP Mardan, June 1981 prepared by Harza-Nespak Consultants.
i i)
iii)
The PPR seeks to plan for the agricultural development in the command areas of the Upper Swat, Lower Swat and Sholgara Canal Systems, by rehabilitating the existing surface drainage systems, construction of tile drainage systems, enlarging the capacity of the existing irrigation systems, remodelling of the main farm watercourses, precision land levelling on the farms and improving the farm-to-market road system. Agricultural support services were proposed to be provided in parallel programs. Because of the large size, the PPR provided for the implementation of the project in two Phases: Phase I to include the rehabilitation of the surface drainage system in a part of the area and construction of 83,500 acres of the tile drainage systems, and Phase I1 to include the planning and implementation of 87,400 additional acres of tile drainage and all other works not covered in Phase-I. Notable here is the implied emphasis on the drainage component.
The PPR noted that the original design of the Upper and Lower Swat Canal Systems was based on providing between 5 and 6 cfs of channel capacity at the distributary head for each 1000 acres of area served, whereas the estimates of irrigation requirements based on evapo-transpiration
Because the work described in this section of the report refers to specific documents, the original units for areas and water flows are retained and therefore appear in the English system. Normally, i t is project policy to use the International System (So. As reference, one cfs = 28.3 I/s; and 1 cusec/1000 ac = 0.07 M h a .
8
0 c
rates for the various crops for the design cropping intensity of 100 percent (60 percent in Kharif and 40 percent in Rabi) indicated a corresponding requirement of 7.6 cfs per 1000 acres. Hence, the original design included a 20 to 30 percent shortage of water during the period of maximum demand. Subsequent increases in cropping intensities by 40 to 50 percent had resulted in another 30 to 40 percent water shortage.
Considering averages for the period 1972-76, the PPR brought out the shortage of irrigation deliveries for the Lower Swat Canal as follows:
Authorized Full Supply Discharge: Average Delivery during Peak month Estimated Peak Month Water Requirement Shortage 52 percent
830 cfs 941 cfs 1941 cfs
While the PPR recognized the need for further studies to determine the most economical value of cropping intensity and canal capacity enlargement, it considered an intensity of 200 percent as feasible for which the required capacity of the off-taking distributaries was 10 to 12 cfs for 1000 acres of the cultivable commanded area to deliver full water requirements during the month of maximum demand. The required doubling of the capacity of the irrigation channels was to be accomplished by constructing parallel channels along the main canals, branches, distributaries and minors.
Notwithstanding the imolications of the canal remodelline and runnine of variable suoolies. the qDerational asDects were not treated in the PPR.
In the appraisal of the SCARP Mardan Project by the World Bank in its SAR of January 1 1 , 1979, the canal capacity constraint to provide peak optimal irrigation water requirement was recognized and the Project recommended for financing, among other drainage and agricultural development components, provided for remodelling of the LSC system for a projected cropping intensity of 180 percent. For this cropping intensity the peak monthly water requirement for the project was estimated to be about 1820 cusecs, or 93 percent greater than the present peak deliveries. The design capacity for the peak two-week requirement was found to exceed the capacity by more than 100 percent.
While the SAR provided for the introduction of adequate arrangements to monitor the canal flows no consideration was paid to any modified operational procedures to deliver irrigation supplies according to the crop water requirements.
More detailed proposals for the remodelling of the LSC were presented in the Draft FPP Report of June 1981. The salient features of the remodelling as brought out in this Report (FPP) are detailed in the following sections.
3.1.2 Design Criteria of Remodelling
According to the FPP, the remodelled svstem was conceived to permit a "gradual changeover from the present type of svstem to a modern demand-tvae svstems",
9

c
commanded area
r-
delivery rate delivery capacity
0
100
100-200
0 separate outlet not provided
19 I 0, = 0.019 (CCA)
l c 200-1 0,000
> 10,000
1 C'
19-1 1
1 1 QT = 0.011 (CCA)
QT = 0.040 (CCA)'
10

I]
ci c [I
~
Flow rate < 2 2 - 4 4 - 6 6 - 8 8 - 10 > 10 cusecllOOOac
Percent Of time 16.7% 16.7% 19.4% 19.4% 16.7% 11.1% over the year
[I
c
came to the conclusion that based on the 10 year record (1971-80) shortages occurred 1.6 percent of the time (in the months of October and November) and the average shortage was 23 percent. Thus the available supplies did not constitute a constraint to adequately meet the foreseeable demands.
The FPP stated that canal remodelling criteria have been developed’ to provide the structures (canal head regulators, wasteways, flow and discharge control structures, and outlets) necessary for a demand system. However, recognizing the constraints on acceptance of the demand system particularly the provision of gated watercourse outlets, the FPP added that ‘general designs for canal structures have been developed so that structures can be economically converted, by addition of gates and control devices, for a demand system at a future date’. Also considering that it will be prohibitively expensive to make a second enlargement of the minors in less than 20 years, the FPP stated that all canal sections will be enlarged according to the Demand Systems criteria.
Notwithstanding the above, the FPP stated that ‘the basic system has been designed for a gradual change over from the existing system to a demand-type system’, and in order that ‘remodelled system will have the inherent flexibility necessary to accommodate a gradual change over’ the following general design criteria were established.
i) Remodel watercourse and supply channel to an initial capacity of 11 cusecs per 1000 acres with provision to increase to an ultimate capacity of 19 cusecs per 1000 acres,
c c can be avoided except for the outlets where gates would be necessary to adjust the three elements
of any demand system, the rate, duration and frequency. In so far as the remodelling of the LSC is concerned, it does not appear, that deliberate consideration has been given to the flow regimes and the consequent requirement of and design of regulating structures.
In any event, the design features incorporated in the remodelling of the LSC which have a bearing for a demand-based system need to be specifically highlighted and are as mentioned below:
Head Reeulators: FPP provides for gated head regulators for all the off-taking channels including the head regulator of the minors which were ungated. Thus it should be possible to regulate the flows in the channels or to completely shut them off.
Cross Reeulators: Only the two existing cross regulators on the main canal were proposed for remodelling in the FPP. The extent to which these regulators would be effective in controlling the supplies would be dependent on the flow regimes in practice.
DroD Structures: For the check-drops or inclined drops, the design recommended in the FPP included the provision of stop log or gate frame guide and a deck for gate operation. Thus up- stream water levels could be controlled depending upon the location of these structures.
Wastewavs: The FPP recognized two functions for the wasteways: 1) disposal of excess water reaching the canal and 2) de-watering of a section of canal for routine maintenance or emergency repair of a damaged section of canal. It was also stipulated that certain wasteways may have to be over designed for initial canal system operations prior to completion of all watercourse improvements and until irrigators are ready to accept the increased canal supply.
Apart from the proposal to enlarge the existing wasteway at RD 83 of the main canal, the FPP stated that new wasteways will be constructed in the head reaches of all distributaries and also at the tail ends of all the distributaries and minors, The design of the wasteways structures as proposed in the FPP, was to consist of i) a side-channel spillway with crest elevation fixed by the design water surface elevation and having a capacity equivalent to the capacity of the largest upstream off-taking channel, ii) a gated turn-out to permit complete de-watering of the canal, and iii) an outlet section leading from the turn out to the receiving drain.
Outlets to watercourses: The outlet is the last structure in the Irrigation System which controls the supply entering the watercourse or tertiary channel from which the farmers obtain their irrigation supplies. As per existing practice, the entire flow in the wqtercourse is taken by the farmers in turns, in a rotation generally of seven days, called ‘waruhandi’. In the FPP, it was proposed to install Adjustable Proportionate Modules (APMs)~ as outlets, which pass supplies more or less in proportion to the supply in the feeding channel. However, a modification in design was proposed whereby the outlet could be converted to gated operation, simply by remov- ing the roof block and inserting a gate frame in the same slot. The adoption of this outlet design was predicated on the consideration that the present method of canal operation could be continued initially but changes could be made subsequently for demand-based operations. In actual practice
‘. The AMP is a fixed structure. The word ‘Adjustable‘ refers to the adjustment made for the required size at the time of installation, and in case of changes in the commanded area.

I
c
C
I D I
c
c! c
however, the modified APM was not adopted and instead it was decided to use pipe outlets acting as submerged orifices and equipped at the entrance with vertical slide gates and having stilling wells to measure the upstream and downstream heads for determining the discharge. With the gated outlets, as provided, constant adjustment of the gates would be an important operational cequirement as the outlet discharge would vary with fluctuating upstream head.
3.1.3 Operational Considerations
The design stage intentions regarding the future operation of the remodelled system are reflected only in one document, the Operation and Maintenance Manual, Mardan SCARP, (April 1985) prepared by Harza-Nespak Consultants. Apart from setting forth operation and maintenance procedures for the remodelled irrigation and drainage system, a procedure to introduce a demand type of irrigation delivery replacing the continuous proportionate flow system was also outlined in the Manual. Importantly, the Manual emphasized that the change from the present method of continuous flow to a demand system must be a gradual one, and therefore, it outlined procedures which would allow the present method of delivery to be followed as an interim measure. Also as a step towards demand-based operations, a demonstration was recommended along with a Training Program for the benefit of the staff of the agencies to be involved: Irrigation, Agriculture and On-Farm Water Management.
The Manual recognizes the importance of design management interactions and suggests that appropriate changes in it may be necessary as the detailed designs, still on hand, may not support the assumptions made in all cases.
The remodelling of the LSC system is foreseen as providing the capability of delivering an increased water supply to the watercourse outlets and the provision of metering gates at each watercourse outlet to provide for positive water control and measurement to all watercourses.
The Manual states that outlets to the distributaries, branches and minors will be remodelled to accommodate the increased capacity, and the channels will have adequate check structures so that water can be delivered under fluctuating crop water requirements. Gauges will be installed and outlet gates calibrated so that flow measurements may be made and recorded at all important points in the system.
As regards the design of the outlets which will be equipped with locking arrangements, the Manual states that these would be provided with discharge measurement structures namely metering gates, often referred to as modified submerged adjustable orifice gates, and consisting of a length of smooth or corrugated pipe with a slide gate having a round or square bottom leaf over the entrance. Two small stilling wells would provide the means for measuring heads or elevations of water upstream and downstream from the gate and give the effective operating head across the gate to relate to the discharge.
Relating to the operation of the system, it has been assumed that water will be delivered and utilized 24 hours each day and that water deliveries will be according to the water demand of the area served by the canal.
The Manual provides that iiiitially, following remodelling, water deliveries to each watercourse
13
I I I I
D' cl
will be made according to the average water requirements of the project, but that the farmers would be allowed to continue their irrigation in much the same manner they are presently following using the warabandi slip prepared by the Irrigation Department.
In this phase of operation, termed 'interim operation' the watercourse outlets will be manually operated by the Gauge Reader, rather than functioning automatically as in the past, and for this purpose the Irrigation Department, in addition to the warabandi slip would provide a tabulation of the water to be delivered at the watercourse outlet.
This tabulation is to be prepared by multiplying the acreage of each crop served by the watercourse (to be obtained as early as possible in the irrigation season) by the long range crop irrigation requirement. (The situation in this regard however, is not very clear, as the Manual, in the Section on Operational Plan, states that
"before the demand system is entirely i n effect the gauge reader would divert into each watercourse art amount of wafer proponioiial to the cultivable command area based upon the designedpow for the distributary, branch or minor. This amounf is the designedpow for 10- day periods based upon long term average temperatures and an anticipated croppifig pattcrrr. "
However, the very next sentence says:
"Anjustmeiits would be mode to nieef the actual croppifig parterri and weather coridirioiis. ''
It can only be surmised that what the authors of the Manual had in mind is probably an initial operation based on a fixed delivery schedule to be replaced by a more flexible delivery schedule based on actual cropping to be introduced with certain but as yet unspecific institutional requirements.
Under the Interim Operation, the distribution of water is proposed on the continuous flow of water into the watercourse on a 7-day rotation basis.
In the Manual it has been recommended that a small distributary branch or minor should be selected by the Irrigation Department for a demonstration of the demand system which should be started as soon as possible and which would provide a good opportunity for extensive training for the Extension Service and Irrigation Department personnel in the utilization of the demand system. For the selection of the demonstration area, it has been recommended that it should have a small extent, a strong Water Users Association and where some or all water users have expressed an interest in changing to the demand system.
While no guidelines for the introduction of demand system in the Demonstration Area have been provided, it has been suggested that irrigation Department should prepare a detailed plan for the demonstration and give special training to the personnel operating the system and that the Extension Service and the On-Farm Water Management Directorate should intensify and focus their educational programs on the water users involved. The subject on which farmers should be educated have been identified as consumptive use of crops, rooting development and growth habits, moisture holding capacity of the soil, determination of the quantity of irrigation water to be applied and the methods of application.

n I]
, c 13
Realizing that it may not always be possible to meet the demands fully due to capacity constraints and that adjustments may have to be made in competing demands the Manual suggest that the system of water delivery envisaged should be regarded as 'modified demand'.
In the event the total crop irrigation requirement exceeds the designed capacity of the channels due to a larger than normal acreage of high water use crops, the Manual suggest that it will be the responsibility of the Irrigation Department and the Water User Association to guide the farmers in their cropping pattern so that the peak demand does not exceed the capacity. This situation, however, is not expected to occur often as it will take only a season or so for the farmers to adjust their cropping patterns according to the capacity of the irrigation system.
The Manual stipulates that when the change over to demand system occurs ( for which 5 years is considered to be a reasonable time) water deliveries will be based on actual cropping pattern and cropping intensity of individual farms on a watercourse unit.
3.1.4 Institutional Issues
Three major institutional issues arise from this remodelling exercise:
i) There has been very little effective interaction between the design authorities and the operating agencies during the planning and design stages;
Major design features such as gated outlets and easily adjustable cross regulators have been decided with little reference to existing social and cultural background of the project area; and
Operational manual itself has not given due and sufficient consideration to the organizational capacity of the existing institutional framework.
i i)
iii)
This deficiency is clearly evident from the optimism reflected in some sections of the Manual. For instance, the procedure for ordering and delivering the water as given in the Manual is as follows:
"The Chairman, or some designared represeritarive of a Water User Association should collect the water orders (denmuds) from the water users on the watercourse. He would serve as a water order coordinator and niighf be called a "Common irrigator" as is the c u e in some countries. To eficiently di.rpntch water and to avoid operaring waste, it is necessary to require advance notice of changes iti wafer delivery. I f will be necessary to place the water orders 48 hours before actual delivery at the watercourse ourler so thar the water ordered can be nmde available through the system when i f is desired. Appendix Figure I is a water request form which can be placed on a card to be used to indicate a new water or-der or a water order change. It cari be handed 10 the Gauge Reader by the Water User Associatiori 's representative (Common Irrigator) or placed in a srnall nietal receptacle mounted on the outlet gate for that purpose. The orders for water should be consolidated by the designated Watcr User Association's representatiw (Common Irrigator) and pawed on to the Gauge Reader who will be visiting the watercourse outlet on a daily bnris. During rhe gradual c h y g e over fo the deniand system the water orders would be coordinated with the Warabandi Slip prepared by the Irrigation Departnienr. The Conrmori Irrigator should be reimbursed for his services arid his wages should be puid by the Wafer User Association from fees levied OII the menibers.
15 i 0

C
c: c C
m e wafer orders for each watercourse are passed on to the Gauge Reuder who will piirol a reach of ihe Lower Swai Canal, a distributary, a brarich or a niirior. Under rhe derrmud sysrem orders will be passed to the Sub-Engineer. arid ori to the Execurive Engineer, who will have a Water Despaich Oficer on his stas He will use a desk-top computer ro schedule wafer deliveries throughout the system. 7he delivery schedule would be sew to the Sub-Engineer from where it is given io ihe Gauge Readers. Diversions will be mrule'ar the headword irito ihe Lower Swai Canal, ihen into the distributaries, branches and minors iri accordance wiih ihe water schedule receivedfrom the Erecuiive Engineer.
The Gauge Reader, who is assigned to a speci~?c reach of ihe sysiem, would regulate the watercourse gare in accordance wiih ihe schedule worked our by the Water Desparch Oficer based upon ihe demauds on ihe waiercourse and rhe availabiliiy of waier. where ihere is rio limiiaiion on ihe amount of waier available, deliveries io ihe watercourw can be made or1 ihe basis of the demands of the farmers on the warercourse. me Gauge Reader would record the amount of wafer delivered ro the watercourse on a daily basis. His record book would dso show the amourit of the water ordered for the watercourse.
As indicatedpreviously, the distribuiion of waier in ihe waiercourse would be ihe responsibiliry of the Water User Association and ir is ariticipaied rhar ihe eritire /low in the warercourse would be delivered to one farmer at a time. 271;s would allow the fanner to compute rhe amounr (depth) of water he applies to eachfield. 271;s information, along wiih the corisumprive use requiremenr for ihe crop, will enable him to evaluate his irrigation praciice and to increase his fann irrigation eflciency to an optimum. "
The above expectations are obviously farfetched considering the present status of the institutional set up. Similarly, regarding the determination of the water requirements, the Manual is not very explicit and even contradictory, and reflects a lack of awareness of local conditions. At one point it is mentioned that water is released according to the demand expressed by the WUAs, on the other hand it is said that
"7he cropped areas of each crop for every watercourse unir will be supplied by the reveriue staff to the projeci opemibig agency ai the siari of the season, or prcfkably bcfore the siart of rhe season. ?his cropped area will be used for ihe cornpurarion of crop wafer requiremerit.s for individual watercourse units. "
It is clear that most of these expectations have not been fulfilled up to now, and even have little chance of being realized in the near future, reflects the inadequate consideration of important institutional aspects of the project.
While construction work was pursued by all the parties concerned, there is no evidence that much attention has been paid to the most important organizational elements in the design. Establishing special monitoring units for O&M in the operating agency, training of operating personnel, formation of Water Users Associations, and training of farmers seem to have been assumed as tasks that would easily fall into position with the completion of designed physical infrastructure. This assumption has been proved wrong, as to date, none of these items has been accomplished as originally envisaged.

3.2 Chashma Riaht Bank Canal lrriaation System
3.2.1 Irrigation S y s t e m Operat ions
Two aspects will be discussed under this section; the first one relates to the activities undertaken to simulate main canal operations, and the second one addresses the efforts to refine the calibration of structures at main and secondary level.
3.2.1.1
Preliminary results of the simulation of Chashma Right Bank Canal were presented in the previous progress report (# 1); further work done in this area has shown that the technique is very useful to comprehend, evaluate and eventually manage the canal’s operation.
The objectives of using a simulation model for CRBC can be given as follows:
Simulation of main canal ooerations
i) To understand the behavior of Stage I under the existing hydraulic/operational conditions and water delivery pattern.
To explore the design and operational constraints of the main canal at minimum and maximum planned discharges in accordance to crop based operations and to assess water delivery problems at these flows.
To evaluate and suggest improved management and operational practices
ii)
iii)
At present, it has been considered by WAPDA that the system is passing through a transitional phase and the process of defining the management objectives and the corresponding operational procedures could be postponed. The managers have adopted a secure approach and the management objectives have been translated into keeping the water elevations at the regulation points of the main and secondary canals as high as possible. This approach has raised the delivery performance ratio (DPR) for the off-takes of stage I , but has deferred the introduction of genuine crop-based operations of the system. Therefore, current water deliveries to the off-takes of stage I are different from the original plan. However, the present schedule can not be sustained, as per the original design, once all three stages of the main canal become operational.
Given these conditions, it is important to assess more fully the capabilities of the system, specially since it is a newly built one which has not yet attained hydraulic equilibrium.
Before the model (SIC, from CEMAGREF, France) was applied, existing information and available data were analyzed. The yearly monitoring reports for the last four years (1987-1991), produced by the Alluvial Channel Observation Project (ACOP), provided useful knowledge about important parameters (i.e. topography, seepage, siltation, Strickler coefficient, etc). This information was supplemented with comprehensive data about water levels, structure’s geometry and gate operation collected by IIMI’s field team.
Hydraulic Performance of CRBC Staee I The proper hydraulic functioning of stage I is critical for the performance of the whole system.
17
C
I 0
Figure Il l-la
At 65.5 cumecs inflow of CRBC Measured and Computed Velocities
Velocity 3 2
. . . . . . . . . . . . .
. . . . . . . . . . . . . . . . .
. . . . . . . . . . . . . . . . . . . . .
29.9 36.6 60.4 77.7 15.5
Distance along the canal (km) - Measured Comouted
Figure I l l - lb Comparison of Existing and Design
Velocity along CRBC for different Flows
(Existing VelIllDesign Vet) 1 I
0.8
0.6
0.4
0.2
0 15.7 29.4 35.8 36.9 51.8 60 .3 69.7 72.2 76.2 77.5
Distance along the Canal Ikm)
107 m^3/s 67.5 rne3/s 41 .23 m^3/s
18

0
191
190
189
188
cc r! n 0 u c
Il n
upstream - -
downstream
-
-
-
D
The model was used to study the hydraulic performance and water distribution capacity of the system for different head releases, ranging from 40 to 113 m3/s. The results were compared with the field data, and the predicted trends were verified wherever possible. Some of those results (water surface levels and discharges) were already presented in progress report # I .
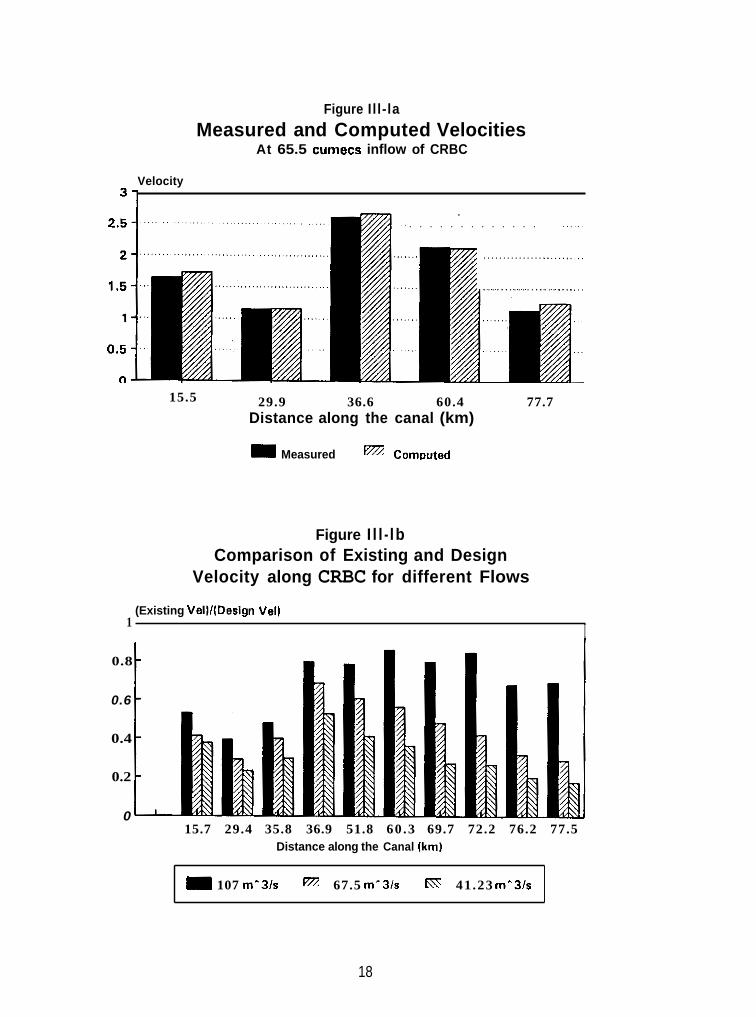
Velocity is an important parameter because of the sediment-related effects on the canal performance. The variation of velocity in different reaches provided useful information about the impact of existing practices on system behavior. Figure Ill-la shows the close agreement between measured and predicted velocities at 67.7 m3/s. Figure Ill-lb shows three set of predicted velocities at low, medium and high discharges corresponding to actual head releases in 1992; it also shows the behavior of the velocity along the canal under current operation of cross regulators.
The velocity along the canal is affected by the backwater curve. The significant water storage as a result of maintaining the design water elevation at the tail of stage I and upstream of the combined structure has produced considerably low velocities and flatter slopes in these reaches. The consequence has been s i l t accumulation which could be observed during canal closure. While this may be favorable for the unlined reach it is clearly problematic for the lined section. It remains to be seen whether this silt will be flushed at a later stage with high discharges when Stages I1 and 111 are fully developed. Before this time there is the option of running the canal for some time at a higher discharge with the escape at the end of Stage 1 fully open to control the siltation problem.
Figure 111-2
Up and Down-stream of first Regulator Predicted and Measured Stage-Discharge
Water Level Im)
lg2 2
I".
30 40 50 60 70 80 90 100 110 Discharge Irn-3lsec)
* Model - WAPDA rating curve 0 WAPDA measurement
19

0 ci 0 [I
G II n CI
Figure 111-2 shows the comparison of predicted and measured Stage-Discharge sets (depth vs Q) at RD 120 + 000 [original in feet] and upstream of the combined structure. The predicted values are in good agreement with the measured data for the former set; while the curves upstream of the combined structure show a constant difference from the observations. This difference is probably related to the calibration of the gates of the cross regulator. Future work will address this particular issue.
The above work has produced two main conclusions: first, the current operational mode of the main canal is having a considerable impact on its hydraulic performance with implications for management. Of special importance are those issues related to sedimentation vis a vis maintenance, and the excess deliveries as they affect farmers perception of water availability. Second, simulation can be used as an additional tool to analyze a variety of situations which are difficult to try out in the field for a variety of reasons.
Unsteadv Flow Conditions and the Water Delivered to the Off-takes Determining the necessary management conditions for an appropriate distribution of water under different flow conditions is one of the major objectives under the CBIO project. A good estimate of the volume diverted to the off-takes is needed for the proper operation of the secondary canals under unsteady conditions. The computed distribution pattern during one week for four sample distributaries was compared with the direct discharge measurements available for that same period.
Results indicate that distributary 1 always maintained free flow conditions while distributary 4 remained submerged. The flow conditions of the other two distributaries varied from free to submerged flow depending upon the management of the downstream stop-log structure. The number of the stop-logs is changed frequently by Irrigation Department personnel to ensure the discharge into the tertiary channels off-taking before this structure. Thus, downstream conditions can not be represented by a single rating curve.
The predicted discharges are very close to the measured ones for distributary # 4. A variation of 5 to 20 % was observed for the other three distributaries resulting from variable flow conditions for # 2 and # 3, and improper calibration of the outlet pipe for number one.
Figures 111-3 and 111-4 show the gate openings, water elevation in the main canal and the predicted and measured discharges for distributaries 3 and 4. It can also be observed that the gate opening is the most important parameter and determines the flow pattern. Likewise, the effect of water level fluctuations in the main canal can be seen to be rather small.
These results show that the accuracy of prediction of the water delivered to the off-takes depends upon a precise quantification of the structures’ dimensions and their downstream conditions. The difference between the measured and computed values is the acceptable limits, but some work is still required to improve the simulation of the structures’ behavior.
Hvdraulic Evaluation of the ootions to handle a desien constraint This third and final application conducted during the season explored how well a proposed scenario (based on new management rules or physical modifications) could be hydraulically evaluated. It also demonstrated that when different choices are available to solve a particular problem, a manager could compute and compare various relevant parameters to optimize his
20
I I
! i

Figure 111-3
at Distributary-3 Head Regulator Unsteady Flow Simulation of CRBC
Gate Openings Im) and 0 im3/s) Water Elevation Imj i 187.6 31
5 4.5 4 -
3.5 3 -
2.5 2 -
1.5 1 -
o.5 0
+ +
1.5 +
187.6 - 187.4 - 187.2 - 187 - 186.8 - 186.6 - 186.4 .- 186.2
- \
r - - / - - / - --, L. .-, .-/ - -
+ .& A - . . . . , . . . . .. . . . . . ., , ,. . , . . . . . , , , ,
. . . . . . . . . . . . . . . , , . . . . . . . . . . . . . . . , . . . . . . , . . .. . . . . .
187.4
1187 187.2
186.8
I t -4 1 1 86.6
0.5 1 186.4 186.2
0 ' '186 5 6 7 8 , 9 0 1 2 3 4
Time in days
Model (1 + Flsld Q
WL In maln cmal
- Gate opsninp - .
21
t3
1.4
1.2 -
1
0.8 -
0.6
[I
++ + + +
t + + ++ + -* +
..
I I I
D
c U
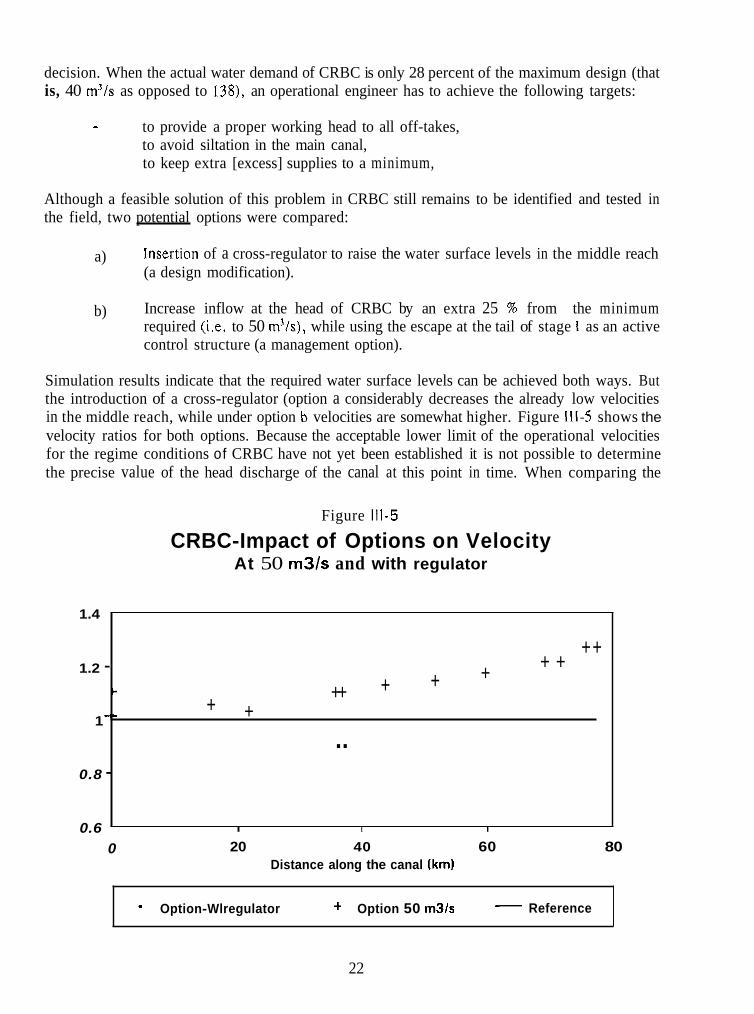
decision. When the actual water demand of CRBC is only 28 percent of the maximum design (that is, 40 m’ls as opposed to 138), an operational engineer has to achieve the following targets:
- to provide a proper working head to all off-takes, to avoid siltation in the main canal, to keep extra [excess] supplies to a minimum,
Although a feasible solution of this problem in CRBC still remains to be identified and tested in the field, two potential options were compared:
a) Insertion of a cross-regulator to raise the water surface levels in the middle reach (a design modification).
Increase inflow at the head of CRBC by an extra 25 % from the minimum required (i.e. to 50 m’/s), while using the escape at the tail of stage I as an active control structure (a management option).
b)
Simulation results indicate that the required water surface levels can be achieved both ways. But the introduction of a cross-regulator (option a considerably decreases the already low velocities in the middle reach, while under option b velocities are somewhat higher. Figure 111-5 shows the velocity ratios for both options. Because the acceptable lower limit of the operational velocities for the regime conditions of CRBC have not yet been established it is not possible to determine the precise value of the head discharge of the canal at this point in time. When comparing the
Figure 111-5
At 50 m31s and with regulator CRBC-Impact of Options on Velocity
0 20 40 60 80 Distance along the canal (kml
Reference - Option-Wlregulator + Option 50 m3ls
22
options against each other, results indicate that the computed water elevations and velocities in the 25 % higher discharge scenario is a better hydraulic option. It is also the cheaper option (no construction work), but it will have to be checked against the maximum allowable withdrawal of CRBC from the lndus at Chasma barrage.
In summary, this is the time for operational staff of CRBC to prepare and practice well defined operational rules for the main canal and its off-takes. Before Stage I1 becomes fully operational, a reasonable estimation of crop water requirements for both stages and the trial-implementation of appropriate ten-daily schedule for the operation of the system is recommended. This would begin to shift the canal managers away from the present pattern of responding to uncertainties related to water management and cropping practices under which they are now operating.
A final note on the simulation work described in this section of the report concerns the perception that this type of activity is generating among the different agencies’ personnel. The results of such studies are intended to bring potential problems to the attention of the managers rather than provide definitive solutions to them. Only after professional in-depth studies of such findings are made by the design and operational engineers of the concerned agency will it be possible to determine and select the best or most appropriate solution for the problem.
3.2.1.2 DeveloDment of Ratina Curves
Work on the development of final rating curves for distributaries and watercourses continued during the reporting period. As it was pointed out previously, the particular physical set up of CRBC causes some problems in this regard.
Calibration of the gated structures at the offtake points of the distributaries is complicated due to the presence of drop structures located relatively near of the heads. These structures are fitted with stop logs (kurrfes) which are removed or added from time to time, therefore changing the downstream conditions and making impossible the development of a single rating curve to fit those particular situations.
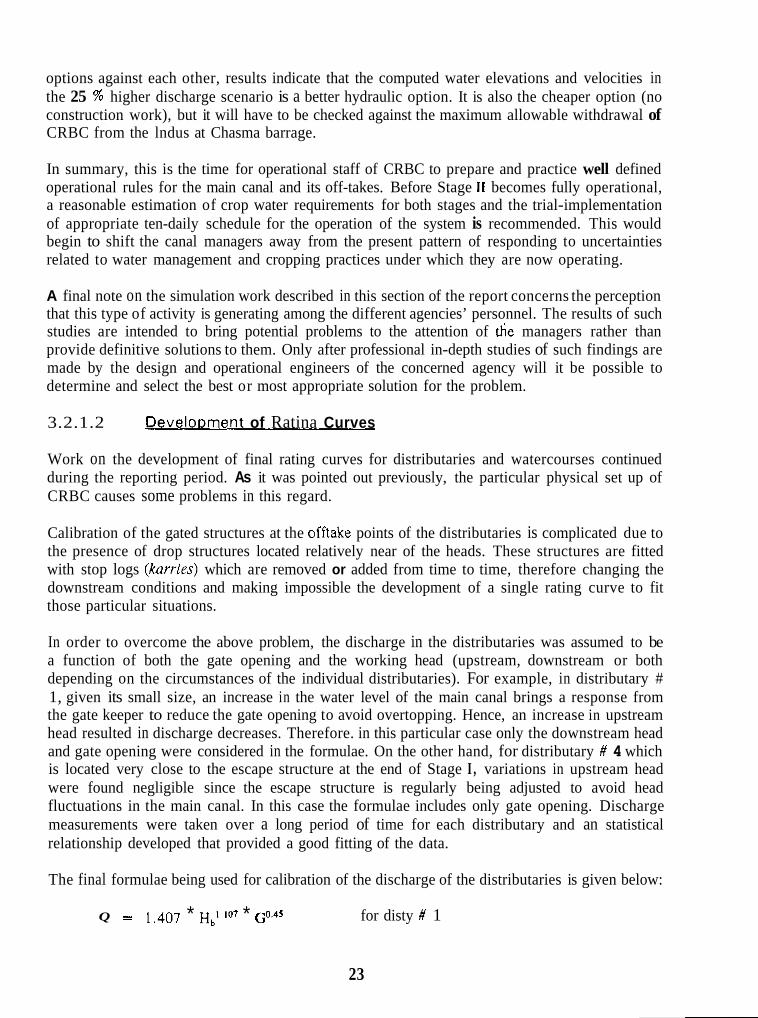
In order to overcome the above problem, the discharge in the distributaries was assumed to be a function of both the gate opening and the working head (upstream, downstream or both depending on the circumstances of the individual distributaries). For example, in distributary # 1, given its small size, an increase in the water level of the main canal brings a response from the gate keeper to reduce the gate opening to avoid overtopping. Hence, an increase in upstream head resulted in discharge decreases. Therefore. in this particular case only the downstream head and gate opening were considered in the formulae. On the other hand, for distributary # 4 which is located very close to the escape structure at the end of Stage I , variations in upstream head were found negligible since the escape structure is regularly being adjusted to avoid head fluctuations in the main canal. In this case the formulae includes only gate opening. Discharge measurements were taken over a long period of time for each distributary and an statistical relationship developed that provided a good fitting of the data.
The final formulae being used for calibration of the discharge of the distributaries is given below:
Q = 1,407 * H,’ 10’ * Go4s for disty # 1
23

Figure 111-6
Rating Curve of W/C # 1481 07R
Heed (meters1 0.5 1
0 0.02 0.04 0.06 0.08 0.1 Discharge lcumecsl
~ l - Rating Curve 0 Measured Discharge
Rating Curve of WIC # 1538243 Head (meters1
0 0.02 0.04 0.06 0.08 0.1 Discharge (cumecsl
Rating Curve 0 Measured Discharge -
24
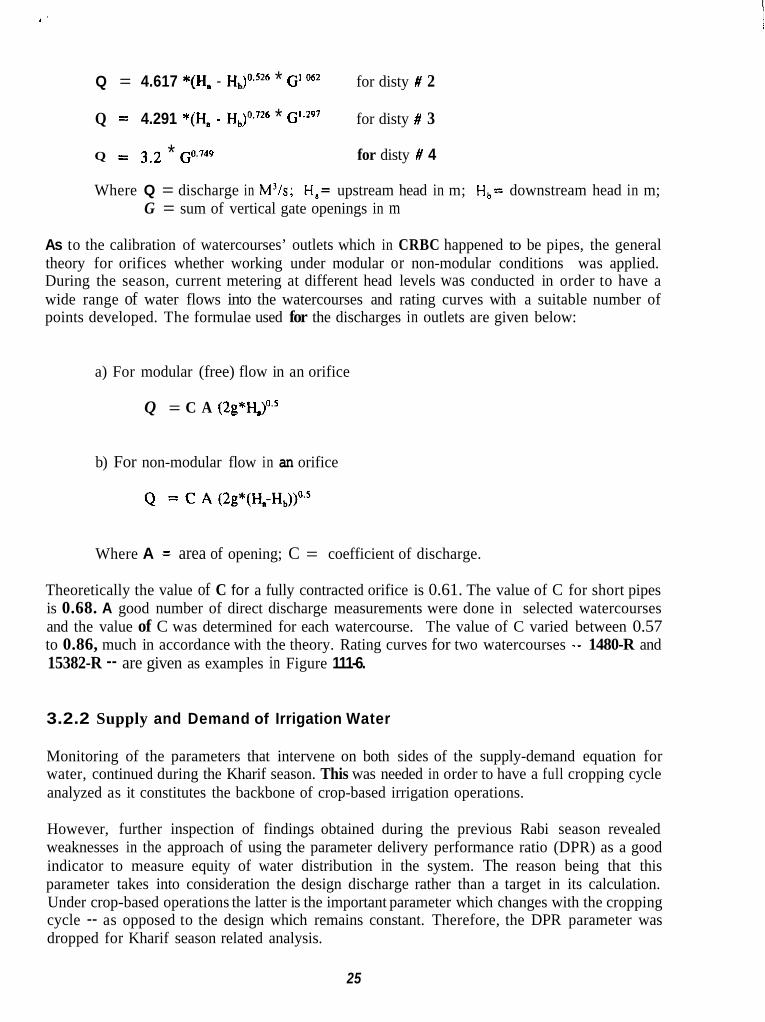
G ci Q = 4.617 *(H, - Hb)0.526 * G’ 06’ for disty # 2
Q = 4.291 *(Ha - H,)0726 * for disty # 3
Q = 3.2 * Go7@ for disty # 4
Where Q = discharge in M’ls; H,= upstream head in m; H,= downstream head in m; G = sum of vertical gate openings in m
As to the calibration of watercourses’ outlets which in CRBC happened to be pipes, the general theory for orifices whether working under modular or non-modular conditions was applied. During the season, current metering at different head levels was conducted in order to have a wide range of water flows into the watercourses and rating curves with a suitable number of points developed. The formulae used for the discharges in outlets are given below:
G CI
a) For modular (free) flow in an orifice
Q = C A (2g*Hd0.’
b) For non-modular flow in an orifice
Where A = area of opening; C = coefficient of discharge.
Theoretically the value of C for a fully contracted orifice is 0.61. The value of C for short pipes is 0.68. A good number of direct discharge measurements were done in selected watercourses and the value of C was determined for each watercourse. The value of C varied between 0.57 to 0.86, much in accordance with the theory. Rating curves for two watercourses -- 1480-R and 15382-R -- are given as examples in Figure 111-6.
3.2.2 Supply and Demand of Irrigation Water
Monitoring of the parameters that intervene on both sides of the supply-demand equation for water, continued during the Kharif season. This was needed in order to have a full cropping cycle analyzed as it constitutes the backbone of crop-based irrigation operations.
However, further inspection of findings obtained during the previous Rabi season revealed weaknesses in the approach of using the parameter delivery performance ratio (DPR) as a good indicator to measure equity of water distribution in the system. The reason being that this parameter takes into consideration the design discharge rather than a target in its calculation. Under crop-based operations the latter is the important parameter which changes with the cropping cycle -- as opposed to the design which remains constant. Therefore, the DPR parameter was dropped for Kharif season related analysis.
I
25 I

0 n E 1 D c 0 I! 0 0
C
Below, four important components pertinent to the question of supply and demand of irrigation water in CRBC are presented.
3.2.2.1 Relative Water S U D D I ~
The parameter Relative Water Supply (RWS) continued to be used as a key factor to evaluate the performance of the system. It is a powerful tool as it provides a good sense on how farmers respond to a given amount of water made available (or expected to be made available) by the system at different levels.
It is also a very convenient indicator, since by definition as the relationship between the amount of water supplied (both irrigation and rainfall) and the amount of water needed (crop demand plus seepage and other losses), it involves all the important factors that dictate the success or failure of the crop in the field. As before all the variables that intervene in the equation were closely monitored down to the on-farm level,
In Table-1, the crop water requirements for distributary # 3 during the Kharif season were calculated, based on a detailed survey of both crops and areas actually cropped. Furthermore, the requirement for the entire cropping cycle is given in Table-25. The latter table sets the stage for the calculation of 10-daily water requirements--once pertinent water losses and effective rainfall are introduced-- as demanded by the system under current field conditions.
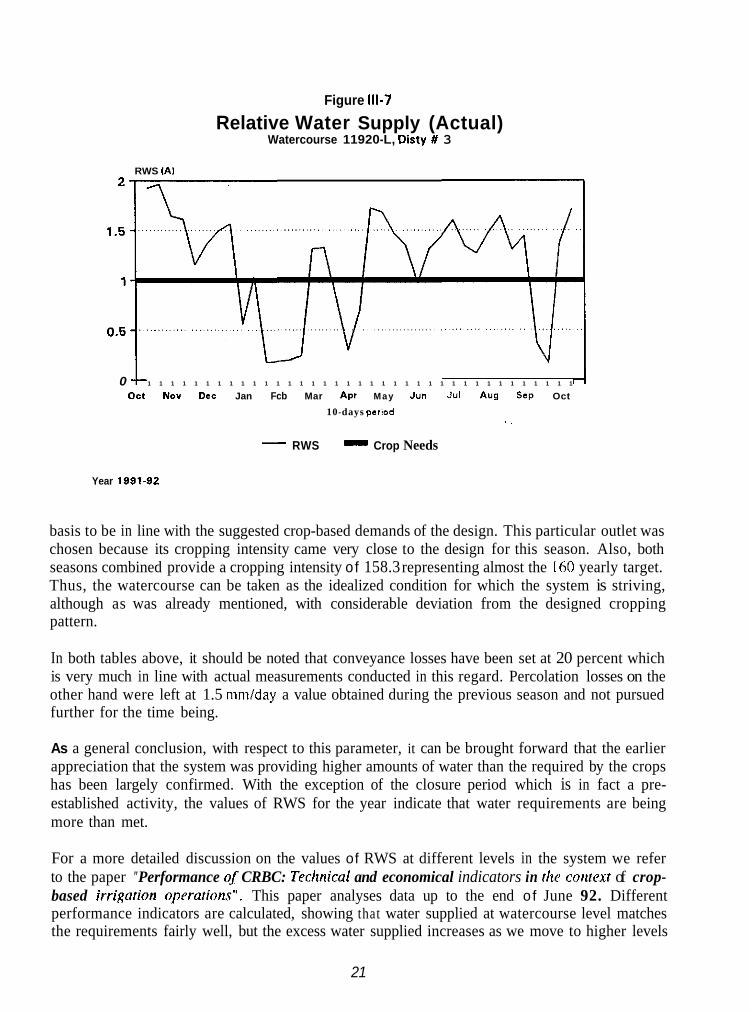
The above information was thus put together and the RWS for selected watercourses and distributaries was calculated. As an example, this information can be seen for watercourse 11920- L during Kharif season in Table-3. Similar information had been provided in progress report # 1 for the same watercourse during the Rabi season. The combined information of both seasons is given in Table-4, and Figure 111-7 shows the yearly variation.
The figure highlights this temporal variation of the RWS for the sample watercourse and is indicative of the situation on those other watercourses monitored by the IlMl field team. The cut in the irrigation water supply during the canal closure period of January-February 1992 is naturally expressed by a very low RWS for 3 periods of 10 days. For the whole Rabi season, 3 localized peaks are observed, corresponding mainly to the periods of pre- (end of October), first (december) and, second (march) irrigation of wheat; a crop predominant in the current cropping pattern of the sample watercourses. Two of these peaks surround the canal closure period and thus partly compensate the shortage of water during this 40 day long period.
The portion of the graph that corresponds to the second period, i.e. Kharif, indicates a somewhat higher value of RWS than those observed for Rabi. This tallies with the overall perception by farmers that water allocations are higher during Kharif. The supply seems suitable as per crop demand throughout the season (values always greater than unity).
As mentioned above, Tables 3 and 4 show the data utilized to obtain the RWS values for the Kharif and the year, respectively, for watercourse 11920-L; the data is presented on a 10-daily
’ In both cases, crop water requirements were calculated following the guidelines set forth by the Food and Agricultural Organization through lheir computer program CROPWAT.
26
c!
c
c
Figure 111-7
Watercourse 11920-L, Disty # 3 Relative Water Supply (Actual)
RWS IAI
0 1 1 1 1 1 1 1 1 1 1 1 1 1 1 1 1 1 1 1 1 1 1 1 1 1 1 1 1 1 1 1 1 1 1 1 1 1
Oot No" Dec Jan Fcb Mar Apr May Jun Jul Aug S c p Oct
10-days period . .
RWS - Crop Needs - Year 1881-82
basis to be in line with the suggested crop-based demands of the design. This particular outlet was chosen because its cropping intensity came very close to the design for this season. Also, both seasons combined provide a cropping intensity of 158.3 representing almost the 160 yearly target. Thus, the watercourse can be taken as the idealized condition for which the system is striving, although as was already mentioned, with considerable deviation from the designed cropping pattern.
In both tables above, it should be noted that conveyance losses have been set at 20 percent which is very much in line with actual measurements conducted in this regard. Percolation losses on the other hand were left at 1.5 mmlday a value obtained during the previous season and not pursued further for the time being.
As a general conclusion, with respect to this parameter, it can be brought forward that the earlier appreciation that the system was providing higher amounts of water than the required by the crops has been largely confirmed. With the exception of the closure period which is in fact a pre- established activity, the values of RWS for the year indicate that water requirements are being more than met.
For a more detailed discussion on the values of RWS at different levels in the system we refer to the paper "Performance of CRBC: Teclinical and economical indicators in (lie contexf of crop- based irrigarion operarions". This paper analyses data up to the end of June 92. Different performance indicators are calculated, showing that water supplied at watercourse level matches the requirements fairly well, but the excess water supplied increases as we move to higher levels
0 21

c c 1 c n S I] c 0 n 0 c 0 [I
c1 c G U
of the system. This corresponds, of course, with the practice of escaping excess water at the tail of Stage I and to a lesser degree at the tail of distributaries.
3 ..2.2.2. Water Losses
Three aspects related to water losses that were conducted during the reporting period are presented in this section: i) those pertaining to losses, proper, in distributaries # 3 and # 4; ii) installation of small flumes in order to fine-tune water measurements and hence improve losses assessments; and iii) trial with infiltration rings to improve our understanding of water movement at field level.
i) Water losses from distributaries. The Inflow-Outflow method was utilized. For Distributary # 3, the first measurement (inflow) was done at the head, just below'the first drop structure, giving a value of 1870 Ils (60% of the design discharge). The second point (outflow) was taken at the tail and measured a discharge of 1740 Ils, that is 130 Ils less than at the head. Out of the 14 outlets in between the measuring points, 8 were closed, 2 outlets were open drawing about 43 I/s and 15 I/s, and 2 were partially closed drawing each about 14 Ils. In addition, halfway the distributary, there was a pump discharging water from some flooded fields into the canal, this discharge was calculated at 30 I/s. So the net surface abstraction was about 60 Ils. This leaves a loss of 130 - 60 = 70 I/s caused by seepage.
The distance between measuring points was 4570 m (15,000 feet), the average width 7 m, the average depth was calculated at 1 m, and the average wetted perimeter was therefore 9 m, 'resulting in a wet area of 41,000 m2. This gave a seepage loss rate of 70 / 41 = 1.7 I/s per 1000 m'.
In Distributary # 4, with the help of the list of opedclosed outlets observed in the morning, a reach with a maximum number of closed outlets was selected; this was the stretch from RD 12,860 (just below 2 open outlets) to RD 32,950 (16 m from tail). Q-in was 3710 I/s (about 65% of design), Q-out 3390 Ils, or a difference of 320 Ils. Of the 19 outlets along this stretch, 10 were closed and 9 were partially closed. The discharge through each outlet was roughly measured; the total abstraction was found to be about 227 Ils. These figures indicate a loss of 93 I/s caused by seepage.
The distance between measuring points was 6120 m (20,090 feet), with an average canal width of 10 m, the average depth was about I m, with an average wetted perimeter of 12 m, resulting in a wet area of 73,000 m2. This gave a seepage loss rate of 93 / 73 = 1.3 I/s per 1000 in'.
The seepage loss rate values found for the distributaries # 3 and # 4 are comparable. Their average value being therefore of 1.5 I/s per lo00 m2. This is lower than the standard value of 2.4 Ils cited for canals in the Punjab, but it should be kept in mind that the canals evaluated are located in the heavier soils of the CRBC irrigation system area.
In the CRBC Stage I1 feasibility report (1987), the water losses from the distributaries are estimated at 258 cfs from 1.9 million feet of canal length, or 13 Ilslkm. From our measurements equivalent values of 15.3 and 15.2 I/s/km are obtained for distributaries # 3 and # 4 respectively; there is considerable agreement with the values cited in the feasibility report considering the margin of uncertainty of our measurements.
28

I I ii) Introduction of smaller flumes. Two new, smaller (EBC) flumes were introduced and tried
out in the field. These were adapted from the RBC flume, to fit better our field conditions, and make them more easy to handle.
Work was carried out in a couple of sites. First, in watercourse 8980-L of distry # 4 current metering at the head gave a value of 62 Us. Subsequently, at the end of the lined section (about 2 km, only one leaking nakka of less than 1 I l s ) the discharge was measured three different ways: current meter (56 Us), RBC-flume (59 Us) and EBC-flume (60 I l s ) . The values are all in good agreement, within a 7 percent margin; and show a very small loss in the lined section.
The second trial was done at watercourse 21,516-Lof Girsal, in the unlined left branch just below the outlet. The outlet is a flume which was partially closed by putting a concrete block in front. of it in the minor. For reference, water in the minor was 433 mm below the white mark. Measurements were done with both the RBC flume, 35.8 I/s, and the EBC, 36.9 Ils, the results once again showing a good agreement between the devices.
The EBC-flumes used at D.I.Khan have, 10-cm, bigger cut-off sheets than the ones utilized for the Punjab and the RBC-flume, in order to fit better some watercourses in the CRBC area. This was found to make the installation more easy, except in the case when the watercourse runs at a small fraction of its capacity with a low water level. In this case the flume has to be installed at a lower level to avoid a long waiting period for the stable working head to built up.
iii) Infiltrometer. A trial with the set of infiltrometer rings was carried out. We installed one pair (inner + outer ring) in a field which had been lying fallow during kharif and which was dry with a good soil structure. Another pair of rings was installed in a neighboring field of which the rice had been harvested recently. Its surface had dried up but under it the soil was still wet, with no soil structure.
The dry fallow field absorbed 160 mm in 2% hours; the harvested rice field 12 mm in 2 hours. We did not continue the experiment long enough for the infiltration rate to come to a constant value (the basic infiltration rate). This can indeed take very long for a clay soil, and the concept of basic infiltration rate does not fully apply to clay soils because the structure of a clay soil is slowly changing after saturation.
But changes in the infiltration rate were very slow at the end. We therefore approximated the basic infiltration rates as follows: for the dry, fallow field 0.7 mm per minute; for the harvested rice field 0.7 mm per hour. As can be inferred from above, after a few hours the rate of infiltration in the harvested rice field was 60 times slower than in the dry fallow field. This is due to the loss of structure. (The moisture contents only affects the infiltration rate at the beginning of the experiment.) While this trial was very preliminary it does point to the influence that farmers practices can have on water demand.
3.2.2.3 0 D e n and Closure of Outlets I
As was reported in Progress Report # 1, the openinglclosure of outlets turned out to be an ~
I
important factor to monitor. This behavior by farmers, which goes contrary to the traditional supply-driven practices set forth by the Irrigation Department under which outlets remain open all the time, provided the first insight to the de facro crop-based irrigation operations being
29 I
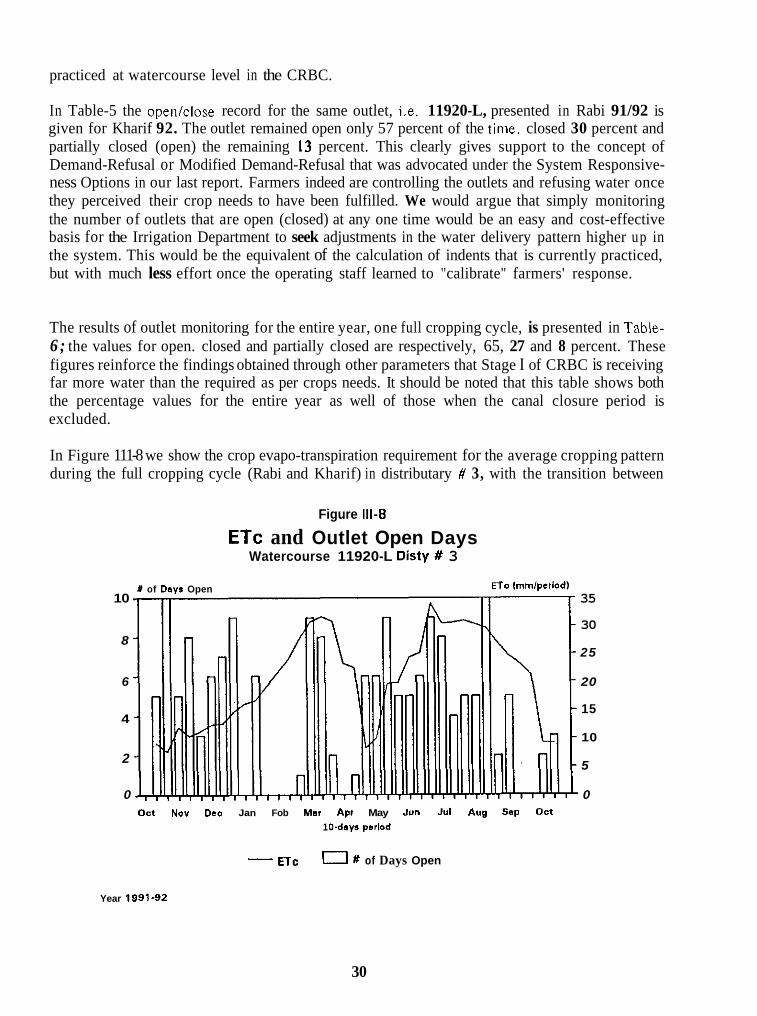
c practiced at watercourse level in the CRBC.
c
0
ci c
In Table-5 the open/close record for the same outlet, i.e. 11920-L, presented in Rabi 91/92 is given for Kharif 92. The outlet remained open only 57 percent of the time, closed 30 percent and partially closed (open) the remaining 13 percent. This clearly gives support to the concept of Demand-Refusal or Modified Demand-Refusal that was advocated under the System Responsive- ness Options in our last report. Farmers indeed are controlling the outlets and refusing water once they perceived their crop needs to have been fulfilled. We would argue that simply monitoring the number of outlets that are open (closed) at any one time would be an easy and cost-effective basis for the Irrigation Department to seek adjustments in the water delivery pattern higher up in the system. This would be the equivalent of the calculation of indents that is currently practiced, but with much less effort once the operating staff learned to "calibrate" farmers' response.
The results of outlet monitoring for the entire year, one full cropping cycle, is presented in Table- 6 ; the values for open. closed and partially closed are respectively, 65, 27 and 8 percent. These figures reinforce the findings obtained through other parameters that Stage I of CRBC is receiving far more water than the required as per crops needs. It should be noted that this table shows both the percentage values for the entire year as well of those when the canal closure period is excluded.
In Figure 111-8 we show the crop evapo-transpiration requirement for the average cropping pattern during the full cropping cycle (Rabi and Kharif) in distributary # 3, with the transition between
Figure 111-8
Watercourse 11920-L Disty # 3 ETc and Outlet Open Days
X of Days Open ETo Immlpcriod) 10 35
30
25 8
6 20
15
10
5
4
2
0 0 Oct Nov Dec Jan Fob Mat Apt May Jun Jul Aug Scp OCt
1 0-days period
ETc 0 # of Days Open -
Year 1991-92
30

seasons clearly observed in early May. ( See also Annex-4 for ET,, calculated for 30 years, and measured by Class A-pan during 1992). Super-imposed on the requirements is the number of days that outlet t 1920-L remains open. While there is some correlation during the Kharif, the relationship is not as strong as one would expect. However, looking at the graph it does seem that during critical demand periods in both seasons, farmers are clearly taking in as much water as they can. The relatively high number of days open in May corresponds to the period when land preparation for rice is needed. A better match might be obtained when we average open/closed data for all monitored outlets, and also including the outlets’ discharges in the analyses. This analysis will be done during Rabi 92/93 season.
In order to improve on the quality of this information, the status of the outlets is being monitored, at random, twice a day. Also, readings have been added during weekends and holidays. This approach will help minimize the chance that the farmers would open or close the structure after our readings took place or that they would make unexpected changes for the night. So far, this extra monitoring has not given cause for concern that the original data are biased.
3.2.2.4
Consistent with the importance that the impact of shifting crop distribution can have on system operations, we continued monitoring of both cropping pattern and intensities in the system during the Kharif 92 season.
Cromina Pattern and its ImDact
The results of the cropping pattern and intensities, for selected watercourses, of distributary # 3 as compared against designed values (as derived from the PC 1 document) are given in Table-7 and complemented by Figure 111-9, for the Kharif season. In general, the intensities fell far short (42 percent on the average) from the target of 60 percent intended for the season. Also, there is quite a significant discrepancy between the values for individual crops, most notably for rice.
While the rice crop has an intended design intensity of just 2 percent of the area, the range cropped in selected watercourses spans from 3 to 49 percent with an average of 23.7. The impact of such a large variation should be clear as it relates to the demand for water, and in fact may help explain the low intensities where farmers prefer to plant rice while diminishing the total cropped area. But it also reinforces the findings that water deliveries are much higher than original intended. Farmers undoubtedly perceive that the system can provide a lot of water and hence go for a high water demand crop; a condition that will bring only problems to management once Stage I1 and 111 become fully operational and the generous current water allocations will have to be curtailed.
Sugarcane also shows considerable variations within watercourses and the overall average for the monitored area is only 5.5 percent, much less than the proposed 15 percent. Likewise, maize, cotton and millet are all down from the initial design intended values. It is obvious that rice is by far the most popular crop for the season and all others have been affected accordingly. Given the economic returns of rice, as compared to other crops, it is not surprising that in a system that is providing relatively high amounts of water a considerable shift for that crop is taking place.
In Figure 111-10, the cropping intensities for the complete cropping cycle -- Rabi and Kharif -- are given. The figure shows that CRBC as a whole (represented by the samples) is still achieving some-what lower values than the 150% cropping intensity called for by the design; and it also
31
I I i i i
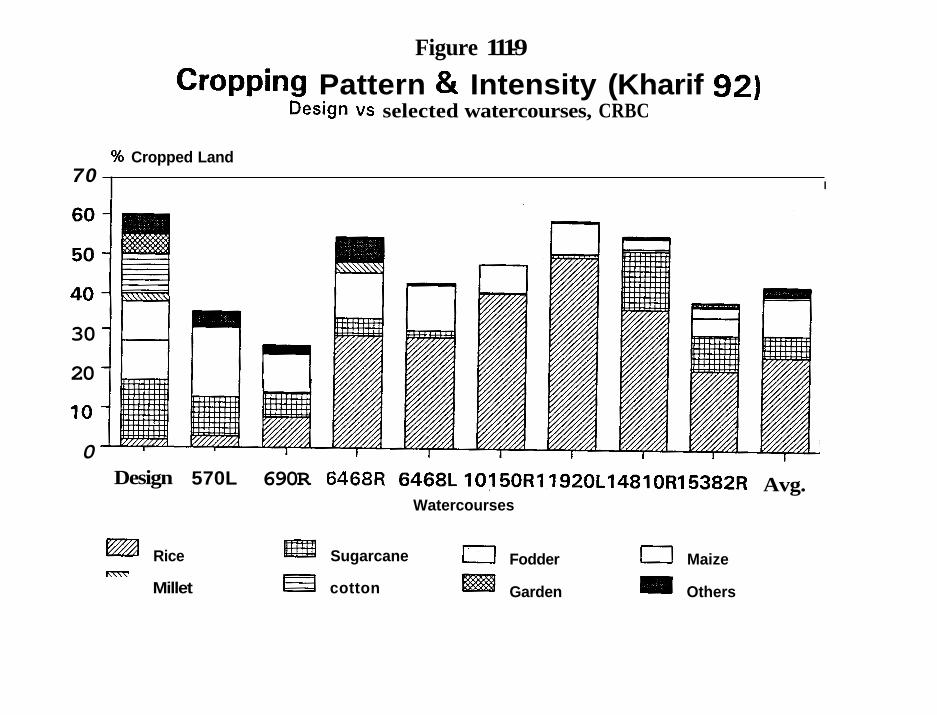
m n n ~ ~ n ~ n ~ m ~ m ~ n ~ ~ n ~ ~
Figure 111-9
Design vs selected watercourses, CRBC Cropping Pattern & Intensity (Kharif 92)
% Cropped Land 70
I I
W N
30
20
10
0 Design 570L
n 690R 6468R 6468L10150R11920L14810R15382R
Watercourses
0 Fodder 0 Maize Rice Sugarcane
Garden Others Millet f3 cotton
Avg.

0
0
0 0 0 0 n 0 0
0
m- *
L a,
cn c .- Q. a. 0
33

c j c
0
c 0 G [I
0
0 0
shows that the shortage is associated primarily with the Kharif's value of 60 percent as opposed to Rabi's 90. One explaining factor for this is the habit of a substantial part of the farmers to move to higher areas during Karif season.
Another conclusion that comes out of Figures 111-9 above is that the existing cropping pattern is clearly different from that utilized in the design of the system; the implication being that the 10- day water requirements calculated under those assumptions no longer hold. For example, for the designed conditions the peak water requirement of 138 m3/s occurs during the second period of October while with the new pattern the peak comes during the last period of June and is somewhat lower. The latter situation has been clearly observed and documented in the field. Thus, new crop demand should be recalculated and fed back into operational plans.
3.2.3 Irrigation Facilities
Further exploration on the needs of new irrigation facilities was pursued during this reporting period but only in the context of the modelling work. It was felt unwise to be proposing changes in the current physical set up of the system without understanding properly the behavior and performance of what is already available. The project feels that it is too early to propose new structures or, even worse, to design and construct say an outlet and install it in the field without a full evaluation of the hydraulic operation -- both at main and distributary level -- of the system.
Because of this, the forthcoming work through simulation is being expanded to cover the distributary level. The modelling, to be used in connection to the management innovations already discussed previously in the report, will look into the behavior of the distributary # 3 to asses the performance of the outlets and to determine whether their present location is suitable for crop- based operations. Once the above is established, and only then, will we be in a position to suggest modifications, if any, for the outlets. Likewise, the simulation study will provide us with a better idea of the roll to be played by escapes at the distributary level.
Also in connection to the above, it should be understood that the findings that have already been obtained through the modelling exercise, on the evaluation of system design and on the operational procedures currently utilized by CRBC's management, are to be perceived only as indicative rather than as Dermanent solutions or definite recommendations. For example, work related to the possible need of an extra cross-regulator in Stage I as against the option of running at a higher discharge, as tested by the modelling, should not be seen by WAPDA or the Irrigation Department as a full recommendation emanating from the crop-based project. Instead, the findings are intended to bring to the attention of the agencies the need to seriouslv analvze the implications of those results corning out of the simulation studies. If WAPDA were to conclude that the need for an extra regulator is indeed a valid one, then the simulation package could be utilized to determine the exact location for the structure by feeding it with the complete set of pertinent information, as provided by the agency. On the other hand, if the option of increasing the discharge is chosen, the hydraulic model can be used to determine what would be the minimum discharge to achieve the required water levels to feed all distributaries and link-feeders.
I! 34
3.2.4 Irrigation Institutions
3.2.4.1 Scooe of Studv Activities
The main focus of study activities during the season being reported was on the watercourse level. The intention was to understand how the farmers with varying degrees of experience in irrigated agriculture would behave in a newly established irrigation system. The specific objectives were to study the existing irrigation practices in the CRBC Stage I command area, and to ascertain the strengths and weaknesses in the prevailing system. The study was limited to a sample study area consisting of Distributary No. 3 and Distributary No. 4 of new CRBC Stage area, and Girsal minor of the old Paharpur canal system which is incorporated in CRBC Stage I.
Primary data were collected from 12 watercourses of distributary #s 3 and 4 and Girsal minor. A multistage purposive sampling technique was adopted to select watercourses and respondents. One outlet from each quartile of the distributarylminor was selected. In each selected outlet, a sample of 6 farmer respondents (two each from head, middle and tail positions along the watercourse were interviewed and their irrigation practices were observed. Total sample size thus obtained was 72 farms representing various locations.
3.2.4.2 The Practice of Warabandi
The wurubundi system is a repeated cycle of rotational canal water distribution with a fixed turn and a time duration for each farmer, the time duration being determined proportionally according to the size of the farmer’s land-holding to be irrigated by the particular watercourse. A certain water allowance (or nikut) is also given to farmers far from the outlet as a compensation for conveyance losses along the watercourse. Normally, wurabandi has been adopted under conditions of water scarcity. Two types of warabandi, i.e. katcha warubundi and pucca warabundi, are usually found in Pakistan. The katcha warabandi is decided mutually by the farmers themselves without formal involvement of any government agency, while the paccu wurabundi is decided by the Irrigation Department when disputes are likely to arise, and issued in officially recognized wurabundi schedules.
To ascertain the nature of irrigation practices in the two Distributaries #s 3 and 4, a rapid appraisal was conducted for all watercourses during the Kharif 1992 season. By interviewing a few farmers on each watercourse, information about the existing status of wurubundi was obtained. For most of the watercourses, farmers had called upon the local purwuris to assist in the drawing up of their unofficial warabandi, and in a few cases the official wurubundi schedules have been issued. However, in most areas, the process is still under way.
On Distributary # 3, out of 20 watercourses only 3 do not have warubundi. The 17 with wurabandi have all unofficial arrangements. In Distributary # 4, the picture is slightly different: out of 36 watercourses, 14 have warabandi, 2 of which (7670-L and 19248-L) have official warubandi even if it is not strictly followed by the irrigators mainly due to excessive water supply. One possible explanation for the difference in irrigation practices between the two distributaries is the relatively greater scarcity of water in the watercourse commands of distributary # 3 than of distributary # 3, as reported by farmers, Another relates to the social characteristics, the population in Distributary # 4 being more diversified and with a higher
35

I
serial no.
i !ci
water- distributary wurubandi water availabi- course type lity (hrs per ha)
8
0
2
3
D
6468-L # 3 Unofficial 1.34
101 50-R # 3 I Unofficial 2.32
ci
5
6
II
1860-R # 4 No wurubundi
8980-L # 4 No wurubundi
I]
7
8
9
n 16512-L # 4 No wurubundi
28448-R # 4 Unofficial 1.35
5767-L Girsal Official 3.15
D
12 I 24046-L I Girsal (I Official 5.44
proportion of recent settlers.
In distributary # 3, in-depth investigations were carried out in four selected sample watercourse commands. The unofficial or the "Brotherhood (kurchu) wurubundi" was practiced on all the four watercourses until last Rabi season. During Kharif 1992 some areas of distributary # 3 have been transferred to Jabbar Wala minor of distributary # 4. The command area of one of the sample watercourses (14810-R) has been affected by these recent changes. As a result, even the unofficial wurabandi of some commands has collapsed during this Kharif season.
In Girsal minor, an official wurubundi determined by the Irrigation Department is followed in the four sample watercourse commands. At the tail watercourses, although the official wurubundi have been drawn up after the remodelling, differences already exist between the design-stage and the current practices. For the last 5 tail watercourses, differences are observed due to the soil erosion by the Indus river which has resulted in the decrease of the culturable command area of these watercourses.
Most of the farmers have reported that water is in excess during the Rabi season and that they are not keen about adhering to the wurubandi. Thus changes from the wurubundi frequently take place by mutual agreements. At times farmers close their outlets when they do not need any water. During the Kharif season, farmers cultivate a lower percentage of their land and again they are not particular about following their unofficial warabundi.
570-L 1 # 3 I Unofficial I ' 2.12 11 II !
11 11 1 21516-L 1 Girsal I Official I 3.67 II I I I I II II
36

The allocation of water is an important variable to be considered in the analysis of the management of water below the outlet. The water allocation in the warabandi system is measured in hours per hectare, and varies from one watercourse to the other, depending on the command area to be irrigated, which in fact determines the size of the outlet and the constant discharge of the water supplied to the watercourse. If warabandi is strictly adhered to, each farmer’s water turn duration should be on the basis of this uniform water allocation and the size of his farm.
The box on the previous page gives the type of warabandi and the water allocation for 12 observed sample watercourses, and highlights the differences from one watercourse to the other.
An important observation was that in practice, the farmers in each observed watercourse irrigated their land taking more or less than their due share according to the uniform water allocation for the watercourse. The actual time durations of their irrigation turns were observed for the 9 watercourses supposed to be having some form of warabandi (see box above), and the data so collected were analyzed and given in the box in the next page.
There is a high variability among farmers in the water allocated per hectare for the 4 watercourses of Distributary # 3, and the variability is much lower for the 4 watercourses of Girsal Minor.
Figure 111-1 1 and Figure 111-12 highlight the differences between two watercourses, 10150-R of distributary # 3 characterized by a high variability of water allocation among farmers, and 5767-L of Girsal minor where differences are less. These observations lead to the conclusion that there is less equity in karcha warabandi as compared to pakka warabandi.
Variability of water distribution within watercourses
3.2.4.3 Water Sharing
Even when warabandi exists, farmers have the practice of increasing the flexibility of water supply by exchanging canal turns or by purchasing full or partial turns of farmers having an excess of irrigation water.
Most of the time, farmers exchange canal water in partial turns. These partial turns are used to complement the irrigation of some fields when the allocated time is short of 15 to 30 minutes of irrigation to fulfill the field water requirements. This type of exchange is seen to be a daily irrigation practice in the area. The box below gives the results of farmer responses on this issue on the basis of distributaries.
37

0
Figure 111-1 1
Water Allocated versus Design Warabandi in 101 50-R (Disty. 3)
HOUIS Allocated I Design 31
...................... . . . . . . . . . . . . . . . . . . . . . . . . . . . . . . . . . . . . . . . . . . . . . . . . . . . . . . . . . . . . . . .
2 . . . . . . . . . . .
1.5 . . . . . . . . . . t I I I ' I 1
0.5
0 Head 1 2 3 4 5 6 7 8 9 10 11 12 13 14 1 5 16 17 18 Tail .
Farm Serial Number
I 0 10150-R - Target
Figure 111-1 2
Water Allocated versus Design Warabandi in 5767-L (Girsal Minor)
Hours Allocated I Design
. . . . . . . . . . . . . . . . . . . . . . . . . . . . . . . . . . . . . . . . . .
Head 1 2 3 4 5 6 7 8 9 10 11 12 13 14 16 16 17 18 19 20 Tail
Farm Serial Number
I I 0 5767-L - Target
37-A
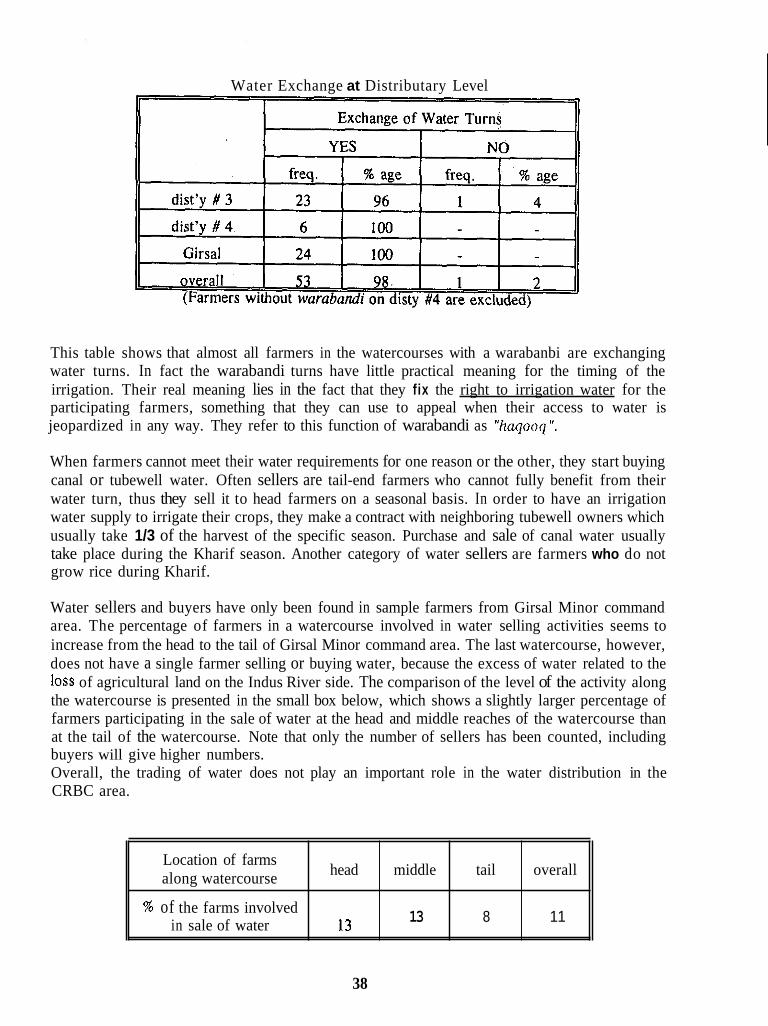
[I
Location of farms along watercourse
W of the farms involved in sale of water
[I
head middle tail overall
13 8 11 13
In
r! El
Water Exchange at Distributary Level
This table shows that almost all farmers in the watercourses with a warabanbi are exchanging water turns. In fact the warabandi turns have little practical meaning for the timing of the irrigation. Their real meaning lies in the fact that they fix the right to irrigation water for the participating farmers, something that they can use to appeal when their access to water is jeopardized in any way. They refer to this function of warabandi as ”kaqoooq”.
When farmers cannot meet their water requirements for one reason or the other, they start buying canal or tubewell water. Often sellers are tail-end farmers who cannot fully benefit from their water turn, thus they sell it to head farmers on a seasonal basis. In order to have an irrigation water supply to irrigate their crops, they make a contract with neighboring tubewell owners which usually take 1/3 of the harvest of the specific season. Purchase and sale of canal water usually take place during the Kharif season. Another category of water sellers are farmers who do not grow rice during Kharif.
Water sellers and buyers have only been found in sample farmers from Girsal Minor command area. The percentage of farmers in a watercourse involved in water selling activities seems to increase from the head to the tail of Girsal Minor command area. The last watercourse, however, does not have a single farmer selling or buying water, because the excess of water related to the loss of agricultural land on the Indus River side. The comparison of the level of the activity along the watercourse is presented in the small box below, which shows a slightly larger percentage of farmers participating in the sale of water at the head and middle reaches of the watercourse than at the tail of the watercourse. Note that only the number of sellers has been counted, including buyers will give higher numbers. Overall, the trading of water does not play an important role in the water distribution in the CRBC area.
0 38
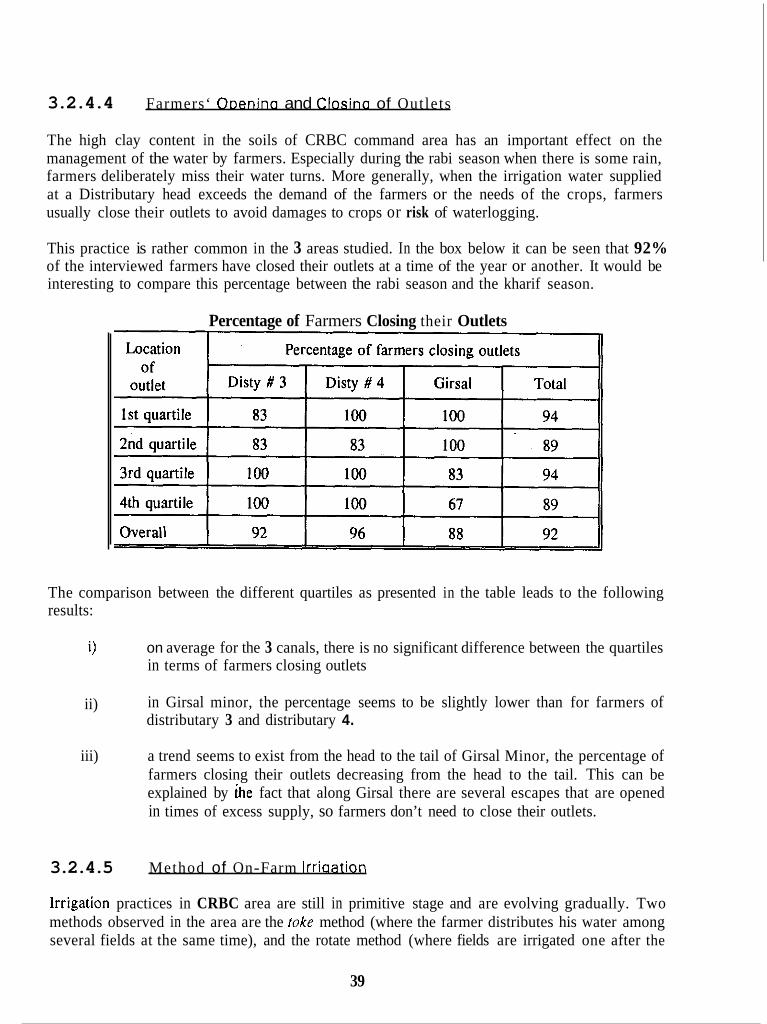
3.2.4.4
The high clay content in the soils of CRBC command area has an important effect on the management of the water by farmers. Especially during the rabi season when there is some rain, farmers deliberately miss their water turns. More generally, when the irrigation water supplied at a Distributary head exceeds the demand of the farmers or the needs of the crops, farmers usually close their outlets to avoid damages to crops or risk of waterlogging.
This practice is rather common in the 3 areas studied. In the box below it can be seen that 92% of the interviewed farmers have closed their outlets at a time of the year or another. It would be interesting to compare this percentage between the rabi season and the kharif season.
Farmers‘ ODenina and Closina of Outlets
Percentage of Farmers Closing their Outlets
The comparison between the different quartiles as presented in the table leads to the following results:
i) on average for the 3 canals, there is no significant difference between the quartiles in terms of farmers closing outlets
in Girsal minor, the percentage seems to be slightly lower than for farmers of distributary 3 and distributary 4.
a trend seems to exist from the head to the tail of Girsal Minor, the percentage of farmers closing their outlets decreasing from the head to the tail. This can be explained by h e fact that along Girsal there are several escapes that are opened in times of excess supply, so farmers don’t need to close their outlets.
ii)
iii)
3.2.4.5 Method of On-Farm lrriaation
Irrigation practices in CRBC area are still in primitive stage and are evolving gradually. Two methods observed in the area are the toke method (where the farmer distributes his water among several fields at the same time), and the rotate method (where fields are irrigated one after the
39
i I l i i

c 0 D [I
U c
other). The rokc method is more frequently used than the rotate method. The combined use of two methods have the highest prevalence. (In older canal systems of the Punjab only the rotate method is being used.)
The survey revealed that the main reason for using a combination of the two methods is the presence of sloping lands. Another reason (in disty #3 & #4 area) is that before the start of CRBC this area was categorized as rain-fed area with small holdings, due to which farmers are hesitant to make farm level ditches, leading to the adoption of haphazard on-farm irrigation methods for crop production.
3.2.4.6
Due to the high content of clay in the soils of CRBC command, the sloping nature of the soil and no use of recommended agricultural practices, fields are uneven. The majority of the farmers have always the problem of draining the extra water from their fields.
Different practices are currently used by farmers, including the drainage of the excess water to nearby (adjoining) fields and to drain the water to the watercourse itself when possible. Mostly farmers are draining out water to adjoining fields. The survey has also revealed that some farmers use receptacles such as tins to drain the excess water out of their fields (lifting it) instead of draining water by breaking field bunds.
3.2.4.7
Drainaae of t h e Excess Water
Preferential Allocation of Water to CroDs
Generally canal water supply in the area studied was reported to be adequate to meet the crops’ requirements. This meant that there was no need to prioritize among crops for the application of irrigation water. Despite this, the farmers were observed to have some preference for particular crops.
In Rabi season there are only two competing crops which require irrigation. The data revealed that 72 percent of the farmers prefer fodder over wheat. Gram is hardly irrigated at all and has a very low priority.
Four main crops are grown during the Kharif season. Farmers always give the first priority to Rice. Sugarcane comes second, fodder third, and maize forth. The interview results and field observations suggest that the farm size also has some influence on these preferences.
3.2.4.8 Watercourse Maintenance
In the Girsal minor, it is learnt that there is some involvement of officials from the Irrigation Department @urwuris), at least in one cleaning of watercourses which is done during canal closure.
In other areas in CRBC, usually the farmers take the initiative when they feel that the watercourse is full of grasses, that the bunds are in bad conditions with the presence of rat holes and that water flow is not normal. One farmer takes the initiative to inform the others about a specific day for cleaning, this person, however, being generally a big land owner or the chairman of the
40
n
Ll c D 0 c c 0 c
c I! G 0 c
defunct Water Users' Association, who has some influence in such activities. All farmers get together at the end-point of the lined portion of a watercourse on a specific day. A farmer is selected to lead the cleaning process and to supervise the whole activity including the basic responsibility of dividing the watercourse length among water users according to the size of their farm or the time of their water turns. Each participant stops over at his farm nakka. If anyone is absent during this cleaning process due to any reason, his share is leftor some farmers clean that and in lieu the absentee is asked to pay one day of labor. In some watercourse commands, the absentee farmers are not allowed to irrigate their fields but this happens very rarely.
In the case of Girsal minor, farmers reported the involvement of pamuris of Irrigation Department in the watercourse cleaning. According to farmers, during the canal closure, the pamari comes to see the big or influential farmers and fixes a day in consultation with them and ask them to inform all the water users. On the fixed date, he is usually present at the location of the cleaning. If farmers give names of absentees to the panvuri for necessary action, then those are forwarded to the zilludar who sometimes imposes fines on absentees. This aspect has to be checked further in subsequent field investigations.
3.2.5 Economics of Crop-Based Operat ions
3.2.5.1 Monitorina of Farmer's Pract ices
As announced in Progress Report # 1, the collection of farm level data has been enhanced during Kharif 1992. 48 farmers of distributary # 3 command area and 24 farmers of distributary # 4 command area have been monitored regularly by IlMI field staff.
Farming practices, inputs used and number of hours of irrigation have been collected for rice, sugarcane and fodder fields. At the end of the season, crop cuts have been made for rice sample fields, following the same method than the one used for wheat at the end of the previous season (See Progress Report # 1).
The entry of the yield data has been finalized. Average rice yields are presented in Figure 111-13a for selected watercourses of distributary # 3 , and in Figure 111-13b for those selected in distri- butary # 4. Rice yields vary from less than lo00 kg/ha (watercourse 570-L of distributary # 3) to more than 5000 kg/ha (watercourse 6468-R of distributary # 3). On average the rice yield was more than 3000 kglha. One has to keep in mind, however, that the method of measuring yields from small sample areas ( 3 times 1 m2 per field) always produces higher yield figures than the net yield obtained by the farmer. The farmers is facing losses during harvesting and threshing, and sometimes he even excludes the payments in grains he makes to laborers and artisans from his perceived yield. When we estimate these losses at 25%, the average net yield comes to about 2500 kg/ha. This still compares favorably with the 1992 average rice yield for NWFP of 1950 kg/ha and for Punjab of 1100 kg/ha. Good rice yields in the CRBC area can be contributed to the generous supply of water combined with a clay-rich soil.
It is interesting to note that the rice yields are much more variable from one farm to the other or from one watercourse to the other in distributary # 3 compared to distributary # 4. The in-depth analysis of these data will be undertaken during the next Rabi season.
c 41

I n ‘ I T I I
0 Figure Ill-13a
8 Watercourses. Disty 3, CRBC Average Rice Yields (crop-cut)
6ooo2
c .-__
Watercourse
c D
i
Figure Ill-13b
4 Watercourses, Disty # 4 CRBC Average Rice Yields (crop-cut)
KglHa
. . . . . . . . . . . . . . . . . . . . . . . . .
. . . . . . . . . . . .
. . . . . . . . .
. . . . . . . . . . . . .
16512-L Watercourse

l u I
-1
n
D 0 1 [i
c G il
The collection of data on farming practices and inputs is still under way and the data entry process has not started yet. '
The results of the analysis of data at a farm level have led to an internal IIMI research paper (Analysis offarming sysiems in ihe Crop-Based Irrigation Operarions project, NWFP, Pakistan) prepared by Anne Chohin and have been included in a paper titled "Peflormancr of CRBC: technical and economic indicators in the context of Crop-Based Irrigaiion Operaiions" prepared by Carlos Garces and Pierre Strosser and presented at the IIMI Internal Programme Review 1992 (Colombo, December 1992).
3.2.5.2
To understand the main constraints on agricultural production and to predict changes due to modifications in the supply of canal water, an in-depth analysis of farming systems was undertaken. Anne Chohin, student from Wye College (UK), worked with lIM1 staff for 4 months, using an approach developed by CEMAGREF (french research institute). This approach and the first results are explained below.
The farming systems have been analyzed in order to understand the decision making process of farmers. What are the choices of farmers and which are the constraints on agricultural production (irrigation water supply, labour, credit, etc) are two important questions to be addressed through this analysis.
The first step of the analysis covered the classification of farms, using interview data collected by the contractor during the first season of the project. The objective is to identify different types of farms corresponding to different production strategies (cropping patterns, farming practices, etc) with respect to farm resource endowment (land, water, labour, money) and existing constraints. Seven classes of farms, representing the main farming systems of the area, were defined in a population of 171 farms from 8 watercourses of distributary # 3. The characteristics of these farms are summarized below.
Farming svstem analysis and modellinq
Average cliaracteristics of farms for 7 classes - CRBC area
Water, purportedly an abundant resource in the area under stage I of CRBC limits in fact in many groups (2, 3 , 4, 5 and 6 ) the area of rice cultivated. Water is often a scarce resource in June-July
42
because of the high rice water requirements. However, the extent to which the rice cultivation is limited varies amongst groups, as indicated by the different maximum percentages of rice observed.
Sugarcane is limited more by labour and/or the money constraints than by the scarcity of irrigation water. Sugarcane cultivation is demanding in terms of labour, fertilizer inputs and consequently in money. Farmers facing money andlor labour constraint (group 4, 5 ) therefore do not include any sugarcane in the cropping patterns.
Very few farms have diversified cropping pattern (group 6 ) , cultivating, in addition to wheat, rice, gram and some oilseeds. The farmer personal awareness and information about the possibility of inter-cropping oilseed with sugarcane seems to be the reason for this cropping decision rather than particular farm resources and constraints.
Farms from group 0 and 3 do not appear to face problems of irrigatioa water supply, but reasons for this situation are different for the two groups. The former group represents farmers who migrate to hilly areas in summer, and therefore do not cultivate rice or cultivate very little of rice, leading to a low irrigation water demand. For farmers of group 3, water consists in an abundant resource, imputed for some farms to the availability of tubewell water.
Low cropping intensities are observed in group 1. The reasons for fallow land include water duty and soil problems. Water logging and salinity problems are reported by farmers of this group. Moreover, money shortages do not permit to reclaim saline fields which is then left fallow. The migration to hilly areas during the summer is another reason to leave land fallow. Contrarily to group 0, small areas of rice are cultivated with the help of hired labour (permanent labourers).
The availability of money is also determinant for the choice of the cultivation practices. Well endowed farms (group 2 and 3) correspond to mechanized cultivation practices for wheat crop, and in group 3, where money is even a more abundant resource and farms are larger, farmers have started to use combined harvesters for rice harvesting. On the contrary, farmers of Group 2 try to use draught power as much as possible to minimize their costs. They only hire tractors when the labour available does not allow them to complete their cropping activities on time.
The classification of farms has then been the starting point for the second step of the research, the in-depth analysis of farming systems in CRBC area. A representative farm from each group has been selected to be modelled via the use of a linear programming package to study farmer’s responses and changes in agricultural production which are likely to result from changes in the irrigation system.
The results of the modelling of a farm from group 2 are detailed below as an example. The model optimizes the total profit under the current farm constraints, given the inputs requirements for the cultivation. From the output of the model, the productivity of land obtained is about 12500 Rs/ha against a profit per unit of land of 8900 Rslha. Similarly the productivity of water and the profit per unit of water has been calculated, giving respectively the values of 1.3 Rs/m3 and 0.95 Rs/m3. Water appears to be a binding constraint in June-July, limiting the cultivation of rice. Labour, although a relatively abundant resource is also scarce at the harvesting period (end of April-early May for wheat, end of September-early October for rice) and also at the rice transplanting time (June). This labour problem has been overcome by employing hired labour.
43

The same modelling work will be undertaken for the other representative farms of each group during the Rabi 1992/93 season. Several scenarios will then be tested:
1. Changes of the level of water charges (increase by 30%, increase up to the current level of the sugarcane water charges (165 Rs/ha) or increase up to 300 Rslha)
Changes in the water supply pattern (Diminution of the water duty during the Kharif season by 20%, diminution of the water duty during the Rabi season by
2.
20 %)
3.2.5.3 Water c h a r a e s study
The Technical Assistance document signed in August 1991 highlights that
"Appropnate anennon will be grvcn to the magnrtude and nlechancsm of rrnganon service fee collechon. "
To address this important issue, IIMI prepared a workplan with two components:
1. Collection of primary data through farmers' interviews to assess the level of water charges currently paid by farmers in the area and to estimate the impact of changes in water charges on farming systems and agricultural production
Collection and analysis of secondary data mainly provided by the Irrigation Department and WAPDA.
2.
Collection of primary and secondary data has started at the end of the Kharif 1992 season and would continue during the Rabi 1992/93 season. Results of the analysis and discussion with agencies involved in the collection of water charges would take place during the year 1993.
3.3 Summarv of season activities
In LSC system, the main work has been focused on the collection of missing secondary data and interviews of key officials. A number of planning documents and official progress reports were reviewed, and extracts were prepared. On the basis of information gathered in this process, certain tentative conclusions were developed regarding the interactions between design teams and operating personnel, which were then shared with some key ID officials.
The various activities conducted in CRBC system during the Kharif 1992 season are summarized in the box on the next page. As it can be seen, the season has mainly been a follow-up of the field activities as reported in Progress Report # 1 to obtain a complete picture over a year of the operation of the CRBC irrigation system, the pattern in water supply at different levels (main canal, distributary and watercourse level) and its impact on farming practices and agricultural production.
The box also serves as a preview to the nature of activities that will be undertaken during the forthcoming season, that is Rabi 92/93. However, collaboration with the three agencies, WAPDA, ID and AD under the discussed management interventions will modify the data collection
44

programme somewhat for that season. For example, higher emphasis will be given to the operation of the main canal with more attention to be paid to the scheduling of offtakes’ gate openings; to the operation of distributary #3 and its monitoring; extending the simulation studies to the distributary level; assessing the potential for farmers’ organizations and farmers organized behavior, etc. Finally, regular monitoring of farming practices will be abandoned and replaced by a quick survey at the end of the season to collect agricultural inputs and outputs for sample watercourses in distributaries #3 and #4 and Girsal Minor.
, Component
SUMMARY OF SEASON ACTIVITIES
Field Activity
Canal monitoring
Farmers’ interviews
Flow measurements
Flow measurements
Maps, crop survey
Official’s interviews
Farmers’ interviews
Practices monitored
Farmers’ interviews
rainlevap.
Study Main Disty Syst
XXX XXX
xxx -
- xxx
- xxx
- -
xxx xxx
xxx
-
- -
xxx -
Irrigation System Operation
Supply & Demand of Irrigation Water
Irrigation Institutions
Economics of CBlO
Others
Simulation
Water management
Water supply
Water losses
Crop requirements
Role of agencies
Role of farmers
Farming practices (Kharif)
Agri. input/output
Meteorology ~
45
WIC Farm -
-
xxx
xxx
-
xxx
xxx
xxx
xxx
xxx
IV. PROJECT CONSTRAINTS
4.1 LSC S t u d v Activities
The delays in rehabilitation construction work continued as an impediment to the proposed study from its inception stage. In effect, the project is not complete yet, and where the incompletion is felt most is in the project's irrigation component and therefore has a direct bearing to the study.
The emphasis now being placed on the planning of the new project, Swabi SCARP in the upper Swat, tends to further reduce attention and interest on completing the remaining work of Mardan SCARP. The redeeming feature however, is that the operating agency (IPHED) has now taken over some of this work and is in a better position to accomplish the final items of work in line with their operational requirements, but whether they have the sufficient capacity to finish the work early is worrisome and is being anxiously observed.
Most components of the limited institutional study on design management interactions are complete. However, a critically important component of the study, an evaluation of the short-term effects of remodelling on operating the system had to await the completion of head works. While this construction item has only very recently been completed, a large number of outlets in Distributaries have yet to be installed. This may cause further delay in finalizing the study.
4.2 CRBC S t u d v Activities
Again, and as reported in last season's report, collaboration with the various government agencies related to the project was quite satisfactory. These were always amenable in providing secondary data andfor other information requested. As the project progresses the agencies are becoming more and more familiar with project activities and there is a better understanding on the needs for collaboration.
The above notwithstanding, the project has entered into a new phase where close interaction with IIMl by WAPDA, IPHED and AD is a must for project success. Although request were made to the agencies, since late September 92, for secondment of personnel to the project in order to assist in the implementation of the proposed management interventions, at the closing of this reporting period only the IPHED has actually done so. But the personnel assigned by the irrigation agency -- a sub-divisional officer (SDO) and a sub-engineer (SE) -- reported for work in late-december. WAPDA, on the other hand, who had announced the secondment of an engineer since late October, has yet to comply with the actual transfer of the person to D.I. Khan. As to action in this regard on the part of the Agricultural Department is yet to be finalized. The project recognizes however that the agencies are all facing a serious shortage of personnel, that coupled with a deficient budget and constraining recruitment policies makes coping with our needs a difficult task.
Another issue that has suffered for lack of speedy action on the part of collaborating agencies has been the establishment of the Project Coordination Committee. This body who will be instrumental in shaping further project activities is still awaiting nominations of members, although this issue was agreed as far back as August 92.
46
r L c c f c c L c [
t c C IT c c c c c
On the farmer side of the equation the difficulties of establishing regular contacts with them in the field continued. One particular characteristic of farmers in the area, observed from project inception, has been their irregular working pattern. This makes it difficult for field staff to keep a close watch on farmers cultural practices and in general on monitoring field activities. While no change in this regard can be expected by the project, it does pose an extra strain on project implementation.
The project budgetary constraints mentioned in progress report # 1 have been addressed jointly by the Bank and IIMI. A review and redistribution (at no added cost) of budget line items and contingency provision has helped ease some of the problems. Only international staff time allocations remain less than ideal. To cope with this issue, IIMI has taken advantage of other on- going projects and has increased the interventions of other international staff in project related activities.
A final constraint that has been emerging as the project progresses is related to the project's time span. With the introduction of management interventions in the third cropping season (Rabi 92/93) there will be less than a full year to evaluate and propose follow up actions. Again, since this is the way the project was originally conceived there will be very little room to modify this situation. However, this is mentioned here because it might jeopardize the realization of the project's potential impact on the future performance of CRBC.
V. CONCLUSIONS
5.1 LSC Study
The work done so far in the design management study in the LSC suggests that a considerable gap exists between the design stage intentions regarding system operations, and the realization of such intentions after the rehabilitation project has been completed. Three main reasons are discernible: i) lack of effective interaction between the design authorities and the operating agencies during the planning and design stages; ii) incompatibility between some design features such as gated outlets and easily adjustable cross regulators and the existing social and cultural background of the project area; and iii) lack of consideration given to the organizational capacity of the existing institutional framework in developing operational procedures.
The remodelling of the LSC has been presented as a modernization effort. In effect, only physical infrastructure has been enhanced in capacity allowing for a higher water allocation for peak requirements, and supplemented with modern tile drainage facilities in part of the command area. Little attention has been paid to the need to bring about a "modernizing" influence on the operational, institutional and social components of the LSC system.
.5.2 CRBC Study
The analysis of one year of activities in the CRBC has shown that farmers are managing their water in a crop-based mode, while the system at higher levels continues to operate under a
47

supply-sided mode. There is no direct relation between the operation at watercourse level and at higher levels of the system. At distributary and main canal level, the main objective of the two agencies (WAPDA and Irrigation Department) is to operate the system in a certain range of discharges to cope with issues related to the operation of the canal itself rather than the demand of irrigation water. This disruption in the objectives is clearly seen in the values of the performance indicators, both technical and economical, chosen to characterized a crop-based system: the higher the level the worse is the performance of the CRBC irrigation system as a whole.
The different groups (WAPDA Barrage, WAPDA CRBC, Irrigation Department and farmers) have different objectives and do not have a proper system to communicate among each other. The Irrigation Department especially finds itself in a strange position between WAPDA and the farmers without controlling the flows of water entering in the distributaries or in the watercourses. The analysis of the objectives of the operating agencies and their comparison with CBlO objectives will be a key component of IIMl's future research work in CRBC area. The constraints in terms of resources available (funds and staff), responsible for differences between current objectives and CBlO objectives will be evaluated and solutions to overcome them proposed. Future work will concentrate on better estimates of (attainable) operational targets at different levels of the irrigation system.
The present cropping pattern is clearly different from the one presumed during the design of the system. This means peak and minimum water requirements will be different from the design values and will occur at different times of the year. Thus, new crop demand should be calculated and fed back into operational plans, to be drafted for the main system before each season. However, such plans should be flexible to respond to rainfall, inaccuracies in cropping pattern data, farmers' practices such as pre-sowing irrigations, etc. We would argue that simply monitoring the number of outlets that are open (closed) at any one time would be an easy and cost-effective basis for the Irrigation Department to seek adjustments in the water delivery pattern higher up in the system. This would be the equivalent of the calculation of indents that is currently practiced, but with much less effort once the operating staff learned to "calibrate" farmers' response. Testing this method is part of the intervention on distributary 3 carried out during Rabi 92/93 (see next paragraph).
Even if quite static, WAPDA and the Irrigation Department have started to address some of the issues related to crop-based irrigation operation (for example, WAPDA plans to increase the bank level at locations where there would be a free-board problem for the highest discharges). Moreover they accepted the idea of collaboration with IIMI. In view of the project findings and their implications, three management "innovations" have been proposed by IlMl for implementation during the next rabi season and accepted by high officials of WAPDA, ID and AD. The first one will address issues of the operation of the main canal and involves WAPDA; the second one will focus on the water supplied to distributaries and will involve the Irrigation Department and WAPDA indirectly; the third one is related to the lack of communication between the different groups involved in the operation of the system, especially between the end-users, the farmers, and the operating agencies. With the help of the Agricultural and Extension Department, it will be tried to form associations of farmers and to involve them in the operation of the irrigation system, a pre-requisite for a successful crop-based irrigation operation especially if water becomes scarce. For these management interventions, a monitoring by WAPDA-ID-IIMI will take place, leading to the analysis of the performance of the system with the proposed operations.
48

I]
c [3
c L c c c [I
c c c L
It seems important at this stage of the project to start to discuss the expected water scarcity with farmers and staff from the operating agencies. This situation could be expected when Stage 11 and Stage 111 of CRBC become operational with the command area of Stage I fully developed. This aspect will have to be taken into account when doing the modelling of canals and when preparing operational plans with the agencies. For the operation of the water below the outlet, the actual flexibility seems to be sufficient and produces a good performance at this level. The situation with water scarcity, however, will be of prime importance at this level because important changes could be expected.
Further efforts have to be made to understand the irrigation system. The next steps in IIMl’s research, with primary data to be collected by IlMl field team, will have two important components. The first one will be the hydraulic modelling of the behavior of the distributaries (focus on distributary # 3), to identify problems of the operation at this level and to propose scenarios taking into account constraints of the distributaries. The second one will be the economic modelling of farms to predict impact of changes in the irrigation water supply and irrigation system operation on the agricultural production.
Farmers’ initiative to manage the available water on a crop-based mode, as mentioned above, seems to be greatly assisted by the abundance of water now being felt by them at this early stage of development of the CRBC system. Also, the absence of close agency staff involvement in watercourse level irrigation management at this stage, allowing the farmers to evolve their own distribution practices outside an official warabandi system, is another factor that tends to promote farmer’s independent behavior. Both factors appear to augur well for an effort to introduce a flexible management system, provided that agency staff and farmers can reach a consensus regarding the mode of management.
In any event, the present status of haphazard irrigation practices which can be observed in the field calls for a substantial effort in farmer training and irrigation extension services in the coming seasons during which a mutual understanding among agency staff and farmers regarding the type of management can also be achieved.
49

REFERENCES
Ait-kid, Mohammed. 1988. Major features of Moroccan large-scale irrigation projects. Irrigation management network. ODI-IIMI. London. Network paper 88/ld. June.
Bandaragoda, D.T. and C.Garces. 1992. Crop-based irrigation in Pukistan: Initial Efforts in the Nonh West Frontirr Province Irrigation Management Network. Overseas Developnient Institute. London. Network Paper # 18. October.
Brown, Copeland, Heiler and Co. 1987. Chashma Right Bank Irrigation Project (Stage I I ) Pakistan. Technical and Economic Feasibility Report. New Zealand.
Chohin, A. 1992. Analysis offanning systems in the crop-based irrigation operarions projrct in NWFP, Pakistan. Internal IIMI-PAK paper. Lahore. Pakistan.
Garces, C. and T. Bandaragoda. 1991. Inception report on the technical assistance study for crop- based irrigation operation in the NWFP. International Irrigation Management Institute. Lahore. Pakistan.
Garces, C., D.T. Bandaragoda and P. Strosser. 1992. Progress report # I on the technical assistance study for crop-based irrigation operations in the NWFP. International Irrigation Management Institute. Lahore. Pakistan.
Garces, C. and D.J. Bandaragoda. 1992. Modernized irrigation in Pakistan : the case of the Chashma Right Bank Canal irrigation system. Paper presented at the 3rd Pan-american K I D Regional Conference. Mazatlan. Mexico. Nov. 9 to 11.
Zaigham Habib, B.A. Shahid and M.N. Bhutta. 1992. The utiliry of a simulaiion model for Pakistan canal systems: Application examples from Nonhwest Frontier Province and Punjab. Paper presented at the workshop on the application of mathematical modelling for the improvement of canal operation. October 26-29 at Montpelier, France.
Harza-Nespak Consultants. 1981. Final Project Plan. SCARP Mardan. Mardan. Pakistan. June.
Strosser, P. and C. Garces. 1992. Performance of CRBC: Technical and economical indicators in the context of crop-based irrigation operarions. Paper presented at Internal Program Review. IIMI. Colombo. Sri Lanka. December.
Water and Power Development Authority. 1977. Project Planning Report of Mardan Saliniry Control and Reclamation Project - Phase one. Mardan. Pakistan. December.
Water and Power Development Authority. 1981. Chashma Right Bank Irrigation Project. PC-I P r o f o m (Revised). Lahore. Pakistan.
World Bank. 1979. Staff Appraisal Report, Saliniry Control and Reclamation Project (SCARP). Mardan. Pakistan.
50

I I c
TABLES
51

TABLE - I
CROPWATER REQUIREMENTS FOR DISTY # 3 , CRBC (Kharif Crops) (mdperiod)
52
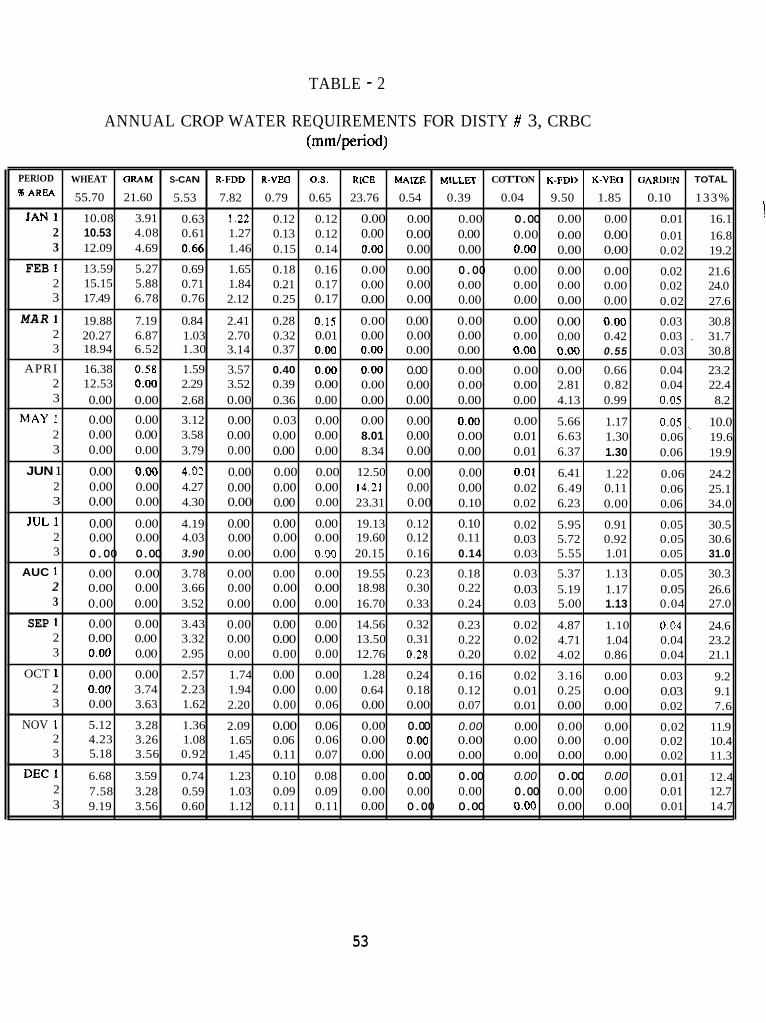
TABLE - 2
PERIOD
% A R M
J A N 1 2 3
FEB 1 2 3
MAR 1 2 3
APRI 2 3
MAY1 2 3
JUN 1 2 3
J U L I 2 3
AUC 1 2 3
SEP 1 2 3
OCT 1 2 3
NOV 1 2 3
D E C I 2 3
ANNUAL CROP WATER REQUIREMENTS FOR DISTY # 3, CRBC (mm/period)
WHEAT arum S-CAN R-I’DD R-vEa 0,s. RICE MAIZE M u e T COTTON K-PDI) K-vea a A m i ” TOTAL
55.70 21.60 5.53 7.82 0.79 0.65 23.76 0.54 0.39 0.04 9.50 1.85 0.10 133%
10.08 3.91 0.63 ‘1.22 0.12 0.12 0.00 0.00 0.00 0.00 0.00 0.00 0.01 16.1 10.53 4.08 0.61 1.27 0.13 0.12 0.00 0.00 0.00 0.00 0.00 0.00 0.01 16.8 12.09 4.69 0.66 1.46 0.15 0.14 0.00 0.00 0.00 0.00 0.00 0.00 0.02 19.2 13.59 5.27 0.69 1.65 0.18 0.16 0.00 0.00 0.00 0.00 0.00 0.00 0.02 21.6 15.15 5.88 0.71 1.84 0.21 0.17 0.00 0.00 0.00 0.00 0.00 0.00 0.02 24.0 17.49 6.78 0.76 2.12 0.25 0.17 0.00 0.00 0.00 0.00 0.00 0.00 0.02 27.6
19.88 7.19 0.84 2.41 0.28 0.15 0.00 0.00 0.00 0.00 0.00 0.00 0.03 30.8 20.27 6.87 1.03 2.70 0.32 0.01 0.00 0.00 0.00 0.00 0.00 0.42 0.03 . 31.7
0.00 0.00 0.55 0.03 30.8 18.94 6.52 1.30 3.14 0.37 0.00 0.00 0.00 0.00
16.38 0.58 1.59 3.57 0.40 0.00 0.00 0.00 0.00 0.00 0.00 0.66 0.04 23.2 12.53 0.00 2.29 3.52 0.39 0.00 0.00 0.00 0.00 0.00 2.81 0.82 0.04 22.4 0.00 0.00 2.68 0.00 0.36 0.00 0.00 0.00 0.00 0.00 4.13 0.99 0.05 8.2
0.00 0.00 3.12 0.00 0.03 0.00 0.00 0.00 0.00 0.00 5.66 1.17 0 .05, . 10.0 0.00 0.00 3.58 0.00 0.00 0.00 8.01 0.00 0.00 0.01 6.63 1.30 0.06 19.6 0.00 0.00 3.79 0.00 0.00 0.00 8.34 0.00 0.00 0.01 6.37 1.30 0.06 19.9
0.00 0.00 4.02 0.00 0.00 0.00 12.50 0.00 0.00 0.01 6.41 1.22 0.06 24.2 0.00 0.00 4.27 0.00 0.00 0.00 14.21 0.00 0.00 0.02 6.49 0.11 0.06 25.1 0.00 0.00 4.30 0.00 0.00 0.00 23.31 0.00 0.10 0.02 6.23 0.00 0.06 34.0
0.02 5.95 0.91 0.05 30.5 0.00 0.00 4.19 0.00 0.00 0.00 19.13 0.12 0.10 0.03 5.72 0.92 0.05 30.6 0.00 0.00 4.03 0.00 0.00 0.00 19.60 0.12 0.11
0.05 31.0 0.00 0.00 3.90 0.00 0.00 0.00 20.15 0.16 0.14 0.03 5.55 1.01
0.00 0.00 3.78 0.00 0.00 0.00 19.55 0.23 0.18 0.03 5.37 1.13 0.05 30.3 0.03 5.19 1.17 0.05 26.6 0.00 0.00 3.66 0.00 0.00 0.00 18.98 0.30 0.22
0.00 0.00 3.52 0.00 0.00 0.00 16.70 0.33 0.24 0.03 5.00 1.13 0.04 27.0
0.04 24.6 0.00 0.00 3.43 0.00 0.00 0.00 14.56 0.32 0.23 0.02 4.87 1.10 0.00 0.00 3.32 0.00 0.00 0.00 13.50 0.31 0.22 0.02 4.71 1.04 0.04 23.2 0.00 0.00 2.95 0.00 0.00 0.00 12.76 0.28 0.20 0.02 4.02 0.86 0.04 21.1
0.00 0.00 2.57 1.74 0.00 0.00 1.28 0.24 0.16 0.02 3.16 0.00 0.03 9.2 0.00 3.74 2.23 1.94 0.00 0.00 0.64 0.18 0.12 0.01 0.25 0.00 0.03 9.1 0.00 3.63 1.62 2.20 0.00 0.06 0.00 0.00 0.07 0.01 0.00 0.00 0.02 7.6 5.12 3.28 1.36 2.09 0.00 0.06 0.00 0.00 0.00 0.00 0.00 0.00 0.02 11.9 4.23 3.26 1.08 1.65 0.06 0.06 0.00 0.00 0.00 0.00 0.00 0.00 0.02 10.4 5.18 3.56 0.92 1.45 0.11 0.07 0.00 0.00 0.00 0.00 0.00 0.00 0.02 11.3
0.01 12.4 7.58 3.28 0.59 1.03 0.09 0.09 0.00 0.00 0.00 0.00 0.00 0.00 0.01 12.7 9.19 3.56 0.60 1.12 0.11 0.11 0.00 0.00 0.00 0.00 0.00 0.00 0.01 14.7
6.68 3.59 0.74 1.23 0.10 0.08 0.00 0.00 0.00 0.00 0.00 0.00
53

n P
APRIL MAY JUNE JULY AUGUST SEPTEMBER OCTOBER Item
Period = 10 days 3
0
0.0
3.6
41.3
21.1
0.0
0
0.2
Water flown (days) - 7 1 2
4 9
25.9 57.2
2.4 1.3
49.5 47.7
9.2 9.1
5.2 11.4
6 13.5
1.4 1.7
Flow mrniperiod -
I - Rainfall mm/period
Area Cultivated - (Ha)
ETcrnmiperiod -
Conveyance Losses - (20%) mrniperiod
Percolation losses - (1.5 mmiday)
I RWS

c FLOWN MMjPERIOD MMlPWOD CULTIVATED MMlPERlOD LOSSES (20%) DAYS HA MMlPERlOD
OCT 1 - -
. ._
2 3
NOV I 2 3 c
. . 9.7 3 I 1 68.9 2.7 74.6 14.7 13.4
9 68.6 1.3 47.7 9.1 13.7 I I 76.5 1.0 44.8 7.6 15.3
8 57.3 0.8 43.0 11.9 11.5 9 55.8 0.6 63.4 10.4 11.2 4 24.2 1.3 74.6 11.3 4.8
1 IAN
13.5 15 15
L 2 I MAR
3
1.5 1.6 1.3
JUL 1 2
OCT 1 2 3
SEP 1 2
4 25.9 2.4 49.5 9.2 5.2 9 57.2 1.3 47.7 9.1 11.4
-
2 5 0
0 0 1
LO 10 7
0 3 7
9 10 9
10 10 10
10 6 5
9 10 10
7 1
0.0 4.8 0.9
71.0 1 7.8
40.6
51.9 5.0
43.0 3.4 67.9 2.8 88.6 7.3
4yj 58.3
74.6 16.1 1.8 74.6 16.6 5.6 74.6 19.2 0.0
74.6 21.6 0.0 74.6 24.0 0.0 74.6 27.6 0.2
74.5 30.8 14.2 74.6 31.7 14.3 74.8 30.8 6.1
76. I 23.2 0.0 67.3 22.4 2.9 43.2 8.2 8.2
7.4 10.0 ' 10.4 7.4 19.6 13.1 7.4 19.9 11.1
7.4 24.2 8.6 7.8 25.1 13.6 7.8 34.0 17.7
23.4 30.5 17.8 37.4 30.6 9.8 47.4 31.0 8.6
47.4 30.3 13.6 47.4 29.6 17.2 . . .~
47.4 27.0 11.7
47.4 1 24.6 I 11.9 47.4 23.2 1.0
0 0.0 3.6 47.3 21.1 0.0 I I
F 1992) = 57.7%
LOSSES (1.5 MMIDAY)
13.5 1.6 1.2
1.4 12 1.5
16.5 1.6
15 I ;:; I 71 7.5 1.3
1;l 13.5

f c II c c El
c [3
c c c r L.
I c II L f_
L [3
TABLE - 5 SEASONAL OPENlCLOSE RECORD
WATERCOURSE 11920-L DISTY # 3; KHARIF 1992
MONITORED
56

TABLE - 6
SEASONAL OPENKLOSE RECORD FOR RABI AND KHARIF 91/92 WATERCOURSE 11920-L OF DISTY # 3
KHARIF 1992
% CLOSED
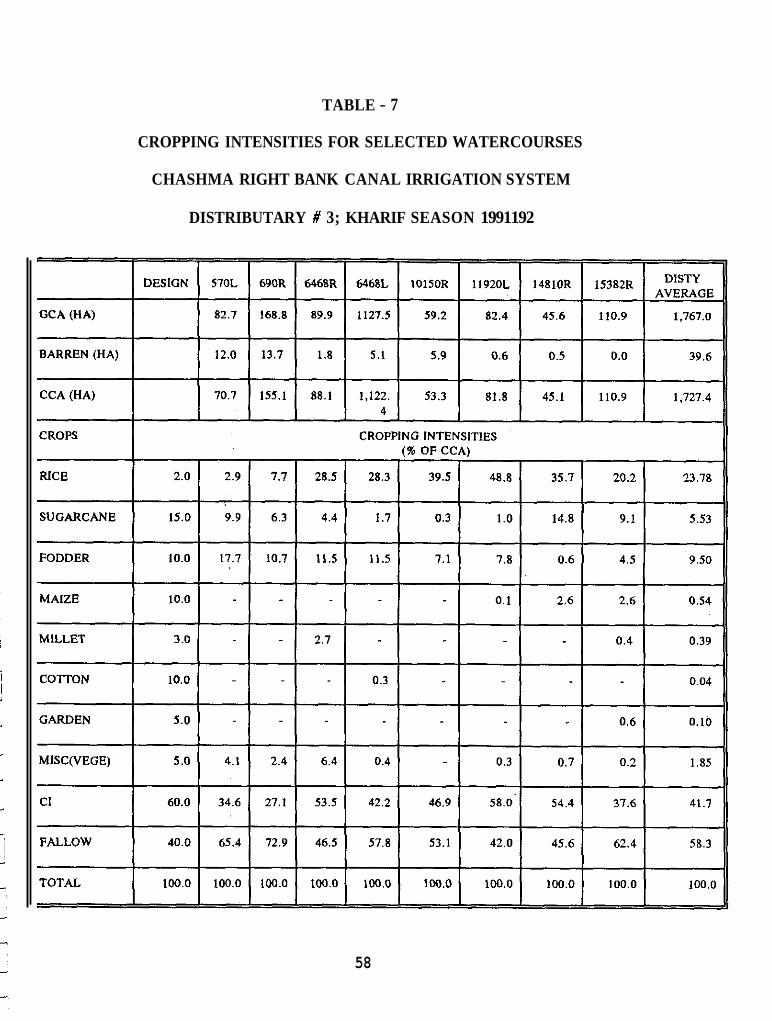
TABLE - 7
CROPPING INTENSITIES FOR SELECTED WATERCOURSES
CHASHMA RIGHT BANK CANAL IRRIGATION SYSTEM
DISTRIBUTARY # 3; KHARIF SEASON 1991192
58

e c
ANNEXES
59
c 0
c
II! r; c L c c
II c @ I,
I;,
IlMl PERSONNEL INVOLVEMENT
A. International Staff
1. Carlos Garces, lrrigation Engineer and Project Team Leader 2. Tissa Bandaragoda, Senior Management Specialist 3. Pierre Strosser, Agricultural Economist 4. Erik Van Waijjen, Agricultural Engineer
B. National staff
(fielded at D.I.Khan)
5 . Hakim Khan, Field Research Professional 6. M. Rafiq Khan, Senior Field Assistant 7. Talha Awam, Field Assistant 8. Abdul Maroof, Field Assistant 9. Sharif Ahmad, Field Assistant 10. Nadir Khan, Field Assistant 11. Ghulam Mustafa, Field Assistant 12. Mohammad Iqbal, Driver
(based in Lahore)
13. Rana M. Afaq, lrrigation Engineer 14. Zhaigham Habib, Systems Analyst 15. Saeed Ur Rahman, Agricultural Economist 16. Muhammad Akram Khan, Secretary/Data Entry
(special support)
17. M. Badruddin, IIMI-Pak Associate
Annex - 1
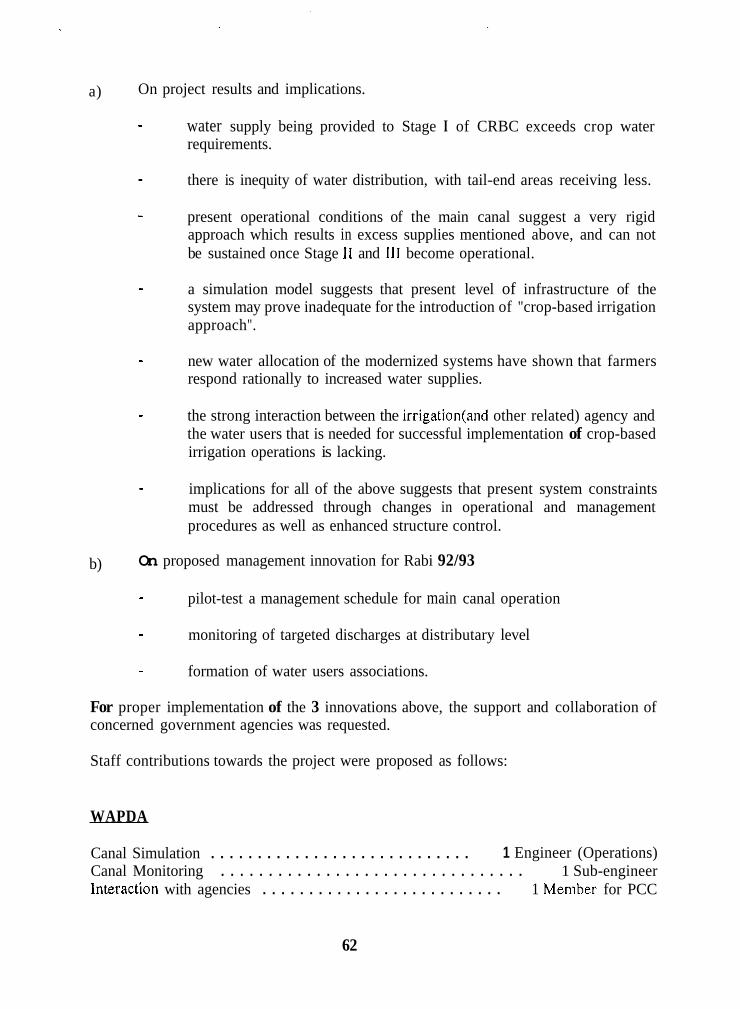
c
[I
c
a) On project results and implications.
- water supply being provided to Stage I of CRBC exceeds crop water
there is inequity of water distribution, with tail-end areas receiving less.
present operational conditions of the main canal suggest a very rigid
requirements.
-
- approach which results in excess supplies mentioned above, and can not be sustained once Stage 11 and 111 become operational.
- a simulation model suggests that present level of infrastructure of the system may prove inadequate for the introduction of "crop-based irrigation approach".
- new water allocation of the modernized systems have shown that farmers
the strong interaction between the irrigation(and other related) agency and
respond rationally to increased water supplies.
- the water users that is needed for successful implementation of crop-based irrigation operations is lacking.
- implications for all of the above suggests that present system constraints must be addressed through changes in operational and management procedures as well as enhanced structure control.
b) On proposed management innovation for Rabi 92/93
- pilot-test a management schedule for main canal operation
monitoring of targeted discharges at distributary level -
- formation of water users associations.
For proper implementation of the 3 innovations above, the support and collaboration of concerned government agencies was requested.
Staff contributions towards the project were proposed as follows:
WAPDA
Canal Simulation . . . . . . . . . . . . . . . . . . . . . . . . . . . . 1 Engineer (Operations) Canal Monitoring . . . . . . . . . . . . . . . . . . . . . . . . . . . . . . . . 1 Sub-engineer lnteraction with agencies . . . . . . . . . . . . . . . . . . . . . . . . . . 1 Member for PCC
62
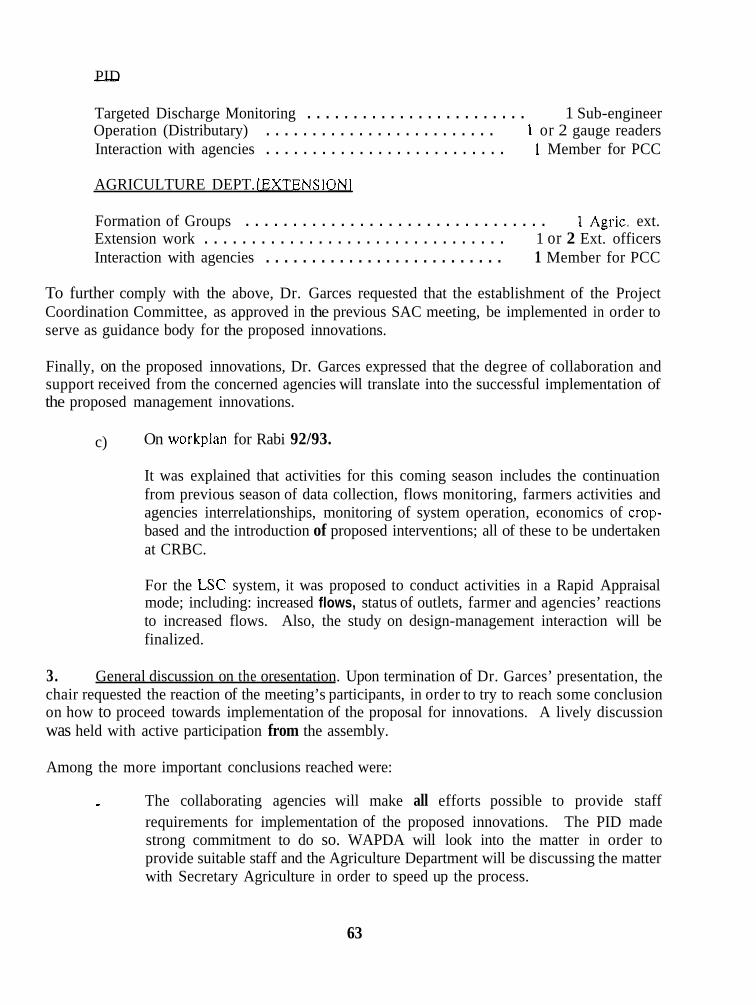
- PID
Targeted Discharge Monitoring . . . . . . . . . . . . . . . . . . . . . . . . 1 Sub-engineer Operation (Distributary) . . . . . . . . . . . . . . . . . . . . . . . . . 1 or 2 gauge readers Interaction with agencies . . . . . . . . . . . . . . . . . . . . . . . . . . 1 Member for PCC
AGRICULTURE DEPT. rEXTENSlONl
Formation of Groups . . . . . . . . . . . . . . . . . . . . . . . . . . . . . . . . 1 Agric. ext. Extension work . . . . . . . . . . . . . . . . . . . . . . . . . . . . . . . . 1 or 2 Ext. officers Interaction with agencies . . . . . . . . . . . . . . . . . . . . . . . . . . 1 Member for PCC
To further comply with the above, Dr. Garces requested that the establishment of the Project Coordination Committee, as approved in the previous SAC meeting, be implemented in order to serve as guidance body for the proposed innovations.
Finally, on the proposed innovations, Dr. Garces expressed that the degree of collaboration and support received from the concerned agencies will translate into the successful implementation of the proposed management innovations.
c) On workplan for Rabi 92/93.
It was explained that activities for this coming season includes the continuation from previous season of data collection, flows monitoring, farmers activities and agencies interrelationships, monitoring of system operation, economics of crop- based and the introduction of proposed interventions; all of these to be undertaken at CRBC.
For the LSC system, it was proposed to conduct activities in a Rapid Appraisal mode; including: increased flows, status of outlets, farmer and agencies’ reactions to increased flows. Also, the study on design-management interaction will be finalized.
3. General discussion on the oresentation. Upon termination of Dr. Garces’ presentation, the chair requested the reaction of the meeting’s participants, in order to try to reach some conclusion on how to proceed towards implementation of the proposal for innovations. A lively discussion was held with active participation from the assembly.
Among the more important conclusions reached were:
- The collaborating agencies will make all efforts possible to provide staff requirements for implementation of the proposed innovations. The PID made strong commitment to do so. WAPDA will look into the matter in order to provide suitable staff and the Agriculture Department will be discussing the matter with Secretary Agriculture in order to speed up the process.
63
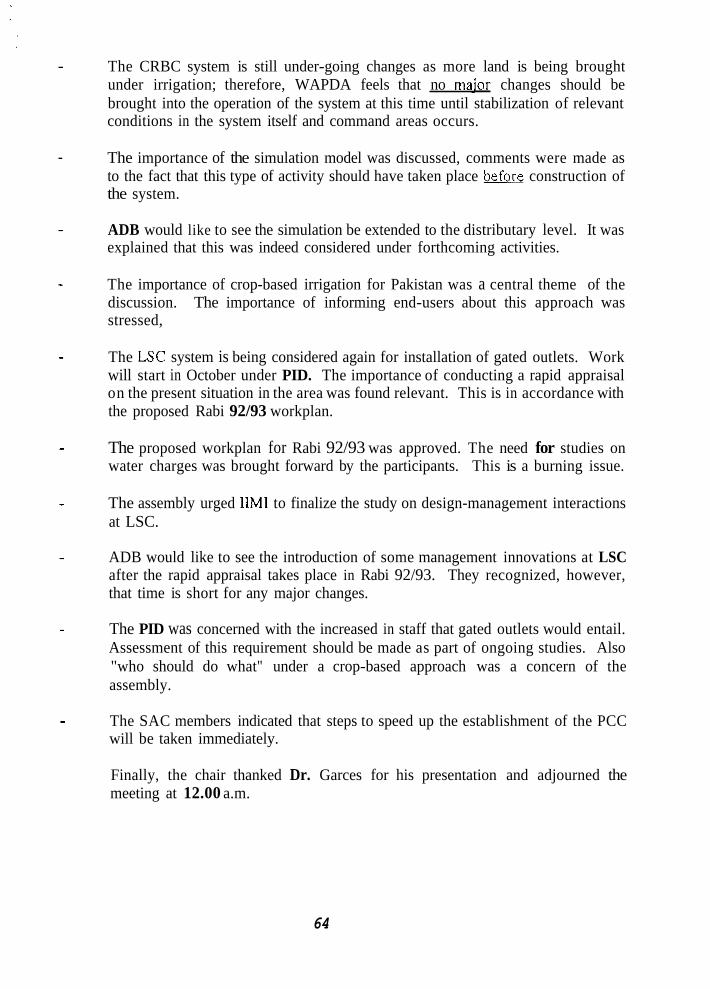
The CRBC system is still under-going changes as more land is being brought under irrigation; therefore, WAPDA feels that no ma-ior changes should be brought into the operation of the system at this time until stabilization of relevant conditions in the system itself and command areas occurs.
The importance of the simulation model was discussed, comments were made as to the fact that this type of activity should have taken place before construction of the system.
ADB would like to see the simulation be extended to the distributary level. It was explained that this was indeed considered under forthcoming activities.
The importance of crop-based irrigation for Pakistan was a central theme of the discussion. The importance of informing end-users about this approach was stressed,
The LSC system is being considered again for installation of gated outlets. Work will start in October under PID. The importance of conducting a rapid appraisal on the present situation in the area was found relevant. This is in accordance with the proposed Rabi 92/93 workplan.
The proposed workplan for Rabi 92/93 was approved. The need for studies on water charges was brought forward by the participants. This is a burning issue.
The assembly urged l lMl to finalize the study on design-management interactions at LSC.
ADB would like to see the introduction of some management innovations at LSC after the rapid appraisal takes place in Rabi 92/93. They recognized, however, that time is short for any major changes.
The PID was concerned with the increased in staff that gated outlets would entail. Assessment of this requirement should be made as part of ongoing studies. Also "who should do what" under a crop-based approach was a concern of the assembly.
The SAC members indicated that steps to speed up the establishment of the PCC will be taken immediately.
Finally, the chair thanked Dr. Garces for his presentation and adjourned the meeting at 12.00 a.m.
64
c:
c c c
c
c
CROP-BASED IRRIGATION OPERATIONS IN NWFP
SUGGESTED MANAGEMENT INTERVENTIONS FOR IMPLEMENTATION IN FORTHCOMING SEASONS
BACKGROUND
ANNEX-3
The crop-based irrigation operations project (CBIOP) has completed one year of activities of its intended three. As per project documents, IIMl as the implementing agency was to suggest (based on study results of two cropping season) to the collaborating agencies, i.e. WAPDA, PID and Agriculture Department, management interventions aimed to improve the overall productivity of water in the project areas.
While monitoring of the second season (i.e. Kharif 92) is not yet over, project results have already provided some guidelines that allow IIMI to propose a set of interventions - both technical and institutional - that would allow the project to begin fulfillment of its intended objectives.
While, originally, the project was to be conducted at two modernized irrigation systems: Chashma Right Bank Canal (CRBC) and Lower Swat Canal (LSC), activities in the latter had to be curtailed significantly due to delays in the construction andlor remodelling of basic infrastructure. As a consequence, findings to be addressed hereunder refer mainly to the CRBC project area.
In the following paragraphs, the project leadership reviews some of the results obtained and their implications, and presents and justifies the proposed management innovations. Likewise, the mechanism for implementation, including the cooperation expected from collaborating agencies, are given.
FINDINGS AND IMPLICATIONS OF PROJECT SO FAR
A detailed account of project findings corresponding to work undertaken during the Rabi 1991/92 season are contained in Progress Report # 1 of June 20, 1992. A similar report, Progress Report # 2 corresponding to activities carried out during Kharif 1992 is currently under preparation as the cropping season is still on-going.
The above notwithstanding, significant findings and their implication are summarized below:
65
L
I

1.
2.
3.
4.
Project monitoring activities clearly indicate that the water supply being provided to stage I of CRBC exceeds crop water requirements, and that there is considerable inequity in the distribution of water, despite the excess, with those areas at the tails of the command receiving less.
The excess water supply is creating a sense of abundance of the resource among end- users. This is not the case as can be ascertained by those located at tail reaches of watercourses and/or distributaries. Furthermore, as more area is brought under irrigation, the system will necessarily have to reduce water supplies in Stage I creating conflict with end-users already accustomed to over-deliveries.
A computer model to simulate the actual hydraulic and operational conditions of the main canal has been successfully applied to the CRBC system. Results indicate that the present operation of the main canal is very rigid; it is based on maintaining water supply levels at fixed elevations through frequent manipulation of cross-regulators, escapes and off- takes' gates. This approach results in the excess supplies above mentioned; and can not be sustained once stage I1 and 111 become fully operational. Thus, the implication that a more flexible approach in the operation of the canal is needed.
The simulation model also brings forward that the present level of infrastructure of the system may prove inadequate for the introduction of a crop-based irrigation approach. At the lower end of crop water requirements, low supplies in the main canal can not fully attain the hydraulic conditions needed to satisfy all off-takes demands of stage I and much less those in forthcoming stages I1 and 111. The implications of the above suggest that present system design constraints must be addressed through changes in operational and management procedures or enhanced structure control, or both.
The new water allocations of the modernized systems have shown that farmers respond rationally to increased water supplies. This has been corroborated at CRBC through monitoring of the opening and closure of outlets by means of the control boxes on the downstream side. In fact, farmers try to adjust existing supplies to their demands which has led them to modify their traditionally wurubundi-based water distribution method. However, the strong interaction between the irrigation (and other related) agency and the water users that is needed for successful implementation of crop-based irrigation operations is lacking.
The above implies that a concerted effort to establish and strengthen this relationship is a necessary, although not sufficient, condition for achieving the objectives pursued under the modernized systems.
66

PROPOSED INNOVATIONS
In view of the project’s finding and their implications presented in the previous section, three management innovations are proposed below. The mechanisms for implementation and the expected collaboration from each government agency concerned are presented thereafter. Also, pre-conditions for successful implementation of the innovations are highlighted in the text.
1) ManaPement schedule for main canal ooeration: The purpose of this intervention is to pilot-test a designed management schedule for more appropriate operation of stage I through real time calculations of hydraulic parameters. Based on crop-water requirements obtained from last Rabi 91/92 season, the water demand, on 10-day basis, for distributaries 1,2,3 and 4 of stage I of CRBC can be appraised. With this knowledge, IIMI will prepare in collaboration with the concerned agency, a management schedule for main canal operation to be tested during the forthcoming rabi 92/93 season. The plan would provide gate settings for cross-regulators, escapes and off-take structures as well as water supply levels at selected points in order to supply water more in accordance to crop requirements. Thus, the concept of crop-based irrigation would be introduced, on an experimental basis, to the CRBC irrigation system.
At present, gates are being moved frequently, sometimes 3 and 4 times during the day in order to keep WSL at maximum elevation (even above design levels at the tail reach of stage I). This procedure gives very little control to the operating agency to determine the actual flows at different off-takes since varying velocities would cause varying flows despite equal water levels in the main canal.
The management schedule for the Rabi 92/93 season could require seasonal adjustment if actual rainfall and cropping pattern were to deviate considerably from our initial assumptions. The 30- year averages for the former, and the past rabi season for the latter will be taken as starting points of the intervention. As the process is developed and tested, it is foreseen that in the near future actual field conditions would be the inputs in the schedule. It is also felt that through the proposed management schedule a more rational use of scarce human resources can be accomplished, by eventually reducing the number and frequency of direct field measurement for canal monitoring purposes.
The innovation is directed towards WAPDA in its capacity of main canal operation agency.
2) Monitoring of tareeted discharges at distributarv level: This management innovation follows from number 1 above. The purpose of this intervention is two fold: i) to pilot-test the operability of the distributaries under targeted discharges conditions, and ii) to upgrade the response of the PID to farmers’ needs.
One distributary of stage I (i.e. distributary # 3) will be selected in order to monitor its targeted deliveries. By daily monitoring of the number of outlets opened (or closed) as well as the tail gauges (tail proper and off-taking minor) of the distributary, feedback will be provided upstream for adjustments of deliveries. A high number of closed outlets would signal the need for a supply reduction at the off-take level. On the other hand, continuous opening of outlets coupled with proper information to be gathered by irrigation personnel as provided by end-users, would show
67

demand requirements needing adjustment.
While opening and closure of outlets, through control boxes on the downstream side, is already in the hands of farmers, strict control over water levels at critical points, by means of existing drop structures within the distributary, would remain with the irrigation agency to ensure reliability of water distribution.
This innovation entails a bottom-up "management approach as opposed to the traditional "top- down" represented by the supply-based irrigation operations of the country. In essence, the farmer is given more control over outlet operation in exchange for less interference with distributary canal management.
The innovation is directed towards the provincial Irrigation Department in its capacity of operating agency at the distributary level.
Because this particular intervention entails close linkage between the PID and the end-users which, as was pointed out earlier, is not readily available a third management innovation is proposed in order to fill the gap.
3. Formation of Water Users Associations: The establishment of these farmers groups will serve the purpose of increasing their organized behavior and will provide a mechanism to enhance their awareness in crop-based irrigation operation matters.
There is evidence of previous attempts by the On Farm Water Management staff in forming WUAs while the watercourse development program was under way in CRBC Stage 1, but the WUAs as such no longer operate in the area.
Our intention at this stage is to try and re-establish these old WUA-type of organization or forming new ones using group training and learning processes as a motivator.
A key activity to be undertaken by the groups is to establish greater contact with irrigation and other related agencies in order to provide feedback on water conditions at Field level.
Our research has shown that farmer awareness of, and access to, new high yielding seed varieties are two aspects that can and should be improved. Focus of attention of the WUAs can be directed to this particular area so that early impact of a new WUA can be achieved. Watercourse maintenance, pre-seasonal planning of crops, input management, obtaining credit and marketing of the produce are objectives to be considered in the long-run for these proposed groupings.
A strong and sustainable farmer organization is a pre-requisite for a successful crop-based irrigation operation. Its real value will be seen when somewhat unpopular decisions have to be taken regarding water delivery, and when the farmers need to convince themselves as a group of the trade-offs involved in such decisions.
68

This intervention is geared towards the Agricultural andlor Extension Department the agency with greater interactions with the farmer community.
MECHANISMS FOR IMPLEMENTATION
Because each of the proposed interventions falls within the domain of a different government agency, the mechanisms for implementation and the cooperation expected from those agencies will be treated separately.
1. WAPDA’s role. A clear advantage of simulation models is that it helps managers to evaluate and study many operational options before they are finally implemented. For the preparation of a management schedule for main canal operation, close interaction with WAPDA’s CRBC operational staff will be needed.
A professional staff designated by WAPDA will work with IIMI staff to become familiar with the simulation model, and to prepare the management schedule before the start of the rabi 92/93 season. Work is expected to take place in both Lahore and D.I. Khan.
In addition to the above effort, CRBC’s operational staff needs to work hand in hand with IIMl’s field team in order to measure relevant hydraulic parameters and to feedback canal conditions for further refinement of the intervention.
While it can be expected that the amount of actual field measurements will be reduced as result of the implementation of the model, extensive monitoring of the main canal will be needed in the early phase of the proposed program. Measurement of gate openings, water supply levels, structure’s physical conditions and obtaining other related information will be part of these efforts.
A crucial condition that should be met before implementation of this proposed intervention is a decision on whether there is to be or not flow variations within the main canal. If this is not done, the results of the proposed pilot-testing itself can shed more light into this matter and assist in taking a final decision.
2) PID’s role. Close interaction among PID and IlMI field staff will be needed in order to carry on successfully the activities related to the monitoring of targeted discharges at a selected distributary. Previous work undertaken by the project, on which the PID has been marginally involved, will be the basis of the field measurements and observation program.
A number of critical points andlor structures within the distributary as well as for 8 selected outlets have been calibrated. Discharges will be closely monitored and opening and closure status of outlets will be determined daily. This information will be fed back to WAPDA so that applicable adjustments can be made in the management schedule of the main canal. This presupposes that a WAPDA-PID linkage will also be in place, something .that until now has been done rather loosely.
The PID needs to assign, before the rabi season starts, one sub-engineer to the CBlOP on full time basis in a field coordinator role. In addition to the above, PID gauge readers, one or two
69

depending on availability, would need to be retrained by IIMl’s field staff in order to support the proposed management innovation. Finally, the present level of interaction PID-IIMI at XEN level should remain the same, if not enhanced.
3) Aericultural [Extension1 Deoartment’s role. While the previous two proposed interventions address technical aspects of crop-based irrigation operations in Pakistan, the third one deals with .institutional issues.
Because llMI has relatively low comparative advantage in the establishment of water user’s associations it is expected that the lion’s share of this activity would fall under the purview of the agricultural extension department. However, llMI staff can provide guidelines and share experiences obtained through work in other countries.
It is proposed that initial efforts be directed towards the establishment of WUAs in one or two selected water courses of distributary # 3 and that these can play a role model for further expansion of the groupings throughout stage I of CRBC. The newly created WUA would provide the required linkage between the targeted discharges activity and the needs of water users.
It is also recommended that in order to concentrate efforts and avoid wastage of scarce human and physical resources, the present dispersed activities of the Agricultural Extension Department be directed towards this effort. A positive impact obtained in the formation of WUA would help the Agriculture Extension personnel to make a case for further expansion of their involvement in CRBC. The soon to be established project coordination committees will provide guidance and coordinating force for the establishment of the WUAs units.
CAVEAT
A number of conditions to be met by collaborating agencies, in order to bring forward successfully the proposed interventions, have been intimated in previous pages. These include, among others, the secondment of agencies’ staff to the CBlO Project, decisions to be taken related to main canal operation and the integration of agencies’ activities around the project. In the manner in which these conditions are met will rest the feasibility of the implementation effort of the proposed management innovations.

cl
c c
c
ANNEX - 4
Table AN # 4-1
Climatic Data for D.I. Khan (Period 1961-1991)
Altitude 174 masl. Latitude 31.8" N
f c
c
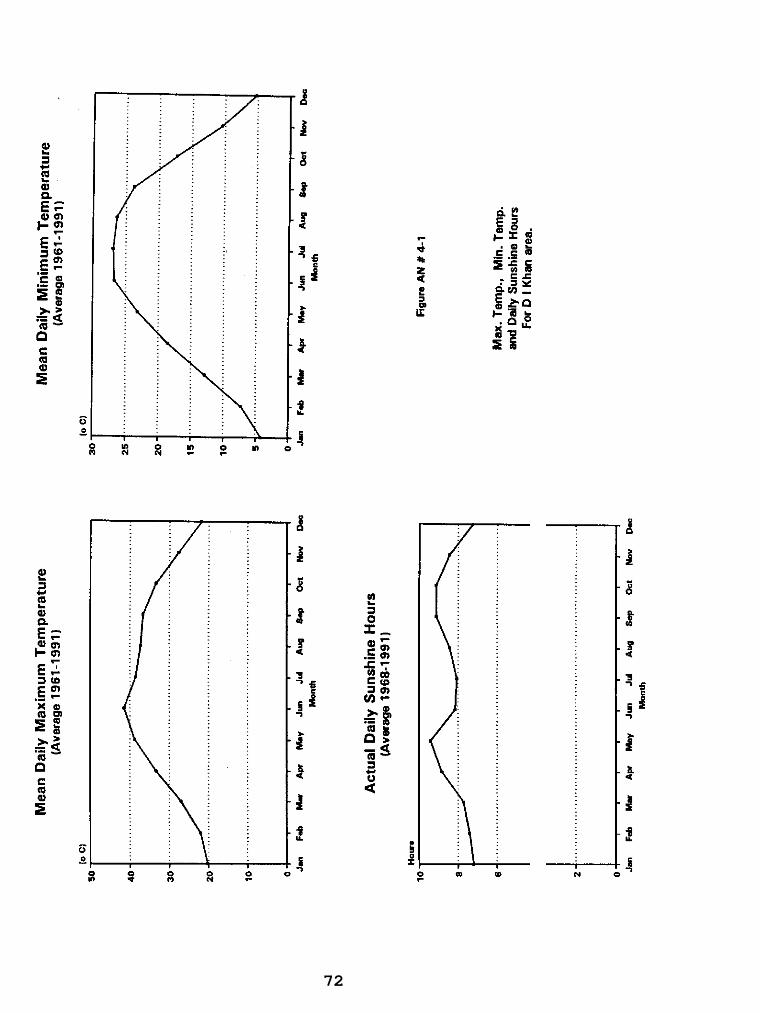
72

-4 w
Monthly Relative Humidity (Average 1961 -1 991 I
P a C m
I
60
50
40
30
20
10
0
Monthly Rainfall (Average 1961 -1991 1
70 n I ............................................ .....................................
60
............................................ .............................. 50
............................................ .............................. 40
.............. ....................... .............................. 30
.................. 20
10
0 Jan F& Ms A p May Jm Jd Aw &p Oat Nov Dsc
Monm
Mean Daily Wind Speed (Average 1961-1983)
wd=v 200 I
"1 ........................................
Figure AN # 4-2
Relative Humidity. Windspeed and Monthly Rainfall
For D I Khan area.
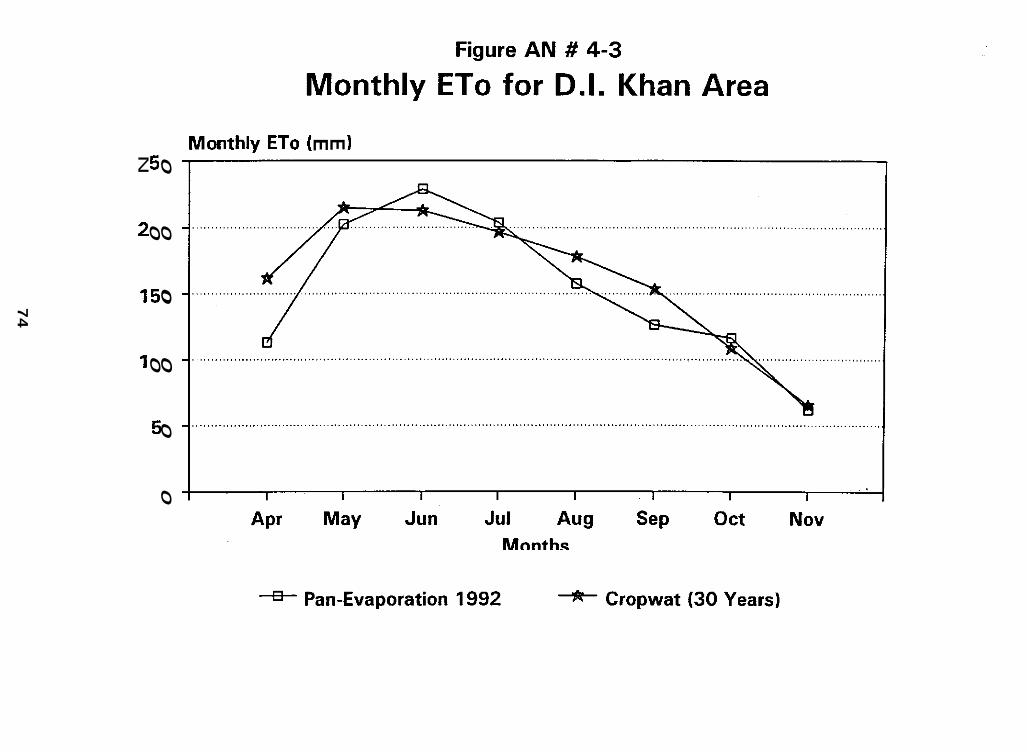
I
E E Y
I-" z w * E 0
0
0
0
0
0
m 0
m
0
N
N
m F
F
74