critical state for overconsolidated unsaturated silty soil
TRANSCRIPT

Critical state for overconsolidated unsaturatedsilty soil
A.R. Estabragh and A.A. Javadi
Abstract: The critical state concepts have been investigated for an overconsolidated unsaturated silty soil through a com-prehensive set of controlled suction triaxial laboratory experiments. The experimental tests were conducted in a speciallydesigned double-walled Bishop and Wesley triaxial cell on samples of unsaturated silty soil. Isotropic loading, unloading,and triaxial drained shear tests were performed on samples of unsaturated silty soil with different overconsolidation ratiosat various suctions. The data from the triaxial tests were used in the development of a critical state framework for overcon-solidated unsaturated silty soil. The framework is defined in terms of four state variables: mean net stress (p’), deviatorstress (q), suction (s), and specific volume (v). The results show that the critical state lines in q:p’ space for different soilsuctions are not parallel and merge with each other. The slopes and intercepts of these lines are functions of suction. How-ever, the critical state lines are nearly parallel in the v – ln p’ plane except under saturation conditions, and the slope andintercept of these lines are also functions of suction.
Key words: critical state, unsaturated soil, overconsolidation, specific volume, triaxial test.
Resume : On a etudie les concepts d’etat critique pour un sol limoneux non sature au moyen d’un ensemble completd’essais triaxiaux a succion controlee en laboratoire. Les essais experimentaux ont ete realises sur des echantillons de sollimoneux dans la cellule triaxiale a double paroi concue specialement a cet effet par Bishop et Wesley. On a execute desessais de cisaillement triaxiaux draines avec chargement et dechargement isotropes sur des echantillons de sol limoneuxsous differents rapports de surconsolidation (OCR) et sous diverses succions. Les donnees des essais triaxiaux ont ete utili-sees dans le developpement d’un cadre d’etat critique pour le sol limoneux non sature et surconsolide. Le cadre est definien fonction de quatre variables d’etat : la contrainte moyenne nette (p’), la contrainte deviatorique (q), la succion (s) et levolume specifique (v). Les resultats montrent que les lignes d’etat critique dans l’espace q : p’ pour differentes succionsdu sol ne sont pas paralleles et se fondent les unes aux autres. Les pentes et les points d’interception de ces lignes sontdes fonctions de la succion. Cependant, les lignes d’etat critique sont presque paralleles dans le plan v – lnp’ sauf dansles conditions saturees, et la pente et l’interception de ces lignes sont aussi des fonctions de la succion.
Mots-cles : etat critique, sol non sature, surconsolidation, volume specifique, essai triaxial.
[Traduit par la Redaction]
Introduction
The critical state theory has been proposed as a usefulframework for interpreting the behaviour of saturated soils.The critical state is a state of soil during shearing whereshear strain can continue without any further change instress or volume. The critical state models for saturated soilsare defined in terms of three state variables: mean net effec-tive stress, p’ ½p0 ¼ ð�1 þ 2�3Þ=3� uw�; deviator stress, qðq ¼ �1 � �3Þ; and specific volume, v (Schofield and Worth1968), where �1 and �3 are axial and radial stresses, respec-tively, and uw is the pore-water pressure. At critical statethese variables are related through three critical state param-eters, M, �, and � and the following equations:
½1� q ¼ Mp0
½2� v ¼ �� �lnp0
where M is the slope of the projection of the critical stateline in q:p’ space, � is the intercept (at p’ = 1 kPa), and �is the slope of the projection of the critical state line in v –ln p’ space.
The stress state for unsaturated soils can be representedby two stress state variables. The most commonly usedstress state variables for unsaturated soils are the net stressð�� uaÞ and matric suction ðua � uwÞ, where ua is the pore-air pressure (Fredlund and Morgenstern 1977). To build acritical state framework for unsaturated soils the concepts ofyielding and critical state for saturated soils can be extendedby using two independent stress state variables for unsatu-rated soils.
The critical state framework for unsaturated soils has beenproposed by many researchers (e.g., Alonso et al. 1990; Toll1990; Maatouk et al. 1995; Wheeler and Sivakumar 1995;Loret and Khalili 2002; Wang et al. 2002; Toll and Ong2003; and Khalili et al. 2004). Alonso et al. (1990) showedthat the critical state relationship for unsaturated soils in q:p’space can be expressed by the following equation:
Received 27 November 2005. Accepted 12 November 2007.Published on the NRC Research Press Web site at cgj.nrc.ca on8 April 2008.
A.R. Estabragh.1 Faculty of Soil and Water Engineering,University of Tehran, P.O. Box 4411, Karaj 31587-77871, Iran.A.A. Javadi. Computational Geomechanics Group, School ofEngineering, Computer Science and Mathematics, University ofExeter, Devon, EX4 4QF, UK.
1Corresponding author (e-mail: [email protected]).
408
Can. Geotech. J. 45: 408–420 (2008) doi:10.1139/T07-105 # 2008 NRC Canada

½3� q ¼ Mp0 þMks
where M is the slope of the critical line for saturated soil. Inthis equation, M is considered to be constant and unaffectedby suction (Alonso et al. 1990; Wheeler and Sivakumar1995), and Mk is the slope of the critical state line in the q:splane for a constant value of p’ ½p0 ¼ ð�1 þ 2�3Þ=3� ua�. Bycomparing eq. [3] with the following equation proposed byWheeler and Sivakumar (1995):
½4a� q ¼ MðsÞp0 þ �ðsÞ
where M(s) is the slope of the critical state line and �(s) isthe intercept or the apparent cohesion caused by suction;Mks in eq. [3] can be considered to be the apparent cohe-sion.
Alonso et al. (1990) did not explicitly state a relationshipbetween specific volume v and mean net stress p’ at criticalstate. Toll (1990) proposed that the critical state for unsatu-rated soils could be expressed in terms of deviator stress, q,effective mean net stress, p’, suction, s ðs ¼ ua � uwÞ, spe-cific volume, v, and degree of saturation, sr. Wheeler and Si-vakumar (1995) used the data from shearing tests onsamples of kaolin and showed the existence of critical staterelationships for q and v, which took the form
½4b� q ¼ MðsÞ þ �ðsÞ
½5� v ¼ �ðsÞ � ðsÞln p0
pat
The parameters M(s), �(s), �(s), and c(s) in eqs. [4] and[5] are all functions of suction. They found that M(s) in-creases with increasing suction but the variation of it is rela-tively minor and therefore, accepted a constant slope (i.e.,independent of suction). Variable �(s) is the apparent cohe-sion intercept that is caused by suction and it increases withsuction; pat is atmospheric pressure; �(s) is the intercept (atp0 ¼ pat); and c(s) is the slope of projection of the criticalstate line in the v – ln p’ plane and varies with suction.They reported that the position of the lines does not progressin a smooth sequence with increasing suction, and the bestform of the relationship is not immediately obvious(Wheeler and Sivakumar 1995).
Overconsolidation ratio and state boundarysurface
The relationship between specific volume and effectivestress depends on the stress history of saturated soils. If thepresent effective stress is the maximum to which a saturatedsoil has ever been subjected, the soil is said to be normallyconsolidated. If, on the other hand, the effective stress atsome time in the past has been greater than the presentvalue it is said to be overconsolidated. The maximum valueof effective stress in the past divided by the present value isdefined as the overconsolidation ratio (OCR). An OCR forunsaturated, compacted soils and unsaturated natural soilshas not been clearly established (Nishimura et al. 1999).One definition has been suggested by Fredlund and Ra-hardjo (1993) wherein the present in situ state of stress inan unsaturated soil is translated onto the total stress planeand is called the swelling pressure. The in situ stress state is
referred to as the corrected swelling pressure, which is equalto the sum of the overburden pressure and the matric suctionequivalent. The use of the corrected swelling pressure elimi-nates the need for measuring the in situ negative pore-waterpressure and assessing how it should be combined with thetotal stress when defining OCR (Fredlund and Rahardjo1993). The swelling pressure should be ‘‘corrected’’ for sam-pling disturbance using a modified Casagrande type of con-struction (Fredlund et al. 1980; Fredlund 1983). Fredlundand Rahardjo (1993) suggested that the OCR of an unsatu-rated soil be defined as
½6� OCR ¼ pc
p0s
where pc is the preconsolidation pressure, which refers tothe maximum applied stress to which the soil has come toequilibrium in its history, and p0s is the corrected swellingpressure. This method appears to be applicable to the deter-mination of OCR for in situ conditions and for natural soils.However, it is not applicable to the results of laboratory ex-periments on remolded samples that have been unloadedfrom a point on the virgin line to different pressures at con-stant suction, because, in this case, all unloading curves willcoincide (for a particular suction and sample). Consideringthese deficiencies of defining OCR Nishimura et al. (1999)used the term total stress ratio (TRS) for defining OCR as
½7� TSR ¼ pcomp
ð�v � uaÞwhere pcomp is the static compaction pressure and ð�v � uaÞis the current confining pressure. However, Nishimura et al.(1999) also state that ‘‘It is not clear how an overconsolida-tion ratio can be defined when there are two independentstress state variables (suction and overburden pressure)’’.They acknowledge that there is need for a more in-depthstudy of procedures that can be used to define the OCR ofcompacted soils and unsaturated soils.
As the procedures for exact definition of OCR have notbeen fully established for reconstituted compacted soil andalso considering the fact that in the experiments conductedin this research the samples were unloaded at constant suc-tion from a point on the virgin line, the traditional definitionof OCR (as for saturated soils) has been used in this re-search. As the value of pc has been prescribed in this re-search and the tests have been conducted at constantsuction, the use of the traditional definition of OCR appearsto be more appropriate in this case.
A saturated soil that is looser (sometimes referred to aswetter) than the critical state will contract in volume undershear to achieve the critical state, or if volume change isprevented (an undrained condition) then an increase in pore-water pressure will result so that the effective stress statemoves towards the critical state. A soil that is denser (ordrier) than the critical state will dilate or if volume changeis prevented a decrease in pore-water pressure will result. Inthe case of normally consolidated soils the stress paths forboth drained and undrained tests lie entirely on the stateboundary surface. In the case of overconsolidated soils thestress paths prior to failure for both drained and undrainedtests lie inside the state boundary surface. A distinctionmust be made between lightly and heavily overconsolidated
Estabragh and Javadi 409
# 2008 NRC Canada

soils. Lightly overconsolidated soils remain wet of criticalstate but heavily overconsolidated soils reach failure at apoint on the state boundary surface on the dry side of thecritical state.
Wheeler and Sivakumar (1995) conducted five differenttypes of shear tests on samples of normally consolidated un-saturated compacted kaolin. Among them, three types ofshear tests were conducted at constant suction and the restwere conducted with variable suction. They did not reach atrue critical state for some of the tests under variable suc-tion. Wheeler and Sivakumar (1995) proposed a critical stateframework for unsaturated soils based on the results of thetests under controlled suction. They concluded that there isa state boundary surface for unsaturated soil that is producedby linking the isotropic normal compression line and thecritical state line. They showed that all stress paths traverseda unique state boundary that can be defined by the expres-sion of yield surface with elliptical cross-sections.
Purpose of this studyLaboratory tests to study the critical state behaviour for
unsaturated soils are still limited in number due to the com-plex and time consuming nature associated with testing un-saturated soils.
Previously the critical state condition had been consideredonly for normally consolidated unsaturated soils by many re-searchers such as Maatouk et al. (1995); Wheeler and Siva-kumar (1995); and Wang et al. (2002). In this study, thecritical state condition will be examined for overconslidatedunsaturated samples of a silty soil. In this paper, criticalstate concepts for overconsolidated unsaturated silt will bestudied through a number of controlled suction drained tri-axial shear tests.
Experimental study
Soil propertiesThe soil used in the testing program was a silty soil with
low plasticity, comprising 5% sand, 90% silt, and 5% clay.The grain size distribution curve for this soil is shown inFig. 1. It had a liquid limit of 29% and a plasticity index of19%. The optimum water content in the standard compac-tion test was 14.5%, the maximum dry density (gd) was1.74 Mg/m3, and the specific gravity of solids (Gs) was2.72. According to the Unified Soil Classification System(USCS), the soil can be classified as silt with low plasticity(ML).
Sample preparationThe test program included a number of equalization, iso-
tropic loading and unloading, and shearing tests on samplesof the soil. The samples were 38 mm in diameter and76 mm high and were prepared at a water content of 10%(4.5% less than the optimum water content as determinedby the standard compaction test). To ensure uniformity ofdensity and consistency in behaviour, the samples were pro-duced by compacting the material statically in a differentnumber of layers (1, 3, 6, and 9 layers) in a compressionframe with a fixed displacement rate of 1.5 mm/min. Foreach method of static compaction, the variation in dry den-
sity along the length of the sample was determined by cut-ting the sample into eight slices and measuring the densityof each slice. Typical variations of dry density in the sam-ples compacted in 1, 3, 6, and 9 layers are shown inFigs. 2a, b, c, and d, respectively. The optimum number oflayers was selected by considering the value of standard de-viation (STD) and the presence of any visible interfaces be-tween the layers. As expected, the sample uniformity wasthe best with compaction in 9 layers. The samples preparedby this technique were very uniform, and the interfaces be-tween the layers were minor. The repeatability of results ob-tained using samples prepared in this way was found to beexcellent. Therefore, the samples were compacted in 9layers, with each layer being compacted statically with afixed displacement rate of 1.5 mm/min to maximum verticaltotal stresses of 1600 kPa. Table 1 shows the soil state vari-ables (specific volume v, water content, w, and degree ofsaturation, sr) after compaction.
Experimental apparatusThe tests were conducted in a double-walled triaxial cell.
In the design of the apparatus a Bishop and Wesley triaxialcell was modified into a double-walled cell and used fortesting the unsaturated soil samples. A double-walled cellwas used so as to avoid the difficulties that would otherwisehave resulted from creep or hysteresis of the inner acrylicwall (Wheeler 1988). A schematic of the developed appara-tus is shown in Fig. 3. Pore-water pressure (uw) was appliedand measured at the base of the sample through a saturatedporous filter with an air entry value of 500 kPa. Pore-airpressure (ua) was applied at the top of the sample through ahydrophobic membrane and a filter with low air entry value(Javadi and Snee 2001). The free air could not pass throughthe high air entry disk but the diffused air could passthrough it in solution with water, gather underneath thehigh air entry disk, and form air bubbles. The accumulationof the air bubbles under the high air entry disk could preventthe passage of the water from the pore-water controller intothe sample through the high air entry disk and cause seriouserrors in the measurement of water volume change. To over-come this problem, a flushing system was designed and usedas suggested by Fredlund (1975). The axis translation tech-nique, proposed by Hilf (1956), was used for creating thedesired suctions in the samples. In this way, the values ofuw were maintained above atmospheric pressure. Four geo-
Fig. 1. Grain size distribution curve.
410 Can. Geotech. J. Vol. 45, 2008
# 2008 NRC Canada

technical digital system (GDS) pressure controllers wereused to apply and control the pressure in the inner and outercells, the pore-water pressure, and the axial stress. Samplevolume change was measured by monitoring the flow ofwater into and out of the inner cell with a GDS controllerunit. The measurements of the sample volume change wereused to monitor the variation in the specific volume (v). Theflow of water to the sample was recorded by another GDScontroller unit, and hence the variations in water content(w) and the degree of saturation (sr) were monitored. A con-ventional Bishop and Wesley hydraulic triaxial apparatuswas used for conducting the tests on saturated samples. Thecontrol system for these tests consisted of three pressurecontrollers and a digital pressure interface (DPI) unit. Acomputerized control system was used to log the data fromall of the GDS units and control a test to follow any re-quired stress or strain path by adjusting the GDS controllers.
Before the main tests, calibration tests were carried out toestimate the volume change of different components of the
system (including apparent volume change of the cell dueto the effects of cell pressure, water absorption by theacrylic cell walls, loading ram displacement, and the drain-age line) and to make the necessary corrections to the meas-urements.
Experimental procedure
EqualizationThe purpose of the equalization tests was to create a de-
sired suction in a sample by allowing the pore-air pressureand pore-water pressure to equalize to the applied air pres-sure and back pressure, respectively. During equalization,the suction in the sample changed gradually from its initiallyunknown value after compaction to the required value. Aftersetting up the sample in the triaxial cell, all the tubes andfittings between the two cells and the spiral groove at the
Table 1. Soil state variables at the beginning (after compaction)and end of equalization.
Beginning of equalization End of equalization
Test No. w (%) sr (%) v w (%) sr (%) vT3U1 10.4 36.45 1.77 10.05 37.7 1.73T3U2 9.7 34.63 1.76 8.96 34.06 1.71T3U3 10.7 38.34 1.76 10.3 37.25 1.75T3U4 10.1 34.90 1.79 10.46 36.80 1.77T3U5 10.2 36.03 1.77 10.34 37.8 1.74T3U6 9.7 34.26 1.77 8.0 28.57 1.75T3U7 9.4 33.68 1.76 10.07 36.96 1.74T3U8 10.2 35.43 1.78 10.15 36.23 1.76T3U9 9.4 32.10 1.79 9.44 33.62 1.76T3U10 9.8 34.62 1.77 9.5 35.86 1.72T2U1 9.4 32.82 1.78 10.15 37.15 1.74T2U2 10.1 34.77 1.79 10.85 40.49 1.73T2U3 10.4 36.04 1.78 10.4 37.67 1.75T2U4 10.0 35.51 1.77 10.07 33.40 1.82T2U5 9.2 32.20 1.78 10.70 37.65 1.77T2U6 10.7 37.94 1.77 11.03 40.82 1.74T2U7 10.3 36.53 1.77 10.71 38.68 1.75T2U8 10.0 35.28 1.77 10.25 36.66 1.76T1U1 10.7 38.50 1.76 15.81 60.22 1.71T1U2 9.7 34.00 1.77 13.91 50.65 1.75T1U3 9.5 32.83 1.79 14.84 52.08 1.77T1U4 9.6 33.40 1.78 15.34 53.42 1.78T1U5 10.1 35.00 1.78 13.06 47.07 1.76T1U6 9.8 34.98 1.76 12.28 45.10 1.74T1U7 9.8 35.34 1.75 12.06 45.3 1.72T1U8 9.6 33.76 1.77 11.85 42.97 1.75T1U9 10.6 38.34 1.75 12.74 47.37 1.73T0U1 9.7 33.10 1.79 27.35 100.0 1.66T0U2 9.3 32.85 1.77 31.23 100.0 1.66T0U4 9.9 34.80 1.77 30.89 100.0 1.66T0U5 9.3 32.60 1.77 30.24 100.0 1.66T0U6 10.3 37.35 1.75 30.28 100.0 1.62T0U7 9.2 32.58 1.77 31.38 100.0 1.59T0U8 9.2 32.59 1.77 28.9 100.0 1.71T0U9 9.8 34.87 1.76 30.9 100.0 1.62T0U10 9.4 33.45 1.76 25.2 100.0 1.64
Note: w, water content; sr, degree of saturation; v, specific volume.
Fig. 2. Variation of dry density along the samples compacted in adifferent number of layers.
Estabragh and Javadi 411
# 2008 NRC Canada

bottom of the high air entry disk were flushed to preventany air entrapment in the system that could affect the re-sults. After flushing, the pressures of the two cells were in-creased simultaneously to 10 kPa while the back pressureand air pressure were increased to 5 and 6 kPa, respectively.To achieve a desired matric suction in a sample, the targetvalues of cell pressure, back pressure, and air pressure wereselected. The target and initial values of inner cell pressureand back pressure together with required time to reach thetarget values were set in the control program. The pressureswere then ramped from the initial values to the target valuesat a rate of 1.6 kPa/min (rates of 1.6 and 2 kPa/min werepreviously used by Wheeler and Sivakumar 1995 and Zaka-ria 1994, respectively). The volumes of water inflow or out-flow to the sample and to the inner cell were monitoredduring equalization. The equalization stage varied in lengthbetween tests but usually took between 5 and 8 days. Theequalization stage was terminated when the flow of waterdecreased to less than 0.1 cm3/day (as used by Zakaria1994; Wheeler and Sivakumar 1995; Sharma 1998; andRampino et al. 2000). Table 1 shows the state variables ofthe soil before and after the equalization stage.
ConsolidationAfter the sample was equalized at specified suction (0, 50,
100, 200, or 300 kPa) and mean net stress (20 or 50 kPa), itwas loaded isotropically under the constant suction (air backpressure and water back pressure were kept constant) to apreselected value of mean net stress (usually 550 kPa). Theprocess of ramped consolidation was used to limit the excesspore-water pressure generated at the top face of the sampleto an acceptably low value. The target and initial values ofcell pressure, back pressure, and required time to achievethe target pressures were inserted in the control program.The required information during this and the followingstages was recorded by a computer. At the end of each stagethe sample was left for 24 h under the target pressures to al-low full dissipation of excess pore-water pressure. Eachsample was consolidated to a virgin state.
Unloading stageAfter consolidation to a virgin state, the cell pressure was
reduced from its value at the end of the consolidation stageto a predefined lower value under constant suction. Thevalue of the target pressure in the unloading stage varied de-
Fig. 3. Layout of the apparatus.
412 Can. Geotech. J. Vol. 45, 2008
# 2008 NRC Canada
pending on the required OCR for the sample. The unloadingwas conducted using the ramping method, and the rate ofunloading was kept the same as that used in the ramp con-solidation stage. The pressure in the inner and outer cellswas reduced simultaneously.
Shearing (reloading)After unloading, drained shear tests were conducted (with
constant cell pressure at a constant rate of axial strain) onthe samples with prespecified OCRs. An axial displacementrate of 0.120 mm/h was used in the shear tests (giving astrain rate of about 3.78%/day as used by Sivakumar 1993;Cui and Delage 1996). This rate was selected to ensure thedissipation of excess pore-water pressure during shearing.The volume change for each sample was calculated duringthe shearing stage from the volume of water that flowedfrom the GDS unit to the inner cell or vice versa. The axialstrains and the variation in water content were calculatedfrom the data recorded by the relevant GDS units. Further-more, variations of mean net stress, deviator stress, axialstrain, and volumetric strain were calculated from the re-corded data. All the samples were tested to critical state atthe end of the shearing stage where deviator stress (q),mean net stress (p’), and specific volume (v) either remainedconstant or changed very slowly.
Results
EqualizationThe purpose of the equalization stage in each test series
was to create a desired suction in the sample. All the equal-ization stages were conducted under constant mean netstress.
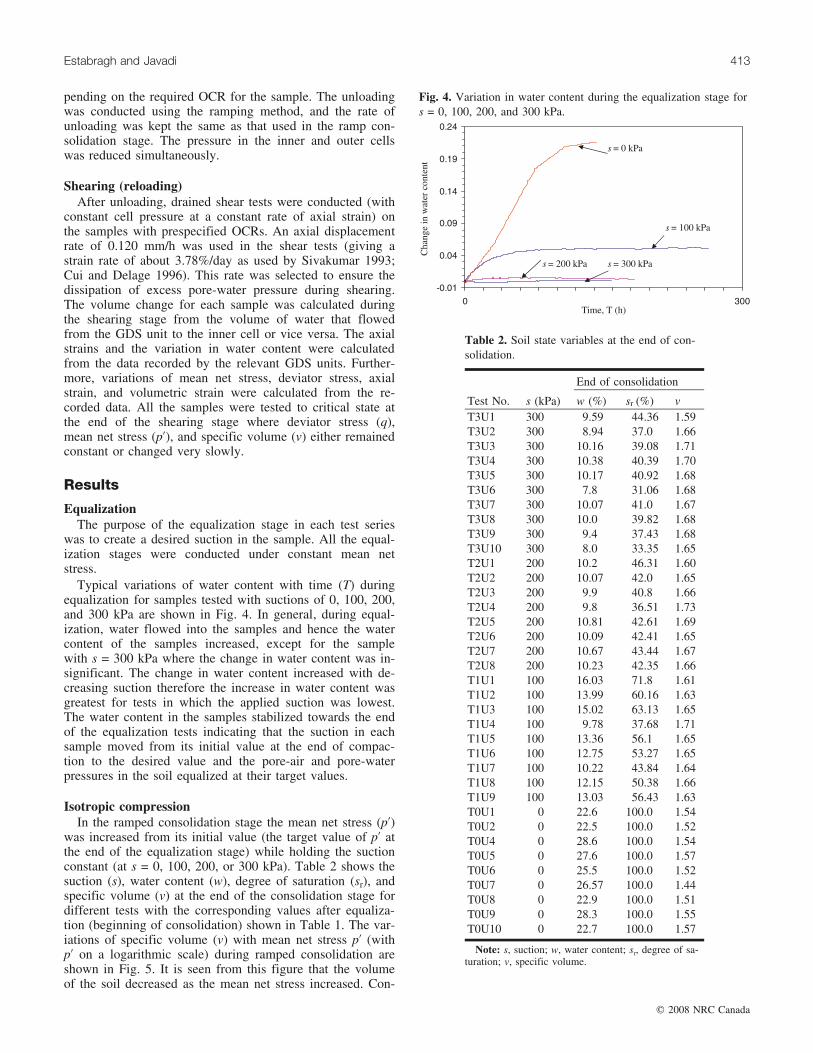
Typical variations of water content with time (T) duringequalization for samples tested with suctions of 0, 100, 200,and 300 kPa are shown in Fig. 4. In general, during equal-ization, water flowed into the samples and hence the watercontent of the samples increased, except for the samplewith s = 300 kPa where the change in water content was in-significant. The change in water content increased with de-creasing suction therefore the increase in water content wasgreatest for tests in which the applied suction was lowest.The water content in the samples stabilized towards the endof the equalization tests indicating that the suction in eachsample moved from its initial value at the end of compac-tion to the desired value and the pore-air and pore-waterpressures in the soil equalized at their target values.
Isotropic compressionIn the ramped consolidation stage the mean net stress (p’)
was increased from its initial value (the target value of p’ atthe end of the equalization stage) while holding the suctionconstant (at s = 0, 100, 200, or 300 kPa). Table 2 shows thesuction (s), water content (w), degree of saturation (sr), andspecific volume (v) at the end of the consolidation stage fordifferent tests with the corresponding values after equaliza-tion (beginning of consolidation) shown in Table 1. The var-iations of specific volume (v) with mean net stress p’ (withp’ on a logarithmic scale) during ramped consolidation areshown in Fig. 5. It is seen from this figure that the volumeof the soil decreased as the mean net stress increased. Con-
Table 2. Soil state variables at the end of con-solidation.
End of consolidation
Test No. s (kPa) w (%) sr (%) vT3U1 300 9.59 44.36 1.59T3U2 300 8.94 37.0 1.66T3U3 300 10.16 39.08 1.71T3U4 300 10.38 40.39 1.70T3U5 300 10.17 40.92 1.68T3U6 300 7.8 31.06 1.68T3U7 300 10.07 41.0 1.67T3U8 300 10.0 39.82 1.68T3U9 300 9.4 37.43 1.68T3U10 300 8.0 33.35 1.65T2U1 200 10.2 46.31 1.60T2U2 200 10.07 42.0 1.65T2U3 200 9.9 40.8 1.66T2U4 200 9.8 36.51 1.73T2U5 200 10.81 42.61 1.69T2U6 200 10.09 42.41 1.65T2U7 200 10.67 43.44 1.67T2U8 200 10.23 42.35 1.66T1U1 100 16.03 71.8 1.61T1U2 100 13.99 60.16 1.63T1U3 100 15.02 63.13 1.65T1U4 100 9.78 37.68 1.71T1U5 100 13.36 56.1 1.65T1U6 100 12.75 53.27 1.65T1U7 100 10.22 43.84 1.64T1U8 100 12.15 50.38 1.66T1U9 100 13.03 56.43 1.63T0U1 0 22.6 100.0 1.54T0U2 0 22.5 100.0 1.52T0U4 0 28.6 100.0 1.54T0U5 0 27.6 100.0 1.57T0U6 0 25.5 100.0 1.52T0U7 0 26.57 100.0 1.44T0U8 0 22.9 100.0 1.51T0U9 0 28.3 100.0 1.55T0U10 0 22.7 100.0 1.57
Note: s, suction; w, water content; sr, degree of sa-turation; v, specific volume.
Fig. 4. Variation in water content during the equalization stage fors = 0, 100, 200, and 300 kPa.
Estabragh and Javadi 413
# 2008 NRC Canada

tinuous increase in mean net stress caused the soil to start toyield at some point. The normal consolidation lines for thesetests are shown in Fig. 6.
UnloadingUnloading tests followed all of the consolidation tests at
various suctions. The unloading stage usually began from amean net stress of 550 kPa and continued to a preselected(lower) mean net stress (see Fig. 5). During the unloadingstages, suction was held constant.
ShearingA total of 20 controlled-suction triaxial drained shear tests
with constant cell pressures were performed on the samples,each with a specific OCR. In this test program five cellpressures (50, 100, 200, 300, and 400 kPa) (different OCRs)and four suctions (0, 100, 200, and 300 kPa) were used. Ta-ble 3 shows the suction, OCR, and cell pressure, togetherwith the corresponding state variables of the soil at the be-ginning of shearing. Figures 7–10 show the variations of thedeviator stress, q and volumetric strain, "v with axial strain,"a at different suctions. For each suction, five shear testswere carried out each at a different cell pressure. The varia-tions of q and "v with "a for various suctions are discussedbelow.
s = 0 kPaIn the test with cell pressure equal to 50 kPa the deviator
Fig. 5. Variation of specific volume during ramp consolidation andswelling (unloading) for various suction values.
Fig. 6. Normal consolidation lines for various suction values.
Table 3. Soil state variables at the beginning of shearing tests withdifferent �3 and OCR.
Before shearing
Test No. s (kPa) �3 (kPa) OCR w (%) sr (%) vT3U7 300 50 11 10.1 39.3 1.70T3U4 300 100 5.5 10.6 40.5 1.71T3U5 300 200 2.75 10.4 41.0 1.70T3U6 300 300 1.83 9.8 38.9 1.70T3U9 300 400 1.38 9.4 37.4 1.70T2U7 200 50 11 10.8 42.5 1.70T2U4 200 100 5.5 10.0 40.0 1.70T2U5 200 200 2.75 10.9 42.2 1.70T2U6 200 300 1.83 11.0 45.6 1.66T2U8 200 400 1.38 10.2 42.4 1.66T1U5 100 50 11 13.6 54.5 1.68T1U7 100 100 5.5 10.5 38.6 1.74T1U8 100 200 2.75 12.4 50.8 1.67T1U9 100 300 1.83 13.3 56.8 1.64T1U6 100 400 1.38 13.2 54.7 1.66T0U2 0 50 11 23.3 100.0 1.54T0U5 0 100 5.5 28.0 100.0 1.58T0U7 0 200 2.75 27.0 100.0 1.45T0U9 0 300 1.83 29.2 100.0 1.56T0U10 0 400 1.38 22.8 100 1.57
Note: s, suction; �3, radial stress; w, water content; sr, degree of satura-tion; v, specific volume.
Fig. 7. Results for drained tests carried out on samples with s =0 kPa, plotted against axial strain: (a) deviator stress, q; (b) volu-metric strain, "v (%).
414 Can. Geotech. J. Vol. 45, 2008
# 2008 NRC Canada

stress increased until it reached a maximum of about150 kPa at 3% axial strain after which it remained constant(see Fig. 7). During this stage, dilation occurred in the sam-ple. In the other tests with cell pressures of 100, 200, 300,and 400 kPa, deviator stress increased up to axial strains of5%, 18%, 20%, and 26%, respectively, and then remainedconstant. Contraction occurred in all of these samples duringshearing. It is seen from Fig. 7b that the compression curvecorresponding to the sample tested at �3 = 200 kPa is lo-cated below the other curves and does not follow the ex-pected trend, showing that this sample was morecompressed than all of the others during shearing. Table 1shows that the specific volume of this sample (T0U7) afterequalization was not consistent with the other samples testedat s = 0 kPa. This variation of specific volume could be re-lated to oscillations in the GDS controller, although theoverall trend of variation was maintained, and this initialvariation of specific volume resulted in the volumetric curvebeing inconsistent with the overall trend.
s = 100 kPaThe results of shear tests with a suction of 100 kPa are
shown in Fig. 8. The results of the test with �3 = 50 kPashow that the deviator stress first increased to a peak valueof 250 kPa, after which it became nearly constant. Duringshearing, the volume of the sample increased after a slightinitial contraction. In the test with a cell pressure of100 kPa shearing continued up to an axial strain of 18%. Itis seen from the results that the deviator stress increased to avalue of about 400 kPa at an axial strain of nearly 4% and
then remained nearly constant until an axial strain of about11% after which it decreased very slowly. However, the oc-currence of failure did not appear in the results of deviatorstress versus axial strain. This may have been due to airtrapped in the relevant GDS unit during the test (as reportedby other researchers, such as Zakaria 1994) or developmentof shear bands in the sample due to very slight softening.Softening response in the samples generally results from lo-calized failure zones, so called shear bands (Budhu 1979).After shearing, there was no evidence of failure in the sam-ple. In the tests with cell pressures of 200, 300, and400 kPa, the deviator stress increased to peak values andthen remained nearly constant while the volume of the sam-ples decreased during shearing (Fig. 8b).
s = 200 kPaFigure 9 shows the results of the tests conducted at s =
200 kPa. In the tests with cell pressures of 50 and 100 kPathe deviator stress increased to a maximum value and thenremained more or less constant. It is seen from Fig. 9b thatthese samples experienced an initial slight reduction in vol-ume followed by dilation. In the tests with cell pressures of200, 300, and 400 kPa the deviator stress increased to con-stant values at relatively large axial strains, and the volumeof these samples decreased during shearing.
s = 300 kPaFigure 10 shows the variations of deviator stress and
volumetric strain with axial strain for five samples tested at
Fig. 8. Results for drained tests carried out on samples with s =100 kPa, plotted against axial strain: (a) deviator stress, q; (b) vo-lumetric strain, "v (%).
Fig. 9. Results for drained tests carried out on samples with s =200 kPa, plotted against axial strain: (a) deviator stress, q; (b) vo-lumetric strain, "v (%).
Estabragh and Javadi 415
# 2008 NRC Canada

s = 300 kPa. The results show that for the test with a cellpressure of 50 kPa the deviator stress first increased to apeak value of about 400 kPa at an axial strain of about 2%and then decreased sharply to 300 kPa, after which it re-mained nearly constant. In all of the tests at cell pressuresof 100, 200, 300, and 400 kPa, deviator stress increased topeak values and then remained more or less constant. Dur-ing shearing, the samples tested with cell pressures of 50and 100 kPa experienced an initial contraction followed bydilation, whereas the samples tested at confining pressuresof 200, 300, and 400 kPa all experienced contraction.
Discussion
The results show that the volume of the samples withhigh OCR values first decreased and then increased. The de-viator stress for these samples usually increased to a peakvalue and then decreased with increasing axial strain. Thepeak point was particularly clear in the case of the sampletested at s = 300 kPa and �3 = 50 kPa. This behaviour issimilar to that which has frequently been observed in satu-rated soils by many researchers, such as Wood (1990) andothers. During shearing of a saturated soil with a high OCRthe volume of the sample first decreases and then increasesas deviator stress and axial strain increase. It can be saidthat the heavily overconsolidated samples are denser or drierthan critical state because of dilation during shearing. There-fore the behaviour that was observed for unsaturated sam-ples with OCRs of 11 and 5.5 was similar to the behaviour
of heavily overconsolidated samples in saturated conditions.The volume of the rest of the samples with lower OCR val-ues of 2.75, 1.83, and 1.38 decreased with increasing q and"a. It can be concluded that these samples are looser or wet-ter than the critical state because they contracted duringshearing to achieve the critical state condition, and the stresspaths lie inside the state boundary surface.
The results of shearing tests show that all samples withdifferent OCRs and suctions tended towards critical state atthe end of shearing with mean net stress (p’), deviator stress(q), and specific volume (v) either remaining constant orchanging very slowly. To confirm whether samples in differ-ent shearing tests (especially those tested at the low value ofOCR) reached the critical state the data were plotted in q/p’(stress ratio) : "a (axial strain) space. Typical results forsamples tested with cell pressures of 50, 100, 200, 300, and400 kPa at a suction of 300 kPa are shown in Fig. 11. Thismethod was suggested by Toll and Ong (2003) for determi-nation of critical state condition in the case of shear bandand nonhomogenous deformation. Toll and Ong (2003) con-ducted constant water content and consolidated drained testson unsaturated and saturated samples of sandy clay soil todefine the critical state parameters. They concluded that atrue critical state, that is, no change in deviator stress, porepressure, or volume was rarely achieved by the end of theirtests. They showed that the deviator stress continued to in-crease (and the pore-water pressure to decrease), but by theend of the test the stress path followed a constant stress ratio(q/p’). They explained that it is always difficult to define atrue critical state condition for bonded or dense materials asthey often fail through the development of distinct shear sur-face where nonhomogenous deformation will affect the re-sults. They therefore assumed that the ultimate (constant)stress ratio (q/p’) defines the critical stress condition. Fig-ure 11 confirmed that samples with a low value of OCR at-tained the critical state condition. Most of the testsapproached the critical state conditions with no evidence ofany obvious peak in the curve, and the samples failed bybarrelling in a plastic fashion rather than by the formationof a distinct failure plane. The exception to this pattern ofbehaviour was more obvious in the test with a cell pressureof �3 = 50 kPa at a suction of 300 kPa. In this test, the de-viator stress increased to a peak and then decreased to amore or less constant value. The exhibition of post-softeningbehaviour that was observed in this test can be attributed tothe influence of suction in contributing to the stiffness, brit-tleness, and dilatancy of the soil sample that is usually ob-served at low confining pressures and high suctions. Therewas no (obvious) evidence of a shear plane at the end ofshearing in this sample, as was discussed in the ‘‘s =300 kPa’’ section of the paper. However in such tests, eachsample may fail on a distinct slip plane, and there can be adrop in deviator stress after a peak value was attained. Itwas unclear whether initiation of the slip plane coincidedwith the peak deviator stress or occurred at a higher strain.This meant that there was some uncertainty as to whetherthe post-peak reduction of deviator stress represented a falltowards a critical state value or towards a (lower) post-rupture value (with very high localized strain in the regionof the slip plane). Sivakumar (1993) and Wheeler and Siva-kumar (1995) reported similar results from tests on kaolin
Fig. 10. Results for drained tests carried out on samples with s =300 kPa, plotted against axial strain: (a) deviator stress, q; (b) vo-lumetric strain, "v (%).
416 Can. Geotech. J. Vol. 45, 2008
# 2008 NRC Canada

and explained that the critical deviator stress would not besubstantially lower than the peak deviator stress. They con-cluded that the critical state deviator stress can be taken asthe deviator stress just before the appearance of a shearplane. Based on the conclusions of Wheeler and Sivakumar(1995) and also Maatouk et al. (1995) the peak value for�3 ¼ 50 kPa was taken as the critical state deviator stress.
Figure 12 shows the critical state data in the q:p’ plane forthe constant suction shear tests conducted at four differentvalues of suction (0, 100, 200, and 300 kPa). The criticalstate values of q and p’ for each suction appear to fall on astraight line given by eq. [4]. It can be seen from Fig. 12that the critical state lines at different suctions are not paral-lel and meet each other at a point with a mean net stress ofabout 950 kPa. These findings support those reported bymany researchers such as Delage et al. (1987) and Maatouket al. (1995), but they are not consistent with the results re-ported by Wheeler and Sivakumar (1995) for kaolin andWang et al. (2002) for silt. The reason for this may be theexistence of a high friction angle and low degree of satura-tion in unsaturated silt as suggested by Delage et al. (1987).The degree of saturation of the specimen reflects the area ofthe pore water in contact with soil particles, which is re-sponsible for the increase in the shear strength of soils. Toll(1990) explained the effect of the degree of saturation on thefabric and behaviour of unsaturated soil. He concluded thatthe effect of the degree of saturation will be due to the pres-ence of aggregates at a lower degree of saturation causingthe soil to behave in a coarser fashion than would be justi-fied by the grading. In unsaturated conditions the aggregatedfabric can be maintained during shear because the suctiongives strength to the aggregates. In any case samples com-pacted at a high degree of saturation would not be expectedto have an aggregated fabric. Silty soil would tend to desa-turate at much lower suctions (Toll 2000). At intermediatevalues of suction the aggregated fabric would be held to-gether by the suction and could give high angles of friction.
Figure 13 shows the variation of M(s) with suction. It ap-pears that the value of M(s) decreases with increasing suc-tion. These results were also supported by the datapresented by Delage et al. (1987) and Maatouk et al.(1995). Figure 14 shows the values of the intercept �(s)plotted against suction. It can be seen that �(s) increased
monotonically as the suction increased, although not in alinear fashion (as was assumed by Alonso et al. 1990).
The critical state relationship (eq. [4]) is comparable withthe early approach for the shear strength of unsaturated soilsthat was suggested by Fredlund et al. (1978) as
½8� � ¼ c0 þ ð�� uaÞtan�0 þ ðua � uwÞtan�b
It is possible to assume that the slope of the critical stateline is the equivalent of �’ and the intercept �(s) is theequivalent of �b. Alonso et al. (1990), in their critical statemodel, assumed that the slope of the critical state line wasindependent of suction and the variation of apparent cohe-sion was equivalent to the variation of �b with suction in
Fig. 11. Stress ratio, q/p’ against axial strain, "a (%) for drainedtests on samples with s = 300 kPa.
Fig. 12. Critical state line for q and p’ under various suctions.
Fig. 13. Variation of M(s) with suction.
Fig. 14. Variation of �(s) with suction.
Estabragh and Javadi 417
# 2008 NRC Canada

the conventional shear strength expression. This was consis-tent with the behaviour reported by Escario and Saez (1986),Gan et al. (1988), and Escario and Juca (1989), who re-ported that the value of �b in eq. [8] decreased with increas-ing suction. Recently, many researchers, such as Maatouk etal. (1995) and Delage and Graham (1995), reported experi-mental evidence that progressively showed that both �’ and�b are functions of suction. The research works of Maatouket al. (1995) and Delage and Graham (1995) strongly sup-port the results of the study presented in this paper.
Figure 15 shows the critical state values of v plottedagainst p’ (with p’ on a logarithmic scale) for constant suc-tion shear tests conducted at the four different suctions (0,100, 200, and 300 kPa). The critical state values of v appearto fall on a unique critical hyperline (i.e., a unique line foreach value of suction). Inspection of Fig. 15 suggests the ex-istence of a unique critical state relationship of the formpostulated in eq. [5]. The critical state lines are nearly paral-lel (except for the saturated case) over the range of stressesused in this testing program. However, the position and theslope of the critical state line at zero suction were very dif-ferent to those of the critical state lines for unsaturated soilsamples. This provides further confirmation of the signifi-cant influence of suction on the fabric of the soil. The re-sults show that the specific volume at critical state is afunction of suction and mean net stress, and this has beenconfirmed by the experimental results of Wheeler and Siva-kumar (1995) and Maatouk et al. (1995). Figure 15 showsthat the critical state lines for suctions of 100, 200, and300 kPa are parallel (i.e., the value of (s) is nearly thesame at the above suctions). The value of (s) for a suctionof zero is much less than the other suctions, and the criticalstate line for the saturated soil is located below the othercurves. Therefore, for the soil tested in this study, theredoes not seem to be any anomalous position for critical stateat zero suction as reported by Wheeler and Sivakumar(1995) for kaolin. Inspection of Table 4 shows that the slope (s) of the critical state line is less than the slope �(s) of thenormal compression line at a suction of zero, whereas atsuctions of 100, 200, and 300 kPa it is greater than the �(s).The variation of (s) with suction is similar to that of �(s)as reported by Estabragh et al. (2004) (see Fig. 16). Thevalue of (s) increased with increasing suction from zerountil a suction of about 120 kPa, after which it remainednearly constant. The variation of �(s) with suction is shownin Fig. 17 and this indicates that �(s) increased with increas-ing suction. The shape of the critical state lines shown in
Fig. 15 is not consistent with the model of Alonso et al.(1990) and the results of Sivakumar (1993). Alonso et al.(1990) predicted that the critical state lines for each valueof suction would be curved (convex upward) with a slopethat tended to �(s) at high values of mean net stress. Sivaku-mar (1993) concluded, from the results of shearing tests onkaolin, that the critical state lines for higher values of suc-tion are curved and therefore cannot be parallel to the corre-sponding normal compression lines at the same values ofsuction. Wheeler and Sivakumar (1995) also concluded theexistence of curvature of the critical state lines, the fact thatthe positions of the lines do not progress in a smooth se-quence with increasing suction, and that the best form ofthe relationship is not immediately obvious. It appears that,for the samples of silt tested in this study, the assumption of
Fig. 15. Variation of specific volume (v) and mean net stress (p’) atcritical state condition.
Table 4. Values of soil parameters at critical state conditionand consolidation.
s M(s) �(s) (s) �(s) �(s) N(s)0 1.26 0 0.053 1.81 0.078 1.661100 1.14 127 0.093 2.150 0.089 1.791200 1.08 182 0.086 2.150 0.071 1.789300 0.92 253 0.085 2.164 0.055 1.765
Note: s, suction; M(s), slope of critical state line; �(s), intercept orthe apparent cohesion caused by suction; (s), slope of projection ofthe critical state line in the v – ln p’ plane; �(s), intercept (at p’ = pat);�(s), slope of the normal compression line; N(s), values of specificvolume at reference pressure.
Fig. 16. Variation of (s) with suction.
Fig. 17. Variation of �(s) with suction.
418 Can. Geotech. J. Vol. 45, 2008
# 2008 NRC Canada

linear and parallel critical state lines in the v – ln p’ planewould be reasonable. More experiments are needed to inves-tigate the transition from saturated to unsaturated conditions.
Conclusion
The concepts of critical state for overconsolidated unsatu-rated soils have been studied through a comprehensive set oftriaxial tests. The testing program included various stages ofequalization, consolidation, unloading, and shearing. Con-trolled suction drained triaxial shear tests were performedon samples of an unsaturated silty soil with different OCRsunder various suctions. The results show that the lightlyoverconsolidated samples were located on the wet side ofthe critical state line and the heavily overconsolidated sam-ples were on the dry side of the critical state line. The re-sults also show that the concepts of critical state foroverconsolidated soils, originally developed for saturatedsoils, can be extended to unsaturated soils where the matricsuction is considered to be an independent variable. Thecritical state for unsaturated soils can be expressed in termsof the following variables: deviator stress, q, mean netstress, p’, matric suction, ðua � uwÞ and specific volume, v.The unsaturated critical state lines require four parameters:M(s), �(s), �(s), and (s). All of these parameters are func-tions of suction. The critical state lines in the q:p’ space con-verged at a point with a p’ value of about 950 kPa. It wasshown that, for the soil tested, suction had no significant ef-fect on the strength of the soil for p’ values greater than950 kPa. The results also show that both M(s) and �(s) arefunctions of suction, and the variation of �(s) with suction isnot linear. These results are not supported by the results ofWheeler and Sivakumar (1995) and Alonso et al. (1990).The critical state values of v and p’ (at constant suctions)fall on straight lines in the v – ln p’ space that are nearlyparallel except for saturated conditions. These results areagain not consistent with those of Alonso et al. (1990) andWheeler and Sivakumar (1995). One of the reasons for thedifference between the results of this study and some of theresults reported in the literature could be related to the typesof soils used in the studies. The soil tested in this study wassilt, whereas most of the research on unsaturated soil hasbeen on kaolin and other clays. The behaviour of unsatu-rated soils is complex, partly because of the number of pa-rameters involved. A larger database is required to betterunderstand the behaviour of unsaturated soils.
ReferencesAlonso, E.E., Gens, A., and Josa, A. 1990. A constitutive model for
partially saturated soil. Geotechnique, 40(3): 423–439.Budhu, M. 1979. Simple shear deformation of sands. Ph.D. thesis,
University of Cambridge, Cambridge, UK.Cui, Y.J., and Delage, P. 1996. Yielding and plastic behaviour of
an unsaturated compacted silt. Geotechnique, 46(2): 291–331.Delage, P., and Graham, J. 1995. Mechanical behaviour of unsaturated
soils: understanding the behaviour of unsaturated soils requires re-liable concept models. In Unsaturated Soils: Proceedings of the 1stInternational Conference on Unsaturated Soils, Paris, 6–8 Septem-ber 1995. Edited by E.E. Alonso and P. Delage, A.A. Balkema, Rot-terdam, the Netherlands. pp. 1223–1256.
Delage, P., Surjde Silva, G.P.R., and De Laure, E. 1987. Un nouvel
appareil triaxial pour les sols non satures. Vol. 1. In Proceedingsof the 9th European Conference on Soil Mechanics and Founda-tion Engineering, Dublin, Ireland. A.A. Balkema, Rotterdam, theNetherlands. pp. 25–28.
Escario, V., and Juca, J.F.T. 1989. Strength and deformation ofpartially saturated soils. In Proceeding of the 12th InternationalConference on Soil Mechanics and Foundation Engineering, Riode Janeiro, 13–18 August 1989, A.A. Balkema, Rotterdam, theNetherlands. pp. 43–46.
Escario, V., and Saez, J. 1986. The shear strength of partly satu-rated soils. Geotechnique, 36(3): 453–456.
Estabragh, A.R., Javadi, A.A., and Boot, J.C. 2004. Effect of com-paction pressure on consolidation behaviour of unsaturated siltysoil. Canadian Geotechnical Journal, 41(3): 540–550. doi:10.1139/t04-007.
Fredlund, D.G. 1975. A diffused air volume indicator for unsatu-rated soils. Canadian Geotechnical Journal, 12: 531–539.
Fredlund, D.G. 1983. Prediction of ground movements in swellingclays. In Presentation of the 31st Annual Soil Mechanics andFoundation Engineering Conference, Minneapolis, Minn. Ameri-can Society of Civil Engineers, New York.
Fredlund, D.G., and Morgenstern, N.R. 1977. Stress state varablesfor unsaturated soils. Journal of the Geotechnical EngineeringDivision, 15(3): 313–321.
Fredlund, D.G., and Rahardjo, H. 1993. Soil mechanics for unsatu-rated soils. John Wiley Publications, New York.
Fredlund, D.G., Morgenstern, N.R., and Widgers, R.A. 1978. Theshear strength of unsaturated soils. Canadian Geotechnical Jour-nal, 31: 533–546.
Fredlund, D.G., Hasan, J.U., and Filson, H.L. 1980. The predictionof total heave. In Proceedings of the 4th International Confer-ence on Expansive Soils, Denver, Colo. Vol.1. American So-ciety of Civil Engineers, New York. pp. 1–17.
Gan, J.K.M., Fredlund, D.G., and Rahardjo, H. 1988. Determina-tion of the shear strength parameters of an unsaturated soil usingthe direct shear test. Canadian Geotechnical Journal, 25: 500–510. doi:10.1139/t88-055.
Hilf, J.W. 1956. An investigation of pore pressure in compactedcohesive soils. Technical Memorandum 654, Bureau of Recla-mation, U.S. Department of the Interior, Denver, Colo.
Javadi, A.A., and Snee, C.P.M. 2001. The effect of air flow on theshear strength of soil in compressed-air tunnelling. Canadian Geo-technical Journal, 38: 1187–1200. doi:10.1139/cgj-38-6-1187.
Khalili, N., Geiser, F., and Blight, G.E. 2004. Effective stress inunsaturated soils: Review with new evidence. International Jour-nal of Geomechanics, 4(2): 115–126. doi:10.1061/(ASCE)1532-3641(2004)4:2(115).
Loret, B., and Khalili, N. 2002. An effective stress elastic-plasticmodel for unsaturated porous media. Journal Mechanics of Ma-terials, 34(2): 97–116.
Maatouk, A., Leroueil, S., and Larochelle, P. 1995. Yielding andcritical state of a collapsible unsaturated silty soil. Geotechni-que, 45(3): 465–477.
Nishimura, T., Hirabayashi, Y., Fredlund, D.G., and Gan, J.K.-M.1999. Influence of stress history on the strength parameters ofan unsaturated statically compacted soil. Canadian GeotechnicalJournal, 36: 251–261. doi:10.1139/cgj-36-2-251.
Rampino, C., Mancuso, C., and Vinale, F. 2000. Experimental beha-viour and modelling of an unsaturated compacted soil. CanadianGeotechnical Journal, 37: 748–763. doi:10.1139/cgj-37-4-748.
Schofield, A.W., and Worth, C.P. 1968. Critical state soil me-chanics. McGraw-Hill Publication, London.
Sivakumar, V. 1993. A critical state framework for unsaturatedsoil. Ph.D. thesis, University of Sheffield, Sheffield, UK.
Estabragh and Javadi 419
# 2008 NRC Canada
Sharma, R.S. 1998. Mechanical behaviour of unsaturated highly ex-pansive clays. D.phil. thesis, University of Oxford, Oxford, UK.
Toll, D.G. 1990. A framework for unsaturated soil behaviour. Geo-technique, 40(1): 31–44.
Toll, D.G. 2000. The influence of fabric on the shear behaviour ofunsaturated compacted soils. In Advances in unsaturated soils.Reston: American Society of Civil Engineering. Edited by C.Shakelford, S.L. Hauston, and N.-Y. Chang. Geotechnical Spe-cial Publication No. 99, pp. 222–234.
Toll, D.G., and Ong, B.H. 2003. Critical-state parameters for anunsaturated residual sandy clay. Geotechnique, 53(1): 93–103.
Wang, Q., Pufahl, D.E., and Fredlund, D.G. 2002. A study of criti-cal state on an unsaturated silty soil. Canadian GeotechnicalJournal, 39: 213–218. doi:10.1139/t01-086.
Wheeler, S.J. 1988. The undrained shear strength of soils contain-ing large gas bubbles. Geotechnique, 38(1): 399–413.
Wheeler, S.J., and Sivakumar, V. 1995. An elasto plastic criticalstate framework for unsaturated soil. Geotechnique, 45(1): 35–53.
Wood, D.M. 1990. Soil behaviour and critical state soil mechanics.Cambridge University Press, UK.
Zakaria, I. 1994. Yielding of unsaturated soil. Ph.D. thesis, Univer-sity of Sheffield, Sheffield, UK.
420 Can. Geotech. J. Vol. 45, 2008
# 2008 NRC Canada