critical duration in visual brightness discrimination for retinal areas of various sizes
TRANSCRIPT
TEICHNER, KOBRICIK, AND DUSE V
related to monocular acuity by a factor, 2, or 1.414.Inspection of Table VI indicates that 1.414 is a veryrepresentative number for the ratios obtained. Thus,Berry's data, if significant, may be accounted forwithout reference to stereoscopic vision at all. Theycannot, therefore, be considered as opposing ourhypothesis.
ACKNOWLEDGMENTS
We wish to express our appreciation for the commentsand constructive criticisms given us by Dr. Kenneth N.Ogle, Mayo Foundation, and Dr. Richard N. Berry,Indiana University, in response to a pre-publicationversion of this paper. However, the authors acceptcomplete responsibility for the contents of the paper.
JOURNAL OF THE OPTICAL SOCIETY OF AMERICA VOLUME 45, NUMBER 11 NOVEMBER, 1955
Critical Duration in Visual Brightness Discriminationfor Retinal Areas of Various Sizes
WILLIAM R. BIERSDORFUniversity of Wisconsin, MIadison, Wisconsin*
(Received May 5, 1955)
In this study visual brightness discrimination was investigated for three centrally fixated incrementalareas (10 20', 50, and 190) each superimposed upon a 260 surround. Surround luminances from logI= 3.48to logl= -3.02 (millilamberts) were used. The objectives of the experiment were to find: (a) the shape of thetransition between the two theoretical conditions It=constant and I=constant as the duration of incre-mental exposure was increased, and (b) the magnitudes of the critical durations at which this transitionoccurred.
The results indicated that the transition between conditions It=constant and I=constant for centralfixation was relatively sharp, regardless of field size or luminance level. This was true for both differentialand absolute threshold determinations. The critical durations, depending upon field size, ranged from0.02-0.06 second at high luminances to as long as 0.20-0.35 second at low scotopic luminance levels. Thecurves relating critical duration to log luminance showed irregularities in the mesopic range for the twolarger fields. These irregularities were interpreted as indicating a possible transition between rod and conefunctioning in this luminance range.
INTRODUCTION
IN 1885, Bloch' demonstrated in visual stimulationthat within a limited range of durations the product
of luminance and duration must be constant to producea constant visual effect. Since that time the validityof this reciprocal relation, known as the law of Bloch orBunsen-Roscoe, has been verified by many investigators.However, it has also been found that this reciprocalrelationship holds only up to a certain critical duration,beyond which time the relationship It= constant issuperseded by the relationship I= constant.
Investigators have found either gradual or sharptransitions between these two relationships as durationof stimulation is increased. In a basic study on thesingle-fiber response of the eye of the horsehoe crabLimulus, Hartline2 found a sharp transition at thecritical duration from the relationship It= constant toI= constant. For absolute threshold studies on thehuman eye, Graham and Margaria3 and Karn4 foundthat size of area of stimulation changed the sharpness
*Present address: Army Medical Service Graduate School,Waslington, D. C.
I A. M. Bloch, Compt. rend. Soc. Biol. 2,493 (1885).2 H. K. Hartline, J. Cellular Comp. Physiol. 5, 229 (1934).3 C. H. Graham and R. Margaria, Am. J. Physiol. 113, 299
(1935).4 H. W. Karn, J. Gen. Psychol. 114, 360 (1936).
of transition, with a sharp transition obtaining onlywhen the area of stimulation was reduced to one ortwo minutes visual angle. For areas of half a degree orlarger, the shape of the curve changed quite gradually.This gradual transition they attributed to neuralinteraction and to statistical effects brought into playwhen the larger retinal areas were stimulated. On theother hand, Graham and Kemp5 and Keller6 in theirexperiments on brightness discrimination found a sharptransition for a larger area of stimulation (84-minutefield with the incremental brightness added to one-halfthe field). The question may be asked if the sharpnessof transition here is due to a difference between thefunctions of absolute threshold and brightness dis-crimination, or whether with relatively larger areas ofstimulation brightness discrimination will also show agradual transition from Iconstant to I=constant.The first objective of the present experiment was tostimulate with larger incremental areas to find outwhether the transition became less sharp.
The magnitude of the critical duration itself is alsoof interest. In their experiments on brightness discrimi-nation, Graham and Kemp' and Keller6 found that thecritical duration was an inverse function of adapting
6 C. H. Graham and E. H. Kemp, J. Gen. Physiol. 21, 635(1938).
6 M. Keller, J. Exptl. Psychol. 28, 407 (1941).
920 Vol 45
November 1955 CRITICAL DURATION IN VISUAL BRIGHTNESS DISCRIMINATION 921
uminance, and reached a maximum of nea r 0.10second with a foveal test field. The question may beasked about the magnitude at luminance levels belowthe cone threshold. Thus, a second objective of thepresent experiment was to determine critical durationsfor scotopic luminance levels using larger than fovealtest fields.
APPARATUS
The optical arrangement of the stimulator wassimilar to that described by Baker,7 consisting of twolight beams in "Maxwellian view," namely: thesurround, a circular field subtending a visual angle of260, and the incremental field superimposed on thesurround. Fixed diaphragms inserted into the incre-mental beam gave circular fields of 10 20', 50, and 190visual angle concentric with the surround. The lightsource for each beam was a 2-mm aperture in an opaquebaffle backed by ground glass which was illuminatedfrom behind by the concentrated beam from a 150-wattincandescent projection lamp. The lamp was operatedfrom a 110-volt Sola constant voltage transformer.tThe subject viewed the stimulus fields through a1.7-mm artificial pupil in the eyepiece that projectedinto a light-tight cubicle.
Central fixation for the 1 20' field was obtained bycross-hairs subtending 5 minutes visual angle stretchedacross the surround beam. Since the stimulation for thissize field was always at photopic levels, this arrangementwas satisfactory. For the 5 and 190 fields, however,the cross-hairs could not be seen when the luminancewas reduced to scotopic levels. Therefore, a fixationlight of 10 visual angle maintained at minimum intensitywas used to obtain central fixation at scotopic levels.
The durations of the incremental exposures wereprovided by rotating sector disk shutters placedimmediately in front of the 2-mm source in the incre-mental beam. One was driven at 7 revolutions persecond with a geared-down cam operating a shutterwhich allowed one flash every 2.1 seconds. An addi-tional hand-operated shutter in the beam enabled theexperimenter to present a single exposure. Using sectordisks of various angular openings, this device gaveexposures of 0.0021, 0.0044, 0.0084, and 0.016 second.A second shutter was operated by a one revolutionper second motor connected with a cam and micro-switch which turned the motor off after one revolution.With sector disks of various openings, this providedexposures of 0.058, 0.110, 0.215, and 0.540 second.
7 H. D. Baker, J. Opt. Soc. Am. 39, 172 (1949).t According to the IES Lighting Handbook,8 the expected 60-
cycle fluctuation in luminance with alternating current incan-descent lamps of the wattage used in this apparatus is about 5%.This value amounts to less than 0.03 log units, which is consider-ably less than the range of the thresholds found in the experiment.In addition, Table I shows that the variability did not system-atically decrease as exposure duration increased. For thesereasons, it was concluded that the use of alternating currentlamps did not affect the results.
8 IES Lighting Handbook (Illuminating Engineering Society,New York, 1952), second edition, pp. 8-58.
A third motor geared to one revolution every fourseconds gave exposures of 1.0 and 2.0 seconds duration.The motors and sector disks were quickly interchange-able in the incremental beam for the experimentalprocedure. The exposure durations were calibrated atthe subject's eyepiece by a photomultiplier tubeconnected through a suitable circuit to a TektronixType 512 oscilloscope possessing a long persistencescreen so that the wave form of the individual exposurescould be observed.
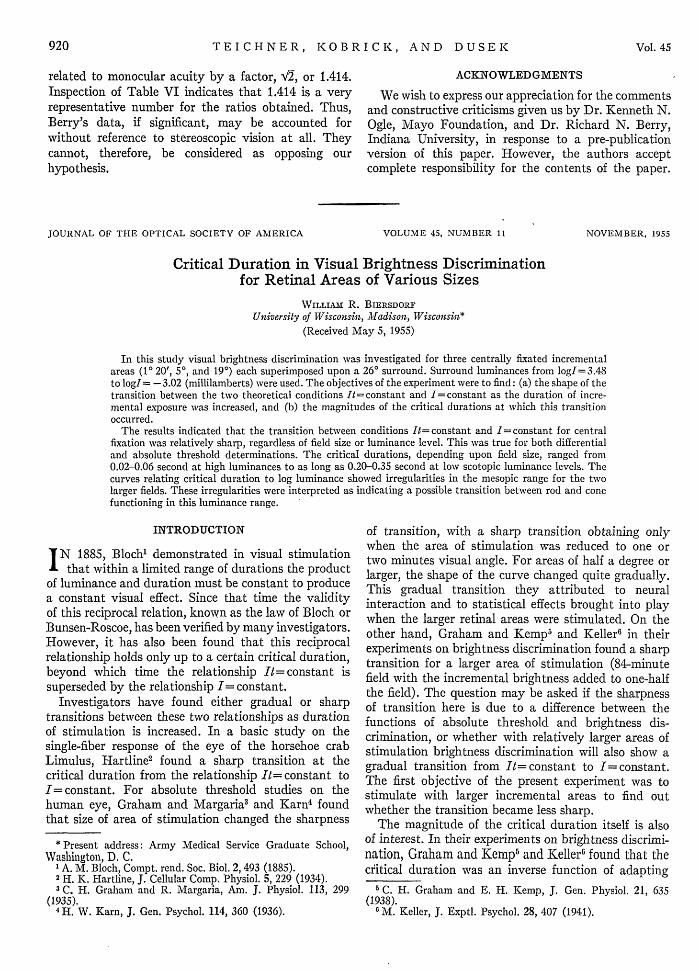
The wave forms of two of the exposures are shownin Fig. 1. All durations were measured from the mid-point of the rise to the midpoint of the decline of thewave form. The tracing of the shortest exposureduration shows it to have a rise time of 0.00012 second,or approximately 6% of the duration of the exposure.All other exposures had relatively shorter rise timesthan this, an example being the 0.016 second exposure,also shown in Fig. 1.
The luminances of both beams were varied byWratten neutral tint gelatin fixed filters. The incre-mental beam luminance was also varied by a 3.0density Wratten neutral tint gelatin wedge and balanc-ing wedge, which enabled thresholds for all durationsat one luminance level to be obtained without changingfixed filters.
The luminance of the surround was calibrated by amonocular match against a directly illuminated half-field viewed also through the artificial pupil of theapparatus. The half-field consisted of a milk-glassscreen illuminated by light from behind, and adjustedto a visual match with half the surround field. Theillumination on this half-field was measured by aMacbeth Illuminometer after removing the artificialpupil. The calibration was performed at three luminancelevels of the surround field, and gave a value of 95 000millilamberts with no filters in the surround beam.Then by split-field visual match, the incrementalfield was calibrated against the surround field and gavea value of 3450 millilamberts with no filters but withthe wedge at maximum transmission in the incrementalbeam.
PROCEDURE
All the data in one experimental session were gatheredfor one incremental field size at one luminance levelfor all ten durations of incremental exposure. The
FIG. 1. Wave forms oftwo of the incrementalexposures, as determinedby tracings from an oscillo-scope screen.
0.00012
0.0021 SEC FLASH
0.016, *i
0.016 SEC FLASH
WILLIAM R.
subject was first adapted to the luminance level to beused in the session by any necessary dark adaptation(40 minutes at the lowest luminances) and then lightadapted to the surround field for 3 to 4 minutes.Then a verbal ready signal was given, and an incre-mental exposure was presented. Thresholds wereobtained using a modified method of limits by increasingthe incremental luminance with the wedge on successiveexposures until the subject reported seeing the incre-mental field twice in succession. All subjects adopteda criterion of not reporting on the first formless barelyvisible flash, but requiring instead the appearance of atleast part of the circular incremental field during theexposure before reporting it as seen. Three thresholdswere thus obtained at one exposure duration. Then theduration of the incremental exposure was changed,and three thresholds obtained at a new incrementalduration. A session began with the shortest duration0.0021 second, and proceeded through the series tothe longest duration 2.0 seconds, then returned throughthe ten steps to the shortest duration again. Thresholdstaken during the two parts of a session did not differsignificantly. Control sessions beginning with thelongest duration, proceeding to the shortest, and thenback to the longest, also showed the same results. A
I .0
0
-1.0
-2.0
-3.0
0
-J
-5.0
-6.0
-7.0
) LMF
) 5'
2.48 . 7
0.48~04 / .
-002
- -0,52 /y /.
-1.02 ___ .
)- -*- . *- .
- -2;02 . -/
_ A./ABS.
, -3.02
-8.0I-.0 . . . .-3.0 -2.0 -1.0
LMF */
19'/ /
-. 2;. A/H
2.48 /.2 i//
.- 102 .
_.- / /
.- 3.02 / i. S.5 *
- -. 0 ABS
_. . -
0 -3.0 -2.0 -1.0L G t
1.0
0
-1.0
-2.01
_ -3.00
0 -40-J
-5.0
-6.0
7.0
- FAM
5, . 7
3 48 /
1 48/
0.48 / /
-002 /
-1.52
-2.02
-2.52 _
__. . .
-2.302_ /
_ ABSS.
-8.0 . .-3.0 -2.0 -1 .0
FAM
19° /
~~~~-./ ./- 348 / 0
248 /* / ./
._._ // /48 //~ /
O48/
*_... . ,/
_ __2./02 2 n/
/-152 */ /
-2.52
-3.02
ABS
0 -3.0 -2.0 -I 0LOG t
0
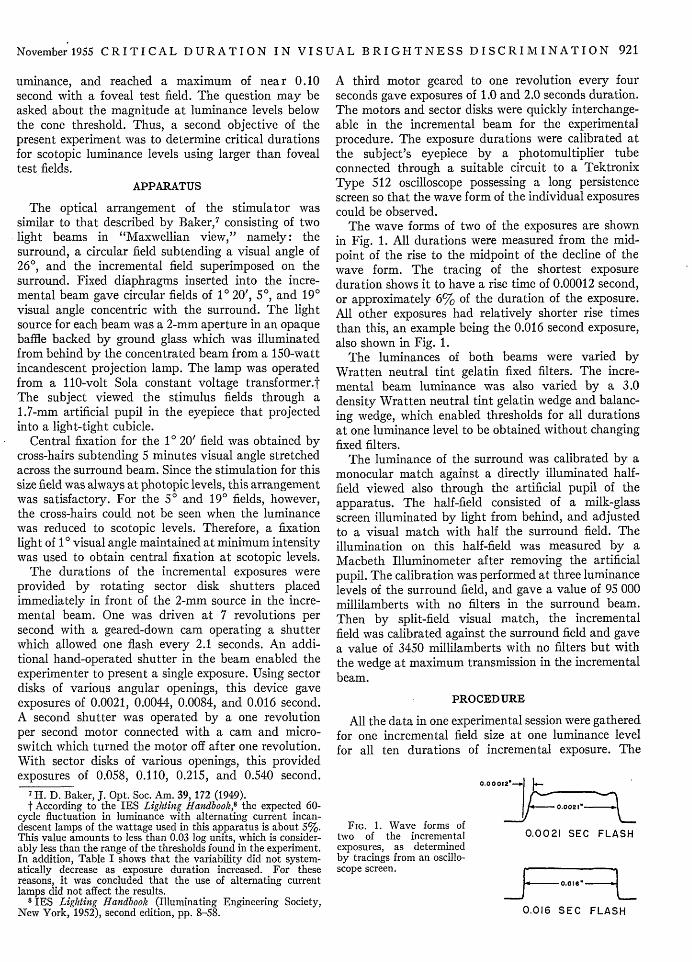
FIG. 2. Mean thresholds for subject FAM for the 50 and 190incremental area conditions. The parameter is the log luminanceof the surround. For the 5° area, the curve for log surround=0.48is plotted directly against the ordinate, while those curves aboveare lowered toward it in multiples of 0.2 (e.g., 1.48 lowered 0.2,2.48 lowered 0.4, etc.). Those curves below 0.48 are lowered awayfrom it in multiples of 0.5 (e.g., -0.02 lowered 0.5, -0.52 lowered1.0, etc.). For the 190 area, the curves are plotted similarly,except those below 0.48 are lowered in multiples of 0.4.
FIG. 3. Mean thresholds for subject LMF for the 5 and 19°incremental area conditions. Parameter and spacing same as forFig. 2.
minimum interval of 3 to 5 seconds was maintainedbetween successive exposures. In one session of lessthan an hour, six threshold determinations for each ofthe ten incremental durations were thus obtained.
Thresholds at eleven luminance levels of the surroundfrom logI (millilamberts) = 3.48 to logI= -3.02, andan absolute threshold determination were obtained forthe 5 and 190 areas. Thresholds were obtained atsix of the higher levels for the 1 20' area. For the 50and 190 areas, the fixation light was turned on at thelogI= -0.52 luminance level and kept on for all levelsbelow that. The intensity of the fixation light wasmaintained at the minimum required by the subjectfor central fixation at each luminance level.
Three subjects were used, two men and one woman,all with normal or near normal vision. Data weregathered on the preferred eye of each subject. Theauthor served as experimenter throughout theexperiment.
RESULTS
The mean threshold values for the three subjectsunder the 5 and 190 incremental area conditions arepresented in Figs. 2-4. Complete tabular data isavailable elsewhere.9 In Fig. 5 are presented the resultsfor all three subjects for the 1 20' area. Each point in
9 W. R. Biersdorf, unpublished thesis, University of Wisconsin(1954).
0......~~~~~~~~~~~
-l l l
922 BIERSDORF Vol. 45
November1955 CRITICAL DURATION IN VISUAL BRIGHTNESS DISCRIMINATION 923
TABLE I. Range of Al t at representative luminance levelsfor subject LMF on the 50 area.
(seconds) 0.0021 0.0044 0.0084 0.016 0.058 0.110 0.215 0.54 1.0 2.0LogI(ml) LogAI-t
3.48 0.07 0.12 0.08 0.08 0.07 0.08 0.12 0.07 0.09 0.05-0.52 0.12 0.17 0.13 0.08 0.13 0.08 0.09 0.08 0.08 0.06abs. 0.11 0.11 0.19 0.11 0.24 0.08 0.07 0.05 0.11 0.10
Figs. 2, 3, 4, and 5 is the mean of the six values obtainedat one session. For all results, luminance values are inmillilamberts, time is in seconds, and logarithms areto the base 10.
Table I shows the range (highest value minus thelowest) in logAI-t units of threshold values at repre-sentative luminance levels for subject LMF on the50 area. The variability for all subjects on the threeareas was similar. For the brightness discriminationthresholds the variability was nearly always less than0.20 unit, while for the absolute thresholds, thevariability was slightly higher, but less than 0.30 unit.
The straight lines in Figs. 2 to 5 are theoretical andare fitted to the data by the method of averages, i.e.,equalizing the arithmetical deviations to both sides ofthe line.10 Throughout the data the threshold valuesfor the four shortest exposure durations were used tofit lines with a slope of zero, and the values for the
1.0
0
-1.0
-5.01
-6.01
-7.0
KGB /50 /
- ./ /x OR //
1.48
48 .. /
-0.02
-0;52
.-1.02
-. 152 . /
._.02 _/ /
.-252
. ABS
.3._.*-8.0 - - 1
-3.0 -2.0 -I .0
KGB /190
.28./ //
-002 i / .
*0... /
t.I -0 2/
.02 a
3.08
A302_ /
.*. .
0 -3.0 -2.0 -1.0 0L 0 G t
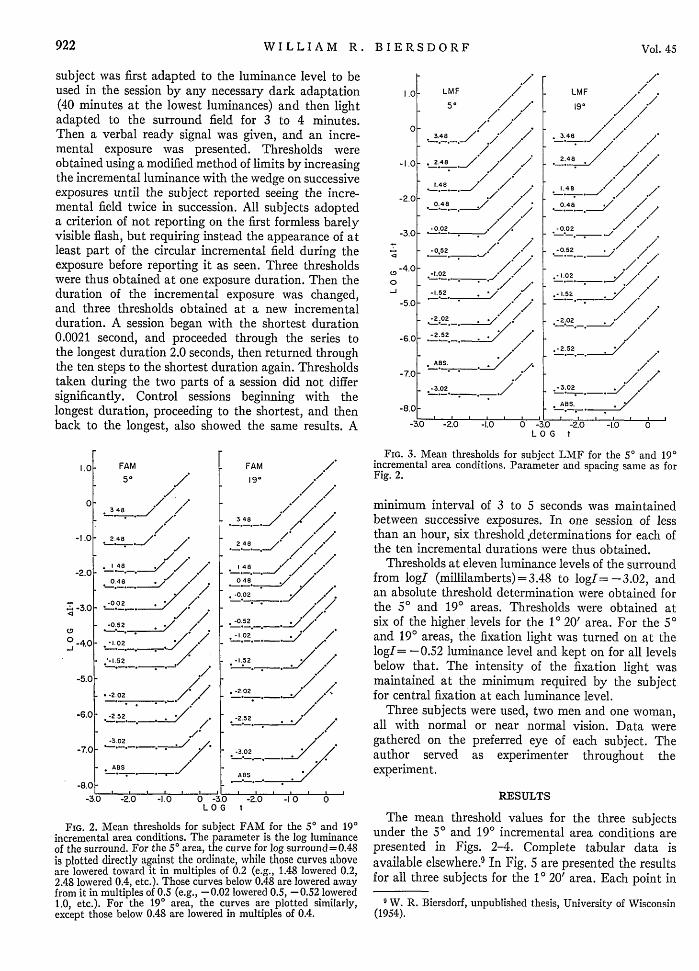
FIG. 4. Mean thresholds for subject KCB for the 5 and 19°incremental area conditions. Parameter and spacing same as forFig. 2.
10 Don Lewis, Quantitative Methods in Psychology (State Uni-versity of Iowa Bookshop, Iowa City, 1948), p. 11.
I.0
0
0-J
-2.0 .-052
-3.0 -1.52 _
-3.0 -2.0 -I
1.0
0
-. 0(2
0-' -2.0
/3/
FAM
1. 0 0 -3.0 -2.0 -1.0 0
KGB/
1[20 /
-.3.48 i.,- 2.48-.14 .- 1 4
0.48_
- . 0.52 2
_ _.__._, . I , . I I
-3.0 -2.0 -1.0 0LO G t
FIG. 5. Mean thresholds for all three subjects for the 1 20'incremental area condition. The parameter is the log luminance ofthe surround. The curves for log surround= 0.48 are plotteddirectly against the ordinate, while those curves above are loweredtoward it in multiples of 0.3 (i.e., 1.48 lowered 0.3, 2.48 lowered0.6, 3.48 lowered 0.9). Those curves below 0.48 are lowered awayfrom it in multiples of 0.3 (i.e., -0.52 lowered 0.3, -1.52 lowered0.6).
three longest durations to fit lines with a slope ofunity. The line of slope zero represents the theoreticalcondition It= constant, which prevails before thecritical duration. The line of slope unity represents thetheoretical condition I= constant, which prevails afterthe critical duration.
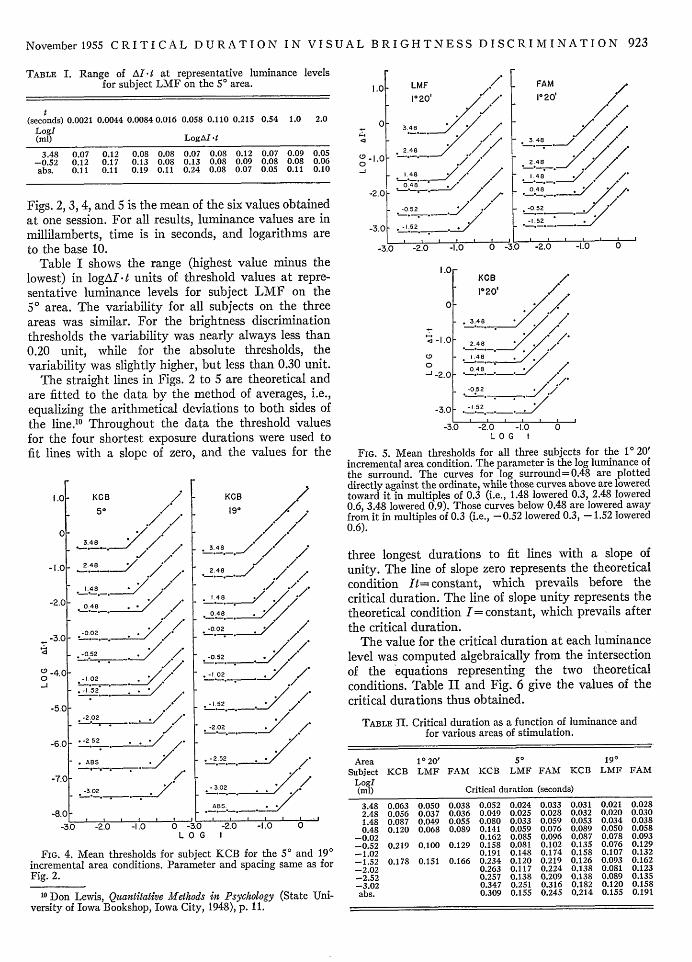
The value for the critical duration at each luminancelevel was computed algebraically from the intersectionof the equations representing the two theoreticalconditions. Table II and Fig. 6 give the values of thecritical durations thus obtained.
TABLE II. Critical duration as a function of luminance andfor various areas of stimulation.
Area 1°20' 50 19°Subject KCB LMF FAM KCB LMF FAM KCB LMF FAM
Logl(mI) Critical duration (seconds)
3.48 0.063 0.050 0.038 0.052 0.024 0.033 0.031 0.021 0.0282.48 0.056 0.037 0.036 0.049 0.025 0.028 0.032 0.020 0.0301.48 0.087 0.049 0.055 0.080 0.033 0.059 0.053 0.034 0.0380.48 0.120 0.068 0.089 0.141 0.059 0.076 0.089 0.050 0.058
-0.02 0.162 0.085 0.096 0.087 0.078 0.093-0.52 0.219 0.100 0.129 0.158 0.081 0.102 0.135 0.076 0.129-1.02 0.191 0.148 0.174 0.158 0.107 0.132-1.52 0.178 0.151 0.166 0.234 0.120 0.219 0.126 0.093 0.162-2.02 0.263 0.117 0.224 0.138 0.081 0.123-2.52 0.257 0.138 0.209 0.138 0.089 0.135-3.02 0.347 0.251 0.316 0.182 0.120 0.158abs. 0.309 0.155 0.245 0.214 0.155 0.191
-3.01
(2
0
-
, . .. . . . . . . .
-3.0I
-2.0
-4.6
WILLIAM R. BIERSDORF Vol. 45
19° 50
.vv -3 -2 -I 0 1 2 3 -3 -2 -I 0 1 2 3
LO G I
1a20
-I 0 1 2 3
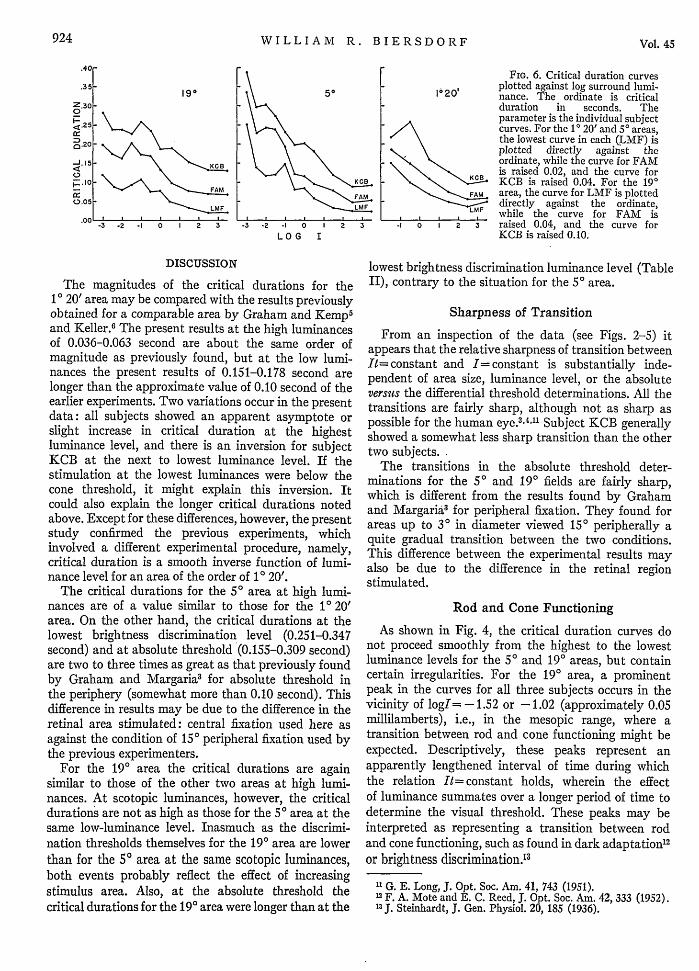
FIG. 6. Critical duration curvesplotted against log surround lumi-nance. The ordinate is criticalduration in seconds. Theparameter is the individual subjectcurves. For the 1 20' and 50 areas,the lowest curve in each (LMF) isplotted directly against theordinate, while the curve for FAMis raised 0.02, and the curve forKCB is raised 0.04. For the 190area, the curve for LMF is plotteddirectly against the ordinate,while the curve for FAM israised 0.04, and the curve forKCB is raised 0.10.
DISCUSSION
The magnitudes of the critical durations for the10 20' area may be compared with the results previouslyobtained for a comparable area by Graham and Kemp5
and Keller.6 The present results at the high luminancesof 0.036-0.063 second are about the same order ofmagnitude as previously found, but at the low lumi-nances the present results of 0.151-0.178 second arelonger than the approximate value of 0.10 second of theearlier experiments. Two variations occur in the presentdata: all subjects showed an apparent asymptote orslight increase in critical duration at the highestluminance level, and there is an inversion for subjectKCB at the next to lowest luminance level. If thestimulation at the lowest luminances were below thecone threshold, it might explain this inversion. Itcould also explain the longer critical durations notedabove. Except for these differences, however, the presentstudy confirmed the previous experiments, whichinvolved a different experimental procedure, namely,critical duration is a smooth inverse function of lumi-nance level for an area of the order of 1 20'.
The critical durations for the 5 area at high lumi-nances are of a value similar to those for the 1 20'area. On the other hand, the critical durations at thelowest brightness discrimination level (0.251-0.347second) and at absolute threshold (0.155-0.309 second)are two to three times as great as that previously foundby Graham and Margaria3 for absolute threshold inthe periphery (somewhat more than 0.10 second). Thisdifference in results may be due to the difference in theretinal area stimulated: central fixation used here asagainst the condition of 150 peripheral fixation used bythe previous experimenters.
For the 190 area the critical durations are againsimilar to those of the other two areas at high lumi-nances. At scotopic luminances, however, the criticaldurations are not as high as those for the 50 area at thesame low-luminance level. Inasmuch as the discrimi-nation thresholds themselves for the 190 area are lowerthan for the 50 area at the same scotopic luminances,both events probably reflect the effect of increasingstimulus area. Also, at the absolute threshold thecritical durations for the 19° area were longer than at the
lowest brightness discrimination luminance level (TableII), contrary to the situation for the 50 area.
Sharpness of Transition
From an inspection of the data (see Figs. 2-5) itappears that the relative sharpness of transition betweenI= constant and I=constant is substantially inde-pendent of area size, luminance level, or the absoluteversus the differential threshold determinations. All thetransitions are fairly sharp, although not as sharp aspossible for the human eye.3 4 -"1 Subject KCB generallyshowed a somewhat less sharp transition than the othertwo subjects.
The transitions in the absolute threshold deter-minations for the 5 and 190 fields are fairly sharp,which is different from the results found by Grahamand Margaria3 for peripheral fixation. They found forareas up to 3 in diameter viewed 150 peripherally aquite gradual transition between the two conditions.This difference between the experimental results mayalso be due to the difference in the retinal regionstimulated.
Rod and Cone Functioning
As shown in Fig. 4, the critical duration curves donot proceed smoothly from the highest to the lowestluminance levels for the 5 and 190 areas, but containcertain irregularities. For the 190 area, a prominentpeak in the curves for all three subjects occurs in thevicinity of logI= -1.52 or -1.02 (approximately 0.05millilamberts), i.e., in the mesopic range, where atransition between rod and cone functioning might beexpected. Descriptively, these peaks represent anapparently lengthened interval of time during whichthe relation I= constant holds, wherein the effectof luminance summates over a longer period of time todetermine the visual threshold. These peaks may beinterpreted as representing a transition between rodand cone functioning, such as found in dark adaptationsor brightness discrimination. 3
"G. E. Long, J. Opt. Soc. Am. 41, 743 (1951).12 F. A. Mote and E. C. Reed, J. Opt. Soc. Am. 42, 333 (1952).13 J. Steinhardt, J. Gen. Physiol. 20, 185 (1936).
.40
.35
Z.300< .25
Dx 20
.15
0
C. .050.00
924
November1955 CRITICAL DURATION IN VISUAL BRIGHTNESS DISCRIMINATION 925
The curves for the 5 area are more variable, butalso suggest the interpretation of a rod-cone transition.All three curves for this area show an apparent slightdepression at logI= -0.52, which may be due to theeffect of turning on the fixation light at this luminancelevel. This same effect also appears in some but not allthe subjects' data for the 19° area. The magnitudes ofthe critical durations also rise to high values at theabsolute threshold for the 50 and 190 areas.
SUMMARY
A review of the literature revealed the need forfurther examination of certain aspects of the criticalduration in brightness discrimination. The criticalduration is the time interval at which a transitionoccurs between the theoretical conditions It -constant
and 1= constant for the visual threshold. Two aspectswere investigated: (a) the abruptness of transitionbetween the theoretical conditions, and (b) the magni-tude of the critical duration at scotopic luminanceswhen rod regions were stimulated.
The apparatus provided a 26° surround and threesizes (10 20', 5, and 190) of centrally fixated incre-mental fields in Maxwellian view. Brightness discrimi-nation thresholds at eleven luminance levels of thesurround ranging from logI(millilamberts)=3.48 tologI= -3.02 and an absolute threshold determination
were obtained for the 50 and 190 fields. Discriminationthresholds were obtained at six of the higher luminancelevels for the 1 20' field. The durations of incrementalexposure were varied from 0.0021 to 2.0 seconds.Three subjects were used.
The results indicated that:
1. The transition between the condition It= constantand = constant for central fixation was relativelysharp regardless of field size or luminance level. Thiswas true for both differential and absolute thresholddeterminations.
2. The critical durations depending upon field sizeranged from 0.02-0.06 second at high luminances toas long as 0.20-0.35 second at low scotopic luminancelevels.
3. The curves relating critical duration to logluminance showed irregularities in the mesopic rangefor the two larger fields. These irregularities wereinterpreted as indicating a possible transition betweenrod and cone functioning in this luminance range.
ACKNOWLEDGMENTS
The author wishes to express his appreciation toProfessor F. A. Mote, Professor C. S. Bridgman, Dr.H. Leibowitz, Lyman M. Forbes, and Kathryn Biers-dorf for their valuable advice and assistance.