critical analysis of the first severn · pdf filein 1945 a report on the severn barrage scheme...
TRANSCRIPT

Figure 1: First Severn Suspension Bridge
CRITICAL ANALYSIS OF
THE FIRST SEVERN BRIDGE
Siobhan Gordon1
13
rd Year MEng Civil Engineering Undergraduate, University of Bath
Abstract: This paper provides a critical analysis of the First Severn Bridge between England and Wales over
the River Severn Estuary. With a high emphasis on construction methods and loadings that occur on the bridge
as well as looking into how the bridge has been maintained and improved since its original opening in 1966.
The First Severn Bridge was the first aerodynamically designed deck on a suspension bridge and marked a new
economic era and gateway to South of Wales.
Keywords: Severn Crossing, Suspension Bridge, Lightweight, and Aerodynamic Deck
1 Introduction
1.1 Brief background
Opened September 8th 1966 the design of the
Severn Bridge was a revolutionary concept, being the
longest single-spanning suspension bridge in the world
on its opening, and praised as the mark of an new
economic era, due to opening up a fast link between
England and South Wales.
It is sited at a mile wide crossing between England
and Wales, where ferries had previously been in
operation for over 800 years. The Severn is renowned
for its treacherous crossing with the second largest tidal
range in the world.
In 1945 a report on the Severn Barrage
Scheme was prepared for the Ministry of Fuel and
Power this was primarily a power scheme to provide
electricity but also featured a road crossing. As a result
the Ministry of Transport assumed responsibility for
the project to bridge the Severn under the 1936 Trunk
Roads Act, and in November of the following year
Mott, Hay& Anderson and, Fox & Partners were
engaged as Joint Consulting Engineers. Ref [1]
However construction of the bridge was
delayed due to the start of the Second World War in
1937, and priority given to the Forth Road Bridge
resulting in the original Severn Bridge designs being
implemented on the Forth instead.
In May 1962 a contract for the superstructure
was finally approved so work on the redesigned main
structure could commence. With the pier foundations
and anchorages already begun construction in 1961.
The Severn bridge was officially opened on
the 8th
September 1966, carried the M4 until the
opening of the Second Severn Crossing in 1996, when
the crossing road was renamed the M48 and resultantly
becoming a more minor crossing.
Proceedings of Bridge Engineering 2 Conference 2010
April 2010, University of Bath, Bath, UK
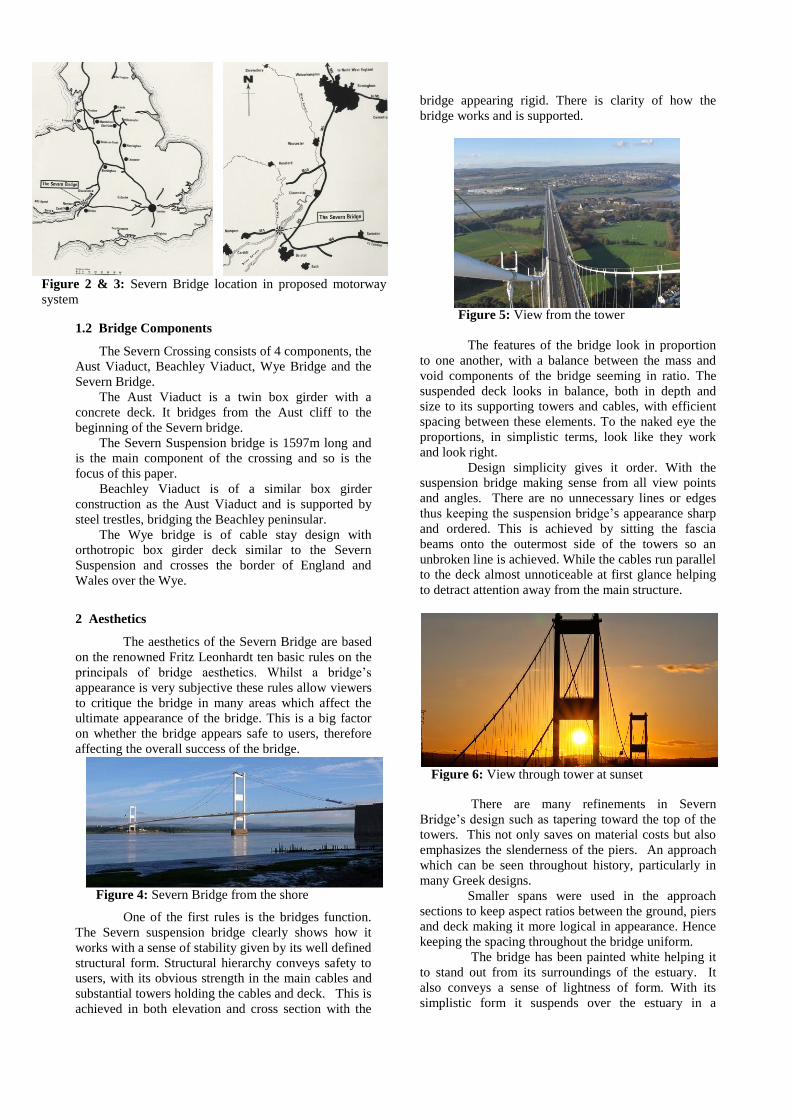
Figure 2 & 3: Severn Bridge location in proposed motorway
system
Figure 4: Severn Bridge from the shore
Figure 5: View from the tower
Figure 6: View through tower at sunset
1.2 Bridge Components
The Severn Crossing consists of 4 components, the
Aust Viaduct, Beachley Viaduct, Wye Bridge and the
Severn Bridge.
The Aust Viaduct is a twin box girder with a
concrete deck. It bridges from the Aust cliff to the
beginning of the Severn bridge.
The Severn Suspension bridge is 1597m long and
is the main component of the crossing and so is the
focus of this paper.
Beachley Viaduct is of a similar box girder
construction as the Aust Viaduct and is supported by
steel trestles, bridging the Beachley peninsular.
The Wye bridge is of cable stay design with
orthotropic box girder deck similar to the Severn
Suspension and crosses the border of England and
Wales over the Wye.
2 Aesthetics
The aesthetics of the Severn Bridge are based
on the renowned Fritz Leonhardt ten basic rules on the
principals of bridge aesthetics. Whilst a bridge’s
appearance is very subjective these rules allow viewers
to critique the bridge in many areas which affect the
ultimate appearance of the bridge. This is a big factor
on whether the bridge appears safe to users, therefore
affecting the overall success of the bridge.
One of the first rules is the bridges function.
The Severn suspension bridge clearly shows how it
works with a sense of stability given by its well defined
structural form. Structural hierarchy conveys safety to
users, with its obvious strength in the main cables and
substantial towers holding the cables and deck. This is
achieved in both elevation and cross section with the
bridge appearing rigid. There is clarity of how the
bridge works and is supported.
The features of the bridge look in proportion
to one another, with a balance between the mass and
void components of the bridge seeming in ratio. The
suspended deck looks in balance, both in depth and
size to its supporting towers and cables, with efficient
spacing between these elements. To the naked eye the
proportions, in simplistic terms, look like they work
and look right.
Design simplicity gives it order. With the
suspension bridge making sense from all view points
and angles. There are no unnecessary lines or edges
thus keeping the suspension bridge’s appearance sharp
and ordered. This is achieved by sitting the fascia
beams onto the outermost side of the towers so an
unbroken line is achieved. While the cables run parallel
to the deck almost unnoticeable at first glance helping
to detract attention away from the main structure.
There are many subtle refinements used on the
There are many refinements in Severn
Bridge’s design such as tapering toward the top of the
towers. This not only saves on material costs but also
emphasizes the slenderness of the piers. An approach
which can be seen throughout history, particularly in
many Greek designs.
Smaller spans were used in the approach
sections to keep aspect ratios between the ground, piers
and deck making it more logical in appearance. Hence
keeping the spacing throughout the bridge uniform.
The bridge has been painted white helping it
to stand out from its surroundings of the estuary. It
also conveys a sense of lightness of form. With its
simplistic form it suspends over the estuary in a
Figure 1: Severn Bridge in
proposed motorway system

Figure 2: Severn Bridge in
proposed motorway scheme
Figure 7: View of deck
striking effortless way without over powering the
surrounding area. It stands out but only with elegance
and grace.
3 Design
Despite completion just 2 years after the Forth
Road Bridge and built using the same consortium and
consultancy, even though it is of comparable size and
appearance the design of the Severn Bridge is
markedly different.
3.1 Deck
The development of the Severn Suspension
Bridges deck came about by accident. It was originally
proposed to use a stiffened truss lattice, similar to that
used on the Forth Road Bridge, however during wind
tunnel testing the model broke. Whilst a new model
was being constructed alternative shapes where tested,
leading to the development of the aerodynamic box
deck. Ref [2]
The re-modified deck shape led to the removal of
the impractical deck kerb, and placement of open
handrails and crash barriers to reduce wind effects as
much as possible to continue the lines of the deck and
flow of wind over it.
Testing and calculations showed that the deck was
stable in all wind speeds and angles of inclination.
However wind tunnel test predicted that oscillation
might occur under certain condition if structural
damping coefficient was less than 0.05.
3.2 Inclined Hangers
Due to the box deck being completely welded no
dampening effects could be expected in the deck. So
inclined hangers were incorporated into the design in
order to absorb the excess energy built up in the deck
thus reducing vibrations and resulting in only a 5-10%
in deck bending stiffness.
Two parts of each hanger are inclined to form a
triangulated system. The hangers situated near the
centre span have separate connections to the deck due
to the overstress that could be caused as a result of
longitudinal movement. The inclined angles are
specific to each section so that each hanger is equally
stressed and capable of taking the required loads.
3.3 Towers
Each tower leg is designed as simple rectangular
tubes formed from 4 stiffened plates, a step away from
the large box component towers of the Forth Road
Bridge. This design greatly reduces wind forces on the
towers, and results in a more efficient use of materials
with towers weighing 50% less than comparable
suspension bridges of similar spans.
3.4 Summary of Design
Like any suspension bridge the load bearing
elements are hung from the suspension cables which
are anchored to the ground. The development of the
box deck enables it to carry only bending forces
providing stiffness to the system, with the closeness of
the hangers allowing concentrated loads to be spread
between them.
The final design centred on the box girder deck,
has the advantage of lightness, more efficient area for
services and bridge components and wind effect where
1/5 of that experienced on the Forth Road Bridge. The
lightness of the suspended structure meant a reduction
in materials so causing a decrease in cable tension and
stiffness in the system as a whole.
4 Geometry
The suspension bridge spans a total distance of
1598m, with the main suspended deck spanning 988m
as seen in figure 9, making it the longest spanning
suspension bridge of its time.
Figure 8: Model of deck in wind tunnel
Figure 9: Elevation of the Severn Bridge

One of the main features of the Severn Bridge that
makes it stand out compared to other suspension
bridges built around the same period i.e. The Forth
Road Bridge is the construction of its suspended deck.
The deck in figure 10 consists of a hollow steel
box 3m deep and 23m wide with feathered edges and a
cantilevered footway and cycle track on each side. This
shape results in a smooth aerodynamic flow of air and
resistance to wind
The steel towers shown in figure 11 consist of 2
rectangular legs joined by three crossing members. The
rectangular towers taper gradually along the 122m high
distance they reach from their concrete piers. Each leg
is comprised of 4 stiffened high tensile steel plates 17m
in length. The design of the towers allows half the
weight of steelwork to be used in the Severn towers
than in the Forth.
5 Site conditions
Situated on a 1 mile wide stretch of the Severn it is
sited at a bottle neck section of the river. With areas
down and upstream of the site widening to 2 miles,
creating currents capable of reaching 4.1ms-1
during
spring tides. In addition the Severn experiences the
second largest tidal range in the world with neap tidal
ranges of 5.5m, and ordinary spring tides reaching
13m, and 14.6m on extreme spring day. These
conditions of flow have the advantage of stopping the
formation of any alluvial deposits at site; however
make construction in the area very difficult and heavily
dependent on the tidal periods and flow of the river.
A 21 borehole study was carried out to indicate the
geological makeup of the site shown in figure 13, it
showed that lots of carboniferous limestone was found
on the surface of the South Eastern Side of the Severn
site, on the North Eastern side the rock was overlain by
Keuper Marl up to 55m thick in places. Ref [2]
The location for Aust Pier was chosen to be
centred on this South Eastern outcrop of limestone
rock, which is uncovered in extremely low tides, with
the Beachley Pier located on the Keuper Marl rock to
the North East 988m across from the Aust pier.
Additional bore holing was carried out once the
site was decided, up to 6m below foundation depth on
the Aust side and 15m on the Beachley pier site, to
check the geological stabilities of the chosen site. i
6 Construction
6.1 Material and Cost
In table 1is a breakdown of the steel that make
up the main superstructure and the cost to the value of
the materials and labour at the time of construction.
Table 1: Quantity of steel work in superstructure and
cost
Section Amount Cost
Tower 2360 tones £476000
Splay, saddles +
anchors 312 tones £77000
Suspended
structure 11300 tones £1394000
Protective
treatment external 162000sq yards £336000
Protective
treatment internal 231000sq yards £587000
Cable wrapping
wires, cable bands,
suspenders
4710 tones £47000
Total £2,917,000
Figure 11: Cross section of tower
Figure 10: Cross section of deck
Figure 12: Site plan of Severn Estury
Figure 13: Geological section through centre line
of site

Figure 14: Beachley pier Figure 15: Aust pier
From left to right;
Figure 16: Climbing structure in Aust tower
Figure 17: First tower plates for bridge erection
Figure 18: Completed Beachley tower erection
Total construction cost amounted to £5,097,000
and took 4 years. The resulting build surmounted to
£8,014,000, making the new design for the Severn
Suspension Bridge £800,000 less than the original
design. Ref [2]
Savings were also made on maintenance costs due
to the reduced area of exposed steel in the box design
and better access to repainting. Further money could
have been saved on the foundations and anchorage due
to the reduced dead loads of the new design; however
these where implemented before the final box structure
designs were finished.
6.2 Anchorage
Due to the physical conditions of the site
tunnelling anchorage was deemed uneconomical, so
gravity anchorage was used. The gravity anchors are
composed of reinforced concrete walls enclosing a
splay chamber where 19 cable strands fan out to a
rectangular pattern. Ref [3]
The Aust anchor due to its position gave a tidal
range which resulted in 6 workable hours at low tide.
The foundations were therefore constructed by
excavation of the area to 2.5m removing all unsound
rock, which was then back filled with concrete. An
external shell was then built to a height 9m above high
tide levels creating a gravity dam. The anchorage was
then cast insitu in 54 sections forming the final anchor.
Ref [3]
The Western Anchor main foundations consisted
of 2 trenches 42m long by 10.6m wide at 23m centres.
They were dug through 6m of gravel and 12m Marl to
the Limestone base. The anchors where lined in the
trenches casting the concrete insitu and then inserting
the reinforcement throughout the anchorage and back
filling with the remaining concrete.
6.3 Towers
The towers were built as free standing structures
tied to the base by wire rope. To erect each tower a
climbing structure was devised carrying a 32 ton
capacity crane. The structure was built in stages with
17 metre sections of steel work added, until the
required 122m was reached. The crane remained for
the rest of the bridge construction.
The winch of the structure was achieved by an
arrangement of hydraulic jacks enabling the structure
to hoist itself, climbing 17m in 6 hours. Rollers were
needed in the tower faces to counteract the unbalanced
force resulting from the winching of the tower
components.
Lifts where installed as soon as possible enabling
framing to be extended as each tower progressed, and
to carry workers safely to various points of the tower.
The towers steelwork was fabricated to a fine
specification off site and then transported to site on
specialist barges. These methods was chosen in order
to avoid double handling of components and reduce the
amount of materials needing to be stored on site,
ultimately reducing costs and making the construction
sequence more methodical and time saving.
Due to tides and water level variations in the
estuary the erection sequence had to be timed carefully
to avoid interruption of work. At later stages in the
tower construction it was also necessary, for safety, to
halt work when wind speeds where more than 10mph.
When the towers where finally erected deflection
at the top of the towers, due to erecting loading,
amounted to 0.1m shoreward, this increased to a
further 0.9m due to tensions in the suspension wires.
This was rectified so extra deflection was calculated to
give the towers a vertical position on final completion.
Ref [1]
6.4 Cables
Cable spinning was used to produce the main
suspended cables. This is a process whereby a number
of single wires are laid parallel to each other then
compacted into a large bundle, when in the correct
position. Due to site difficulties the main cables were
brought across by lying out on the riverbed, under
water, and then hauled to the tower top. Set tides were
needed for this process taking 3 day to be completed
once hauling commenced.
After the first cables where stretched out and
attached to the anchors the remaining cables were
pulled into place by haulage wire and adjusted to the

Figure 19: Cable measurements prior to banding
Figure 20: Cable spinning wheel
Figure 19: Cable measurements prior to banding
Figure 20: Cable spinning wheel
Left to right:
Figure 23: Deck section being lifted
Figure 24: First section being manoeuvred into position
Figure 25: Underside of main span
correct sag ratio and then fixed in the supporting frame
of the tower and anchorage.
An overhead tram system was erected on the
supporting cables and unreelers were then laid 2 wires
at a time over a series of counter weights shelves
finishing in the anchor pits where the cables where
fixed. Counter weights were used to keep an even
tension and maintain the necessary sag in the wire
using both live and dead wires throughout the
superstructure. At the saddles the wires are adjusted to
the correct position using a winching system.
On completion compacting machines mounted
the cables forcing the wires into circular sections with
temporary galvanised steel bands placed around the
cables as they are compacted together, in order to
retain their shape and exclude the weather.
Suspenders were then attached to the
underside of the cable bands and to the suspended
structure diagonally.
6.5 Suspended Spans
Due to the deck shape it was able to float on
water. The 88 sections, which make up the spanning
deck, were assembled on the riverbank and sailed in
the from a local shipbuilding yard.
A special launching barge was developed for
the tasks of towing the deck sections to within 1m of
the designated position. It then held them there, for
approximately 10minutes, in the fast flowing estuary,
as they were winched into place. Getting the sections
into the required positions was heavily dependent on
the tides, with neap tidal range giving the ideal criteria
for the launching. Two week intervals were taken
between each major launching phase managing to erect
3-6 section in a period. [Ref 1]
The sections were lifted from the two main
suspension cables using a winching system sited on
either tower platform. To avoid unequal lifting only
two lift positions were available on each deck section.
However the two end sections couldn’t be winched
directly upwards due to sections being present on either
side. They were therefore slid into place at an angle.
When the weight of the section was taken by
the winch it was raised 7.5m, for washing, by a power
hose on the barge below. It was then winched the
remaining 30.5m to its required position and attached
and welded to the previous section.
Erection began at the centre of the main
suspension span and commenced toward each tower
equally. Initially the main spanning cables were 10m
above their final position, but as the erection
progressed the cables lowered and the steelwork
straightened into their final positions.
6.6 Finishing items
Once the main structure was erected and
welded, the road surfacing began along with the
erection of crash barriers, parapets, and lighting. All
external surfaces were then shot blast sprayed with zinc
and given two coats of finishing paint.
The construction took three years to complete.
It ran 5 months ahead of schedule, despite adverse
weather conditions during construction.
Figure 21: Transporting cable parts on gantry
Figure 22: Cables being compacted
Figure 26: Final painting of main cable
7 Loadings
Loading has been calculated to BS5400 part 2
standards despite it being designed to the older BS153
(2) standards. This is done in order to analyse the
bridge performance to the increase in max HGV
vehicle size from 24 tonnes to 44 tones. It will also
highlight the durability issues present in the bridge
today, which will be discussed in a later section of
changes.
BS5400 codes use the limit state philosophy
checking it to Ultimate limit state (ULS) and
serviceability limit state (SLS).
The most important loads to consider are:
Dead loads
Super-imposed dead loads
Live traffic loads
Wind
Temperature
The following loading cases are applied to the
partial load factors and safety factors to ensure the
bridge is structurally sound.
Table 2: Applicable Partial factors. Ref [4]
SLS ULS
Loading case fl f3 fl f3
Dead 1.00 1.10 1.05 1.10
Super-imposed load 1.20 1.10 1.75 1.10
Live 1.00 1.10 1.30 1.10
Wind 1.00 1.10 1.10 1.10
Temperature 1.00 1.10 1.00 1.10
The following loading combinations need to be
checked at both SLS and ULS;
All permanent load + primary live loads
Combination 1 + wind, and if erection
considered, temporary erection loads
Combination 1 + temperature and if erection
considered, temporary loads
All permanent loads plus secondary live loads
and associated primary live loads
All permanent loads plus loads due to friction
at supports Ref [5]
7.1 Dead and Super-imposed dead loads
Dead loads are in reference to the
superstructure of the bridge. Table shows the total
uniformly distributed load, which has then been
factorised with safety, ULS and SLS factors.
Table 3: Dead loads of bridge
Elements Load
(kN/m)
SLS Load
(kN/m)
ULS load
(kN/m)
Steel work 64.8 71.3 74.8
Cables 24.6 27.1 28.4
Hangers 0.6 0.7 0.7
Total Dead Load 90 99.0 104.0
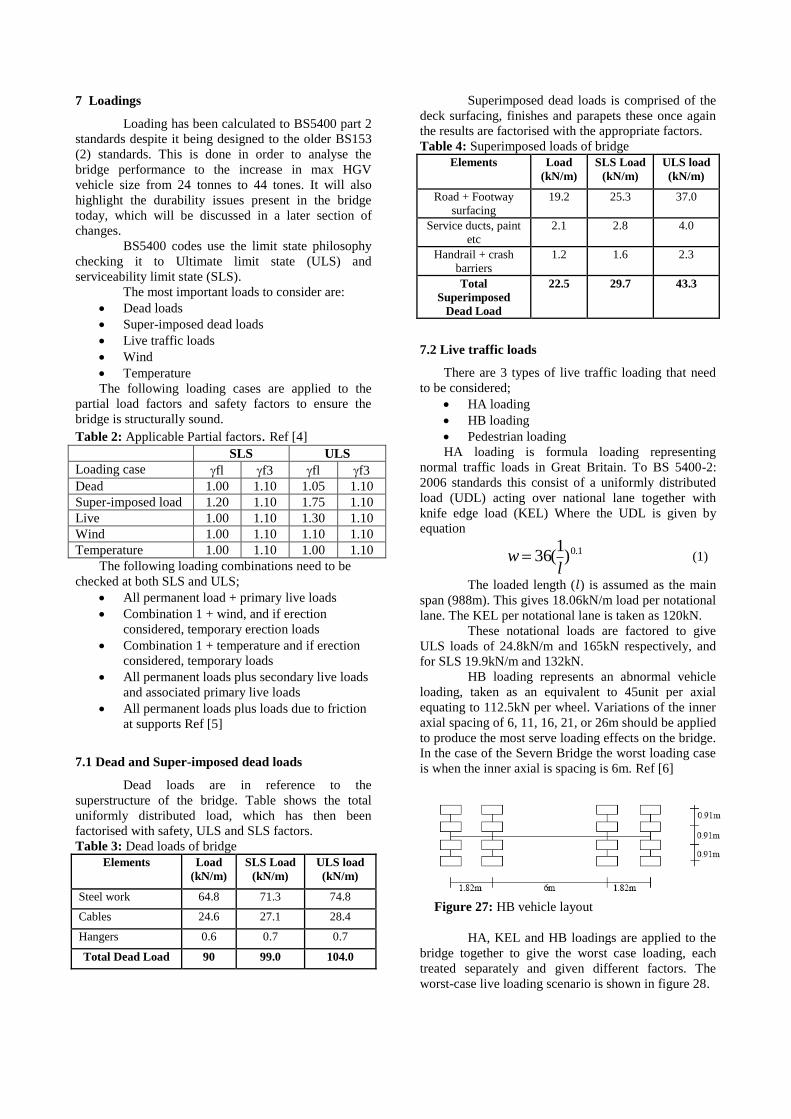
Superimposed dead loads is comprised of the
deck surfacing, finishes and parapets these once again
the results are factorised with the appropriate factors.
Table 4: Superimposed loads of bridge
Elements Load
(kN/m)
SLS Load
(kN/m)
ULS load
(kN/m)
Road + Footway
surfacing
19.2 25.3 37.0
Service ducts, paint
etc
2.1 2.8 4.0
Handrail + crash
barriers
1.2 1.6 2.3
Total
Superimposed
Dead Load
22.5 29.7 43.3
7.2 Live traffic loads
There are 3 types of live traffic loading that need
to be considered;
HA loading
HB loading
Pedestrian loading
HA loading is formula loading representing
normal traffic loads in Great Britain. To BS 5400-2:
2006 standards this consist of a uniformly distributed
load (UDL) acting over national lane together with
knife edge load (KEL) Where the UDL is given by
equation
1.0)1
(36l
w (1)
The loaded length ( ) is assumed as the main
span (988m). This gives 18.06kN/m load per notational
lane. The KEL per notational lane is taken as 120kN.
These notational loads are factored to give
ULS loads of 24.8kN/m and 165kN respectively, and
for SLS 19.9kN/m and 132kN.
HB loading represents an abnormal vehicle
loading, taken as an equivalent to 45unit per axial
equating to 112.5kN per wheel. Variations of the inner
axial spacing of 6, 11, 16, 21, or 26m should be applied
to produce the most serve loading effects on the bridge.
In the case of the Severn Bridge the worst loading case
is when the inner axial is spacing is 6m. Ref [6]
HA, KEL and HB loadings are applied to the
bridge together to give the worst case loading, each
treated separately and given different factors. The
worst-case live loading scenario is shown in figure 28.
Figure 27: HB vehicle layout

Figure 28: Worst case live loading scenario
HA UDL and KEL are multiplied by factor
applied to each notational lane along with the partial
factors. The factors are 1=1, 2=0.67, 3=0.6, and
4=0.6.
Table 5: Loads due to live loads in each lane
Notational
lane
Load
(kN/m)
ULS load
(kN/m)
SLS Load
(kN/m)
1 18.1 24.8 19.9
2 12.1 16.6 13.3
3 10.8 14.9 11.9
4 10.8 14.9 11.9
Total
Superimposed
Dead Load
51.8 71.3 57.0
Due to the cantilevered pedestrian and cycle
paths on the bridge pedestrian loading is also obtained
using equation 2.
)270
10HA Nominal(5
lw (2)
Resulting SLS and ULS load due to
pedestrians is 0.47kN/m3 and 0.61kN/m
2, respectively.
Which are minor when considering the other loading
that is occurring on the bridge.
7.3 Wind loading
Due to the exposed situation of the suspension
bridge over the Severn the wind pressures acting upon
the bridge impartially the deck are very important.
Maximum wind gust speed, , on a bridge without
live load is calculated as;
sgd VSV (3)
Where Sg is gust factor, Vs is site hourly mean
wind speed, which is found using equation 4.
dapbs SSSVV ... (4)
Basic hourly mean wind speed (Vb), is given
as 22m/s, obtained from isotach maps. Probability
factor (Sp), is 1.05 for a highway for 120-year return.
Altitude factor (Sa) is 1.05 and direction factor (Sd) is
0.93 due to the dominant wind coming from the South
West due to the proximity to the sea. These factors
result in an basic hourly mean speed for the site of
22.5m/s.
Gust factor (Sg) is dependent on terrain of the
site, which is defined by;
hgbg STSS .. (5)
Where Sb is calculated by bridge terrain factor
(Sb’) and (Kf) the fetch correction factor giving a figure
of 1.7. Reduction factor (Tg) is taken as 1 due to no
towns sited 3km up wind from bridge site, and
topography factor (Sh’) is 1, thus Sg=1.7, so giving a
maximum gust wind speed of 38.3m/s in the area.
Nominal transverse wind load Pt acting on
the deck is found by;
dt CAqP .. 1 (6)
Where dynamic pressure head, q, is given in
equation 7, resulting in a value of 1230.3N/m3
Projected area, A1, is 5434m2, drag
coefficient, (Cd), for the deck is 1.7, hence the nominal
transverse wind load acting on the deck is 11.4kN/m.
Nominal transverse wind load (Pt) acting on
piers of towers also needs to be accounted for. With
dynamic pressure staying the same, projected area
decreases to 2817m2 per tower and drag coefficient
reduces to 1.5. Resulting nominal transverse wind load
is 5.2kN/m per pier.
Nominal vertical wind loads or uplift is
another important force to calculate. The nominal force
is giving by equation 8;
Lv CAqP .. 3 (8)
Where lift coefficient is given equation 9
below;
))2.01).(20
(1(75.0 d
bCL (9)
Lift coefficient equates to 0.57, and dynamic
pressure remains the same as was found in transverse
wind loading, the projected area A3 is 31418m2. So the
uplift for the bridge is 22.0kN/m.
7.4 Temperature effects
Temperature fluctuations are an important
consideration during bridge design. Impartically
overall temperature increase or decrease which can
create stresses in the bridge deck.
The variation of temperature between day and
night will have a significant effect on expansion and
contraction of a deck on this scale.
Expansion joints are sites on the deck at each pier,
thus the effective length of the deck is 988m,with the
total effective temperature of 50C, and steel expansion
coefficient of 12x106C, the change in deck length can
be calculated
Tl .. (10)
This results of an expansion of 592mm in the
deck.
Amount of stress induced to the bridge due to
temperature difference is given by which could occur
when expansion joint become blocked is calculated
with;
ET .. (11)
2 (7)
25m 25m 9.6m
No load No load HB
HA β1 HA β1
HA β3 HA β3
HA β4 HA β4
KEL
HA β2 HA β2

Figure 30: Fuss cable strength diagram
Figure 30: Forces acting on tower
Which gives stress of 126N/mm2, this is a
manageable figure and would not result in significant
damage to the bridge if not left in this state for a
substantial length of time.
Temperature difference loading can also
occurs when the top surface of the deck is warmer than
the bottom surface, creating temperature variation in
the deck, thus causing the deck to expand and contract
non-uniformly and adding stress to the deck.
7.5 Natural frequency
Rayleigh Ritz equation for natural frequencies
states for the natural frequence of a bridge to feel
comfortable for users of the bridge it should be
between 5Hz and 75Hz. The equation is;
4
20 )(
ml
EIlf n (12)
Where (βnl)2 is 22.37 for a bridge of this type, E
for steel is 200x106, I for the deck is 25.6m
4, l is width
of the deck 31.8m, and m is dead and superimposed
load only in giving 15000kg/m. The natural frequency
of the bridge is 12.9Hz. Although within the
parameters after construction movement was felt on the
bridge and further strengthening was added to reduce
these vibrations.
8 Strength
8.1 Longitudinal bending
Calculating the bending moment in the deck it is
assumed that it is acting as a simply supported beam.
With each support sited at the tower sites, and the main
length taken as the central span so 988m.
8
2
max
wlM (13)
Where w is taken as the dead and superimposed, so
giving a Mmax as 18.0x10⁶ kNm.
However cables support the deck roughly every
23m, so the bending moment diagram will actually be
composed of a series of sagging and hogging moments
as shown below.
The max shear coeffiecient, sagging moment
The simplified method Ref [7] for finding
maximum shear, Smax, and maximum sagging and
hogging moments, Msag, Mhog, are shown below in
equation 14,15 and 16.
Smax1.143F (14)
FlMsag 77.0 (15)
FlMhog 107.0 (16)
This gives maximum shear as 168kN, and the
maximum hogging and sagging moments as 501kNm
and 3607kNm respectively. The bridge acts as
expected with the main moment caused in sagging due
to the stiffness of the deck.
8.2 Cable strength
Due to the suspension of the deck off the
cables the strength of the cables are imperative. Fuss
developed the following equation (17) to solve this
problem.
f
wLH
8
2
(17)
Where l is the span 988m, f is cable sag which
is 82.3m and, w is takes as the uniformly distributed
load, thus loading includes the weight of the cables
themselves and worst case HA and HB loading case. H
therefore equals 324MN.
Main cables are 500mm diameter consisting of 19
strands of galvanised wire 8,322 with 50mm diameter. 2rnArea (18)
Area=3.73x10⁶
Therefore stress in each cable is;
A
F (19)
This is reasonable for a bridge of this span
86.9N/mm2
8.3 Tower Strength
Compression in the tower can be found by
resolving forces. To ensure translation of cables across
tower saddle doesn’t occur, cable tension forces must
be equal between main span and approach spans.
f
L/2 wL/2
H
L/2
Sag V
H
MMax
988m
Figure 28: Bending Moment diagram
Figure 29: Hogging and Sagging bending moment
diagram

Resolve forces so;
V=120.8MN
Rough area of each tower is taken as the average
thickness and width due to tapering in the tower
varying thickness between 25-14mm and width 5.2-
3.7m. Thus average area of the tower is 0.44m2.
Therefore stress, equation 19, in towers is
273N/mm2
Euler’s buckling load for the tower is also found as
it is the most likely mode of failure it will experience,
given equation 20.
2
2
'
)(
l
EIPcrit
(20)
Where the towers I value is 2.2mm4, and effective
length is;
(21)
Giving an effective length of 115.6m and so Pcrit
as 325MN.
9 Strengthening and Remedial work
Shortly after the completion of the Severn Bridge
in 1966 there was a dramatic change in the vehicle
loading in road transport in Britain. Between 1962-
1977:
Goods moved by road measured by ton/ km
virtually doubled
Goods vehicles with gross weight over 28 tons
rose from an insignificant number to 90,000
With the Severn Bridge originally designed to HA
loading of BS 153: Part 3A, it was found that vehicle
loading for a 4 lane bridge was found to be around 20-
160% higher than the original design loadings.
Observations carried out on the bridge in the
1970s found substantial fatigue cracks occurring in the
welded joints at various points on the bridge. Also
external cracking of road surfaces around the Beachley
viaduct and Wye bridge boxes had caused ingression of
corrosion pitting of the deck plate. Also fractures of the
outer wires in some hangers, due to increased
frequency in the vicinity of the lower sockets, had
occurred. The primary cause would be due to the
passage of individual heavy goods vehicles along the
bridge.
After a further investigation was commissioned,
by the Department of Transport, the appraisal was
extended to cover other areas showing that the towers,
hangers, and deck were currently designed to too low a
safety margin.
Single lane operation was thus introduced in the
early weekday hours between 4am- 8am when heavy
goods vehicles where >25% proportion of the traffic
load travelling over the bridge. This was until the
bridge was strengthened up to the required standards.
In July 1982 it was that the full strengthening work
would cost £33 million, including entire bridge
resurfacing, estimated to take 5 years to complete.
The strengthening scheme was as below:
Reinforcement of the Severn Bridge towers,
by installing new tubular columns inside the
tower boxes, and grouting up the voids
beneath the saddle troughs, and jacking the
columns up against the saddles.
Replace all hangers with larger more type
specific ones
Larger welds implementation especially on
the slow lane which large HGV vehicles
occupy
New rocker bearings to be suspended from the
ends of the deck boxes from the towers to
allow rotation to cope with the deck
movement.
Additional stiffening inside and out of deck
box. Ref [8]
However even with these strengthening
alterations the capacity of the bridge was estimated
to have been exceeded by the mid 1990s.
Strengthening work still commenced despite this
fact due to the time period needed to develop a
new crossing as it was deemed more cost effective.
10 Future of the Severn Bridge
Since the opening of the Second Severn
Crossing in 1996 the future of the First Severn
Crossing has been uncertain. At its peak the bridge was
capable of carrying 50,000 vehicles a day, however
today it only carries 25% of the estuary crossing traffic
surmounting to 15,000 vehicles a day, this coupled
with growing maintaince costs and increased closures
due to high winds and ice forming on the hangers, has
brought the efforts of maintain the crossing into
question. References [1] WILLIAM Sir A.The Severn Bridge superstructure.
Yarm : Studio G, 1966
[2] ROBERTS Sir G. Severn Bridge: design and contract
arrangements. Proc. Instn Civ. Engrs, 1968, 41, Sept, 1-48
[3] GROWRING G. Severn Bridge: Foundations+
substructure. Proc. Instn Civ. Engrs, 1968, 41, Sept, 1-48
[4] BS 5400-2:2006. British Standards: Steel, Concrete
and Composite Bridges Part 2. BSI
[5] IBELL, T. 2008. University of Bath, Bridge
Engineering 1 Lecture Series
[6]COLGARO,J.TSCUMI,M.GULVANESSIAN,H. 2002
Designers’ guide to Eurocode 1 Action on Bridges. Thomas
Telford
[7] COBB, F. 2004. Structural Engineer’s Pocket
Book.Elsevier Butterworth-Heinemann
[8]CUNINGHAME J.R and BEALE C. Strengthening and
refurbishment of Severn Crossing. Part 4: TRRL research on
Severn Crossing. Proc.Instn.Civ.Engrs.Structs&Bldgs,
1992,94,Feb,37-49