crisis? what crisis? - amazon s3 · 2015-03-12 · crisis? what crisis? public health care...
TRANSCRIPT
Parkland Institute • June 2009
Crisis? What Crisis?Public health care affordability in Alberta

Crisis? What Crisis? Public health care affordability in Alberta
I
Contents
Acknowledgements
About the Author
About the Parkland Institute
Introduction
Section One: Healthcare Costs
Section Two: Medicare is Sustainable
Crisis? What Crisis? Public health care affordability in Alberta
by Greg FlanaganThis report was published by the Parkland InstituteJune 2009. © All rights reserved.
To obtain additional copies of the report or rights to copy it, please contact:Parkland Institute, University of Alberta11045 Saskatchewan DriveEdmonton, Alberta T6G 2E1Phone: (780) 492-8558 Fax: (780) 492-8738Web site: www.ualberta.ca/parklandEmail: [email protected]
ii
ii
iii
1
5
13

Park land Inst i tute • June 2009
I I
Park land Inst i tute • June 2009
AcknowledgementsThis report is based on research conducted for Parkland’s September 2008 report Sustainable Healthcare for Seniors: Keeping it Public. That report provides an excellent summary of seniors’ healthcare in the province of Alberta. The report details what will be necessary in the near future – the next 20 years – to maintain the optimum health and wellbeing of the province’s seniors those in the age group 65 years and older. It provides a calculus of the potential extra cost to the healthcare system on an ‘all other things constant’ basis while placing into the context of an economic analysis of affordability. It also provides analysis and recommendations on the issues of reform. Thanks to Keith Wiley, Diana Gibson, Ricardo Acuna, and David Thompson for comments on the fact sheets and this report. Also, thanks to Flavio Rojas for the layout of the report.
About the AuthorGreg Flanagan is a public finance economist based in Calgary. He has taught for 30 years in Alberta at various colleges and universities, including 17 years at Mount Royal College. He served as dean at St. Mary’s University-College from 1998 to 2002 and taught public finance (economics) at the University of Calgary in 2003. From 2003 until his recent retirement, he was assistant dean, the Faculty of Management, University of Lethbridge. He holds degrees from University of Calgary (BA Economics), York University (MES Political Economy), and the University of British Columbia (MA Economics). His research interests focus on the economics of public policy. He has served as a director on the board of Parkland Institute, Faculty of Arts, University of Alberta since its inception. He is co-author of two textbooks: Economics in a Canadian Setting, HarperCollins Publishers, 1993; and Economics Issues, a Canadian Perspective, McGraw-Hill, 1997. As well, he has authored numerous papers and articles, including Sobering Result: the Alberta liquor retailing industry ten years after privatization, published by the Canadian Centre for Policy Alternatives and Parkland Institute in June 2003.
Crisis? What Crisis? Public health care affordability in Alberta
I I I
Crisis? What Crisis? Public health care affordability in Alberta
Parkland Institute is an Alberta research network that examines public policy issues. We are based in the Faculty of Arts at the University of Alberta and our research network includes members from most of Alberta’s academic institutions as well as other organizations involved in public policy research. Parkland Institute was founded in 1996 and its mandate is to:
• conductresearchoneconomic,social,cultural,andpoliticalissuesfacing Albertans and Canadians.
• publishresearchandprovideinformedcommentoncurrentpolicyissues to the media and the public.
• sponsorconferencesandpublicforumsonissuesfacingAlbertans.
• bringtogetheracademicandnon-academiccommunities.
All Parkland Institute reports are academically peer reviewed to ensure the integrity and accuracy of the research. For more information visit www.ualberta.ca/parkland.
About the Parkland Institute

Park land Inst i tute • June 2009
IV
Crisis? What Crisis? Public health care affordability in Alberta
1
The government of Alberta has consistently used inaccurate or incomplete numbers to undermine public confidence in the sustainability of public healthcare. This report exposes the false economies used to create a sense of crisis. It illustrates the clear trends in health care spending
Section One considers the costs of healthcare in Alberta and the current data trends. It covers topics such as private verses public, explicit verses implicit costs and the impact of ageing. It also breaks out costs to show trends in different elements of health care such as hospitals, physicians, pharmaceuticals, etc. Section Two puts Alberta’s healthcare costs in perspective, using international, national, and provincial considerations of affordability. It looks at costs in the context of population growth and inflation as well as that size of the economy. The appropriate measures of ‘sustainability’ as well as the question of rising healthcare costs are addressed, while recognizing there is no right level of expenditure on healthcare.
This report is based on research conducted for Parkland’s September 2008 report Sustainable Healthcare for Seniors: Keeping it Public. That report was conducted to evaluate the situation for seniors’ healthcare in the province of Alberta. It included a strong analysis of the affordability of health care in the context of an ageing population.
The following is a summary of the key aspects of affordability that will be looked at in more depth in this report.
Sustainability
It is clear that the Alberta government is obsessed with the affordability or sustainability of the publicly funded health system. Consider the following, a typical government statement: “there is no question that long term sustainability is a major challenge of Alberta’s publicly funded health system.”
In reality, the introduction of Medicare in the 1960s stabilized Canadian healthcare expenditures, which had been on a runaway trajectory similar to the United States. Canadian innovation in public financing of health has kept healthcare affordable while the United States has continued on its escalating trajectory with largely private
funding. Sustainability is a matter of whether the people of a jurisdiction can afford a given level of care. The relevant financial
Introduction
Park land Inst i tute • June 2009
2
ratios in this analysis are healthcare expenditure to GDP, debt to GDP, and healthcare expenditure to total public expenditure.
Healthcare Expenditure to GDP
Of course, there is no standard as to what the people of a jurisdiction should spend on healthcare. This will depend on their wishes. However, national income will be the budget that limits their spending.
Alberta has the highest GDP per capita of any province, but healthcare spending in GDP terms in Alberta is low by any comparison - a fraction of the Canadian average. It is extremely low using international comparisons, and in particular in comparison to the US, which has the highest ratio of health spending to GDP in the world (60 percent higher than Canada’s).
Public healthcare expenditure in Alberta is a very low fraction of overall income, currently at approximately four percent of GDP. The current level is also low compared to the level in the mid-1990s, and has remained relatively stable over the last 10 years.
GDP in Alberta has grown at an annual rate of 4.2 percent per capita in the last decade, far outstripping the projected increase in healthcare costs of 1.32 percent. At these rates of GDP growth and healthcare expenditures, healthcare expenditures would fall in relation to GDP.
Clearly from a GDP measure of the productivity, income, and the wealth of Albertans, current healthcare expenditures are affordable and sustainable. Moreover, Albertans could spend much more on healthcare and remain low compared to other jurisdictions in Canada and abroad.
Debt to GDP
Canada is by far in the best fiscal shape of all the G8 nations, with the lowest debt/GDP ratio, one that has steadily declined in recent years with government surpluses and robust growth in GDP. With a low debt/GDP ratio Canadian healthcare expenditure (as a ratio of GDP) is easily manageable in comparison to other countries. Alberta is even better off, as it has no deficits or debt and has been running large surpluses every year since 1996. In fact, Alberta has been accumulating large net financial reserves since 1999.
Crisis? What Crisis? Public health care affordability in Alberta
3
Health Expenditure to Total Expenditures
Although healthcare spending has been rising as a proportion of the overall provincial budget, it has not been rising as a proportion of GDP. Instead, government expenditure has been cut in relation to GDP. Under Premier Klein’s tenure, government’s share of the overall economy fell from 22 percent of GDP to 12 percent - a 45 percent reduction.
Despite what government officials might argue about the sustainability or affordability of the healthcare system, the situation has now changed.
With oil prices already rebounding, Alberta’s savings and surpluses will more than adequately cover the costs. However, if Albertans decided to increase taxes there is considerable tax room to do so. Alberta is the only Canadian province without a sales tax, and in 2000 Alberta cut income taxes - mainly for the wealthiest - foregoing over $2 billion dollars a year in revenues. Although Alberta need not raise revenues to pay for healthcare improvements, it has the tax room to do so.
Thus unsustainability claims seem less a genuine concern, and more a smokescreen for a particular ideological perspective. The Klein era was one of diminishing the public sector share of the economy and attempting to reduce healthcare costs wherever possible. This effort has paid off only in demolishing or privatizing public assets, increasing the inefficiencies in healthcare, and overextending healthcare workers.
It is clear that healthcare costs will occur, and they will likely increase. Reducing public expenditure will not make them go away; it would only shift them to personal out-of-pocket expenses, for those who can afford it, and private insurance for those who have it. Or it will drive costs into the implicit realm (costs not accounted in exchanged dollars) where it increases stress on caregivers, increases absenteeism from work, and reduces productivity and GDP. Most importantly, shifting costs will undermine the highly valued universality and equity aspects of Medicare.

Park land Inst i tute • June 2009
4
Crisis? What Crisis? Public health care affordability in Alberta
5
Healthcare costs have been rising in Canada and in Alberta. This has created a whole literature on healthcare and a plethora of studies on how healthcare can be made more efficient and effective, and how we can move the system away from treatment, to one focused on wellness. Governments across the land have been declaring the unsustainably of Medicare as healthcare budgets increase and their proportion of government expenditures rise. This section of the report will outline and analyze the current state and history of healthcare costs in Alberta. The next section will consider the controversial issue of sustainability.
Amidst all of this discussion of costs it needs to be remembered that healthcare will incur costs regardless, whether through public provision or private out-of-pocket expenses and private insurance. Failure to provide adequate healthcare can cost us even more in many ways when not properly provided: debilitating illnesses, epidemics, premature deaths, and loss of productivity.
Healthcare is a ‘normal’ good and in some cases a ‘superior’ good, in the terms used in economics. This means we will want greater health the higher our incomes rise; and we may want healthcare services to increase faster than our income increases.1
Public versus Private
Our current Medicare system is relatively new.2 Hospital coverage across the nation dates to 1961, after passage of the Hospital Insurance and Diagnostic Services Act (1957), and physician care to 1971, after the Medical Care Act (1966) was passed. The relatively recent Medicare program in Canada includes public and quasi-public hospitals and mostly private physician practice, with a single payer – the government. The majority of health expenditures are paid through individual provincial public insurance programs, with federal programs for select groups, such as the armed forces and the RCMP. The federal government also makes financial contributions to the provinces for healthcare. Moving to universal comprehensive coverage in the early 1970s from a history of a fragmented mix of public and private health services was not more expensive, and stabilized expenditures as a percentage of national income.3
Healthcare Costs
1 Elasticity is often assumed to be 1, that is a 1 percent increase in income leads to a 1 percent increase in expenditure (demand). See for example: Martins, Joaquim Oliveira, Christine de la Maisonneuve, and Simen Bjørnerud, Projections of OECD Health and Long-term Care Public Expenditures, Organization for Economic Co-Operation and Development, December 2006.
2 For a brief history see Canadian Health Care System, Donna M. Wilson, editor, Edmonton: 1995.
3 Evans, Robert G. “Economic Myths and Political Realities: The Inequality Agenda and the Sustainability of Medicare, p.120, in Campbell, Bruce and Greg Marchidon, editors, Medicare Facts, Myths, Problems, and Promise, James Lorimer and Company Toronto, 2007.
SECTION ONE:
Park land Inst i tute • June 2009
6
Provinces introduced these programs in different years. Alberta’s present health system dates back to the acceptance of the hospital and medical care programs, which Alberta joined in 1972. These approximately 50/50 cost sharing programs were replaced with block transfers and grants through the Federal Provincial Fiscal Arrangements and Established Programs Act (1977). The federal government subsequently reduced overall grants and gave up ‘tax points’ to the provinces.4
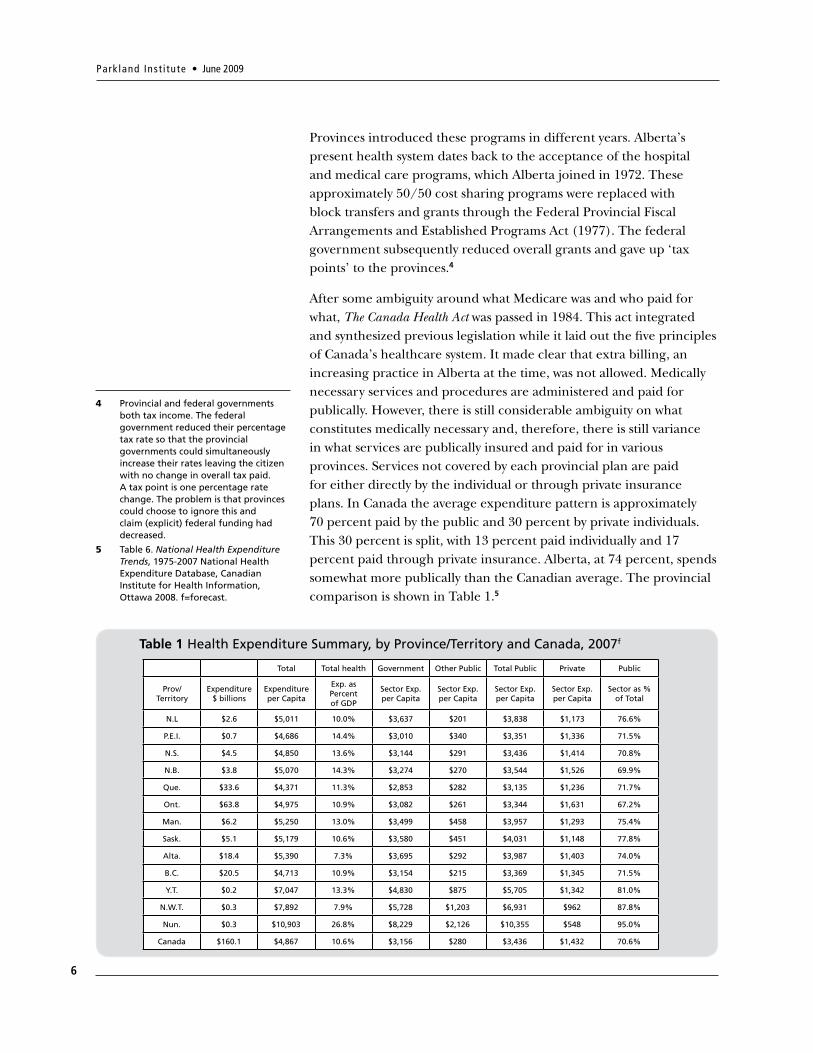
After some ambiguity around what Medicare was and who paid for what, The Canada Health Act was passed in 1984. This act integrated and synthesized previous legislation while it laid out the five principles of Canada’s healthcare system. It made clear that extra billing, an increasing practice in Alberta at the time, was not allowed. Medically necessary services and procedures are administered and paid for publically. However, there is still considerable ambiguity on what constitutes medically necessary and, therefore, there is still variance in what services are publically insured and paid for in various provinces. Services not covered by each provincial plan are paid for either directly by the individual or through private insurance plans. In Canada the average expenditure pattern is approximately 70 percent paid by the public and 30 percent by private individuals. This 30 percent is split, with 13 percent paid individually and 17 percent paid through private insurance. Alberta, at 74 percent, spends somewhat more publically than the Canadian average. The provincial comparison is shown in Table 1.5
4 Provincial and federal governments both tax income. The federal government reduced their percentage tax rate so that the provincial governments could simultaneously increase their rates leaving the citizen with no change in overall tax paid. A tax point is one percentage rate change. The problem is that provinces could choose to ignore this and claim (explicit) federal funding had decreased.
5 Table 6. National Health Expenditure Trends, 1975-2007 National Health Expenditure Database, Canadian Institute for Health Information, Ottawa 2008. f=forecast.
Total Total health Government Other Public Total Public Private Public
Prov/ Territory
Expenditure $ billions
Expenditureper Capita
Exp. as Percentof GDP
Sector Exp. per Capita
Sector Exp.per Capita
Sector Exp.per Capita
Sector Exp.per Capita
Sector as %of Total
N.L $2.6 $5,011 10.0% $3,637 $201 $3,838 $1,173 76.6%
P.E.I. $0.7 $4,686 14.4% $3,010 $340 $3,351 $1,336 71.5%
N.S. $4.5 $4,850 13.6% $3,144 $291 $3,436 $1,414 70.8%
N.B. $3.8 $5,070 14.3% $3,274 $270 $3,544 $1,526 69.9%
Que. $33.6 $4,371 11.3% $2,853 $282 $3,135 $1,236 71.7%
Ont. $63.8 $4,975 10.9% $3,082 $261 $3,344 $1,631 67.2%
Man. $6.2 $5,250 13.0% $3,499 $458 $3,957 $1,293 75.4%
Sask. $5.1 $5,179 10.6% $3,580 $451 $4,031 $1,148 77.8%
Alta. $18.4 $5,390 7.3% $3,695 $292 $3,987 $1,403 74.0%
B.C. $20.5 $4,713 10.9% $3,154 $215 $3,369 $1,345 71.5%
Y.T. $0.2 $7,047 13.3% $4,830 $875 $5,705 $1,342 81.0%
N.W.T. $0.3 $7,892 7.9% $5,728 $1,203 $6,931 $962 87.8%
Nun. $0.3 $10,903 26.8% $8,229 $2,126 $10,355 $548 95.0%
Canada $160.1 $4,867 10.6% $3,156 $280 $3,436 $1,432 70.6%
Table 1 Health Expenditure Summary, by Province/Territory and Canada, 2007f
Crisis? What Crisis? Public health care affordability in Alberta
7
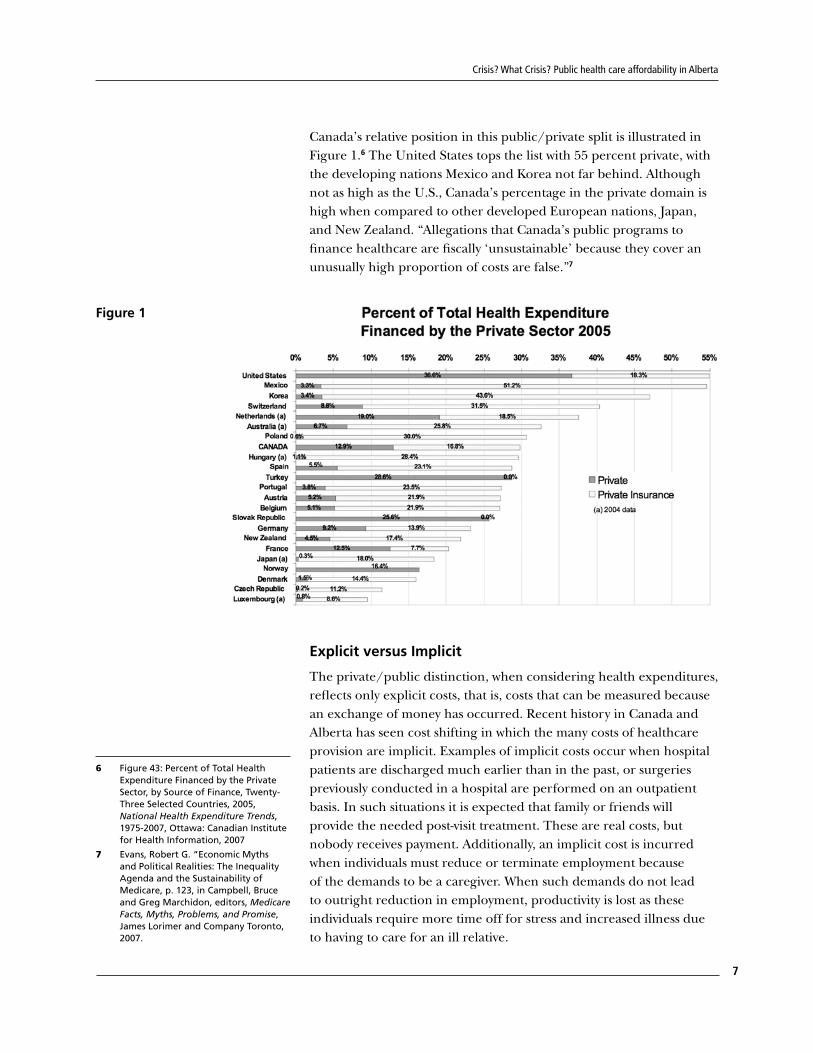
Canada’s relative position in this public/private split is illustrated in Figure 1.6 The United States tops the list with 55 percent private, with the developing nations Mexico and Korea not far behind. Although not as high as the U.S., Canada’s percentage in the private domain is high when compared to other developed European nations, Japan, and New Zealand. “Allegations that Canada’s public programs to finance healthcare are fiscally ‘unsustainable’ because they cover an unusually high proportion of costs are false.”7
Figure 1
Explicit versus Implicit
The private/public distinction, when considering health expenditures, reflects only explicit costs, that is, costs that can be measured because an exchange of money has occurred. Recent history in Canada and Alberta has seen cost shifting in which the many costs of healthcare provision are implicit. Examples of implicit costs occur when hospital patients are discharged much earlier than in the past, or surgeries previously conducted in a hospital are performed on an outpatient basis. In such situations it is expected that family or friends will provide the needed post-visit treatment. These are real costs, but nobody receives payment. Additionally, an implicit cost is incurred when individuals must reduce or terminate employment because of the demands to be a caregiver. When such demands do not lead to outright reduction in employment, productivity is lost as these individuals require more time off for stress and increased illness due to having to care for an ill relative.
6 Figure 43: Percent of Total Health Expenditure Financed by the Private Sector, by Source of Finance, Twenty-Three Selected Countries, 2005, National Health Expenditure Trends, 1975-2007, Ottawa: Canadian Institute for Health Information, 2007
7 Evans, Robert G. “Economic Myths and Political Realities: The Inequality Agenda and the Sustainability of Medicare, p. 123, in Campbell, Bruce and Greg Marchidon, editors, Medicare Facts, Myths, Problems, and Promise, James Lorimer and Company Toronto, 2007.
Park land Inst i tute • June 2009
8
As well, some costs have risen because payments for pharmaceuticals or medical devices have been pushed into ‘retail’ from ‘wholesale’. Examples of this occur when further treatment is now required outside of a hospital, where these items were provided free of charge to the patient by the hospital (which bought them at wholesale prices). This not only changes these items from a public to a private expenditure, but also raises the total cost.
The shift in treatment of seniors in Alberta, especially with respect to housing and long-term care, has changed the expenditure patterns in these ways. A case study on the change over from a nursing home to a designated assisted living facility in Hinton, Alberta is a good example of these cost shifts.8 Explicit costs have been shifted from public to private and increased as they move from wholesale to retail, and implicit costs have increased as more personal unpaid assistance is required.
Alberta Costs are Rising
Healthcare spending was cut by 21 percent in the three years 1994-96, when severe cuts to all public services in Alberta occurred under the Klein government as part of their drive to eliminate deficits and debt.
In the last 10 years, regardless of how much expenditure is explicit/implicit or public/private, the public expenditure on healthcare in Alberta has been increasing at a considerable rate (five percent per annum). Much of the increases in the most recent decade were necessary to repair the damage done in the name of deficit reduction. However, spending on healthcare in constant per capita dollars now surpasses the peak of 1993.
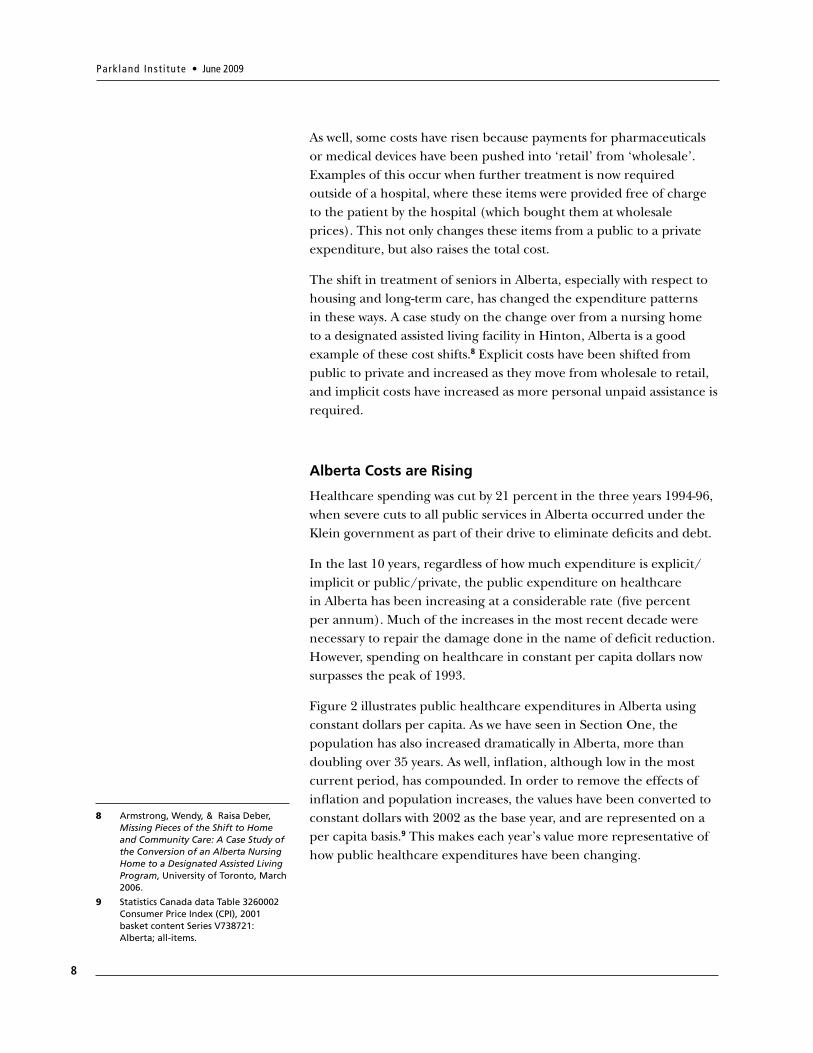
Figure 2 illustrates public healthcare expenditures in Alberta using constant dollars per capita. As we have seen in Section One, the population has also increased dramatically in Alberta, more than doubling over 35 years. As well, inflation, although low in the most current period, has compounded. In order to remove the effects of inflation and population increases, the values have been converted to constant dollars with 2002 as the base year, and are represented on a per capita basis.9 This makes each year’s value more representative of how public healthcare expenditures have been changing.
8 Armstrong, Wendy, & Raisa Deber, Missing Pieces of the Shift to Home and Community Care: A Case Study of the Conversion of an Alberta Nursing Home to a Designated Assisted Living Program, University of Toronto, March 2006.
9 Statistics Canada data Table 3260002 Consumer Price Index (CPI), 2001 basket content Series V738721: Alberta; all-items.
Crisis? What Crisis? Public health care affordability in Alberta
9
Figure 2
The total health expenditure line starts rising in 1997, surpassing the former 1993 peak in 2001. Physician expenses (medical care) follow a similar pattern. Hospital expenditures have risen but have not yet reached the previous high, as the number of hospital beds has remained low since the 1990s. ‘Other’ expenditures, including home care and pharmaceuticals, have risen considerably from the late-1990s, presumably providing treatments that have replaced much of the hospital care. Although ‘preventative’ spending has more than doubled since 1993, note the small amount expended (approximately $77 per capita) despite the amount of rhetoric placed on prevention in discussions of solutions to better health with concurrent lower costs.
Use of Hospitals Falling
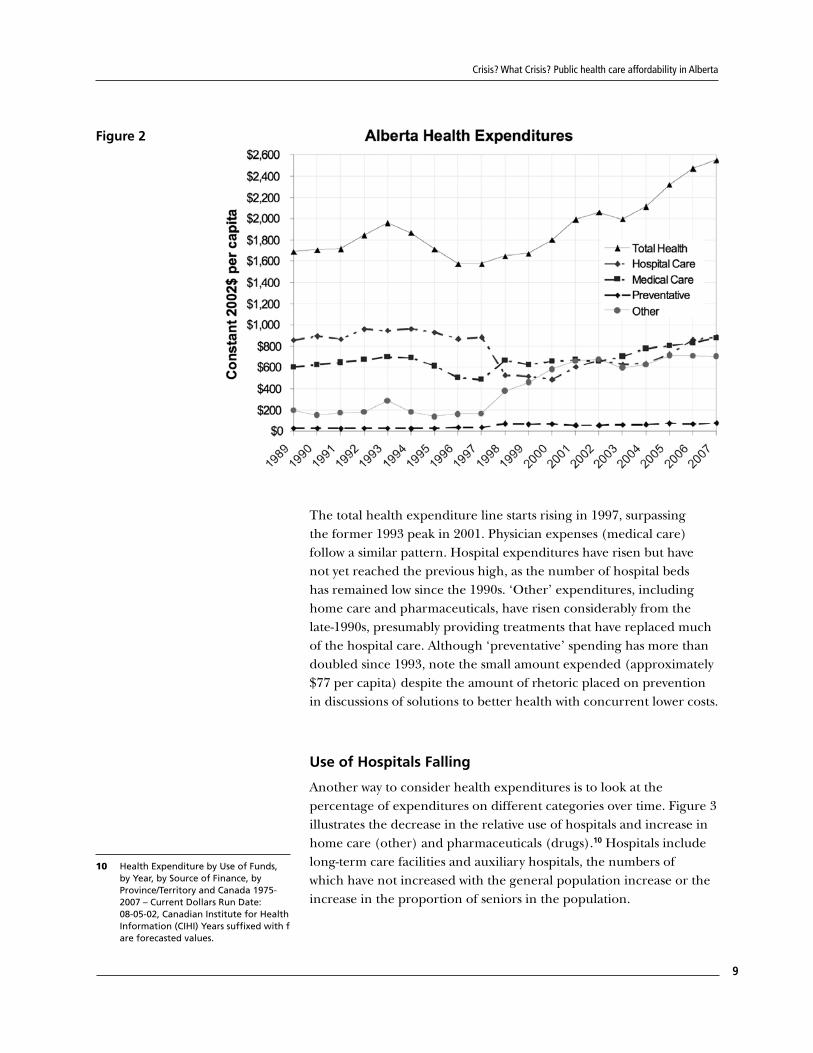
Another way to consider health expenditures is to look at the percentage of expenditures on different categories over time. Figure 3 illustrates the decrease in the relative use of hospitals and increase in home care (other) and pharmaceuticals (drugs).10 Hospitals include long-term care facilities and auxiliary hospitals, the numbers of which have not increased with the general population increase or the increase in the proportion of seniors in the population.
10 Health Expenditure by Use of Funds, by Year, by Source of Finance, by Province/Territory and Canada 1975-2007 – Current Dollars Run Date: 08-05-02, Canadian Institute for Health Information (CIHI) Years suffixed with f are forecasted values.
Park land Inst i tute • June 2009
10
Figure 3
Costs in Relation to Age
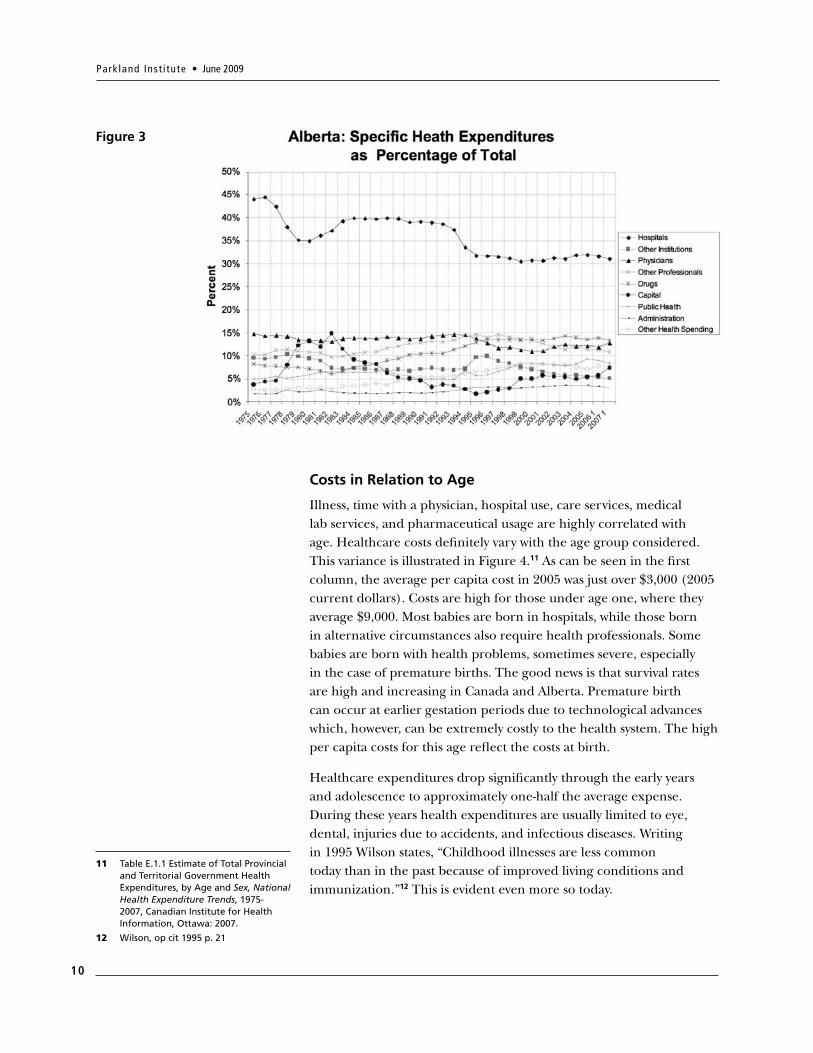
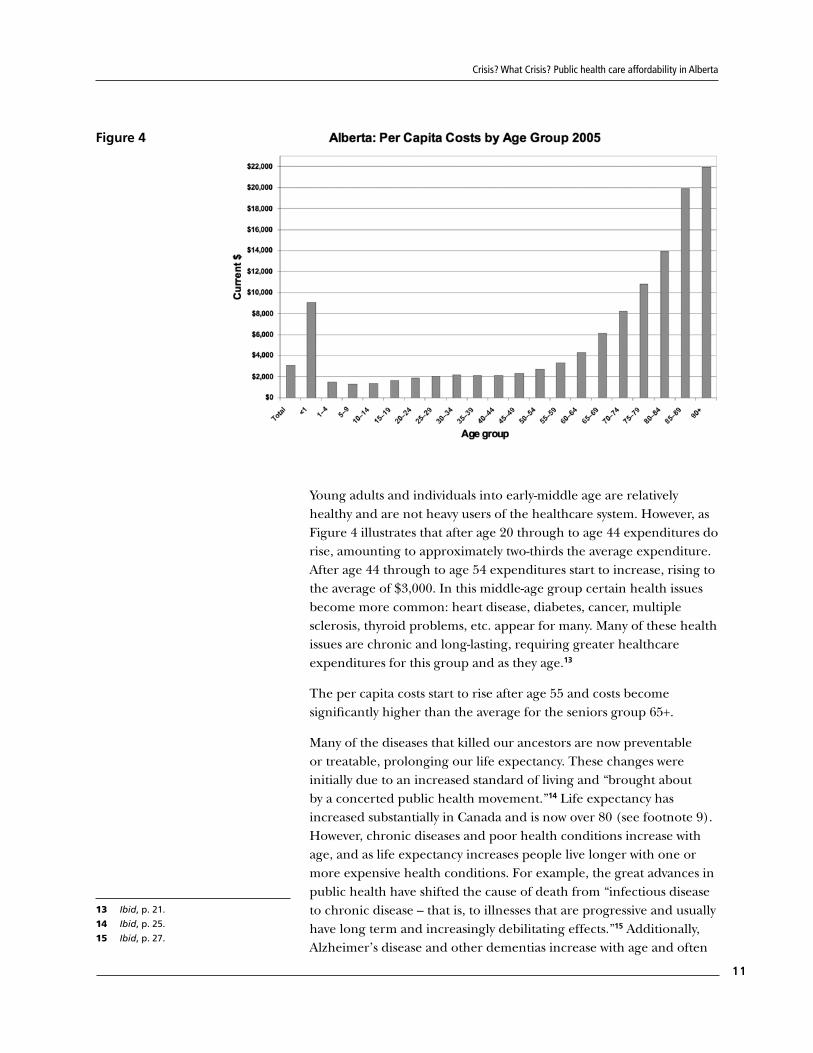
Illness, time with a physician, hospital use, care services, medical lab services, and pharmaceutical usage are highly correlated with age. Healthcare costs definitely vary with the age group considered. This variance is illustrated in Figure 4.11 As can be seen in the first column, the average per capita cost in 2005 was just over $3,000 (2005 current dollars). Costs are high for those under age one, where they average $9,000. Most babies are born in hospitals, while those born in alternative circumstances also require health professionals. Some babies are born with health problems, sometimes severe, especially in the case of premature births. The good news is that survival rates are high and increasing in Canada and Alberta. Premature birth can occur at earlier gestation periods due to technological advances which, however, can be extremely costly to the health system. The high per capita costs for this age reflect the costs at birth.
Healthcare expenditures drop significantly through the early years and adolescence to approximately one-half the average expense. During these years health expenditures are usually limited to eye, dental, injuries due to accidents, and infectious diseases. Writing in 1995 Wilson states, “Childhood illnesses are less common today than in the past because of improved living conditions and immunization.”12 This is evident even more so today.
11 Table E.1.1 Estimate of Total Provincial and Territorial Government Health Expenditures, by Age and Sex, National Health Expenditure Trends, 1975-2007, Canadian Institute for Health Information, Ottawa: 2007.
12 Wilson, op cit 1995 p. 21
Crisis? What Crisis? Public health care affordability in Alberta
11
Figure 4
Young adults and individuals into early-middle age are relatively healthy and are not heavy users of the healthcare system. However, as Figure 4 illustrates that after age 20 through to age 44 expenditures do rise, amounting to approximately two-thirds the average expenditure. After age 44 through to age 54 expenditures start to increase, rising to the average of $3,000. In this middle-age group certain health issues become more common: heart disease, diabetes, cancer, multiple sclerosis, thyroid problems, etc. appear for many. Many of these health issues are chronic and long-lasting, requiring greater healthcare expenditures for this group and as they age.13
The per capita costs start to rise after age 55 and costs become significantly higher than the average for the seniors group 65+.
Many of the diseases that killed our ancestors are now preventable or treatable, prolonging our life expectancy. These changes were initially due to an increased standard of living and “brought about by a concerted public health movement.”14 Life expectancy has increased substantially in Canada and is now over 80 (see footnote 9). However, chronic diseases and poor health conditions increase with age, and as life expectancy increases people live longer with one or more expensive health conditions. For example, the great advances in public health have shifted the cause of death from “infectious disease to chronic disease – that is, to illnesses that are progressive and usually have long term and increasingly debilitating effects.”15 Additionally, Alzheimer’s disease and other dementias increase with age and often
13 Ibid, p. 21.
14 Ibid, p. 25.
15 Ibid, p. 27.

Park land Inst i tute • June 2009
12
require long-term care. Physical conditions such as atherosclerosis develop over a period of years. Treatments extend life, but also extend the length of the terminal illness, requiring greater healthcare services and other assistance for seniors. Most seniors report having at least one chronic health condition, most commonly: arthritis, high blood pressure, and cataracts.
Many diseases such as arthritis impede mobility and require greater assistance. Generally after age 65 we start wearing out at a faster rate. As a result of the correlation of healthcare usage with age, the considerable increase in the proportion of seniors in our population will have considerable effect on the level of healthcare use and overall cost. All other things held constant, any increases in the percentage of the population in the senior group will mean expenditures on healthcare will increase faster than the population at large and faster than the expenditures in the rest of the public sector.
Much of the need for healthcare resources is random. Many persons go through life with little need for healthcare – the lucky ones. In each age group there are individuals who require substantial healthcare resources and therefore incur higher costs than the average. Seniors incur greater costs as the number of individuals needing healthcare services in these age groups also increases. The claim of our healthcare system is to be there for these people – the unlucky ones, regardless of age. We pay for these resources collectively through our tax system in order that services are provided on the basis of need rather than ability to pay. Section Four will discuss ways to use our healthcare resources as effectively as possible, but we need to recognize that statistically, with more than a doubling of the seniors’ age group, the healthcare system will need greater resources than we are currently planning for.
Conclusion
This section has illustrated that health care costs have not been increasing in all areas. Where costs have gone up has been in the ‘other’ category which includes pharmaceuticals and private, out of pocket spending on things like home care. Public spending on hospitals and physicians services have not been big cost drivers and in fact, hospital spending has not yet fully recovered from the cuts of the 1990s. Certainly this tells a different story of sustainability than that one hears in the media and from government. If costs are to be reigned in, pharmaceutical and private spending costs need to be put under the microscope.
Crisis? What Crisis? Public health care affordability in Alberta
13
It is clear that the Alberta government is obsessed with the affordability or sustainability of the publicly funded health system, as this quote indicates: “Alberta’s publicly funded health system has grown steadily over the last fifty years. The range of services and benefits covered by the system and the rate of cost escalation jeopardize the continued viability and affordability of the system. The Ministry’s budget now represents more than one third of all provincial program spending. As new healthcare needs and expectations emerge the cost of meeting them threatens the ability of the province to address and fund its other obligations and priorities. In the health system context, sustainability is about finding the right balance between the needs of Albertans and our funding capacity. However we describe it, there is no question that long term sustainability is a major challenge of Alberta’s publicly funded health system.”16
This section will discuss the misplaced direction of Alberta government on this perspective. Health policy needs to appropriately address the health needs of the population and the best mechanism to serve these needs. As well, the government needs to address ways to promote and improve health in a cost effective way. Most of the 2008 plan laid out by the government appears to reflect this. However, health policy should not be driven in the context of limiting expenditures in healthcare for the sole purpose of limiting the public sector, as seems a priority especially in Alberta.
At a conference in May 2007 in Regina, Robert Evans made the critical point that sustainability relates to whether the people of a nation can afford a given level of services.17 He also demonstrated that the introduction of Medicare starting in the 1960s stabilized Canadian expenditures, which were on a runaway trajectory similar to the United States. Canadian innovation in public financing of health has kept healthcare affordable while the United States has continued on its escalating trajectory with largely private funding. As a result, the United States spending on healthcare is now considerably greater than that of Canada on a Gross Domestic Product (GDP) basis – U.S. approximately 16 percent, Canada approximately 10 percent.
The Alberta government has been in the forefront of those claiming healthcare costs are unsustainable.18 When considering the sustainability of healthcare expenditures, a caution regarding healthcare costs from Section Two bears repeating: costs will occur. Reducing public expenditure will not make them go away, but rather will shift them to private personal out-of-pocket expenses (for those
Medicare is Sustainable
16 Health and Wellness, Business Plan 2008-11, p.156.
17 Evans, Robert G. “Economic Myths and Political Realities: The Inequality Agenda and the Sustainability of Medicare in Campbell, Bruce and Greg Marchidon, editors, Medicare Facts, Myths, Problems, and Promise, James Lorimer and Company Toronto, 2007.
18 For example: ‘Unsustainable’ health -care system must head election agenda: Klein, Stephen Thorne, The Canadian Press, 11/21/2005, p. A6, Ottawa.
SECTION TWO:
Park land Inst i tute • June 2009
14
who can afford it) and private insurance (for those that have it), or it will drive costs into the implicit realm (the costs are not accounted in exchanged dollars) where it increases stress on caregivers, increases absenteeism from work, and reduces productivity and GDP. Ironically, these costs put greater stress on the healthcare system. By all accounts the shift from public to private (explicit and implicit) will increase the overall costs of healthcare. This will undermine the efficiency aspect of Medicare. Most importantly, shifting costs will undermine the highly valued equity aspect of Medicare.
Healthcare Expenditure as a Share of GDP
The relevant ratios in this analysis are healthcare expenditure to GDP, debt to GDP, and healthcare expenditure to total government expenditure.
Gross Domestic Product is the dollar value (in current dollars) of all of the goods and services produced in a particular political jurisdiction in a given year. GDP is considered a useful measure of a nation’s income when considering the affordability of healthcare (or other things). Personal income, a large fraction of GDP, is highly correlated with GDP.19 GDP also provides a relatively common dimension to use when comparing patterns across nations. Of course there is no standard as to what a nation, or, more appropriately, on what the people of a nation should spend their income. This will depend on their wishes. However, national income will be the budget that limits their overall spending.
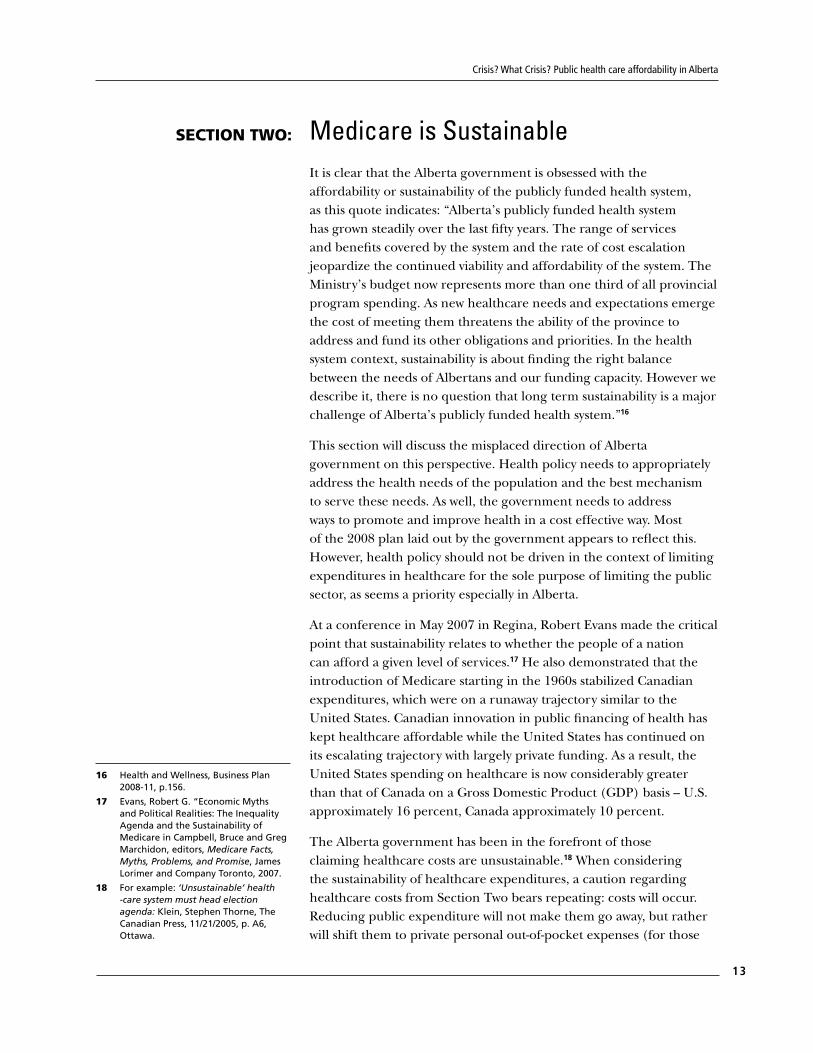
Our ratio of healthcare expenditure to GDP was climbing steadily, in step with that of the United States, prior to the introduction of Medicare. It has since been more in line with European and other developed nations. Figure 5 compares Canada to a number of other countries.20 Note that Organization for Economic Co-Operation and Development (OECD) data are not completely consistent with Statistics Canada measures, but is consistent across nations, thereby allowing a relative comparison.
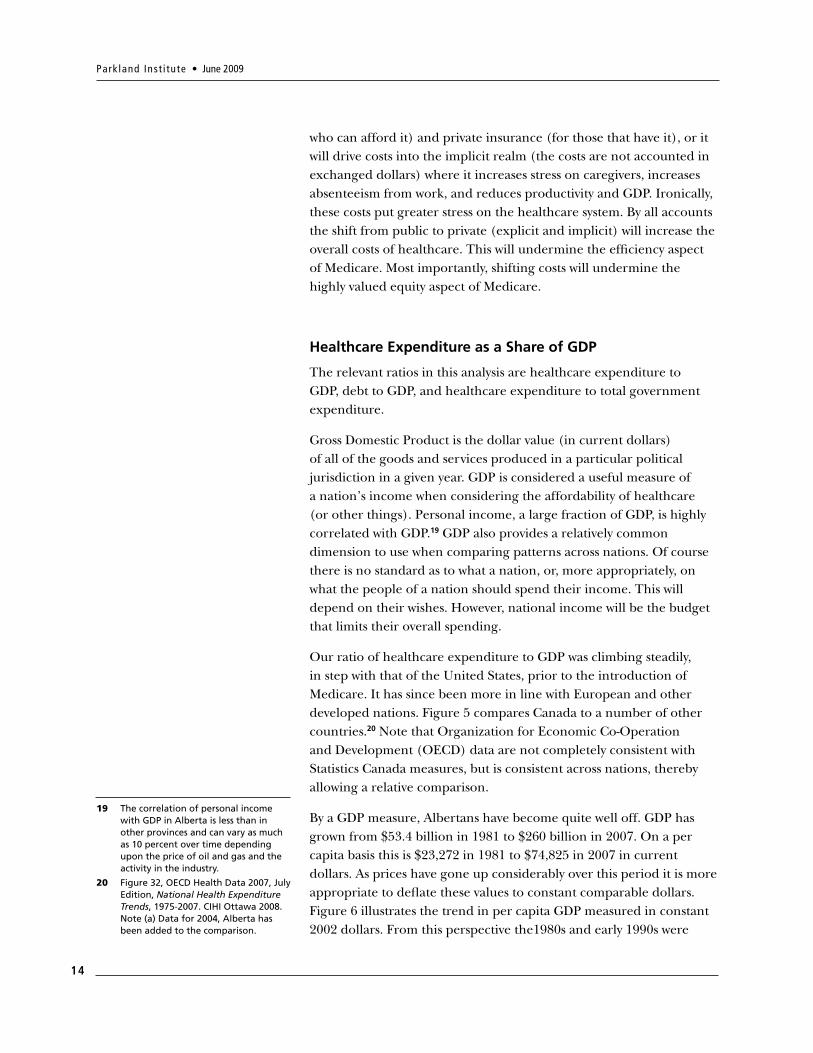
By a GDP measure, Albertans have become quite well off. GDP has grown from $53.4 billion in 1981 to $260 billion in 2007. On a per capita basis this is $23,272 in 1981 to $74,825 in 2007 in current dollars. As prices have gone up considerably over this period it is more appropriate to deflate these values to constant comparable dollars. Figure 6 illustrates the trend in per capita GDP measured in constant 2002 dollars. From this perspective the1980s and early 1990s were
19 The correlation of personal income with GDP in Alberta is less than in other provinces and can vary as much as 10 percent over time depending upon the price of oil and gas and the activity in the industry.
20 Figure 32, OECD Health Data 2007, July Edition, National Health Expenditure Trends, 1975-2007. CIHI Ottawa 2008. Note (a) Data for 2004, Alberta has been added to the comparison.
Crisis? What Crisis? Public health care affordability in Alberta
15
years of declining real GDP per capita. However, the last decade has been quite prosperous. In 1997, Alberta had a per capita GDP of $42,934 and in 2007 it was $63,464. This was a considerable gain of $20,530, a 48 percent increase, or an annual growth rate of per capita GDP of 4.2 percent.
Figure 5
Figure 6
Park land Inst i tute • June 2009
16
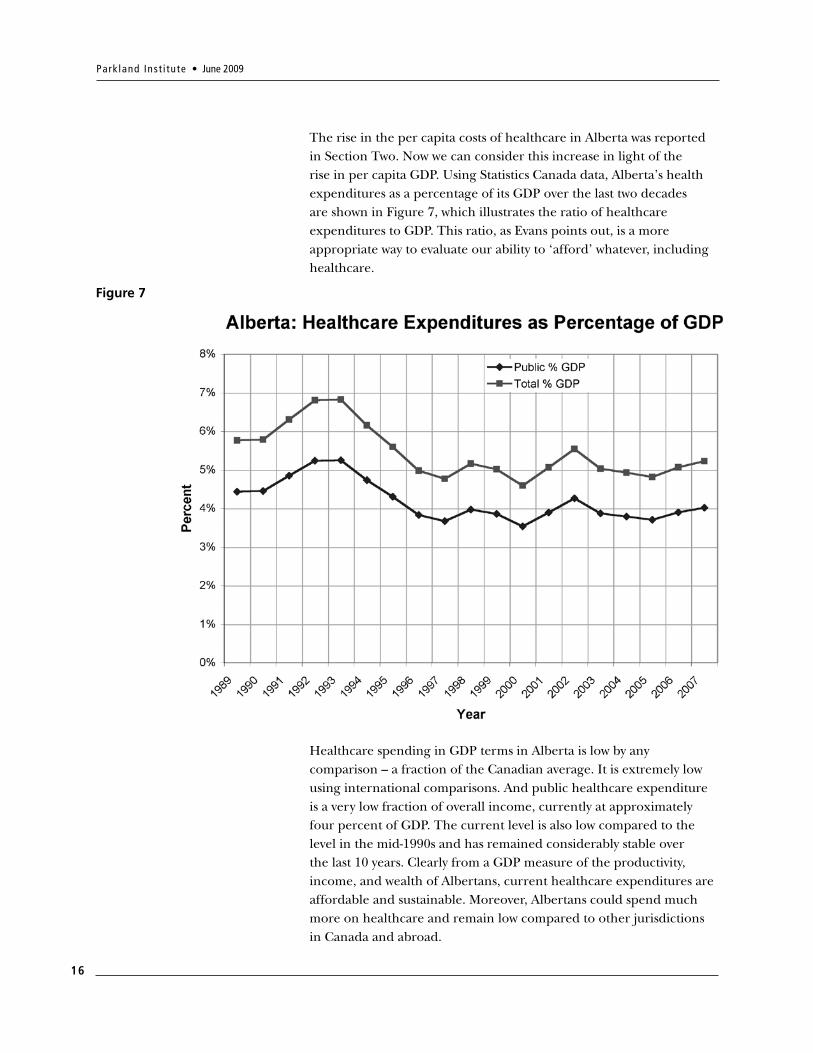
The rise in the per capita costs of healthcare in Alberta was reported in Section Two. Now we can consider this increase in light of the rise in per capita GDP. Using Statistics Canada data, Alberta’s health expenditures as a percentage of its GDP over the last two decades are shown in Figure 7, which illustrates the ratio of healthcare expenditures to GDP. This ratio, as Evans points out, is a more appropriate way to evaluate our ability to ‘afford’ whatever, including healthcare.
Figure 7
Healthcare spending in GDP terms in Alberta is low by any comparison – a fraction of the Canadian average. It is extremely low using international comparisons. And public healthcare expenditure is a very low fraction of overall income, currently at approximately four percent of GDP. The current level is also low compared to the level in the mid-1990s and has remained considerably stable over the last 10 years. Clearly from a GDP measure of the productivity, income, and wealth of Albertans, current healthcare expenditures are affordable and sustainable. Moreover, Albertans could spend much more on healthcare and remain low compared to other jurisdictions in Canada and abroad.
Crisis? What Crisis? Public health care affordability in Alberta
17
Government Debt
Canada has considerable public debt at the federal level. However, Canada is by far in the best fiscal shape of all the G8 nations, with the lowest debt-to-GDP ratio. Our debt/GDP ratio peaked in the early 1990s and has steadily declined every year since then, as the government has been running surpluses in addition to robust growth in GDP. With a low debt/GDP ratio, Canadian healthcare expenditure (as a ratio of GDP) is easily manageable in comparison to other countries (Figure 5).
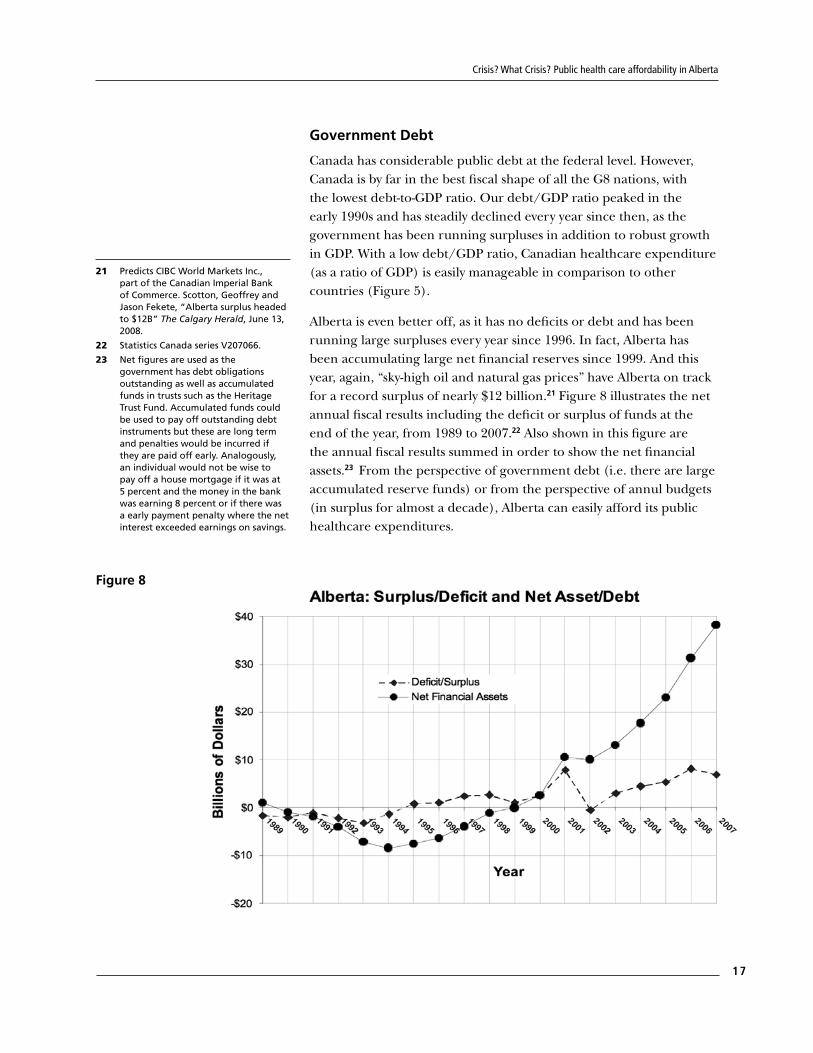
Alberta is even better off, as it has no deficits or debt and has been running large surpluses every year since 1996. In fact, Alberta has been accumulating large net financial reserves since 1999. And this year, again, “sky-high oil and natural gas prices” have Alberta on track for a record surplus of nearly $12 billion.21 Figure 8 illustrates the net annual fiscal results including the deficit or surplus of funds at the end of the year, from 1989 to 2007.22 Also shown in this figure are the annual fiscal results summed in order to show the net financial assets.23 From the perspective of government debt (i.e. there are large accumulated reserve funds) or from the perspective of annul budgets (in surplus for almost a decade), Alberta can easily afford its public healthcare expenditures.
Figure 8
21 Predicts CIBC World Markets Inc., part of the Canadian Imperial Bank of Commerce. Scotton, Geoffrey and Jason Fekete, “Alberta surplus headed to $12B” The Calgary Herald, June 13, 2008.
22 Statistics Canada series V207066.
23 Net figures are used as the government has debt obligations outstanding as well as accumulated funds in trusts such as the Heritage Trust Fund. Accumulated funds could be used to pay off outstanding debt instruments but these are long term and penalties would be incurred if they are paid off early. Analogously, an individual would not be wise to pay off a house mortgage if it was at 5 percent and the money in the bank was earning 8 percent or if there was a early payment penalty where the net interest exceeded earnings on savings.
Park land Inst i tute • June 2009
18
Royalties
This study’s purpose is not to debate the royalty rates in Alberta. As we know, the current level of royalty take by the Alberta is controversial. However, it must be noted that the positive fiscal picture in Alberta is largely due to the revenue boost that royalties have provided to the budget and to the budget surpluses. Virtually all discussions about royalties have been about how much rates need to be increased. Even the oil industry admitted current royalty rates were, on the whole, low, although they disputed the appropriateness of each subsector royalty. The Alberta government has pledged to increase royalty rates in 2009, but these increases are on the light side compared to the recommendations of their own expert panel. The point relevant to this study is that there is considerable room for the government to actually increase revenues above the current level – even under the current tax regime – and the government will increase royalty rates to some extent starting in 2009.
On the other hand, the government currently depends on royalty revenues for a substantial source of operating revenue. If energy prices were to decrease significantly, the province’s resource revenues would fall even more dramatically.
Taxes
On a revenue basis there is no need for the Alberta government to raise tax rates now or in the foreseeable future in order to fund appropriately Medicare (or any other programs) regardless of what government officials might argue about the sustainability, or affordability, of the healthcare system.24 However, if Albertans decided to increase taxes there is considerable tax room to do so. Alberta is the only Canadian jurisdiction not to have a sales tax. Alberta instituted the ‘flat tax’ more appropriately termed the constant-rate tax system, in 2000 while also reducing tax rates from the previous system. This tax regime has reduced personal tax revenue by over $2 billion dollars a year, with most of this tax relief going to the wealthiest in Alberta.25
The Alberta government reports on its website the tax advantage in Alberta.26 The government brags that it collects less than it would under any other provincial tax regime: “If Albertans and Alberta businesses were in any other province, they would pay between about $10 billion to $18 billion more in taxes, every single year. That works out to about $3,000 to $5,000 for each Albertan.”27 Would Albertans support greater taxes to have healthcare funded as necessary? The government has never asked.28 There is enormous tax room to fund
24 Ron Liepert Minister of Health and Wellness has recently (May 15 2008) replaced Alberta’s nine regional health authority boards, the Alberta Cancer Board, the Alberta Alcohol and Drug Abuse Commission and the Alberta Mental Health Board by a single provincial health services board. Liepert says the decision to have one board will help the province build an integrated publically funded health system that will improve equitable access for all Albertans and ensure sustainability for the future. The concern is: does sustainable mean healthcare reductions and/or greater privatization under one Board?
25 See: Flanagan, Greg, “Shifting the Burden”, Alberta Views, Calgary, Alberta, Sept/Oct 2000, pp 21-27.
26 Alberta Tax Advantage: http://www.finance.alberta.ca/publications/budget/budget2008/tax.pdf
27 Budget 2008 The Right Plan for Today & Tomorrow Budget Speech, Honourable Iris Evans Minister of Finance and Enterprise, April 22, 2008
28 The United Nurses of Alberta polled Albertans, who reasoned that they would be prepared to pay more tax for better healthcare.
Crisis? What Crisis? Public health care affordability in Alberta
19
healthcare if that is what the population values and wants, should there arise any budget shortfall. As from a debt perspective, any consideration of taxes shows that suggestions that healthcare is unaffordable or unsustainable is a weak argument.
Health as a Percentage of Provincial Budget
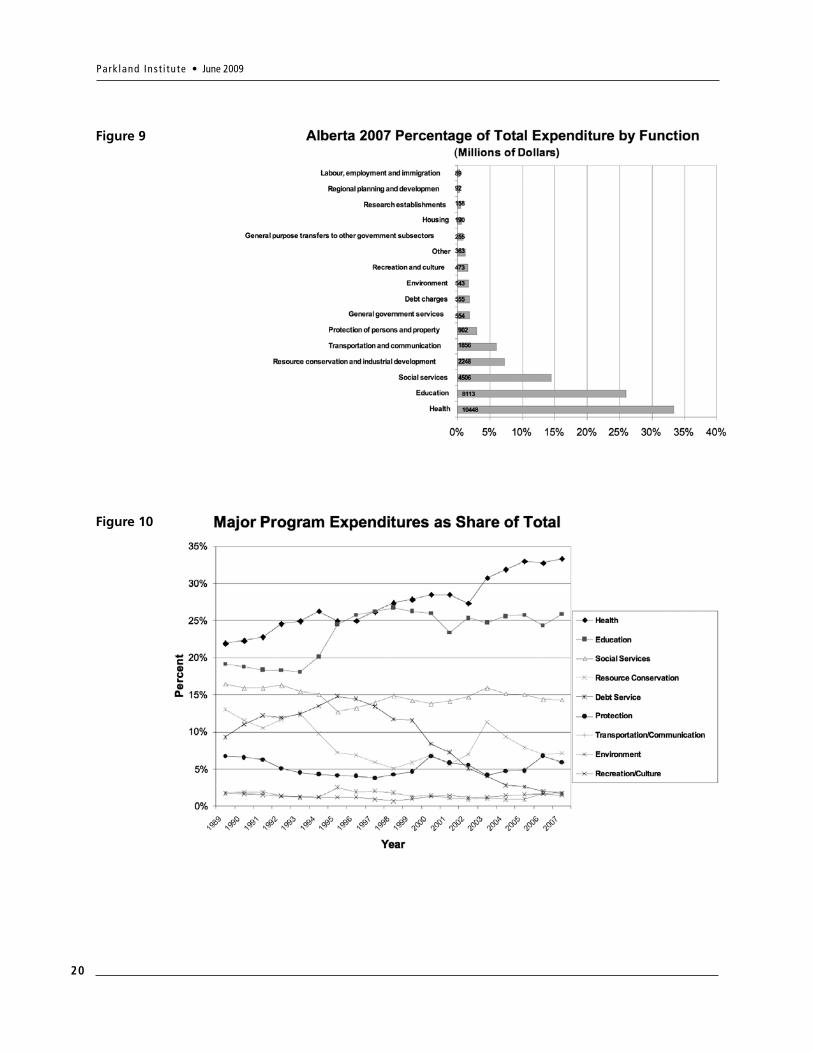
There is no doubt that healthcare is the largest single program category of government expenditure. Figure 9 illustrates the respective shares of select categories of program spending. Healthcare takes up approximately one-third of overall expenditures. The next largest program is education, both K-12 and postsecondary, at approximately 26 percent.
So what about the widely reported steady climb (what Evans termed the “Klein line”) in healthcare expenditure as a percentage of total government expenditures? It is true that the healthcare category of spending takes the largest share of the overall budget? This is illustrated in Figure 10.29 Klein was correct: healthcare spending has been increasing as a percentage of the budget. Note that most other program expenditures are relatively ‘flat’ (social services has fallen while transportation has risen) indicating that health has not robbed other sectors. Debt servicing has fallen in conjunction with the increase in healthcare. Also, as the population ages, education costs (the second largest item) should become less of a burden. It is worth remembering that healthcare spending as a percentage of GDP has been flat over this period.
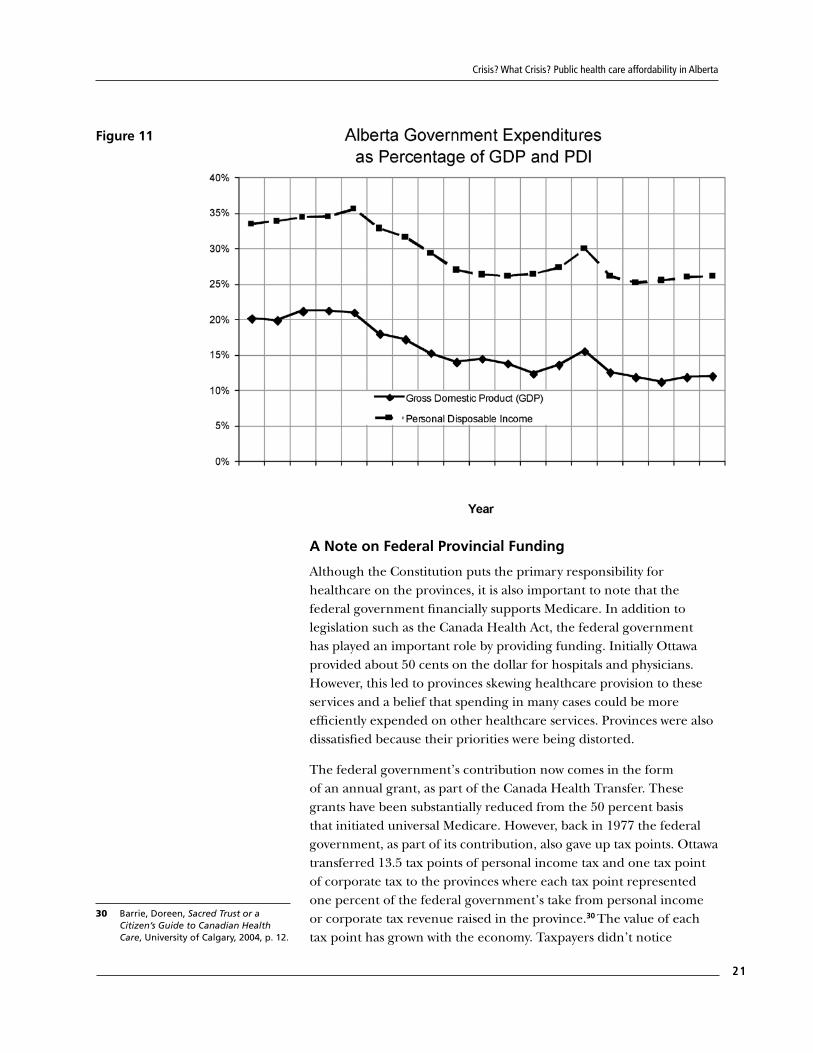
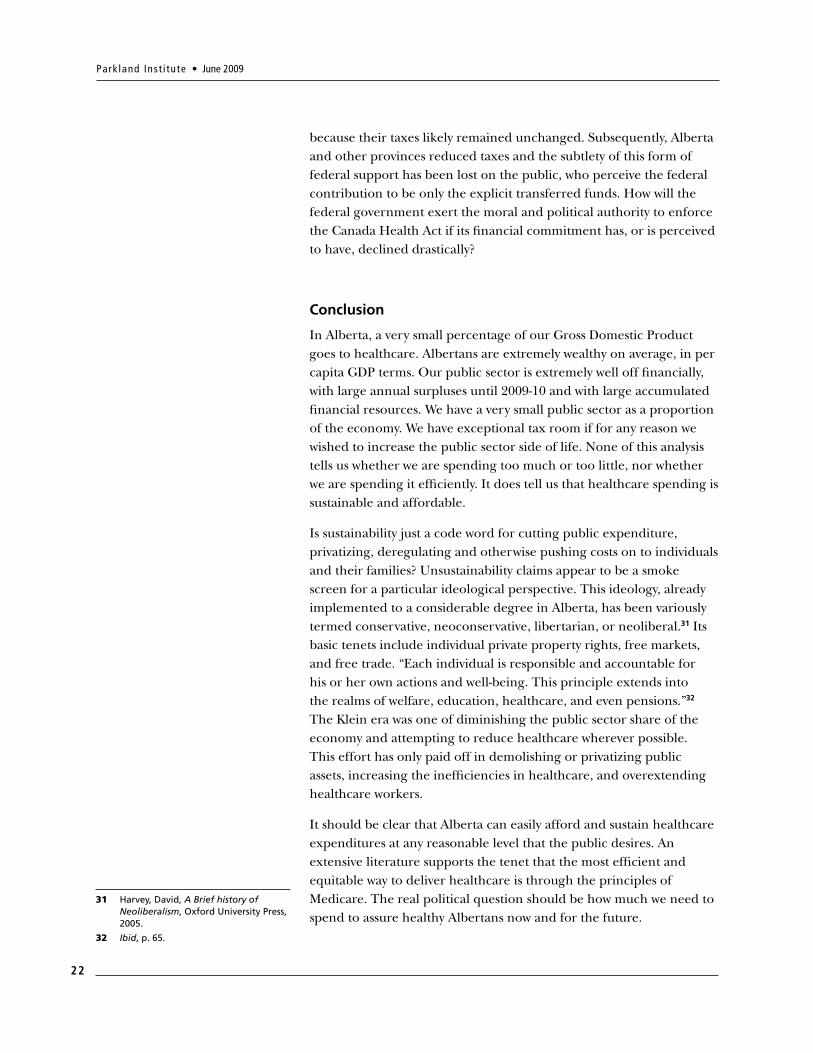
We need to ask, therefore, what has been happening to the total budget as a percentage of GDP? This calculation tells us the government share of the overall economy. Figure 18 illustrates total budget expenditures as a percentage of GDP for each year in Alberta. From a GDP perspective, it is not that healthcare expenditure has been increasing – it has remained quite steady – but that government expenditure has been decreasing (considerably) over the same period. Under Premier Klein’s tenure, government as a share of the overall economy fell from 22 percent of GDP to 12 percent. This is a 45 percent reduction in the public sector proportion of the economy. GDP is somewhat more volatile in Alberta, due to the effects of the oil and gas economy, compared with other jurisdictions. Therefore Figure 11 includes total budget expenditures as a percentage of personal disposable income (PDI), a measure of the income Albertans receive. From an income perspective government has fallen from approximately one-third to one-quarter.
29 Federal and provincial general government revenue/expenditure; Alberta; Provincial government Table 3850002, Statistics Canada. Note Education series was disrupted when the Province took over K-12 education revenue and then accounted for more expenditures.
Park land Inst i tute • June 2009
20
Figure 9
Figure 10
Crisis? What Crisis? Public health care affordability in Alberta
21
Figure 11
A Note on Federal Provincial Funding
Although the Constitution puts the primary responsibility for healthcare on the provinces, it is also important to note that the federal government financially supports Medicare. In addition to legislation such as the Canada Health Act, the federal government has played an important role by providing funding. Initially Ottawa provided about 50 cents on the dollar for hospitals and physicians. However, this led to provinces skewing healthcare provision to these services and a belief that spending in many cases could be more efficiently expended on other healthcare services. Provinces were also dissatisfied because their priorities were being distorted.
The federal government’s contribution now comes in the form of an annual grant, as part of the Canada Health Transfer. These grants have been substantially reduced from the 50 percent basis that initiated universal Medicare. However, back in 1977 the federal government, as part of its contribution, also gave up tax points. Ottawa transferred 13.5 tax points of personal income tax and one tax point of corporate tax to the provinces where each tax point represented one percent of the federal government’s take from personal income or corporate tax revenue raised in the province.30 The value of each tax point has grown with the economy. Taxpayers didn’t notice
30 Barrie, Doreen, Sacred Trust or a Citizen’s Guide to Canadian Health Care, University of Calgary, 2004, p. 12.
Park land Inst i tute • June 2009
22
because their taxes likely remained unchanged. Subsequently, Alberta and other provinces reduced taxes and the subtlety of this form of federal support has been lost on the public, who perceive the federal contribution to be only the explicit transferred funds. How will the federal government exert the moral and political authority to enforce the Canada Health Act if its financial commitment has, or is perceived to have, declined drastically?
Conclusion
In Alberta, a very small percentage of our Gross Domestic Product goes to healthcare. Albertans are extremely wealthy on average, in per capita GDP terms. Our public sector is extremely well off financially, with large annual surpluses until 2009-10 and with large accumulated financial resources. We have a very small public sector as a proportion of the economy. We have exceptional tax room if for any reason we wished to increase the public sector side of life. None of this analysis tells us whether we are spending too much or too little, nor whether we are spending it efficiently. It does tell us that healthcare spending is sustainable and affordable.
Is sustainability just a code word for cutting public expenditure, privatizing, deregulating and otherwise pushing costs on to individuals and their families? Unsustainability claims appear to be a smoke screen for a particular ideological perspective. This ideology, already implemented to a considerable degree in Alberta, has been variously termed conservative, neoconservative, libertarian, or neoliberal.31 Its basic tenets include individual private property rights, free markets, and free trade. “Each individual is responsible and accountable for his or her own actions and well-being. This principle extends into the realms of welfare, education, healthcare, and even pensions.”32 The Klein era was one of diminishing the public sector share of the economy and attempting to reduce healthcare wherever possible. This effort has only paid off in demolishing or privatizing public assets, increasing the inefficiencies in healthcare, and overextending healthcare workers.
It should be clear that Alberta can easily afford and sustain healthcare expenditures at any reasonable level that the public desires. An extensive literature supports the tenet that the most efficient and equitable way to deliver healthcare is through the principles of Medicare. The real political question should be how much we need to spend to assure healthy Albertans now and for the future.
31 Harvey, David, A Brief history of Neoliberalism, Oxford University Press, 2005.
32 Ibid, p. 65.


Park land Inst i tute • June 2009
24
11045 Saskatchewan Drive,Edmonton, Alberta
T6G 2E1Phone: 780.492.8558
Email: [email protected]: www.ualberta.ca/parkland