crestview austin housing market trends
DESCRIPTION
RealEstateAppraisalsAustin.com 8127 Mesa Dr. Ste B206-177 Austin, TX 78759 512-900-7929 http://www.realestateappraisalsaustin.com/reports/crestview-austin-market-trends/TRANSCRIPT
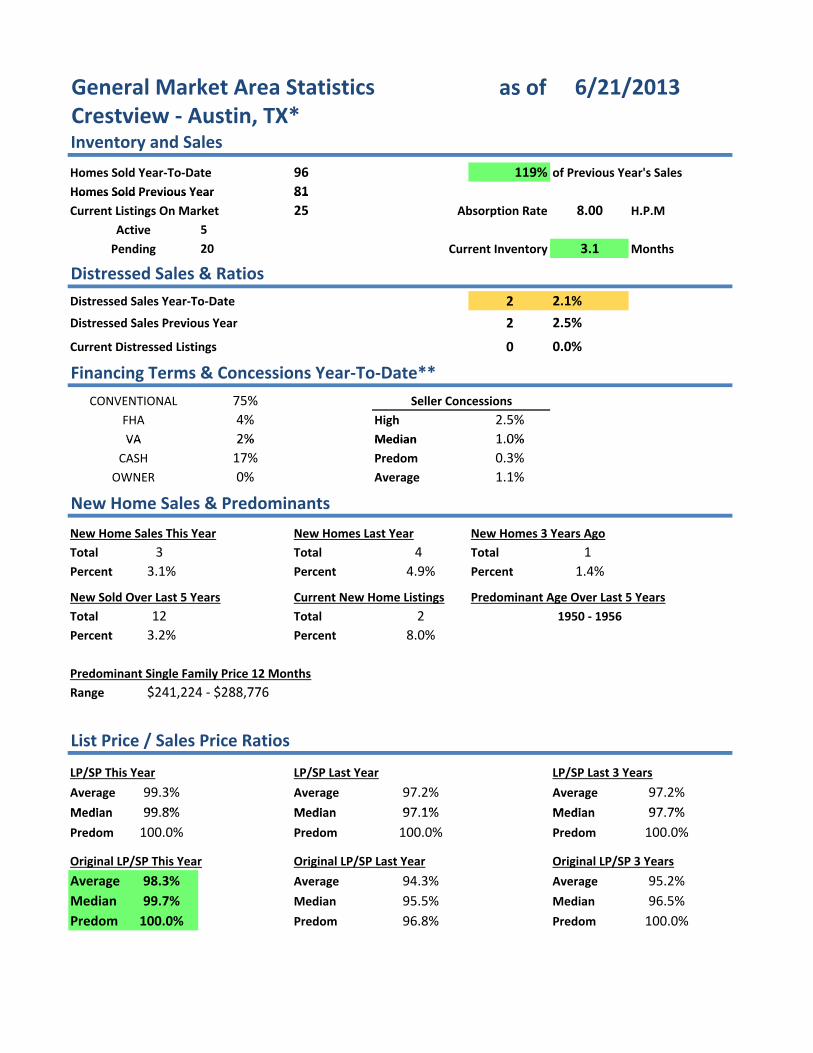
as of
Homes Sold Year‐To‐Date 96 119% of Previous Year's Sales
Homes Sold Previous Year 81
General Market Area StatisticsCrestview ‐ Austin, TX*Inventory and Sales
6/21/2013
Homes Sold Previous Year 81
Current Listings On Market 25 Absorption Rate 8.00 H.P.M
5
20 Current Inventory 3.1 Months
2 2.1%
2 2 5%Di d S l P i Y
Pending
Distressed Sales & Ratios
Distressed Sales Year‐To‐Date
Active
2 2.5%
0 0.0%
75%
4% High 2.5%
2% Median 1.0%
Distressed Sales Previous Year
Current Distressed Listings
Financing Terms & Concessions Year‐To‐Date**
CONVENTIONAL Seller Concessions
FHA
VA 2% Median 1.0%
17% Predom 0.3%
0% Average 1.1%
New Home Sales This Year New Homes Last Year New Homes 3 Years Ago
Total 3 Total 4 Total 1
New Home Sales & Predominants
OWNER
VA
CASH
Percent 3.1% Percent 4.9% Percent 1.4%
New Sold Over Last 5 Years Current New Home Listings Predominant Age Over Last 5 Years
Total 12 Total 2 1950 ‐ 1956
Percent 3.2% Percent 8.0%
Predominant Single Family Price 12 Months
$241 224 $288 776Range
LP/SP This Year LP/SP Last Year LP/SP Last 3 Years
Average 99.3% Average 97.2% Average 97.2%
Median 99 8% Median 97 1% Median 97 7%
List Price / Sales Price Ratios
$241,224 ‐ $288,776
Median 99.8% Median 97.1% Median 97.7%
Predom 100.0% Predom 100.0% Predom 100.0%
Original LP/SP This Year Original LP/SP Last Year Original LP/SP 3 Years
Average 98.3% Average 94.3% Average 95.2%
Median 99.7% Median 95.5% Median 96.5%
Predom 100.0% Predom 96.8% Predom 100.0%
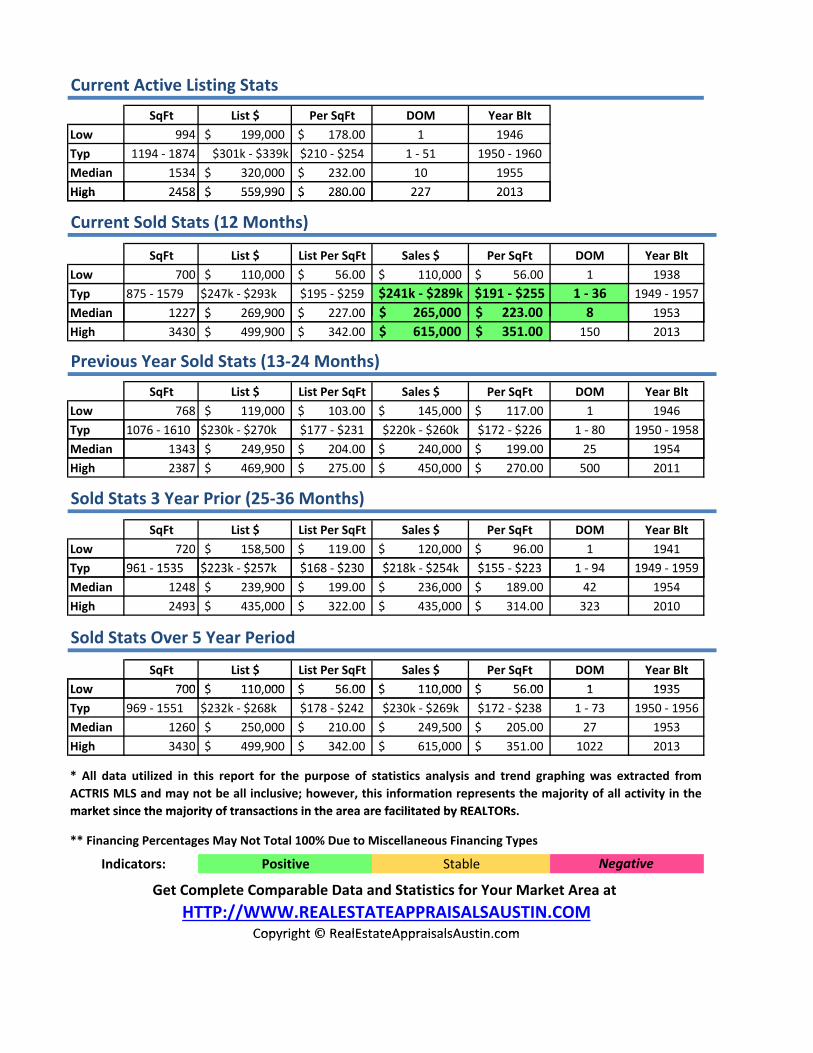
Current Active Listing Stats
SqFt List $ Per SqFt DOM Year Blt
Low 994 199,000$ 178.00$ 1 1946
Typ 1194 ‐ 1874 $301k ‐ $339k $210 ‐ $254 1 ‐ 51 1950 ‐ 1960
Median 1534 320,000$ 232.00$ 10 1955
High 2458 559,990$ 280.00$ 227 2013High 2458 559,990$ 280.00$ 227 2013
Current Sold Stats (12 Months)
SqFt List $ List Per SqFt Sales $ Per SqFt DOM Year Blt
Low 700 110,000$ 56.00$ 110,000$ 56.00$ 1 1938
Typ 875 ‐ 1579 $247k ‐ $293k $195 ‐ $259 $241k ‐ $289k $191 ‐ $255 1 ‐ 36 1949 ‐ 1957
Median 1227 269,900$ 227.00$ 265,000$ 223.00$ 8 1953Median 1227 269,900$ 227.00$ 265,000$ 223.00$ 8 1953
High 3430 499,900$ 342.00$ 615,000$ 351.00$ 150 2013
Previous Year Sold Stats (13‐24 Months)
SqFt List $ List Per SqFt Sales $ Per SqFt DOM Year Blt
Low 768 119,000$ 103.00$ 145,000$ 117.00$ 1 1946
Typ 1076 ‐ 1610 $230k ‐ $270k $177 ‐ $231 $220k ‐ $260k $172 ‐ $226 1 ‐ 80 1950 ‐ 1958
Median 1343 249,950$ 204.00$ 240,000$ 199.00$ 25 1954
High 2387 469,900$ 275.00$ 450,000$ 270.00$ 500 2011
Sold Stats 3 Year Prior (25‐36 Months)
SqFt List $ List Per SqFt Sales $ Per SqFt DOM Year Blt
Low 720 158,500$ 119.00$ 120,000$ 96.00$ 1 1941
T 961 1535 $223k $257k $168 $230 $218k $254k $155 $223 1 94 1949 1959Typ 961 ‐ 1535 $223k ‐ $257k $168 ‐ $230 $218k ‐ $254k $155 ‐ $223 1 ‐ 94 1949 ‐ 1959
Median 1248 239,900$ 199.00$ 236,000$ 189.00$ 42 1954
High 2493 435,000$ 322.00$ 435,000$ 314.00$ 323 2010
Sold Stats Over 5 Year Period
SqFt List $ List Per SqFt Sales $ Per SqFt DOM Year Blt
Low 700 110 000$ 56 00$ 110 000$ 56 00$ 1 1935Low 700 110,000$ 56.00$ 110,000$ 56.00$ 1 1935
Typ 969 ‐ 1551 $232k ‐ $268k $178 ‐ $242 $230k ‐ $269k $172 ‐ $238 1 ‐ 73 1950 ‐ 1956
Median 1260 250,000$ 210.00$ 249,500$ 205.00$ 27 1953
High 3430 499,900$ 342.00$ 615,000$ 351.00$ 1022 2013
* All data utilized in this report for the purpose of statistics analysis and trend graphing was extracted from
ACTRIS MLS and may not be all inclusive; however, this information represents the majority of all activity in the
market since the majority of transactions in the area are facilitated by REALTORsmarket since the majority of transactions in the area are facilitated by REALTORs.
Copyright © RealEstateAppraisalsAustin com
Indicators: Positive Stable Negative
Get Complete Comparable Data and Statistics for Your Market Area at
HTTP://WWW.REALESTATEAPPRAISALSAUSTIN.COM
** Financing Percentages May Not Total 100% Due to Miscellaneous Financing Types
Copyright © RealEstateAppraisalsAustin.com
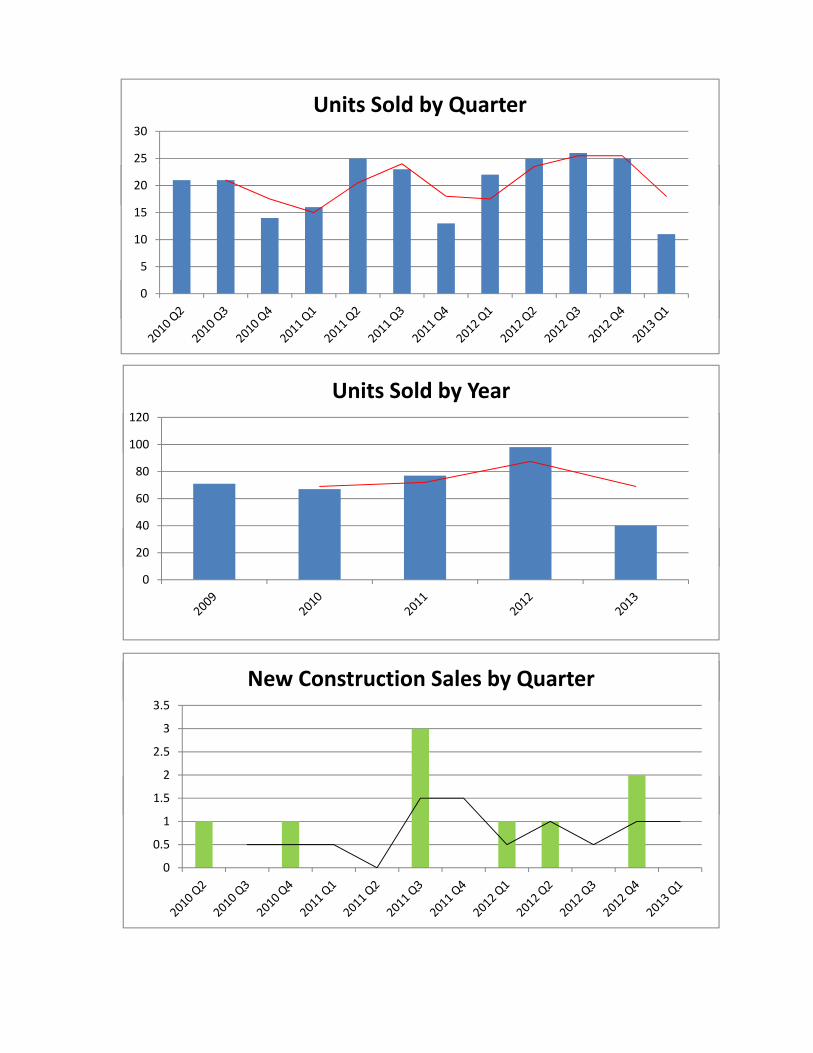
20
25
30
Units Sold by Quarter
0
5
10
15
20
0
100
120
Units Sold by Year
20
40
60
80
100
120
3
New Construction Sales by Quarter
0
20
40
1.5
2
2.5
3
3.5
New Construction Sales by Quarter
0
0.5
1
1.5
2
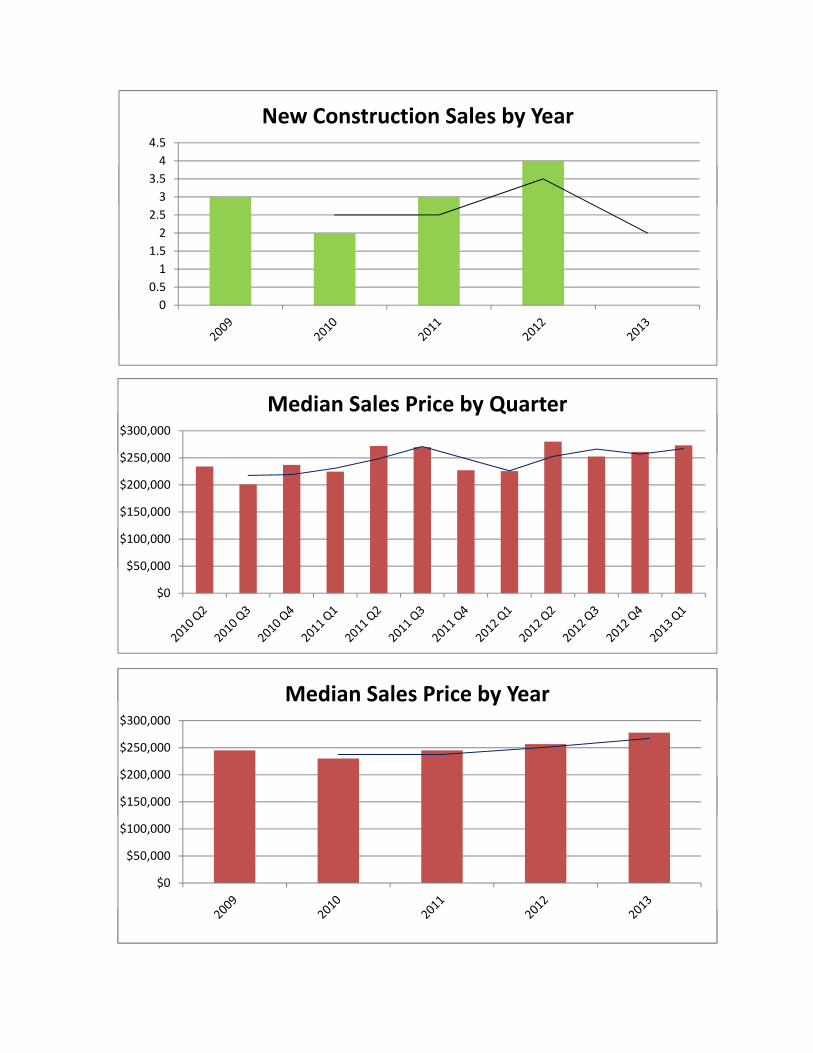
3
3.5
4
4.5
New Construction Sales by Year
0
0.5
1
1.5
2
2.5
3
3.5
$
$300,000
Median Sales Price by Quarter
0
0.5
$50 000
$100,000
$150,000
$200,000
$250,000
$300,000
y Q
$0
$50,000
$100,000
Median Sales Price by Year
$150,000
$200,000
$250,000
$300,000
Median Sales Price by Year
$0
$50,000
$100,000
$150,000
$200,000
$150
$200
$250
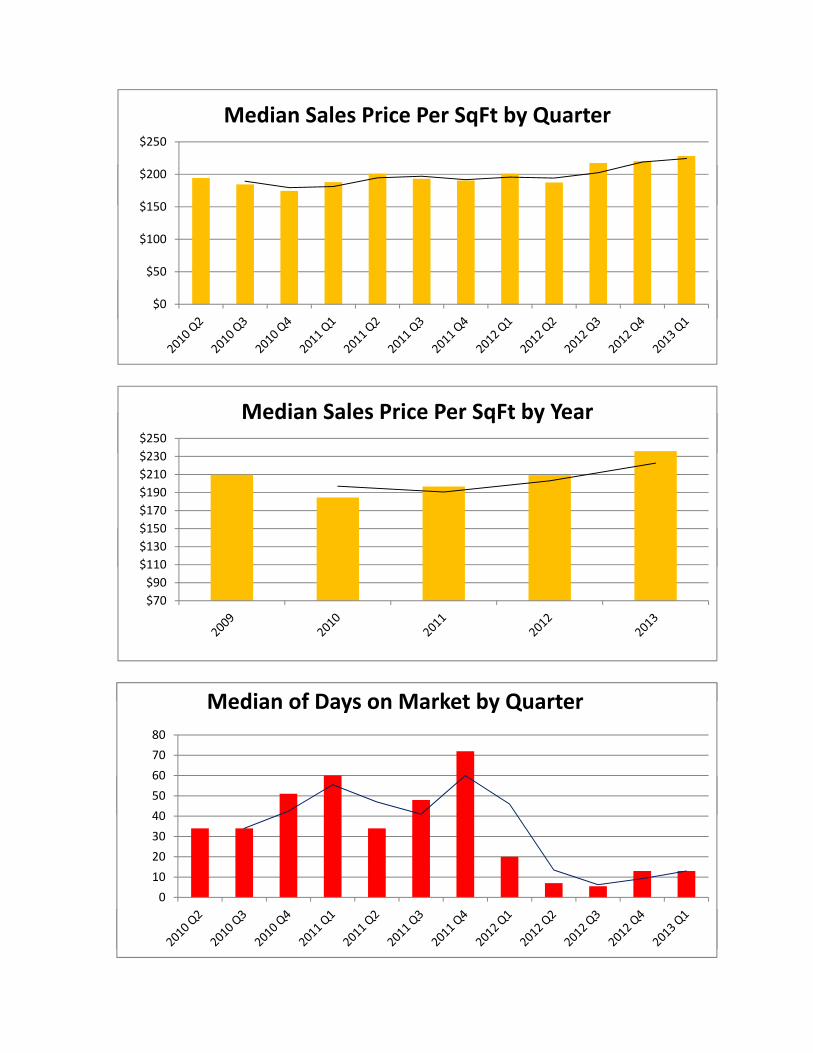
Median Sales Price Per SqFt by Quarter
$0
$50
$100
$150
$200
$0
$230
$250
Median Sales Price Per SqFt by Year
$110
$130
$150
$170
$190
$210
$230
$250
Median Sales Price Per SqFt by Year
Median of Days on Market by Quarter
$70
$90
$110
$130
$150
40
50
60
70
80
Median of Days on Market by Quarter
0
10
20
30
40
50
60
3035404550
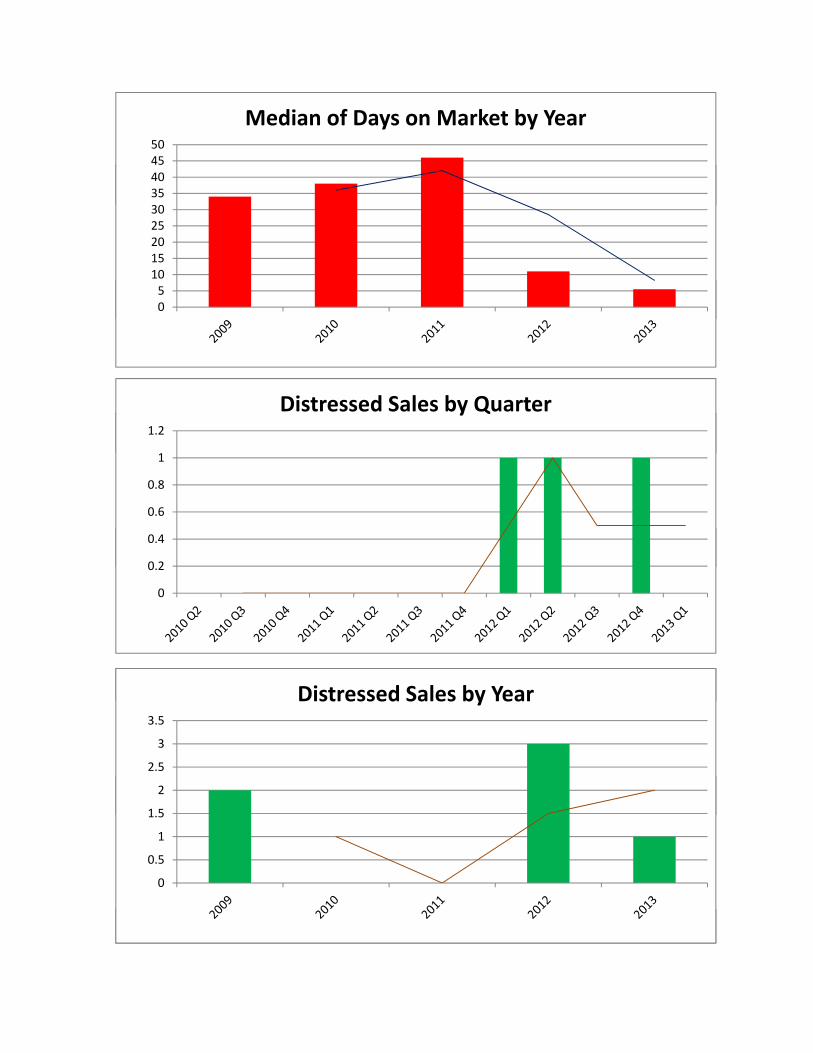
Median of Days on Market by Year
05
10152025303540
1.2
Distressed Sales by Quarter
05
0 2
0.4
0.6
0.8
1
1.2
y Q
0
0.2
0.4
Distressed Sales by Year
1 5
2
2.5
3
3.5
Distressed Sales by Year
0
0.5
1
1.5
2