creative freelancer survey - · pdf filecreative freelancer survey ... forty percent of the...
TRANSCRIPT

1
CREATIVE FREELANCER SURVEY
SURVEY OVERVIEW
In the Capital Region, as elsewhere, a relatively large percentage of jobs in creative industries are not traditional wage and salaried employment. About 53 percent of the jobs in these industries involve income earned by individuals through self-employment. This exceeds the national average of 47 percent. In the Capital Region, and in the U.S., the share of creative industry jobs documented as self-employed has grown over the last decade, by 27 percent and 25 percent, respectively. While some creative self-employed individuals rely on their creative freelance work as a primary source of income, others see it as a supplemental source of income, and still others more of a pastime. In order to understand creative freelancers’ economic impact, it is important to understand how much these individuals rely on the income generated from this work to maintain their standard of living and what are some of the challenges they face in doing work in the region. Secondary data on self-employment are particularly limited, even though self-employed individuals account for such a large share of jobs in creative industries.
In order to gather information on this population in the Capital Region, Mt. Auburn Associates designed and launched a survey targeting individuals in the Capital Region who are self-employed (e.g., operate a business with less than five employees, freelancer, consultant) and earn part or all of their income through creative work such as visual arts and crafts, graphic design, film/media, writing, music, theater, web design, product design,
dance, architecture, interior design, etc. The survey was distributed through traditional media, including newspaper press releases; social media, including Facebook, Twitter, Blogs, and website updates; and through electronic mailings, including e-blasts, personal emails, and newsletters. Additionally, survey outreach was specifically targeted to area chambers of commerce, arts education and support organizations, local chapters of relevant national associations, and other organizations that have access to mailing lists of large numbers of creative freelancers working locally.
In total, 5991
The following text highlights a few of the major findings related to the survey, and the remainder of this document provides detailed tables and graphics on the aggregated survey results.
individuals responded to the survey, 41 percent in visual arts and crafts, 17 percent in design, 20 percent in media, 21 percent in performing arts, and 1 percent in museums. While we cannot generalize the results of this survey to the entire Capital Region, this sample does provide useful insights that were incorporated, as appropriate, into the findings and recommendations found in the Executive Summary.
1 As evident in the following tables, not all 599 survey
respondents answered all questions. Total N is indicated for each question.

2
SURVEY HIGHLIGHTS
Many individuals report heavily relying on their earnings from creative freelancing jobs as their primary source of income.
Of the total number of survey respondents, 45 percent indicate that creative work is their primary source of income, while 32 percent indicate that they are employed, but do their creative freelance work as a secondary source of income. The remaining survey respondents note that they are students, homemakers, unemployed individuals looking for work, or retired individuals doing freelance work on the side.
Half of all survey respondents report that the income generated from their creative work is essential to their standard of living.
While 37 percent of respondents earn $5,000 or less from their creative freelance work, 19 percent of survey respondents report income over $30,000 a year through their creative work, and 11 percent earn over $50,000 a year.2
The majority of freelancers in the Capital Region report sales outside of the region.
Even though relative earnings for the bulk of respondents were low, the income creative freelancers generate from their work is important to their standard of living: 21 percent of survey respondents find that their artwork is essential to maintaining a middle-class or better lifestyle, and 29 percent report that it is essential to allowing their household to meet their minimal household financial needs.
Since income from freelance work is so important to maintaining creative freelancers’ standards of living, many have set up the business infrastructure to sell beyond the region. Selling goods and products to existing markets outside the Capital Region is fairly
2 Twelve percent of respondents chose not to answer
the survey question related to income.
commonplace among freelancers. Seventy-five percent of the 547 survey respondents3
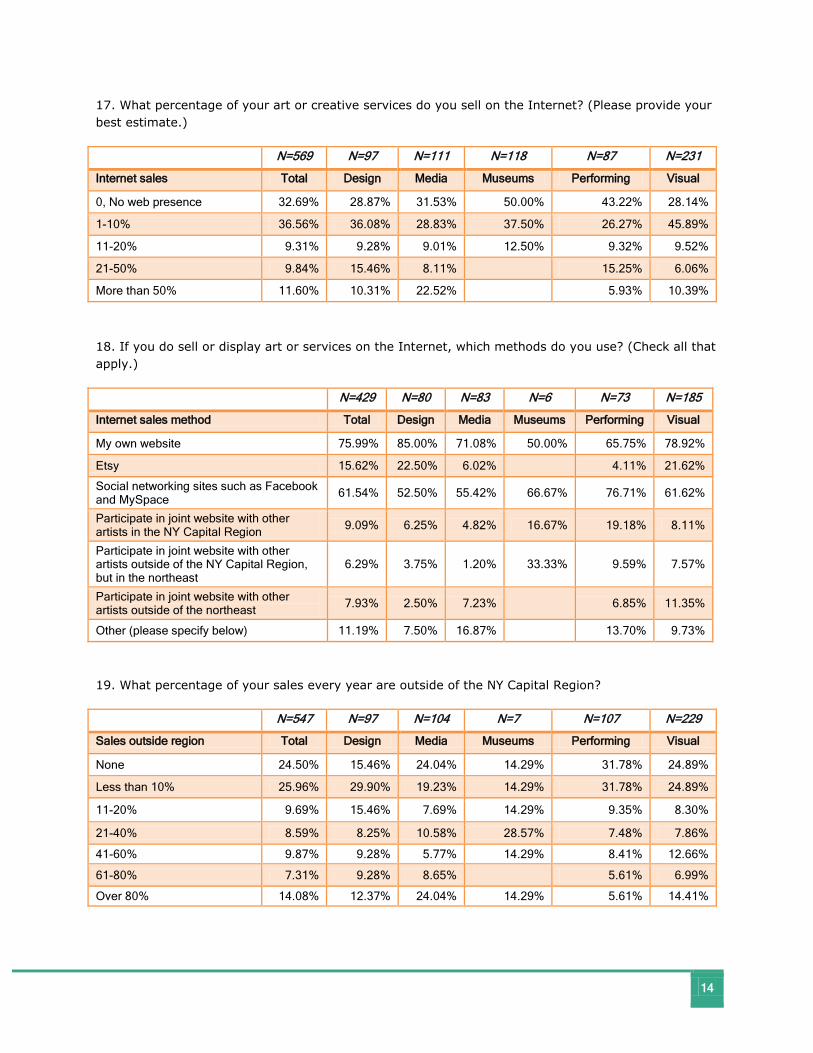
Though Capital Region freelancers report sales outside of the region, survey responses indicate that freelancers are not utilizing the Internet to the extent they could.
report sales outside the Capital Region each year. Fourteen percent of these freelancers report that over 80 percent of their sales each year are outside the region.
Twenty-eight percent of survey respondents working in visual arts report zero Internet sales or no web presence. Nearly one-third of freelancers working in design and media also report zero online sales or no web presence. Only 12 percent of survey respondents across all creative segments report more than 50 percent of their sales to be via web. Directing business support services towards freelancers’ use of online sales could expand exports from this segment of the population, especially since a significant portion of survey respondents indicate an interest in growing their business and/or increasing sales/earnings.
A large number of freelancers in the region want to either grow a creative business out of their freelance work or increase their sales/earnings so that they can make their creative work their primary source of income while remaining a freelancer.
Thirty-nine percent of survey respondents in design and 17 percent of those in media want to grow a creative business, adding employees over time. At the same time, a number of survey respondents are interested in heightening the success of their freelance operation. Forty percent of the visual artists surveyed want to increase their sales/earnings so that they can make their creative work their primary source of income while remaining a freelancer.
3 Total survey responses differ from question to
question as some respondents skipped some questions.

3
Freelancers identified some challenges to their efforts to expand their markets and increase their earnings.
Survey respondents who want to grow a business report that the most significant factors that will impact their growth are growth of markets, access to markets, cost of space, and availability of talent. Over 50 percent of survey respondents note that each of these factors would have a significant impact on their potential.
Survey respondents also indicate that Capital Region independent artists and freelancers
have a number of needs, particularly related to accessing their markets. Respondents note that they need more media coverage; more places to sell, exhibit, or perform; access to information about employment opportunities (and networking opportunities) for creatives; and assistance in the professional business aspects of their operation, particularly in marketing and promotion. Independent freelancers are often professionally trained for years in their specialized discipline, but the success of their business venture rests not only on their ability to create or produce their product, but also on their ability to successfully connect to their market and run their business.

4
SURVEY RESULTS Note: All percentages calculated without accounting for blank responses. 1. Please check the primary creative discipline in which you work. (Check only one answer.)
N=599 N=103 N=118 N=8 N=123 N=243
Discipline Total Design Media Museums Performing Visual
Crafts (e.g., clay, fiber, leather, metal, paper, plastic, wood, mixed-media) 7.85% 19.34%
Dance (e.g., performer, choreographer) 1.34% 6.50% Design (e.g., product design, architecture, landscape architecture, interior design, graphic design, fashion, communications arts)
16.69% 97.09%
Media Arts (e.g., film, video, computer art, multimedia, animation, sound artist, electronic gaming)
6.01% 30.51%
Music (e.g., performer, composer, singer, rapper, dj, producer) 13.36% 65.04%
Theater (e.g., actor, director, playwright, storyteller, lighting designer, set designer, costume designer)
5.34% 26.02%
Visual Art (e.g., painting, sculpture, photography, public art) 31.72% 78.19%
Writing/Literature (e.g., fiction, nonfiction, poetry, journalism, spoken word) 12.69% 64.41%
Interdisciplinary 2.00% 1.94% 3.39% 12.50% 0.81% 0.82%
Other (please specify) 3.01% 0.97% 1.69% 87.50% 1.63% 1.65%
3. If you own or operate a small creative business, how many employees do you have (excluding yourself)?
N=583 N=100 N=115 N=8 N=116 N=240
# Employees Total Design Media Museums Performing Visual
0 56.09% 69.00% 52.17% 50.00% 40.52% 60.83%
1 12.86% 19.00% 15.65% 25.00% 7.76% 11.25%
2 2.92% 4.00% 1.74% 2.59% 3.33%
3 1.54% 1.00% 1.74% 2.59% 0.83%
4 1.54% 0.87% 12.50% 4.31% 0.83%
I don't own or operate a small creative business. 25.04% 7.00% 27.83% 12.50% 42.24% 22.92%
5
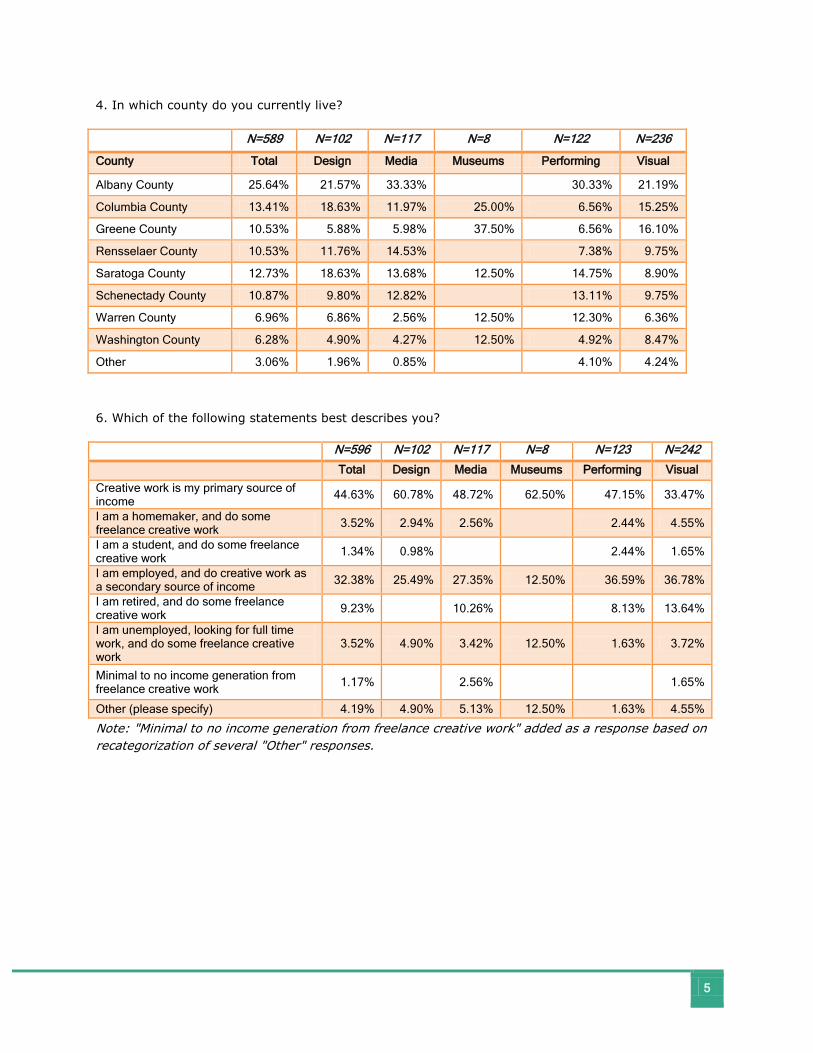
4. In which county do you currently live?
N=589 N=102 N=117 N=8 N=122 N=236
County Total Design Media Museums Performing Visual
Albany County 25.64% 21.57% 33.33% 30.33% 21.19%
Columbia County 13.41% 18.63% 11.97% 25.00% 6.56% 15.25%
Greene County 10.53% 5.88% 5.98% 37.50% 6.56% 16.10%
Rensselaer County 10.53% 11.76% 14.53% 7.38% 9.75%
Saratoga County 12.73% 18.63% 13.68% 12.50% 14.75% 8.90%
Schenectady County 10.87% 9.80% 12.82% 13.11% 9.75%
Warren County 6.96% 6.86% 2.56% 12.50% 12.30% 6.36%
Washington County 6.28% 4.90% 4.27% 12.50% 4.92% 8.47%
Other 3.06% 1.96% 0.85% 4.10% 4.24%
6. Which of the following statements best describes you?
N=596 N=102 N=117 N=8 N=123 N=242
Total Design Media Museums Performing Visual
Creative work is my primary source of income 44.63% 60.78% 48.72% 62.50% 47.15% 33.47%
I am a homemaker, and do some freelance creative work 3.52% 2.94% 2.56% 2.44% 4.55%
I am a student, and do some freelance creative work 1.34% 0.98% 2.44% 1.65%
I am employed, and do creative work as a secondary source of income 32.38% 25.49% 27.35% 12.50% 36.59% 36.78%
I am retired, and do some freelance creative work 9.23% 10.26% 8.13% 13.64%
I am unemployed, looking for full time work, and do some freelance creative work
3.52% 4.90% 3.42% 12.50% 1.63% 3.72%
Minimal to no income generation from freelance creative work 1.17% 2.56% 1.65%
Other (please specify) 4.19% 4.90% 5.13% 12.50% 1.63% 4.55%
Note: "Minimal to no income generation from freelance creative work" added as a response based on recategorization of several "Other" responses.
6
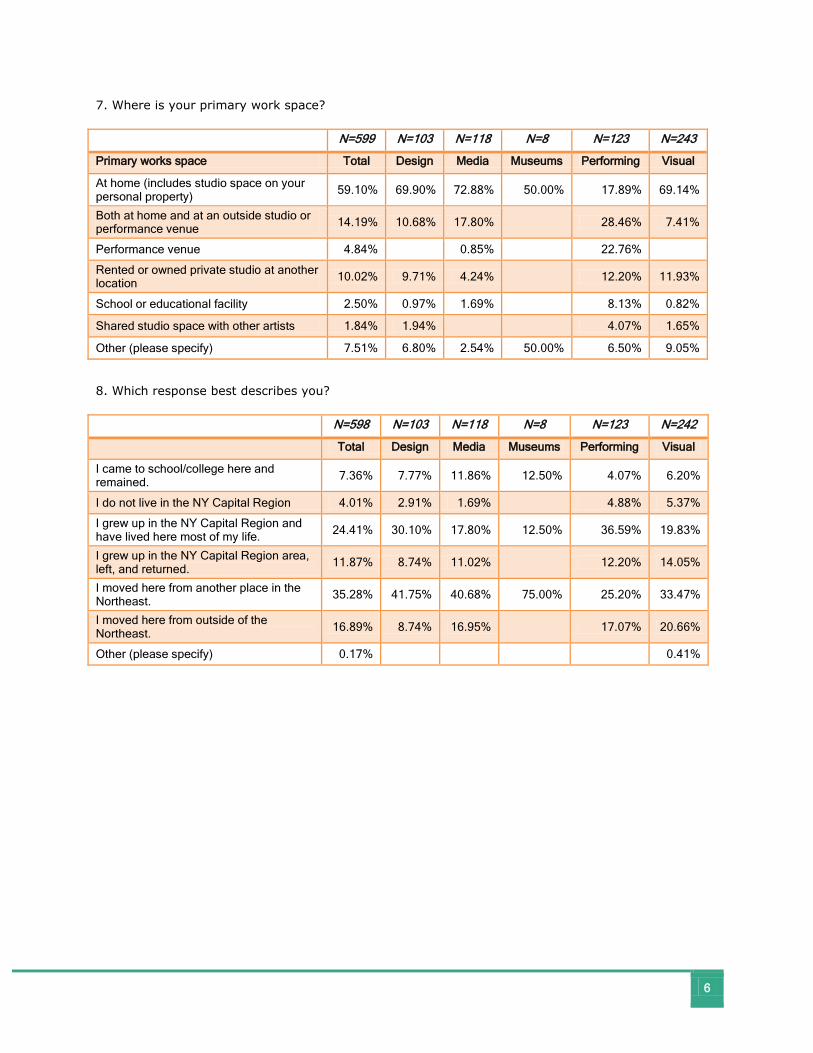
7. Where is your primary work space?
N=599 N=103 N=118 N=8 N=123 N=243
Primary works space Total Design Media Museums Performing Visual
At home (includes studio space on your personal property) 59.10% 69.90% 72.88% 50.00% 17.89% 69.14%
Both at home and at an outside studio or performance venue 14.19% 10.68% 17.80% 28.46% 7.41%
Performance venue 4.84% 0.85% 22.76% Rented or owned private studio at another location 10.02% 9.71% 4.24% 12.20% 11.93%
School or educational facility 2.50% 0.97% 1.69% 8.13% 0.82%
Shared studio space with other artists 1.84% 1.94% 4.07% 1.65%
Other (please specify) 7.51% 6.80% 2.54% 50.00% 6.50% 9.05%
8. Which response best describes you?
N=598 N=103 N=118 N=8 N=123 N=242
Total Design Media Museums Performing Visual
I came to school/college here and remained. 7.36% 7.77% 11.86% 12.50% 4.07% 6.20%
I do not live in the NY Capital Region 4.01% 2.91% 1.69% 4.88% 5.37%
I grew up in the NY Capital Region and have lived here most of my life. 24.41% 30.10% 17.80% 12.50% 36.59% 19.83%
I grew up in the NY Capital Region area, left, and returned. 11.87% 8.74% 11.02% 12.20% 14.05%
I moved here from another place in the Northeast. 35.28% 41.75% 40.68% 75.00% 25.20% 33.47%
I moved here from outside of the Northeast. 16.89% 8.74% 16.95% 17.07% 20.66%
Other (please specify) 0.17% 0.41%
7
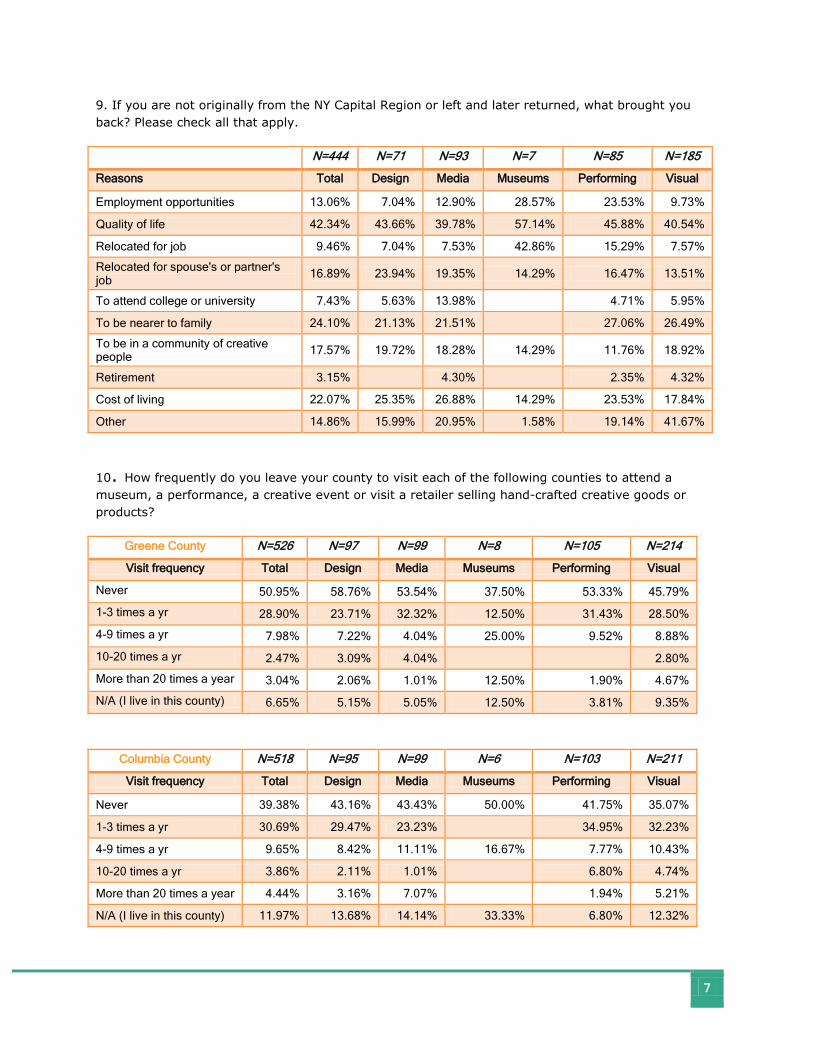
9. If you are not originally from the NY Capital Region or left and later returned, what brought you back? Please check all that apply.
N=444 N=71 N=93 N=7 N=85 N=185
Reasons Total Design Media Museums Performing Visual
Employment opportunities 13.06% 7.04% 12.90% 28.57% 23.53% 9.73%
Quality of life 42.34% 43.66% 39.78% 57.14% 45.88% 40.54%
Relocated for job 9.46% 7.04% 7.53% 42.86% 15.29% 7.57%
Relocated for spouse's or partner's job 16.89% 23.94% 19.35% 14.29% 16.47% 13.51%
To attend college or university 7.43% 5.63% 13.98% 4.71% 5.95%
To be nearer to family 24.10% 21.13% 21.51% 27.06% 26.49%
To be in a community of creative people 17.57% 19.72% 18.28% 14.29% 11.76% 18.92%
Retirement 3.15% 4.30% 2.35% 4.32%
Cost of living 22.07% 25.35% 26.88% 14.29% 23.53% 17.84%
Other 14.86% 15.99% 20.95% 1.58% 19.14% 41.67%
10. How frequently do you leave your county to visit each of the following counties to attend a museum, a performance, a creative event or visit a retailer selling hand-crafted creative goods or products?
Greene County N=526 N=97 N=99 N=8 N=105 N=214
Visit frequency Total Design Media Museums Performing Visual
Never 50.95% 58.76% 53.54% 37.50% 53.33% 45.79%
1-3 times a yr 28.90% 23.71% 32.32% 12.50% 31.43% 28.50%
4-9 times a yr 7.98% 7.22% 4.04% 25.00% 9.52% 8.88%
10-20 times a yr 2.47% 3.09% 4.04% 2.80%
More than 20 times a year 3.04% 2.06% 1.01% 12.50% 1.90% 4.67%
N/A (I live in this county) 6.65% 5.15% 5.05% 12.50% 3.81% 9.35%
Columbia County N=518 N=95 N=99 N=6 N=103 N=211
Visit frequency Total Design Media Museums Performing Visual
Never 39.38% 43.16% 43.43% 50.00% 41.75% 35.07%
1-3 times a yr 30.69% 29.47% 23.23% 34.95% 32.23%
4-9 times a yr 9.65% 8.42% 11.11% 16.67% 7.77% 10.43%
10-20 times a yr 3.86% 2.11% 1.01% 6.80% 4.74%
More than 20 times a year 4.44% 3.16% 7.07% 1.94% 5.21%
N/A (I live in this county) 11.97% 13.68% 14.14% 33.33% 6.80% 12.32%

8
Albany County N=551 N=99 N=104 N=7 N=116 N=221
Visit frequency Total Design Media Museums Performing Visual
Never 5.26% 8.08% 3.85% 2.59% 6.33%
1-3 times a yr 25.23% 25.25% 22.12% 57.14% 19.83% 28.96%
4-9 times a yr 22.50% 23.23% 22.12% 14.29% 25.00% 21.27%
10-20 times a yr 15.06% 18.18% 17.31% 11.21% 15.38%
More than 20 times a year 14.16% 14.14% 14.42% 28.57% 18.10% 11.76%
N/A (I live in this county) 17.79% 11.11% 20.19% 23.28% 16.29%
Rensselaer County N=521 N=97 N=102 N=5 N=109 N=204
Visit frequency Total Design Media Museums Performing Visual
Never 24.95% 28.87% 16.67% 40.00% 22.02% 28.43%
1-3 times a yr 34.55% 28.87% 35.29% 20.00% 37.61% 35.78%
4-9 times a yr 16.51% 22.68% 14.71% 20.00% 17.43% 14.22%
10-20 times a yr 9.79% 7.22% 15.69% 20.00% 8.26% 8.82%
More than 20 times a year 8.64% 6.19% 7.84% 11.01% 8.82%
N/A (I live in this county) 5.57% 6.19% 9.80% 3.67% 3.92%
Schenectady County N=535 N=97 N=108 N=6 N=111 N=210
Visit frequency Total Design Media Museums Performing Visual
Never 23.18% 24.74% 13.89% 50.00% 15.32% 30.48%
1-3 times a yr 39.63% 42.27% 40.74% 33.33% 28.83% 43.81%
4-9 times a yr 16.07% 13.40% 19.44% 16.67% 26.13% 10.48%
10-20 times a yr 8.04% 4.12% 11.11% 11.71% 6.67%
More than 20 times a year 5.79% 7.22% 6.48% 9.91% 2.38%
N/A (I live in this county) 7.29% 8.25% 8.33% 8.11% 6.19%
Saratoga County N=547 N=102 N=110 N=6 N=111 N=214
Visit frequency Total Design Media Museums Performing Visual
Never 12.07% 12.75% 9.09% 33.33% 9.91% 14.02%
1-3 times a yr 35.10% 32.35% 40.00% 16.67% 24.32% 39.72%
4-9 times a yr 22.12% 24.51% 20.00% 16.67% 26.13% 20.56%
10-20 times a yr 13.53% 15.69% 10.91% 17.12% 12.15%
More than 20 times a year 9.32% 4.90% 10.91% 16.67% 14.41% 7.48%
N/A (I live in this county) 7.86% 9.80% 9.09% 16.67% 8.11% 6.07%
9
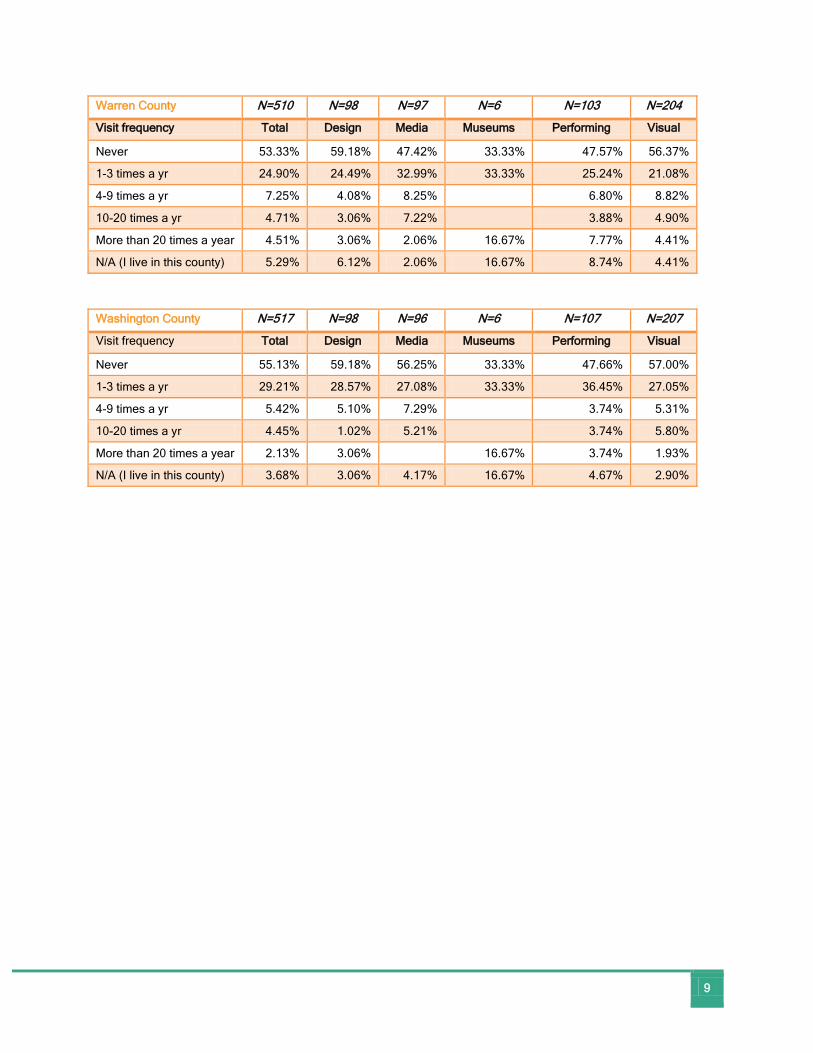
Warren County N=510 N=98 N=97 N=6 N=103 N=204
Visit frequency Total Design Media Museums Performing Visual
Never 53.33% 59.18% 47.42% 33.33% 47.57% 56.37%
1-3 times a yr 24.90% 24.49% 32.99% 33.33% 25.24% 21.08%
4-9 times a yr 7.25% 4.08% 8.25% 6.80% 8.82%
10-20 times a yr 4.71% 3.06% 7.22% 3.88% 4.90%
More than 20 times a year 4.51% 3.06% 2.06% 16.67% 7.77% 4.41%
N/A (I live in this county) 5.29% 6.12% 2.06% 16.67% 8.74% 4.41%
Washington County N=517 N=98 N=96 N=6 N=107 N=207
Visit frequency Total Design Media Museums Performing Visual
Never 55.13% 59.18% 56.25% 33.33% 47.66% 57.00%
1-3 times a yr 29.21% 28.57% 27.08% 33.33% 36.45% 27.05%
4-9 times a yr 5.42% 5.10% 7.29% 3.74% 5.31%
10-20 times a yr 4.45% 1.02% 5.21% 3.74% 5.80%
More than 20 times a year 2.13% 3.06% 16.67% 3.74% 1.93%
N/A (I live in this county) 3.68% 3.06% 4.17% 16.67% 4.67% 2.90%

10
Note: Each county is assigned a
color. The color of the dots
corresponds to the county, and the
dots are proportionately sized to
reflect the percentage of respondents
from that county who reported
visiting a county in the region at
least one time per year. For
example, the orange dot in Warren
County indicates that a high
percentage of respondents from
Washington County visit Warren
County at least once a year, while a
low percentage of respondents from
Greene County visit at least once a
year.

11
11. Approximately what was the annual gross income of your arts-related work last year?
N=587 N=100 N=116 N=8 N=119 N=240
Annual gross income Total Design Media Museums Performing Visual
Less than $2,000 22.15% 12.00% 19.83% 18.49% 30.00%
$2,001 - $5,000 14.99% 16.00% 8.62% 12.50% 13.45% 18.75%
$5,001 - $15,000 20.61% 16.00% 24.14% 12.50% 25.21% 19.17%
$15,001 - $30,000 11.93% 13.00% 12.07% 25.00% 15.97% 9.17%
$30,001 - $50,000 7.84% 12.00% 6.90% 12.50% 9.24% 5.42%
More than $50,000 10.90% 22.00% 10.34% 12.50% 8.40% 7.50%
Prefer not to answer 11.58% 9.00% 18.10% 25.00% 9.24% 10.00%
12. When comparing 2012 to 2013, did your income from your art or creative work:
N=585 N=101 N=116 N=8 N=118 N=238
Change in income 2012-2013 Total Design Media Museums Performing Visual
Decrease significantly (more than 25%) 7.01% 9.90% 5.17% 5.93% 7.56%
Decrease a little (10 to 25%) 8.55% 8.91% 6.90% 12.50% 8.47% 8.82%
Stay about the same (no more than 10% up or down) 40.51% 27.72% 37.07% 37.50% 50.00% 42.86%
Increase a little (10-25%) 22.91% 33.66% 25.86% 12.50% 16.10% 21.01%
Increase significantly (more than 25%) 14.87% 15.84% 18.10% 13.56% 13.87%
Other (please specify) 6.15% 3.96% 6.90% 37.50% 5.93% 5.88%
13. How would you describe the income your household derives from your art? Is it:
N=577 N=101 N=112 N=8 N=118 N=234
Total Design Media Museums Performing Visual
Essential to maintaining a middle class or better lifestyle 20.80% 31.68% 22.32% 50.00% 22.88% 13.25%
Essential to allowing my household to meet our minimal household financial needs
28.77% 34.65% 32.14% 37.50% 33.90% 21.79%
Supplementary, not essential to maintaining our standard of living 35.36% 22.77% 30.36% 33.90% 45.73%
Primarily a hobby, with minimal or no income generation 11.79% 6.93% 11.61% 7.63% 15.81%
Other (please specify) 3.29% 3.96% 3.57% 12.50% 1.69% 3.42%

12
14. Which of the following statements best defines your goal for your independent creative work?
N=574 N=101 N=112 N=8 N=118 N=233
Goal Total Design Media Museums Performing Visual
I'd like to continue my independent creative work at a higher level of activity and/or income
4.01% 5.94% 0.89% 8.47% 2.58%
I'd like to continue my independent creative work at my current level of activity and income
16.72% 14.85% 16.96% 37.50% 22.88% 13.30%
I'd like to find a full-time job at a company or organization where I can work in a position that draws on my creative talents
7.84% 10.89% 8.93% 12.50% 11.02% 4.29%
I'd like to find a job outside of the creative arena so that I no longer have to do freelance creative work
0.17% 0.99%
I'd like to grow a creative business, adding employees over time 18.99% 38.61% 16.96% 12.50% 14.41% 14.16%
I'd like to increase sales/earnings so that I can make my creative work my primary source of income, but remain a freelancer
32.40% 17.82% 39.29% 25.00% 22.88% 40.34%
I'd like to increase sales/earnings, but not to the point where that becomes my primary source of income
17.60% 10.89% 12.50% 18.64% 23.18%
Other (please specify) 2.26% 4.46% 12.50% 1.69% 2.15%
Note: "I'd like to continue my independent creative work at a higher level of activity and/or income" added as a response based on recategorization of "Other (please specify)" responses.
15. If you seek to grow a creative business, how much will the following factors impact your work?
Growth of markets N=144 N=45 N=22 N=2 N=29 N=43
Total Design Media Museums Performing Visual
Not at all 9.03% 4.44% 4.55% 50.00% 10.34% 11.63%
Modestly 33.33% 31.11% 45.45% 31.03% 32.56%
Significantly 57.64% 64.44% 50.00% 50.00% 58.62% 55.81%
Access to markets N=146 N=45 N=24 N=2 N=29 N=43
Total Design Media Museums Performing Visual
Not at all 10.96% 8.89% 8.33% 50.00% 10.34% 11.63%
Modestly 27.40% 26.67% 37.50% 27.59% 23.26%
Significantly 61.64% 64.44% 54.17% 50.00% 62.07% 65.12%

13
Cost of capital equipment N=141 N=42 N=24 N=2 N=29 N=41
Total Design Media Museums Performing Visual
Not at all 20.57% 26.19% 33.33% 50.00% 6.90% 14.63%
Modestly 44.68% 42.86% 41.67% 41.38% 51.22%
Significantly 34.75% 30.95% 25.00% 50.00% 51.72% 34.15%
Access to financing N=141 N=42 N=23 N=2 N=30 N=41
Total Design Media Museums Performing Visual
Not at all 24.82% 33.33% 21.74% 16.67% 26.83%
Modestly 31.21% 35.71% 30.43% 23.33% 31.71%
Significantly 43.97% 30.95% 47.83% 100.00% 60.00% 41.46%
Business management capacity
N=141 N=44 N=23 N=2 N=28 N=41
Total Design Media Museums Performing Visual
Not at all 17.73% 20.45% 13.04% 17.86% 17.07%
Modestly 48.94% 45.45% 52.17% 50.00% 46.43% 53.66%
Significantly 33.33% 34.09% 34.78% 50.00% 35.71% 29.27%
Cost of space N=143 N=45 N=23 N=2 N=29 N=41
Total Design Media Museums Performing Visual
Not at all 20.28% 22.22% 17.39% 50.00% 13.79% 19.51%
Modestly 28.67% 33.33% 47.83% 31.03% 12.20%
Significantly 51.05% 44.44% 34.78% 50.00% 55.17% 68.29%
Availability of talent N=143 N=45 N=23 N=2 N=29 N=41
Total Design Media Museums Performing Visual
Not at all 19.58% 11.11% 13.04% 24.14% 31.71%
Modestly 30.07% 37.78% 21.74% 24.14% 29.27%
Significantly 50.35% 51.11% 65.22% 100.00% 51.72% 39.02%
14
17. What percentage of your art or creative services do you sell on the Internet? (Please provide your best estimate.)
N=569 N=97 N=111 N=118 N=87 N=231
Internet sales Total Design Media Museums Performing Visual
0, No web presence 32.69% 28.87% 31.53% 50.00% 43.22% 28.14%
1-10% 36.56% 36.08% 28.83% 37.50% 26.27% 45.89%
11-20% 9.31% 9.28% 9.01% 12.50% 9.32% 9.52%
21-50% 9.84% 15.46% 8.11% 15.25% 6.06%
More than 50% 11.60% 10.31% 22.52% 5.93% 10.39%
18. If you do sell or display art or services on the Internet, which methods do you use? (Check all that apply.)
N=429 N=80 N=83 N=6 N=73 N=185
Internet sales method Total Design Media Museums Performing Visual
My own website 75.99% 85.00% 71.08% 50.00% 65.75% 78.92%
Etsy 15.62% 22.50% 6.02% 4.11% 21.62%
Social networking sites such as Facebook and MySpace 61.54% 52.50% 55.42% 66.67% 76.71% 61.62%
Participate in joint website with other artists in the NY Capital Region 9.09% 6.25% 4.82% 16.67% 19.18% 8.11%
Participate in joint website with other artists outside of the NY Capital Region, but in the northeast
6.29% 3.75% 1.20% 33.33% 9.59% 7.57%
Participate in joint website with other artists outside of the northeast 7.93% 2.50% 7.23% 6.85% 11.35%
Other (please specify below) 11.19% 7.50% 16.87% 13.70% 9.73%
19. What percentage of your sales every year are outside of the NY Capital Region?
N=547 N=97 N=104 N=7 N=107 N=229
Sales outside region Total Design Media Museums Performing Visual
None 24.50% 15.46% 24.04% 14.29% 31.78% 24.89%
Less than 10% 25.96% 29.90% 19.23% 14.29% 31.78% 24.89%
11-20% 9.69% 15.46% 7.69% 14.29% 9.35% 8.30%
21-40% 8.59% 8.25% 10.58% 28.57% 7.48% 7.86%
41-60% 9.87% 9.28% 5.77% 14.29% 8.41% 12.66%
61-80% 7.31% 9.28% 8.65% 5.61% 6.99%
Over 80% 14.08% 12.37% 24.04% 14.29% 5.61% 14.41%

15
20. To date, what percentage of the funding for your creative work has come from the following sources:
N=471 N=83 N=87 N=6 N=87 N=205
Funding source Total Design Media Museums Performing Visual
Personal savings 74.78% 84.96% 68.36% 49.17% 67.67% 77.27%
Loans from family and friends 2.41% 3.55% 1.98% 1.67% 1.84% 2.43%
Informal donations/gifts from family and friends 2.87% 1.10% 2.87% 0.00% 4.71% 2.93%
Crowd-sourcing websites 0.74% 0.00% 0.92% 0.00% 1.95% 0.47%
Grants or loans from private foundations 1.41% 0.00% 2.47% 1.67% 2.93% 0.89%
Grants or loans from nonprofit organizations 1.54% 0.02% 0.46% 17.50% 2.76% 1.65%
Grants or loans from government 1.37% 0.18% 1.74% 11.67% 1.85% 0.78%
Grants or loans from banks 0.93% 2.17% 0.46% 1.67% 0.30% 0.88%
Investors 1.07% 0.30% 1.72% 0.00% 0.17% 1.54%
Other 12.88% 7.71% 19.02% 16.67% 15.82% 11.15%
Note: Percentages listed in above table are averages of percentages as reported by question respondents.
21. Are you a member of any of the following?
N=535 N=95 N=105 N=8 N=110 N=214
Association Total Design Media Museums Performing Visual
Membership-based local network, association, chapter or guild related to your discipline
41.87% 36.84% 39.05% 50.00% 41.82% 45.33%
Membership-based national professional association related to your discipline 34.58% 33.68% 31.43% 62.50% 52.73% 25.70%
Informal local network, club or association 33.27% 34.74% 36.19% 25.00% 25.45% 35.05%
I do not belong to any formal or informal networks or groups related to my discipline
28.04% 33.68% 27.62% 12.50% 26.36% 27.10%
Other 6.36% 5.26% 5.71% 25.00% 5.45% 7.01%

16
*This graphic includes only those affiliations listed by more than three survey respondents.
22. How often do you interact/network with your creative peers and colleagues through the following networks or at the following locations:
Local associations related to arts
N=514 N=89 N=102 N=6 N=110 N=204
Interaction frequency Total Design Media Museums Performing Visual
Never 17.51% 23.60% 18.63% 33.33% 20.00% 12.25%
1 Rarely (once a yr) 17.90% 23.60% 21.57% 16.36% 15.20%
2 16.93% 19.10% 15.69% 19.09% 16.18%
3 20.43% 17.98% 18.63% 33.33% 17.27% 23.53%
4 14.20% 11.24% 12.75% 33.33% 11.82% 17.16%
5 Often (once a week or more) 13.04% 4.49% 12.75% 15.45% 15.69%

17
National associations related to your art
N=481 N=87 N=94 N=6 N=105 N=186
Interaction frequency Total Design Media Museums Performing Visual
Never 38.05% 44.83% 30.85% 16.67% 34.29% 41.94%
1 Rarely (once a yr) 27.86% 29.89% 35.11% 50.00% 25.71% 23.66%
2 14.35% 11.49% 14.89% 16.67% 16.19% 14.52%
3 9.56% 6.90% 8.51% 16.67% 11.43% 9.68%
4 4.99% 3.45% 5.32% 6.67% 4.30%
5 Often (once a week or more) 5.20% 3.45% 5.32% 5.71% 5.91%
Community or neighborhood organizations
N=478 N=89 N=91 N=6 N=103 N=186
Interaction frequency Total Design Media Museums Performing Visual
Never 21.55% 26.97% 17.58% 33.33% 21.36% 19.89%
1 Rarely (once a yr) 15.69% 17.98% 14.29% 16.50% 15.59%
2 21.34% 21.35% 24.18% 16.67% 21.36% 20.43%
3 18.62% 16.85% 20.88% 16.67% 17.48% 19.35%
4 9.83% 10.11% 10.99% 16.67% 5.83% 10.75%
5 Often (once a week or more) 12.97% 6.74% 12.09% 16.67% 17.48% 13.98%
Exhibit or performance venues, openings
N=509 N=87 N=93 N=6 N=109 N=211
Interaction frequency Total Design Media Museums Performing Visual
Never 11.59% 27.59% 17.20% 16.67% 5.50% 5.21%
1 Rarely (once a yr) 11.79% 19.54% 12.90% 16.67% 11.01% 8.53%
2 18.27% 24.14% 22.58% 16.67% 13.76% 16.59%
3 20.24% 8.05% 21.51% 16.67% 20.18% 24.64%
4 20.24% 14.94% 8.60% 16.67% 22.94% 26.07%
5 Often (once a week or more) 17.88% 5.75% 17.20% 16.67% 26.61% 18.96%

18
Neighborhood eating or drinking establishments
N=481 N=90 N=93 N=6 N=104 N=185
Interaction frequency Total Design Media Museums Performing Visual
Never 21.62% 26.67% 18.28% 33.33% 17.31% 22.70%
1 Rarely (once a yr) 12.89% 17.78% 6.45% 16.67% 13.46% 13.51%
2 19.75% 20.00% 25.81% 16.67% 12.50% 20.54%
3 16.01% 15.56% 21.51% 20.19% 11.35%
4 12.68% 7.78% 12.90% 16.35% 13.51%
5 Often (once a week or more) 17.05% 12.22% 15.05% 33.33% 20.19% 18.38%
Social media N=508 N=91 N=100 N=6 N=103 N=205
Interaction frequency Total Design Media Museums Performing Visual
Never 6.89% 3.30% 7.00% 7.77% 8.29%
1 Rarely (once a yr) 4.13% 6.59% 1.00% 8.74% 2.44%
2 11.42% 14.29% 16.00% 12.62% 7.80%
3 9.45% 17.58% 7.00% 16.67% 7.77% 7.80%
4 13.78% 16.48% 9.00% 13.59% 15.61%
5 Often (once a week or more) 54.33% 41.76% 60.00% 83.33% 49.51% 58.05%
Workshops/trainings/meetings N=497 N=91 N=95 N=6 N=104 N=198
Interaction frequency Total Design Media Museums Performing Visual
Never 19.92% 21.98% 15.79% 16.67% 18.27% 21.72%
1 Rarely (once a yr) 24.75% 26.37% 25.26% 16.67% 27.88% 22.22%
2 22.94% 26.37% 24.21% 50.00% 24.04% 19.70%
3 17.10% 10.99% 22.11% 16.67% 15.38% 18.18%
4 9.66% 8.79% 8.42% 10.58% 10.61%
5 Often (once a week or more) 5.63% 5.49% 4.21% 3.85% 7.58%

19
24. How frequently do you leave your county to visit the following counties in order to network with other creative colleagues or peers?
Greene County N=478 N=88 N=90 N=6 N=95 N=196
Frequency Total Design Media Museums Performing Visual
Never 70.29% 80.68% 75.56% 50.00% 77.89% 60.20%
1-3 times a yr 15.48% 13.64% 12.22% 16.67% 11.58% 19.39%
4-9 times a yr 4.18% 4.44% 16.67% 5.26% 5.10%
10-20 times a yr 1.26% 2.27% 2.22% 1.05% 0.51%
More than 20 times a year 1.46% 1.11% 3.06%
N/A (I live in this county) 7.32% 3.41% 4.44% 16.67% 4.21% 11.73%
Columbia County N=476 N=87 N=91 N=4 N=97 N=194
Frequency Total Design Media Museums Performing Visual
Never 63.66% 75.86% 62.64% 75.00% 68.04% 56.19%
1-3 times a yr 16.18% 6.90% 15.38% 16.49% 20.62%
4-9 times a yr 5.25% 5.49% 8.25% 6.19%
10-20 times a yr 1.68% 2.30% 2.06% 2.06%
More than 20 times a year 1.89% 1.15% 3.30% 2.06% 1.55%
N/A (I live in this county) 11.34% 13.79% 13.19% 25.00% 3.09% 13.40%
Albany County N=494 N=89 N=92 N=5 N=103 N=202
Frequency Total Design Media Museums Performing Visual
Never 25.30% 26.97% 18.48% 20.00% 19.42% 31.19%
1-3 times a yr 26.72% 26.97% 26.09% 80.00% 22.33% 28.22%
4-9 times a yr 12.75% 13.48% 14.13% 16.50% 10.40%
10-20 times a yr 9.72% 7.87% 9.78% 11.65% 9.90%
More than 20 times a year 6.88% 10.11% 7.61% 8.74% 4.46%
N/A (I live in this county) 18.62% 14.61% 23.91% 21.36% 15.84%

20
Rensselaer County N=493 N=90 N=90 N=4 N=97 N=189
Frequency Total Design Media Museums Performing Visual
Never 46.51% 46.67% 34.44% 75.00% 42.27% 53.97%
1-3 times a yr 25.58% 23.33% 28.89% 25.00% 27.84% 23.81%
4-9 times a yr 13.53% 14.44% 21.11% 13.40% 10.05%
10-20 times a yr 5.50% 3.33% 6.67% 7.22% 5.29%
More than 20 times a year 4.23% 5.56% 1.11% 6.19% 3.70%
N/A (I live in this county) 4.65% 6.67% 7.78% 3.09% 3.17%
Schenectady County N=476 N=88 N=90 N=4 N=101 N=190
Frequency Total Design Media Museums Performing Visual
Never 50.84% 52.27% 45.56% 100.00% 32.67% 61.58%
1-3 times a yr 23.74% 27.27% 22.22% 26.73% 22.11%
4-9 times a yr 10.08% 10.23% 13.33% 15.84% 5.26%
10-20 times a yr 4.83% 1.14% 3.33% 11.88% 3.68%
More than 20 times a year 2.52% 1.14% 3.33% 3.96% 1.58%
N/A (I live in this county) 7.98% 7.95% 12.22% 8.91% 5.79%
Saratoga County N=480 N=90 N=89 N=4 N=97 N=197
Frequency Total Design Media Museums Performing Visual
Never 40.63% 41.11% 40.45% 25.00% 31.96% 45.18%
1-3 times a yr 26.46% 27.78% 31.46% 50.00% 18.56% 27.41%
4-9 times a yr 14.17% 10.00% 8.99% 24.74% 13.71%
10-20 times a yr 5.63% 5.56% 2.25% 9.28% 5.08%
More than 20 times a year 4.79% 4.44% 6.74% 9.28% 1.52%
N/A (I live in this county) 8.33% 11.11% 10.11% 25.00% 6.19% 7.11%
Warren County N=470 N=87 N=89 N=4 N=96 N=191
Frequency Total Design Media Museums Performing Visual
Never 72.55% 80.46% 75.28% 50.00% 65.63% 71.73%
1-3 times a yr 12.77% 9.20% 11.24% 12.50% 15.71%
4-9 times a yr 2.77% 2.30% 2.25% 2.08% 3.66%
10-20 times a yr 3.40% 1.15% 4.49% 25.00% 3.13% 3.66%
More than 20 times a year 2.98% 3.37% 7.29% 1.57%
N/A (I live in this county) 5.53% 6.90% 3.37% 25.00% 9.38% 3.66%

21
Washington County N=462 N=86 N=86 N=4 N=95 N=188
Frequency Total Design Media Museums Performing Visual
Never 74.46% 86.05% 75.58% 50.00% 70.53% 71.28%
1-3 times a yr 16.02% 5.81% 11.63% 25.00% 21.05% 19.68%
4-9 times a yr 2.60% 3.49% 3.49% 25.00% 2.11% 1.60%
10-20 times a yr 1.08% 1.16% 1.05% 1.60%
More than 20 times a year 0.65% 1.16% 1.06%
N/A (I live in this county) 5.19% 4.65% 6.98% 5.26% 4.79%

22
Note: Each county is assigned a
color. The color of the dots
corresponds to the county, and the
dots are proportionately sized to
reflect the percentage of respondents
from that county who reported visiting
a county in the region at least one
time per year. For example, the
orange dot in Warren County indicates
that a high percentage of respondents
from Washington County visit Warren
County at least once a year, while a
low percentage of respondents from
Columbia County visit at least once a
year.
23
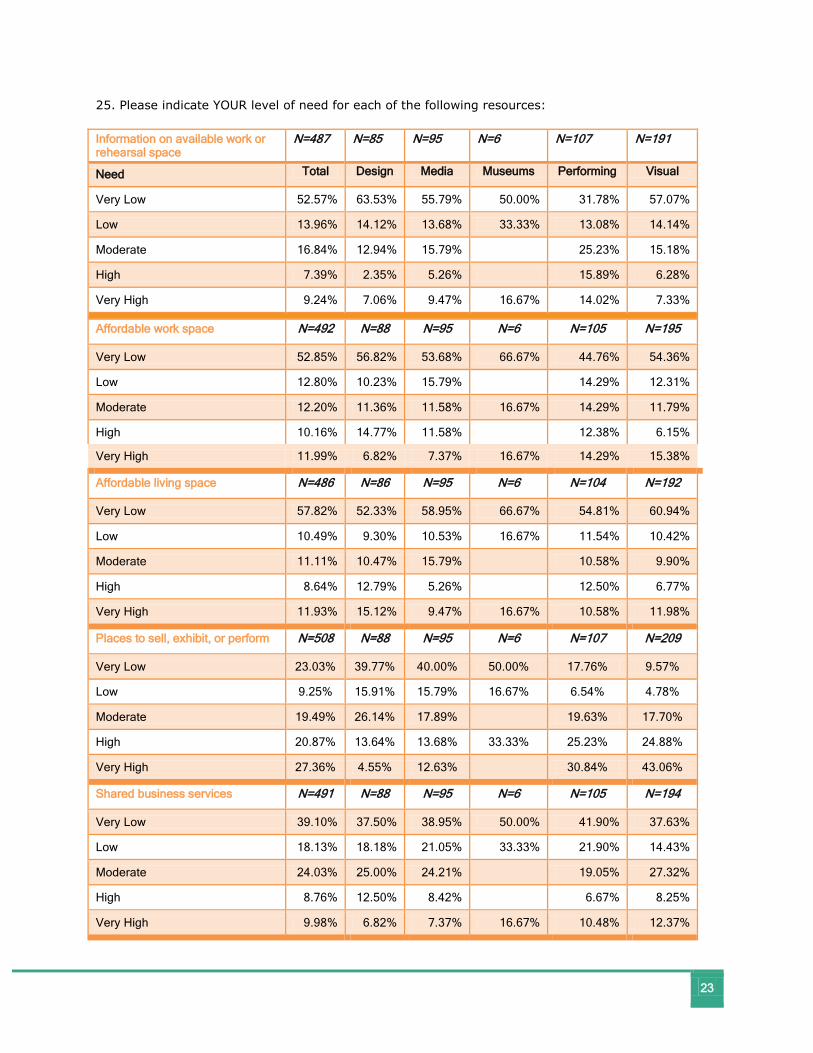
25. Please indicate YOUR level of need for each of the following resources:
Information on available work or rehearsal space
N=487 N=85 N=95 N=6 N=107 N=191
Need Total Design Media Museums Performing Visual
Very Low 52.57% 63.53% 55.79% 50.00% 31.78% 57.07%
Low 13.96% 14.12% 13.68% 33.33% 13.08% 14.14%
Moderate 16.84% 12.94% 15.79% 25.23% 15.18%
High 7.39% 2.35% 5.26% 15.89% 6.28%
Very High 9.24% 7.06% 9.47% 16.67% 14.02% 7.33%
Affordable work space N=492 N=88 N=95 N=6 N=105 N=195
Very Low 52.85% 56.82% 53.68% 66.67% 44.76% 54.36%
Low 12.80% 10.23% 15.79% 14.29% 12.31%
Moderate 12.20% 11.36% 11.58% 16.67% 14.29% 11.79%
High 10.16% 14.77% 11.58% 12.38% 6.15%
Very High 11.99% 6.82% 7.37% 16.67% 14.29% 15.38%
Affordable living space N=486 N=86 N=95 N=6 N=104 N=192
Very Low 57.82% 52.33% 58.95% 66.67% 54.81% 60.94%
Low 10.49% 9.30% 10.53% 16.67% 11.54% 10.42%
Moderate 11.11% 10.47% 15.79% 10.58% 9.90%
High 8.64% 12.79% 5.26% 12.50% 6.77%
Very High 11.93% 15.12% 9.47% 16.67% 10.58% 11.98%
Places to sell, exhibit, or perform N=508 N=88 N=95 N=6 N=107 N=209
Very Low 23.03% 39.77% 40.00% 50.00% 17.76% 9.57%
Low 9.25% 15.91% 15.79% 16.67% 6.54% 4.78%
Moderate 19.49% 26.14% 17.89% 19.63% 17.70%
High 20.87% 13.64% 13.68% 33.33% 25.23% 24.88%
Very High 27.36% 4.55% 12.63% 30.84% 43.06%
Shared business services N=491 N=88 N=95 N=6 N=105 N=194
Very Low 39.10% 37.50% 38.95% 50.00% 41.90% 37.63%
Low 18.13% 18.18% 21.05% 33.33% 21.90% 14.43%
Moderate 24.03% 25.00% 24.21% 19.05% 27.32%
High 8.76% 12.50% 8.42% 6.67% 8.25%
Very High 9.98% 6.82% 7.37% 16.67% 10.48% 12.37%

24
Shared studio space N=486 N=89 N=91 N=6 N=105 N=192
Need Total Design Media Museums Performing Visual
Very Low 62.35% 64.04% 70.33% 83.33% 57.14% 59.38%
Low 15.64% 14.61% 13.19% 19.05% 16.15%
Moderate 11.11% 12.36% 9.89% 9.52% 12.50%
High 4.94% 4.49% 3.30% 7.62% 4.17%
Very High 5.97% 4.49% 3.30% 16.67% 6.67% 7.81%
Business/financial management assistance
N=495 N=89 N=92 N=6 N=107 N=198
Very Low 33.74% 31.46% 42.39% 50.00% 35.51% 28.79%
Low 15.76% 21.35% 11.96% 16.67% 21.50% 12.12%
Moderate 24.04% 24.72% 23.91% 16.67% 20.56% 25.76%
High 14.34% 11.24% 13.04% 11.21% 18.69%
Very High 12.12% 11.24% 8.70% 16.67% 11.21% 14.65%
Marketing assistance N=502 N=89 N=97 N=6 N=105 N=202
Very Low 24.30% 37.08% 29.90% 50.00% 25.71% 14.36%
Low 12.55% 20.22% 12.37% 12.38% 9.90%
Moderate 26.10% 16.85% 31.96% 16.67% 27.62% 26.73%
High 19.12% 14.61% 13.40% 18.10% 23.76%
Very High 17.93% 11.24% 12.37% 33.33% 16.19% 25.25%
Computer/web/technology assistance
N=497 N=88 N=95 N=6 N=104 N=201
Very Low 26.16% 40.91% 23.16% 16.67% 25.00% 21.89%
Low 19.32% 22.73% 22.11% 16.67% 22.12% 15.42%
Moderate 23.34% 18.18% 20.00% 16.67% 24.04% 27.36%
High 17.91% 9.09% 23.16% 33.33% 20.19% 16.92%
Very High 13.28% 9.09% 11.58% 16.67% 8.65% 18.41%
Assistance protecting my intellectual property
N=492 N=89 N=93 N=6 N=105 N=196
Very Low 30.69% 35.96% 35.48% 16.67% 39.05% 21.94%
Low 20.73% 20.22% 19.35% 21.90% 21.43%
Moderate 24.80% 22.47% 23.66% 50.00% 18.10% 29.59%
High 12.80% 14.61% 13.98% 16.67% 12.38% 11.22%
Very High 10.98% 6.74% 7.53% 16.67% 8.57% 15.82%

25
Assistance pricing my art or performance
N=490 N=88 N=90 N=6 N=106 N=197
Need Total Design Media Museums Performing Visual
Very Low 37.96% 42.05% 54.44% 33.33% 41.51% 26.40%
Low 21.22% 22.73% 15.56% 16.67% 20.75% 23.86%
Moderate 17.55% 17.05% 13.33% 33.33% 16.04% 20.30%
High 14.08% 11.36% 12.22% 16.67% 14.15% 15.74%
Very High 9.18% 6.82% 4.44% 7.55% 13.71%
Affordable health insurance N=497 N=88 N=95 N=6 N=105 N=200
Very Low 44.06% 37.50% 51.58% 50.00% 41.90% 44.00%
Low 8.65% 6.82% 12.63% 6.67% 9.00%
Moderate 9.86% 7.95% 7.37% 13.33% 10.50%
High 13.28% 19.32% 10.53% 20.00% 8.50%
Very High 24.14% 28.41% 17.89% 50.00% 18.10% 28.00%
Assistance with retirement savings
N=488 N=89 N=93 N=6 N=105 N=192
Very Low 40.98% 32.58% 46.24% 33.33% 37.14% 44.27%
Low 9.84% 14.61% 10.75% 16.67% 12.38% 5.73%
Moderate 19.26% 20.22% 15.05% 21.90% 20.31%
High 14.14% 15.73% 12.90% 33.33% 14.29% 13.02%
Very High 15.78% 16.85% 15.05% 16.67% 14.29% 16.67%
Grants or loans N=502 N=89 N=96 N=6 N=107 N=201
Very Low 27.29% 40.45% 33.33% 16.67% 30.84% 17.41%
Low 10.36% 15.73% 11.46% 16.67% 8.41% 7.96%
Moderate 18.92% 19.10% 20.83% 16.67% 16.82% 18.91%
High 14.74% 8.99% 16.67% 15.89% 15.92%
Very High 28.69% 15.73% 17.71% 50.00% 28.04% 39.80%
Opportunities to network with other artists
N=495 N=88 N=95 N=6 N=106 N=197
Very Low 13.94% 10.23% 26.32% 33.33% 15.09% 8.63%
Low 12.73% 17.05% 13.68% 33.33% 9.43% 11.68%
Moderate 31.31% 36.36% 24.21% 16.67% 30.19% 32.49%
High 22.63% 19.32% 25.26% 22.64% 23.86%
Very High 19.39% 17.05% 10.53% 16.67% 22.64% 23.35%

26
A local arts council N=487 N=87 N=93 N=6 N=104 N=193
Need Total Design Media Museums Performing Visual
Very Low 20.33% 21.84% 27.96% 16.67% 19.05% 16.58%
Low 17.25% 26.44% 21.51% 16.67% 14.29% 12.95%
Moderate 26.69% 25.29% 23.66% 33.33% 25.71% 29.02%
High 18.69% 14.94% 16.13% 22.86% 19.69%
Very High 17.04% 11.49% 10.75% 33.33% 18.10% 21.76%
Publicity, coverage in the media N=500 N=88 N=95 N=6 N=106 N=202
Very Low 14.40% 20.45% 22.11% 16.67% 16.04% 7.43%
Low 11.60% 20.45% 10.53% 16.67% 11.32% 8.42%
Moderate 21.00% 21.59% 26.32% 20.75% 19.31%
High 23.80% 19.32% 17.89% 16.67% 23.58% 28.71%
Very High 29.20% 18.18% 23.16% 50.00% 28.30% 36.14%
Continued artistic training N=493 N=89 N=92 N=6 N=105 N=198
Very Low 26.17% 20.22% 38.04% 66.67% 29.52% 20.20%
Low 17.04% 23.60% 17.39% 16.67% 19.05% 13.13%
Moderate 24.75% 25.84% 19.57% 21.90% 29.29%
High 19.07% 23.60% 18.48% 13.33% 20.20%
Very High 12.98% 6.74% 6.52% 16.67% 16.19% 17.17%
Professional development N=490 N=89 N=90 N=6 N=107 N=195
Very Low 15.31% 10.11% 22.22% 33.33% 21.50% 11.28%
Low 13.47% 15.73% 10.00% 18.69% 10.77%
Moderate 29.18% 30.34% 27.78% 16.67% 29.91% 29.74%
High 23.47% 24.72% 24.44% 17.76% 25.64%
Very High 18.57% 19.10% 15.56% 50.00% 12.15% 22.56%
Information on employment opportunities for artists and creative freelancers
N=490 N=89 N=94 N=6 N=103 N=195
Very Low 18.57% 10.11% 17.02% 16.67% 19.42% 22.05%
Low 11.43% 11.24% 10.64% 11.65% 11.79%
Moderate 19.39% 21.35% 25.53% 20.39% 15.90%
High 20.61% 24.72% 20.21% 33.33% 18.45% 20.00%
Very High 30.00% 32.58% 26.60% 50.00% 30.10% 30.26%

27

28
26. Even if you personally are not in need of the following resources, how would you rate the availability of these resources throughout the Capital Region?
Information on available work or rehearsal space
N=489 N=86 N=93 N=6 N=106 N=195
Availability Total Design Media Museums Performing Visual
I have no idea 26.99% 27.91% 23.66% 16.67% 24.53% 29.74%
Not available 14.31% 12.79% 10.75% 16.67% 15.09% 16.41%
Somewhat available 54.19% 54.65% 59.14% 50.00% 56.60% 50.26%
Very available 4.50% 4.65% 6.45% 16.67% 3.77% 3.59%
Affordable work space N=493 N=86 N=93 N=6 N=106 N=199
I have no idea 25.76% 25.58% 21.51% 30.19% 25.63%
Not available 15.82% 13.95% 10.75% 16.67% 13.21% 20.60%
Somewhat available 51.93% 54.65% 59.14% 83.33% 49.06% 48.24%
Very available 6.49% 5.81% 8.60% 7.55% 5.53%
Affordable living space N=491 N=86 N=93 N=6 N=104 N=199
I have no idea 23.01% 22.09% 19.35% 33.33% 25.96% 23.62%
Not available 13.44% 11.63% 7.53% 16.67% 13.46% 17.09%
Somewhat available 47.45% 51.16% 52.69% 33.33% 42.31% 45.73%
Very available 16.09% 15.12% 20.43% 16.67% 18.27% 13.57%
Places to sell, exhibit, or perform N=493 N=86 N=91 N=6 N=106 N=201
I have no idea 14.81% 22.09% 15.38% 15.09% 11.44%
Not available 6.29% 4.65% 3.30% 3.77% 9.45%
Somewhat available 55.17% 48.84% 49.45% 66.67% 54.72% 60.70%
Very available 23.73% 24.42% 31.87% 33.33% 26.42% 18.41%
Shared business services N=492 N=86 N=93 N=6 N=106 N=198
I have no idea 37.40% 37.21% 33.33% 50.00% 41.51% 36.87%
Not available 19.92% 13.95% 18.28% 19.81% 23.74%
Somewhat available 37.40% 40.70% 41.94% 50.00% 30.19% 37.37%
Very available 5.28% 8.14% 6.45% 8.49% 2.02%

29
Shared studio space N=489 N=85 N=93 N=6 N=105 N=197
Availability Total Design Media Museums Performing Visual
I have no idea 33.13% 35.29% 34.41% 33.33% 40.00% 27.41%
Not available 16.56% 15.29% 11.83% 16.67% 14.29% 20.30%
Somewhat available 43.56% 42.35% 50.54% 33.33% 38.10% 44.67%
Very available 6.75% 7.06% 3.23% 16.67% 7.62% 7.61%
Business/financial management assistance
N=490 N=86 N=93 N=6 N=105 N=197
I have no idea 33.06% 27.91% 32.26% 66.67% 34.29% 33.50%
Not available 18.78% 9.30% 11.83% 20.00% 25.89%
Somewhat available 35.71% 34.88% 40.86% 16.67% 33.33% 36.04%
Very available 12.45% 27.91% 15.05% 16.67% 12.38% 4.57%
Marketing assistance N=492 N=86 N=92 N=6 N=106 N=199
I have no idea 31.50% 29.07% 27.17% 33.33% 33.96% 32.66%
Not available 20.12% 10.47% 13.04% 16.67% 22.64% 26.13%
Somewhat available 35.98% 31.40% 45.65% 50.00% 32.08% 35.68%
Very available 12.40% 29.07% 14.13% 11.32% 5.53%
Computer/web/technology assistance
N=487 N=86 N=91 N=6 N=106 N=195
I have no idea 28.95% 27.91% 25.27% 50.00% 33.96% 27.69%
Not available 14.78% 9.30% 7.69% 14.15% 21.03%
Somewhat available 37.58% 33.72% 48.35% 50.00% 30.19% 37.95%
Very available 18.69% 29.07% 18.68% 21.70% 13.33%
Assistance protecting my intellectual property
N=488 N=86 N=93 N=6 N=103 N=197
I have no idea 40.16% 36.05% 39.78% 50.00% 40.78% 41.12%
Not available 25.41% 18.60% 21.51% 50.00% 28.16% 28.43%
Somewhat available 28.89% 36.05% 30.11% 27.18% 26.90%
Very available 5.53% 9.30% 8.60% 3.88% 3.55%

30
Assistance pricing my art N=488 N=86 N=92 N=6 N=105 N=196
Availability Total Design Media Museums Performing Visual
I have no idea 38.52% 40.70% 41.30% 50.00% 37.14% 36.22%
Not available 28.48% 23.26% 23.91% 33.33% 31.43% 31.63%
Somewhat available 29.10% 31.40% 32.61% 16.67% 23.81% 29.59%
Very available 3.89% 4.65% 2.17% 7.62% 2.55%
Affordable health insurance N=490 N=86 N=92 N=6 N=106 N=197
I have no idea 25.51% 25.58% 22.83% 16.67% 22.64% 28.43%
Not available 22.86% 16.28% 11.96% 33.33% 27.36% 28.43%
Somewhat available 36.12% 41.86% 41.30% 33.33% 32.08% 33.50%
Very available 15.51% 16.28% 23.91% 16.67% 17.92% 9.64%
Assistance with retirement savings
N=482 N=85 N=92 N=6 N=102 N=194
I have no idea 34.02% 29.41% 35.87% 66.67% 29.41% 36.60%
Not available 20.95% 10.59% 7.61% 16.67% 24.51% 29.90%
Somewhat available 30.08% 41.18% 35.87% 16.67% 24.51% 26.29%
Very available 14.94% 18.82% 20.65% 21.57% 7.22%
Grants or loans N=492 N=86 N=92 N=6 N=105 N=200
I have no idea 27.64% 30.23% 28.26% 27.62% 27.00%
Not available 17.48% 13.95% 16.30% 16.67% 16.19% 20.50%
Somewhat available 45.53% 47.67% 39.13% 66.67% 49.52% 44.50%
Very available 9.35% 8.14% 16.30% 16.67% 6.67% 8.00%
Opportunities to network with other artists
N=486 N=86 N=93 N=6 N=105 N=194
I have no idea 16.87% 19.77% 15.05% 15.24% 17.53%
Not available 7.61% 9.30% 5.38% 16.67% 11.43% 5.67%
Somewhat available 39.51% 36.05% 36.56% 41.90% 42.27%
Very available 36.01% 34.88% 43.01% 83.33% 31.43% 34.54%

31
A local arts council N=488 N=86 N=92 N=6 N=104 N=197
Availability Total Design Media Museums Performing Visual
I have no idea 19.67% 25.58% 20.65% 19.23% 17.26%
Not available 9.22% 9.30% 5.43% 12.50% 9.14%
Somewhat available 31.97% 30.23% 32.61% 16.67% 43.27% 26.90%
Very available 39.14% 34.88% 41.30% 83.33% 25.00% 46.70%
Publicity, coverage in the media N=487 N=85 N=90 N=6 N=105 N=198
I have no idea 17.66% 22.35% 13.33% 16.67% 17.14% 17.68%
Not available 14.99% 12.94% 13.33% 16.67% 16.19% 16.16%
Somewhat available 52.98% 52.94% 53.33% 16.67% 50.48% 55.05%
Very available 14.37% 11.76% 20.00% 50.00% 16.19% 11.11%
Continued artistic training N=488 N=86 N=91 N=6 N=105 N=197
I have no idea 17.83% 23.26% 23.08% 16.67% 10.48% 16.75%
Not available 14.14% 13.95% 13.19% 16.67% 20.95% 11.17%
Somewhat available 43.85% 37.21% 48.35% 16.67% 48.57% 43.15%
Very available 24.18% 25.58% 15.38% 50.00% 20.00% 28.93%
Professional development N=488 N=83 N=92 N=6 N=105 N=199
I have no idea 23.98% 21.69% 22.83% 16.67% 19.05% 28.14%
Not available 17.42% 14.46% 11.96% 22.86% 19.10%
Somewhat available 44.26% 40.96% 44.57% 66.67% 49.52% 41.71%
Very available 14.34% 22.89% 20.65% 16.67% 8.57% 11.06%
Information on employment opportunities for artists and creative freelancers
N=486 N=85 N=90 N=6 N=105 N=197
I have no idea 24.49% 23.53% 25.56% 16.67% 19.05% 26.90%
Not available 23.87% 22.35% 24.44% 33.33% 24.76% 23.35%
Somewhat available 44.44% 43.53% 45.56% 33.33% 46.67% 44.16%
Very available 7.20% 10.59% 4.44% 16.67% 9.52% 5.58%

32
28. What do you think are the greatest strengths of the arts and the creative economy in the NY Capital Region?
The size of the words or phrases in the following graphic correspond to the frequency such words or phrases appeared in responses. The most frequently used words are the largest.
Created using: http://www.wordle.net/create

33
29. What do you think are the greatest challenges that artists and other creative individuals face in the NY Capital Region?
The size of the words in the following graphic correspond to the frequency such words or phrases appeared in responses. The most frequently used words are the largest.
Created using: http://www.wordle.net/create

34
30. What is your gender?
N=483 N=85 N=91 N=5 N=104 N=195
Gender Total Design Media Museums Performing Visual
Female 61.28% 70.59% 59.34% 80.00% 44.23% 66.67%
Male 38.72% 29.41% 40.66% 20.00% 55.77% 33.33%
31. What is your age?
N=488 N=84 N=92 N=5 N=105 N=199
Age Total Design Media Museums Performing Visual
Under 24 3.69% 4.76% 4.35% 7.62% 1.01%
25 - 34 19.06% 28.57% 10.87% 20.00% 24.76% 16.08%
35 - 49 30.74% 40.48% 34.78% 30.48% 25.13%
50 - 65 37.30% 23.81% 41.30% 80.00% 28.57% 44.72%
Over 65 9.22% 2.38% 8.70% 8.57% 13.07%
32. What is your racial/ethnic background? (check all that apply)
N=485 N=85 N=90 N=5 N=105 N=197
Racial/Ethnic background Total Design Media Museums Performing Visual
Asian or Pacific Islander 1.24% 2.35% 2.03%
Black/African-American 1.24% 2.22% 2.86% 0.51%
Hispanic/Latino 0.62% 1.18% 2.22% Native American 0.41% 1.02%
White/Caucasian 91.13% 90.59% 90.00% 100.00% 90.48% 92.39%
2 or more races/ethnicities indicated 2.89% 3.53% 3.33% 1.90% 2.54%
Prefer not to answer 2.47% 2.35% 2.22% 4.76% 1.52%
33. What is your highest level of education?
N=484 N=83 N=89 N=5 N=104 N=200
Education level Total Design Media Museums Performing Visual
Less than high school 0.21% 0.96%
High school 1.86% 2.41% 1.92% 2.50%
Some college or post-secondary training 12.19% 12.05% 6.74% 10.58% 16.00%
Trade school 2.69% 1.20% 1.12% 3.85% 3.50%
Associate degree 7.64% 9.64% 1.12% 4.81% 11.50%
Four-year degree 39.46% 50.60% 38.20% 40.00% 36.54% 37.50%
Postgraduate degree 35.95% 24.10% 52.81% 60.00% 41.35% 29.00%

35
36. Have you ever opened your work space to the public?
N=439 N=83 N=84 N=5 N=79 N=186
Total Design Media Museums Performing Visual
No 66.74% 81.93% 83.33% 60.00% 64.56% 53.76%
Yes 33.26% 18.07% 16.67% 40.00% 35.44% 46.24%
37. Regardless of whether you have opened your work space to the public in the past, do you have an interest in opening it to the public for special events in the future?
N=436 N=83 N=83 N=5 N=77 N=186
Total Design Media Museums Performing Visual
No 52.98% 69.88% 74.70% 60.00% 59.74% 33.33%
Yes 47.02% 30.12% 25.30% 40.00% 40.26% 66.67%