creative corridor regional assessment 4.7files.ctctcdn.com/4a8abb3f001/9fc83676-3549-4457-b... ·...
TRANSCRIPT
REGIONAL ASSESSMENT
CREATIVE CORRIDOR REGIONAL VISION STRATEGY Submitted by Market Street Services, Inc. www.marketstreetservices.com April 7, 2016
TABLE OF CONTENTS
Introduction ............................................................................................................................................................................................... 1
Project Overview ...................................................................................................................................................................................... 2
Regional Assessment ............................................................................................................................................................................. 3
The Creative Corridor Story ................................................................................................................................................................. 7
Strong but Uneven Population Growth and Change ....................................................................................................... 7
A Quality but Constrained Workforce with Strong Resident Wellbeing ............................................................... 15
A Resilient, Diverse Local Economy and Competitive Business Climate ............................................................... 28
Strong Entrepreneurial Legacy with a Still-Evolving Startup Ecosystem ............................................................... 38
A Nice Place to Live but Not Without Challenges .......................................................................................................... 46
Necessary but Elusive Regionalism ...................................................................................................................................... 56
Conclusion ............................................................................................................................................................................................... 60
Photos used on cover and only for purposes associated with this proposal are sourced from the Cedar Rapids Metro Economic Alliance website (left, right); and © Luzav10 | Dreamstime.com - Iowa City Photo (middle).
Regional Assessment
Page 1 – April 2016
INTRODUCTION Regional cooperation has become the hallmark of successful communities across the nation. Working together provides an opportunity to celebrate local strengths while combining and optimizing limited resources. In the Creative Corridor, there are multiple communities, including the Cedar Rapids and Iowa City metro areas that could and should be leveraged for greater economic growth and prosperity. There has been significant progress in recent years, but there is still more to do.
In December of 2008, 30 leaders from this region assembled, still coming to grips with the impact of recent devastating floods, and agreed that the collective region should focus on three strategic imperatives: 1) achieve full flood recovery; 2) develop and implement a regional brand; and 3) develop and implement a regional economic development strategy. With flood-recovery projects largely completed and the Creative Corridor brand successfully launched, the first two imperatives have been completed, but not the third. To this end, the region is now ready to embark upon the creation of a comprehensive, consensus-based Regional Vision Strategy for the Creative Corridor. This process will also serve as the East Central Iowa Council of Governments (ECICOG)'s Comprehensive Economic Development Strategy (CEDS) process. It is understood that the agency will submit the CEDS to the U.S. Economic Development Agency in the fall of 2016. Further, a concurrent regional transportation planning process will be managed by ECICOG, with the goal of integrating the two efforts as much as possible during the processes. ECICOG will combine the primary strategy deliverables from each process into a single document, the Comprehensive Regional Development Strategy (CRDS).
A diverse Steering Committee representing all aspects of Iowa’s Creative Corridor will guide this process and ensure that it lays a foundation allowing individuals and businesses in the region to thrive. The strategy process will build on regional strengths, preserve local identity, and add value to the existing efforts of individual organizations throughout the region. The partners supporting this project include the Cedar Rapids Metro Economic Alliance (CRMEA), Corridor Alliance, East Central Council of Governments, Greater Cedar Rapids Community Foundation, Iowa City Area Chamber of Commerce, Iowa City Area Development Group (ICAD), Kirkwood Community College, Marion Chamber of Commerce, Marion Economic Development Group (MEDCO), MedQuarter Regional Medical District, University of Iowa, and United Way of East Central Iowa.
Market Street Services, a national community and economic development strategy-creation firm based in Atlanta, is facilitating the strategic planning process.
Regional Assessment
Page 2 – April 2016
PROJECT OVERVIEW Moving from brand to strategy will require that the concepts that informed the Creative Corridor label be expanded to a complete focus on all aspects of the seven-county region’s competitive position, key challenges and opportunities, and vision for its successful future. Thus, the Creative Corridor strategic process begins with the gathering and assessment of comprehensive qualitative and quantitative information to set up a baseline of findings that will drive the remaining phases of the process. Stakeholder input was purposely designed to be representative of all key public and private Creative Corridor constituency groups. The phases of the Regional Vision process are as follows:
PHASE ONE: STAKEHOLDER INPUT The first phase involved reaching out to as many regional stakeholders as possible through an online survey, individual interviews, and focus groups to help identify the region’s strengths, weaknesses, opportunities, and challenges.
PHASE TWO: REGIONAL ASSESSMENT This Regional Assessment provides an objective examination of the region’s advantages and challenges. Supplementing quantitative findings with qualitative data from Phase I, the Assessment will tell the “story of the Creative Corridor,” highlighting key findings from the research and identifying initial strategic implications. The seven-county region will be benchmarked against Iowa and the United States, as well as Des Moines, IA; Fort Collins, CO; and Madison, WI to provide greater context for the analysis.
PHASE THREE: CREATIVE CORRIDOR ECONOMIC ANALYSIS This phase will take a deeper dive into the region’s economic and workforce-related dynamics to provide greater context for understanding regional opportunities and challenges. The Analysis will seek to identify the target business sectors which have the greatest potential to drive job creation, elevate standards of living in the community, and provide the greatest opportunities to catalyze growth and development.
PHASE FOUR: CREATIVE CORRIDOR REGIONAL VISION STRATEGY The Vision Strategy will build off of the findings of the first phases and also incorporate existing efforts. Examples of best practice programs, policies, and initiatives from communities around the country will be included when relevant and appropriate to help form strategic recommendations and their subsequent implementation. The final product will be an aggressive and ambitious blueprint for advancing the Creative Corridor’s economy, workforce, and long-term prosperity.
PHASE FIVE: IMPLEMENTATION PLAN The final phase will provide a roadmap for regional leaders to activate and operationalize the Strategy. The Plan will identify lead implementers, key partners, budget considerations, and timelines for implementation of each recommendation. Additionally, performance metrics will be provided to enable stakeholders to track the progress of implementation and goal attainment.

Regional Assessment
Page 3 – April 2016
REGIONAL ASSESSMENT The Creative Corridor Regional Assessment explores the strengths and challenges of the region, evaluating them through what Market Street believes to be the three critical aspects of a community: people, jobs and prosperity, and quality of life and place. Findings related to these key attributes are incorporated into six key stories that frame the discussion of the most important issues impacting the Creative Corridor’s competitiveness as a place to live, work, visit, and do business. These stories represent themes that emerged from extensive public input provided by the Creative Corridor residents, businesses, and community leaders, as well as a comprehensive analysis of data covering regional demographic, socioeconomic, and economic trends.
The six stories are:
Strong but Uneven Population Growth and Change
A Quality but Constrained Workforce with Strong Resident Wellbeing
A Resilient, Diverse Local Economy and Competitive Business Climate
Strong Entrepreneurial Legacy with a Still-Evolving Startup Ecosystem
A Nice Place to Live but Not Without Challenges
Necessary but Elusive Regionalism
FOCUS GROUPS AND INTERVIEWS: A thorough assessment of a community’s strengths, weaknesses, opportunities, and challenges must be informed by input from the people that live and work in the area. A series of focus groups and interviews with individuals from the region’s public, private, and non-profit sectors was conducted in February 2016.
Public input – including focus groups, interviews, and an online survey – is differentiated throughout the report and presented in bold, blue text.
ONLINE SURVEY: In addition to in-person input solicited via six focus groups and 12 interviews, an online community survey was open to the public for roughly three weeks in February 2016. A total of 2,091 residents, workers, and business leaders responded to the survey, providing perspectives that will help supplement face-to-face meetings and quantitative analysis. In total, over 2,200 people contributed to this process to date through public input. The survey was open to all regional stakeholders but is not considered a scientific sample. Perspectives that may have not been captured in the survey were instead informed by carefully planned interviews and focus groups with leaders from across the Corridor.
DATA SOURCES: A variety of public and private data sources are used throughout this Assessment. A great deal of information is drawn from the Census Bureau and other public sources including the Bureau of Labor Statistics (BLS), the Bureau of Economic Analysis (BEA), the National Center for Education Statistics (NCES), the Iowa Department of Education (IDoE), the Federal Bureau of Investigation (FBI), and the Internal Revenue Service (IRS). Proprietary data covering economic composition (employment, wages, exports, etc.) are provided by Economic Modeling Specialists, Inc. (EMSI).

Regional Assessment
Page 4 – April 2016
COMPARISON GEOGRAPHIES: Throughout this assessment, the seven county Creative Corridor region is utilized as the primary geographic unit of analysis, and is typically referred to as “the Creative Corridor,” “the Corridor,” or “the region.” Intra-regional dynamics are occasionally discussed at the county or sub-county level. Certain indicators were not available for Cedar and Iowa Counties.
RESEARCH DYNAMICS: When the five-county region (Cedar Rapids and Iowa City metropolitan statistical areas or MSAs) is the profiled geography, it will be italicized as the “Creative Corridor,” while references in graphics will have an asterisk to denote this composition. In addition to state and national averages, the region’s performance is benchmarked against three metros with which it shares certain characteristics and/or competes for jobs, workers, and investment: the Des Moines-West Des Moines, IA MSA; the Fort Collins, CO MSA; and the Madison, WI MSA. These metros are often identified by their principle city (e.g. “Des Moines”) throughout the report.
As will be seen in the report, the Creative Corridor is comprised by two, fairly distinctive “nodes” north and south corresponding to the Cedar Rapids and Iowa City metropolitan areas. This is in addition to the two rural Corridor counties that are not included in these MSAs. Within these sub-geographies are even more distinctive component districts, including some that have much different racial and economic profiles than the region-at-large. The issue of “one region, multiple segments” and how to differentiate their challenges and opportunities is an important yet difficult one from a research and strategy standpoint. Market Street feels that the Regional Assessment must be focused on broader Corridor-wide issues as opposed to finer-grained analysis of its component MSAs, municipalities, or districts. A segmented approach would ultimately be counter-productive to the goal of developing and implementing a strategic vision and action plan for the full breadth of the Creative Corridor. That said, certain data were disaggregated for component MSAs, counties, and cities when most beneficial to illuminating regional trends.
Regional Assessment
Page 5 – April 2016
TABLE OF FIGURES Figure 1: Population Change By County, Creative Corridor, 2004-2014 ........................................................................... 7
Figure 2: Population Change, Benchmark Regions, 2004-2014 ........................................................................................... 8
Figure 3: Components of Population Change, 2009-2014 ..................................................................................................... 9
Figure 4: Creative Corridor Domestic Net Migration 2001-2013 ...................................................................................... 10
Figure 5: Population Change by Race and Ethnicity, 2004-2014 ...................................................................................... 11
Figure 6: Population Change By Age Group, 2009-2014 ..................................................................................................... 12
Figure 7: Survey Results “Please Indicate If You Disagree Or Agree With The Following Statement About Young Professionals (Working Ages 25-34):” ........................................................................................................................... 13
Figure 8: Educational Attainment, 2014 ...................................................................................................................................... 16
Figure 9: Population Change by Educational Attainment, 2009-2014 ............................................................................ 16
Figure 10: Share Of The Population With A Bachelor’s Degree Or Higher By Age Group, 2014 ......................... 17
Figure 11: K-12 Snapshot, 2013-2014 .......................................................................................................................................... 18
Figure 12: Public School Performance, 2013-2014 ................................................................................................................. 19
Figure 13: Iowa Public High School Graduate Intentions, 2013-2014 ............................................................................ 20
Figure 14: Enrollment And Degree Completions At Public And Private, Non-Profit Higher Education Institutions, 2013-2014 ....................................................................................................................................................................... 21
Figure 15: Labor Force, 2004-2014 ................................................................................................................................................ 23
Figure 16: Per Capita Income, 2004-2014................................................................................................................................... 24
Figure 17: Household Income Distribution Change, 2009-2014 ....................................................................................... 25
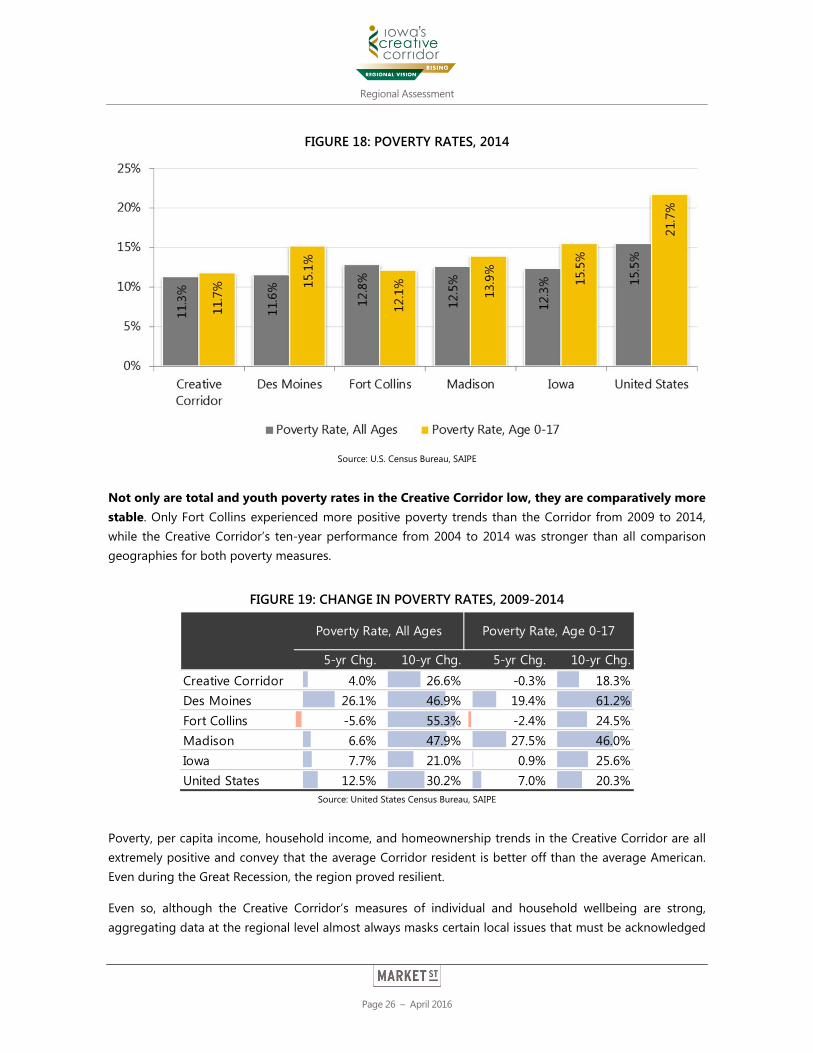
Figure 18: Poverty Rates, 2014 ........................................................................................................................................................ 26
Figure 19: Change In Poverty Rates, 2009-2014 ...................................................................................................................... 26
Figure 20: Total Jobs, 2005-2015 ................................................................................................................................................... 28
Figure 21: Average Annual Wage ................................................................................................................................................... 29
Figure 22: Overview Of Creative Corridor Economy ............................................................................................................... 30
Figure 23: Top 15 Employers In The Creative Corridor ......................................................................................................... 31
Figure 24: Survey Results – “Please Rate The Following Elements Of The Creative Corridor's Business Climate According To The Degree To Which Each Is An Advantage Or Disadvantage To Existing And Prospective New Businesses.” .......................................................................................................................................................... 32
Figure 25: Average Rental Rates, December 2015 .................................................................................................................. 34
Regional Assessment
Page 6 – April 2016
Figure 26: Survey Responses – “From The Standpoint Of Economic Development, What Do You Believe To Be The Creative Corridor's GREATEST STRENGTH OR ASSET As It Seeks To Grow Quality Jobs That Elevate Standards Of Living For Its Residents?” ....................................................................................................................................... 35
Figure 27: Survey Responses – “From The Standpoint Of Economic Development, What Do You Believe To Be The Creative Corridor's Biggest Challenge As It Seeks To Grow Quality Jobs That Elevate Standards Of Living For Its Residents?” ................................................................................................................................................................... 36
Figure 28: Employees By Firm Size, Q4 2009-Q4 2014 ......................................................................................................... 38
Figure 29: Employees By Firms Age, +/- 10 Years, Q4 2009-Q4 2014 ............................................................................ 39
Figure 30: Please Rate the Following Components of the Creative Corridor’s Entrepreneurial Climate: ......... 41
Figure 31: Venture Capital Investments, 2014 .......................................................................................................................... 42
Figure 32: University Research Activity (FY2013) ..................................................................................................................... 43
Figure 33: Patents Per 10,000 Residents, 2003-2013 ............................................................................................................. 44
Figure 34: Survey Responses – “What Do You Think Could Be Done To Make The Creative Corridor More Attractive For Young Professionals?” ............................................................................................................................................ 47
Figure 35: Survey Responses “Please Rate The Following Aspects Of The Creative Corridor's Quality Of Life, Based On Your Experiences Where You Live.” .......................................................................................................................... 49
Figure 36: Violent And Property Crime Rates, Incidents Per 10,000 Residents, 2013 ............................................... 50
Figure 37: Metro Home Affordability, 2014 ............................................................................................................................... 51
Figure 38: Single Family; Home Value Index; Recession And Recovery ......................................................................... 52
Figure 39: Transit Data, 2014 ........................................................................................................................................................... 53
Figure 40: Survey Responses - “Imagine That You Went Home, Packed Your Bags, And Didn't Return To The Region For Ten Years. What Would You Want To See Different (If Anything) About The Region When You Return?” .................................................................................................................................................................................................... 54
Regional Assessment
Page 7 – April 2016
THE CREATIVE CORRIDOR STORY The following narratives comprise the Creative Corridor’s “story” for the purposes of this Regional Assessment. Key takeaways are listed at the end of each story section.
Strong but Uneven Population Growth and Change Unlike many communities in Iowa, the Creative Corridor population is growing as its population diversifies. This is a positive and notable trend, although certain dynamics of this population growth and sub-regional variations in growth are potential concerns.
Population growth is often seen as a fundamental indicator of a region’s attractiveness as a place to live, work, and play, though the components of population change are also important. For example, growth may be flat overall, but the percentage of higher-skilled residents may be increasing. In the case of the Creative Corridor, both overall growth and the dynamics of that growth are positive. This indicates that there are factors like job availability, quality of life, cost of living, and other elements that are compelling factors for talent retention and attraction.
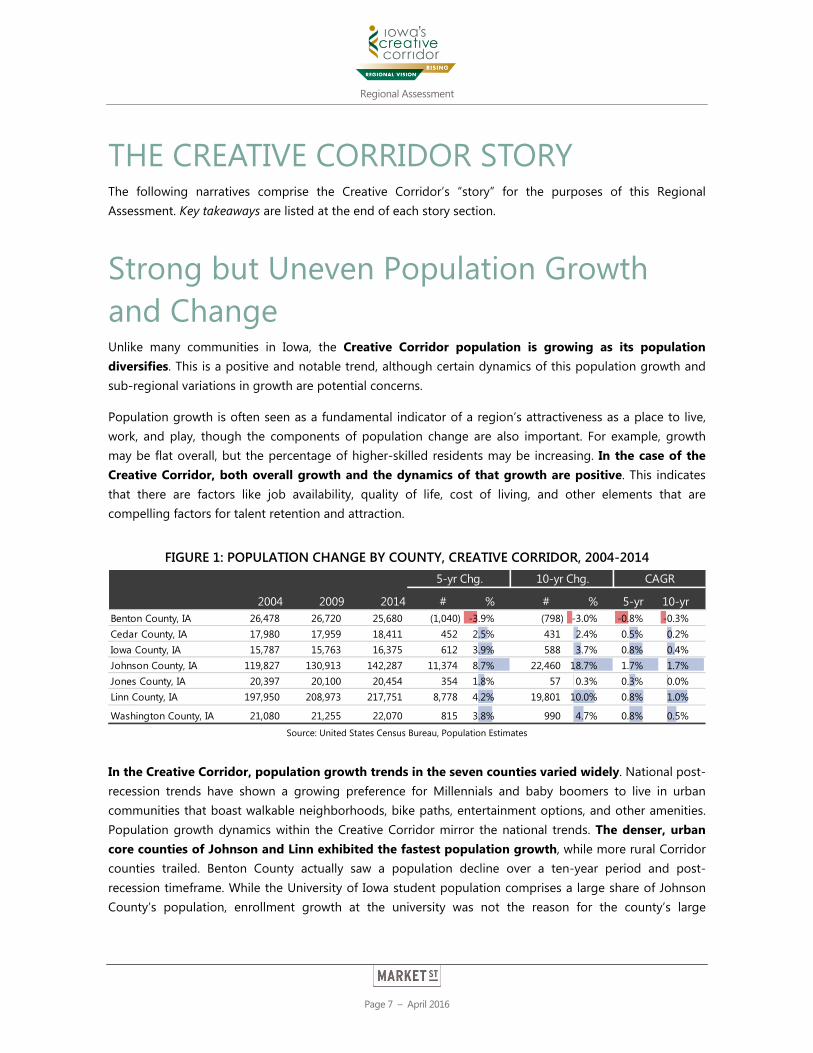
FIGURE 1: POPULATION CHANGE BY COUNTY, CREATIVE CORRIDOR, 2004-2014
Source: United States Census Bureau, Population Estimates
In the Creative Corridor, population growth trends in the seven counties varied widely. National post-recession trends have shown a growing preference for Millennials and baby boomers to live in urban communities that boast walkable neighborhoods, bike paths, entertainment options, and other amenities. Population growth dynamics within the Creative Corridor mirror the national trends. The denser, urban core counties of Johnson and Linn exhibited the fastest population growth, while more rural Corridor counties trailed. Benton County actually saw a population decline over a ten-year period and post-recession timeframe. While the University of Iowa student population comprises a large share of Johnson County’s population, enrollment growth at the university was not the reason for the county’s large
2004 2009 2014 # % # % 5-yr 10-yrBenton County, IA 26,478 26,720 25,680 (1,040) -3.9% (798) -3.0% -0.8% -0.3%Cedar County, IA 17,980 17,959 18,411 452 2.5% 431 2.4% 0.5% 0.2%Iowa County, IA 15,787 15,763 16,375 612 3.9% 588 3.7% 0.8% 0.4%Johnson County, IA 119,827 130,913 142,287 11,374 8.7% 22,460 18.7% 1.7% 1.7%Jones County, IA 20,397 20,100 20,454 354 1.8% 57 0.3% 0.3% 0.0%Linn County, IA 197,950 208,973 217,751 8,778 4.2% 19,801 10.0% 0.8% 1.0%
Washington County, IA 21,080 21,255 22,070 815 3.8% 990 4.7% 0.8% 0.5%
CAGR5-yr Chg. 10-yr Chg.
Regional Assessment
Page 8 – April 2016
population increase. In fact, student enrollment at the University of Iowa actually decreased slightly (-0.6 percent) between 2009 and 2014.
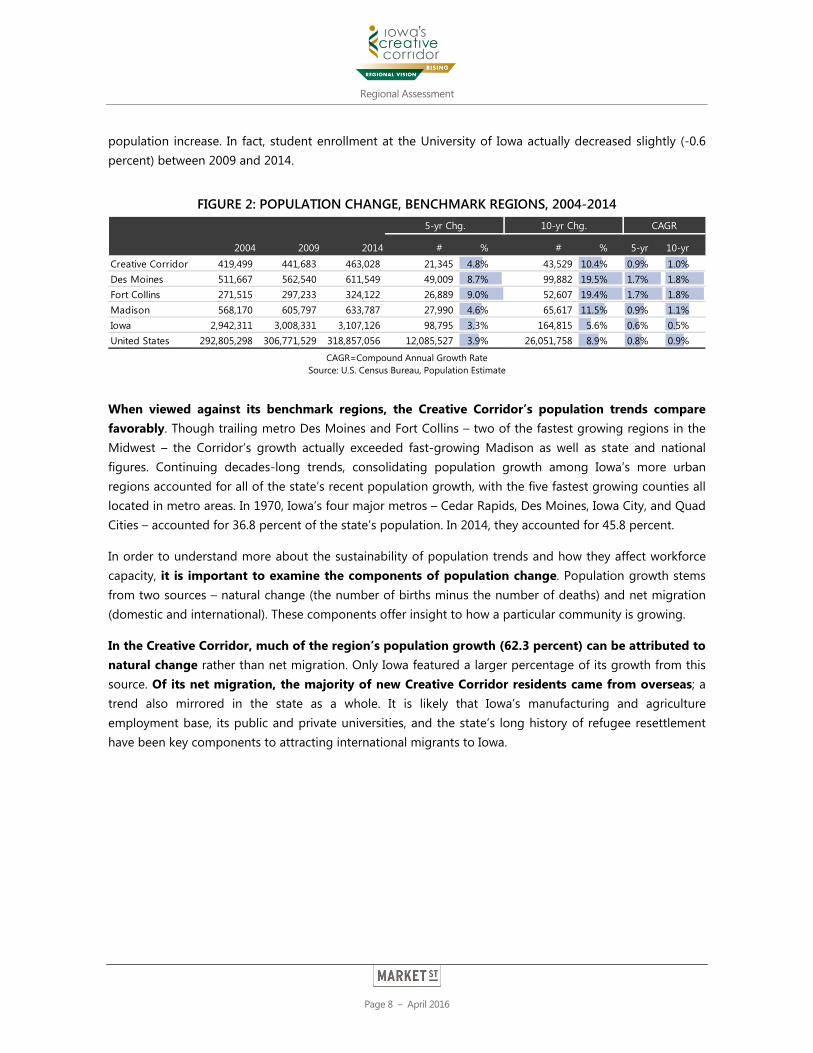
FIGURE 2: POPULATION CHANGE, BENCHMARK REGIONS, 2004-2014
CAGR=Compound Annual Growth Rate
Source: U.S. Census Bureau, Population Estimate
When viewed against its benchmark regions, the Creative Corridor’s population trends compare favorably. Though trailing metro Des Moines and Fort Collins – two of the fastest growing regions in the Midwest – the Corridor’s growth actually exceeded fast-growing Madison as well as state and national figures. Continuing decades-long trends, consolidating population growth among Iowa’s more urban regions accounted for all of the state’s recent population growth, with the five fastest growing counties all located in metro areas. In 1970, Iowa’s four major metros – Cedar Rapids, Des Moines, Iowa City, and Quad Cities – accounted for 36.8 percent of the state’s population. In 2014, they accounted for 45.8 percent.
In order to understand more about the sustainability of population trends and how they affect workforce capacity, it is important to examine the components of population change. Population growth stems from two sources – natural change (the number of births minus the number of deaths) and net migration (domestic and international). These components offer insight to how a particular community is growing.
In the Creative Corridor, much of the region’s population growth (62.3 percent) can be attributed to natural change rather than net migration. Only Iowa featured a larger percentage of its growth from this source. Of its net migration, the majority of new Creative Corridor residents came from overseas; a trend also mirrored in the state as a whole. It is likely that Iowa’s manufacturing and agriculture employment base, its public and private universities, and the state’s long history of refugee resettlement have been key components to attracting international migrants to Iowa.
2004 2009 2014 # % # % 5-yr 10-yrCreative Corridor 419,499 441,683 463,028 21,345 4.8% 43,529 10.4% 0.9% 1.0%Des Moines 511,667 562,540 611,549 49,009 8.7% 99,882 19.5% 1.7% 1.8%Fort Collins 271,515 297,233 324,122 26,889 9.0% 52,607 19.4% 1.7% 1.8%Madison 568,170 605,797 633,787 27,990 4.6% 65,617 11.5% 0.9% 1.1%Iowa 2,942,311 3,008,331 3,107,126 98,795 3.3% 164,815 5.6% 0.6% 0.5%United States 292,805,298 306,771,529 318,857,056 12,085,527 3.9% 26,051,758 8.9% 0.8% 0.9%
5-yr Chg. 10-yr Chg. CAGR
Regional Assessment
Page 9 – April 2016
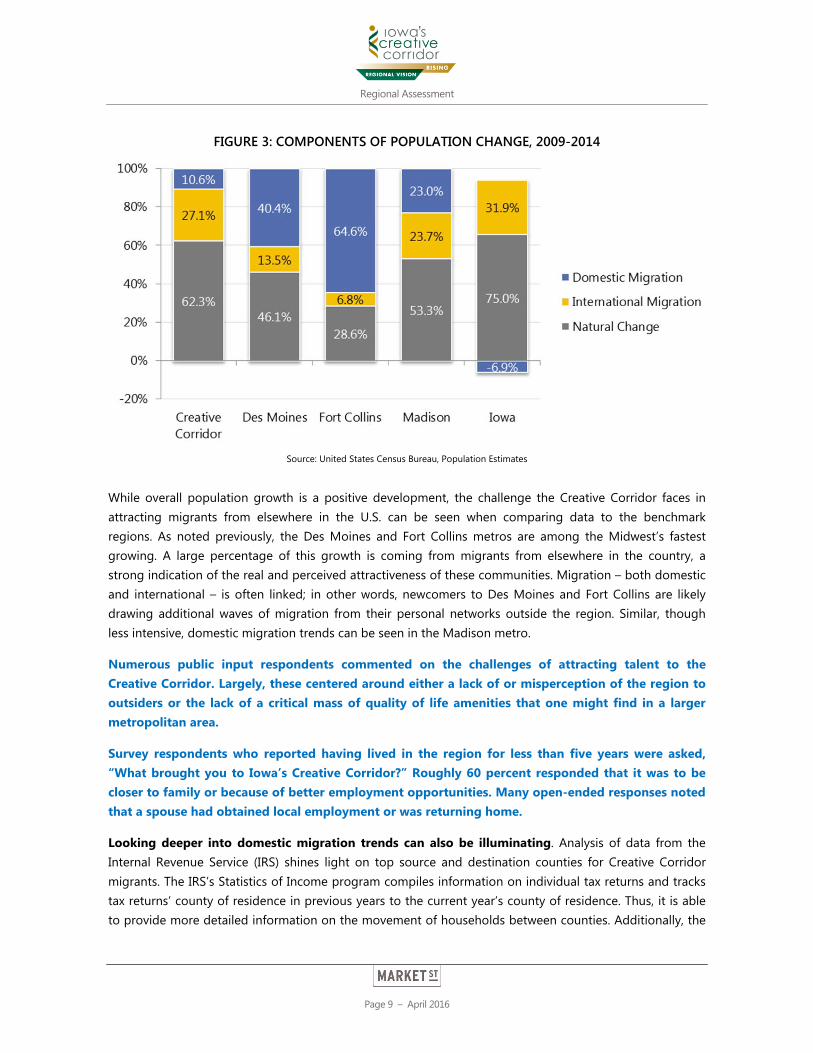
FIGURE 3: COMPONENTS OF POPULATION CHANGE, 2009-2014
Source: United States Census Bureau, Population Estimates
While overall population growth is a positive development, the challenge the Creative Corridor faces in attracting migrants from elsewhere in the U.S. can be seen when comparing data to the benchmark regions. As noted previously, the Des Moines and Fort Collins metros are among the Midwest’s fastest growing. A large percentage of this growth is coming from migrants from elsewhere in the country, a strong indication of the real and perceived attractiveness of these communities. Migration – both domestic and international – is often linked; in other words, newcomers to Des Moines and Fort Collins are likely drawing additional waves of migration from their personal networks outside the region. Similar, though less intensive, domestic migration trends can be seen in the Madison metro.
Numerous public input respondents commented on the challenges of attracting talent to the Creative Corridor. Largely, these centered around either a lack of or misperception of the region to outsiders or the lack of a critical mass of quality of life amenities that one might find in a larger metropolitan area.
Survey respondents who reported having lived in the region for less than five years were asked, “What brought you to Iowa’s Creative Corridor?” Roughly 60 percent responded that it was to be closer to family or because of better employment opportunities. Many open-ended responses noted that a spouse had obtained local employment or was returning home.
Looking deeper into domestic migration trends can also be illuminating. Analysis of data from the Internal Revenue Service (IRS) shines light on top source and destination counties for Creative Corridor migrants. The IRS’s Statistics of Income program compiles information on individual tax returns and tracks tax returns’ county of residence in previous years to the current year’s county of residence. Thus, it is able to provide more detailed information on the movement of households between counties. Additionally, the
Regional Assessment
Page 10 – April 2016
number of exemptions that move from county to county on each tax return can provide a rough estimate of the net flow of individuals from each county of origin to their destination county.
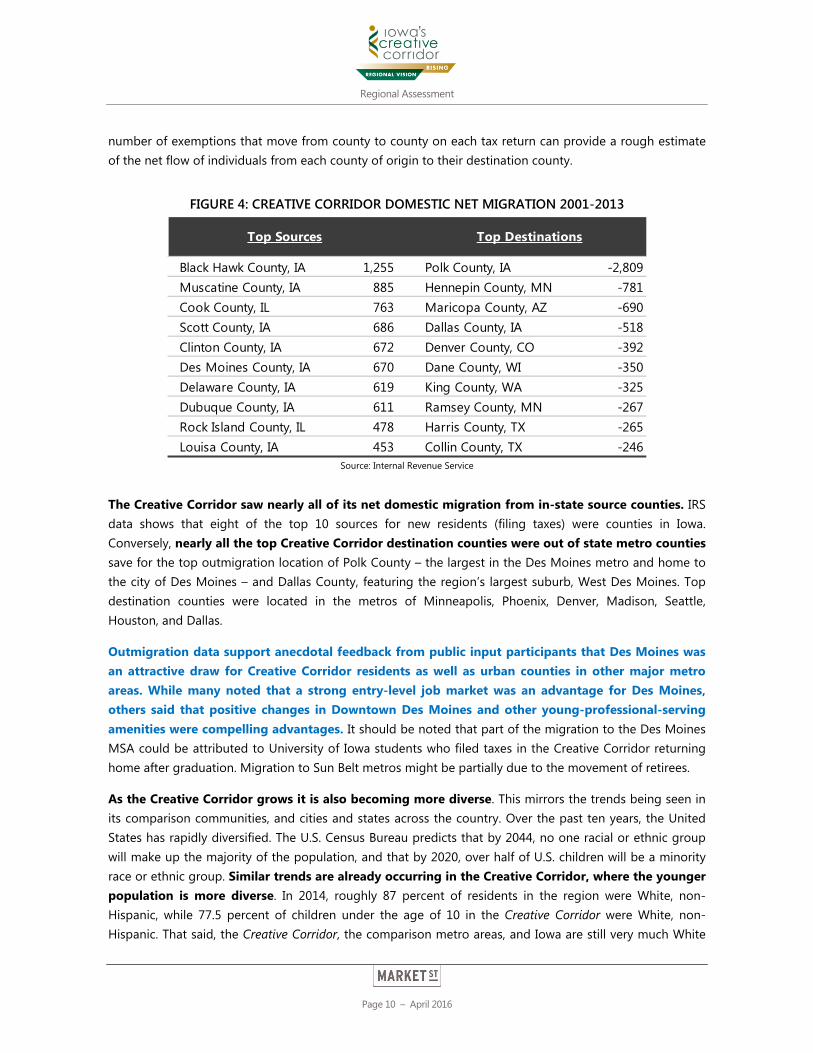
FIGURE 4: CREATIVE CORRIDOR DOMESTIC NET MIGRATION 2001-2013
Source: Internal Revenue Service
The Creative Corridor saw nearly all of its net domestic migration from in-state source counties. IRS data shows that eight of the top 10 sources for new residents (filing taxes) were counties in Iowa. Conversely, nearly all the top Creative Corridor destination counties were out of state metro counties save for the top outmigration location of Polk County – the largest in the Des Moines metro and home to the city of Des Moines – and Dallas County, featuring the region’s largest suburb, West Des Moines. Top destination counties were located in the metros of Minneapolis, Phoenix, Denver, Madison, Seattle, Houston, and Dallas.
Outmigration data support anecdotal feedback from public input participants that Des Moines was an attractive draw for Creative Corridor residents as well as urban counties in other major metro areas. While many noted that a strong entry-level job market was an advantage for Des Moines, others said that positive changes in Downtown Des Moines and other young-professional-serving amenities were compelling advantages. It should be noted that part of the migration to the Des Moines MSA could be attributed to University of Iowa students who filed taxes in the Creative Corridor returning home after graduation. Migration to Sun Belt metros might be partially due to the movement of retirees.
As the Creative Corridor grows it is also becoming more diverse. This mirrors the trends being seen in its comparison communities, and cities and states across the country. Over the past ten years, the United States has rapidly diversified. The U.S. Census Bureau predicts that by 2044, no one racial or ethnic group will make up the majority of the population, and that by 2020, over half of U.S. children will be a minority race or ethnic group. Similar trends are already occurring in the Creative Corridor, where the younger population is more diverse. In 2014, roughly 87 percent of residents in the region were White, non-Hispanic, while 77.5 percent of children under the age of 10 in the Creative Corridor were White, non-Hispanic. That said, the Creative Corridor, the comparison metro areas, and Iowa are still very much White
Black Hawk County, IA 1,255 Polk County, IA -2,809Muscatine County, IA 885 Hennepin County, MN -781Cook County, IL 763 Maricopa County, AZ -690Scott County, IA 686 Dallas County, IA -518Clinton County, IA 672 Denver County, CO -392Des Moines County, IA 670 Dane County, WI -350Delaware County, IA 619 King County, WA -325Dubuque County, IA 611 Ramsey County, MN -267Rock Island County, IL 478 Harris County, TX -265Louisa County, IA 453 Collin County, TX -246
Top Sources Top Destinations
Regional Assessment
Page 11 – April 2016
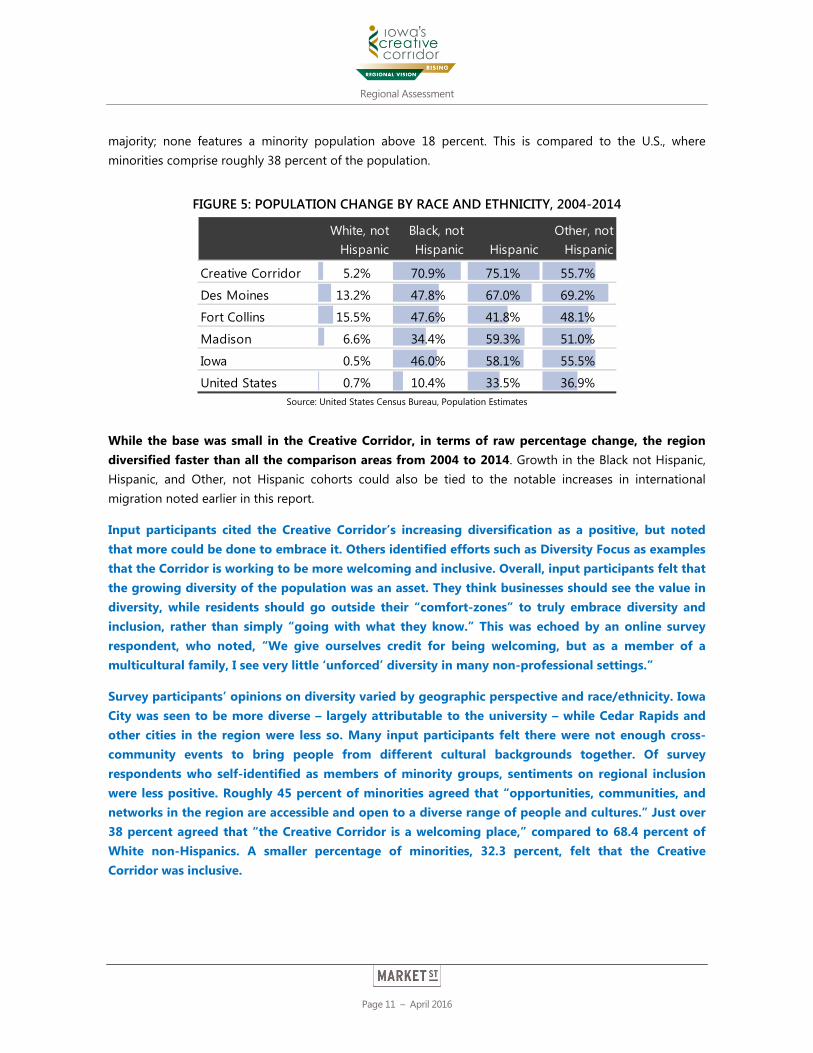
majority; none features a minority population above 18 percent. This is compared to the U.S., where minorities comprise roughly 38 percent of the population.
FIGURE 5: POPULATION CHANGE BY RACE AND ETHNICITY, 2004-2014
Source: United States Census Bureau, Population Estimates
While the base was small in the Creative Corridor, in terms of raw percentage change, the region diversified faster than all the comparison areas from 2004 to 2014. Growth in the Black not Hispanic, Hispanic, and Other, not Hispanic cohorts could also be tied to the notable increases in international migration noted earlier in this report.
Input participants cited the Creative Corridor’s increasing diversification as a positive, but noted that more could be done to embrace it. Others identified efforts such as Diversity Focus as examples that the Corridor is working to be more welcoming and inclusive. Overall, input participants felt that the growing diversity of the population was an asset. They think businesses should see the value in diversity, while residents should go outside their “comfort-zones” to truly embrace diversity and inclusion, rather than simply “going with what they know.” This was echoed by an online survey respondent, who noted, “We give ourselves credit for being welcoming, but as a member of a multicultural family, I see very little ‘unforced’ diversity in many non-professional settings.”
Survey participants’ opinions on diversity varied by geographic perspective and race/ethnicity. Iowa City was seen to be more diverse – largely attributable to the university – while Cedar Rapids and other cities in the region were less so. Many input participants felt there were not enough cross-community events to bring people from different cultural backgrounds together. Of survey respondents who self-identified as members of minority groups, sentiments on regional inclusion were less positive. Roughly 45 percent of minorities agreed that “opportunities, communities, and networks in the region are accessible and open to a diverse range of people and cultures.” Just over 38 percent agreed that “the Creative Corridor is a welcoming place,” compared to 68.4 percent of White non-Hispanics. A smaller percentage of minorities, 32.3 percent, felt that the Creative Corridor was inclusive.
White, not Hispanic
Black, not Hispanic Hispanic
Other, not Hispanic
Creative Corridor 5.2% 70.9% 75.1% 55.7%
Des Moines 13.2% 47.8% 67.0% 69.2%
Fort Collins 15.5% 47.6% 41.8% 48.1%
Madison 6.6% 34.4% 59.3% 51.0%
Iowa 0.5% 46.0% 58.1% 55.5%
United States 0.7% 10.4% 33.5% 36.9%
Regional Assessment
Page 12 – April 2016
Looking at a community’s age dynamics can provide additional perspective on its growth trends and workforce sustainability. As noted previously, even if a region’s population is not increasing, its demographics can still be improving if percentages of younger, educated residents increase.
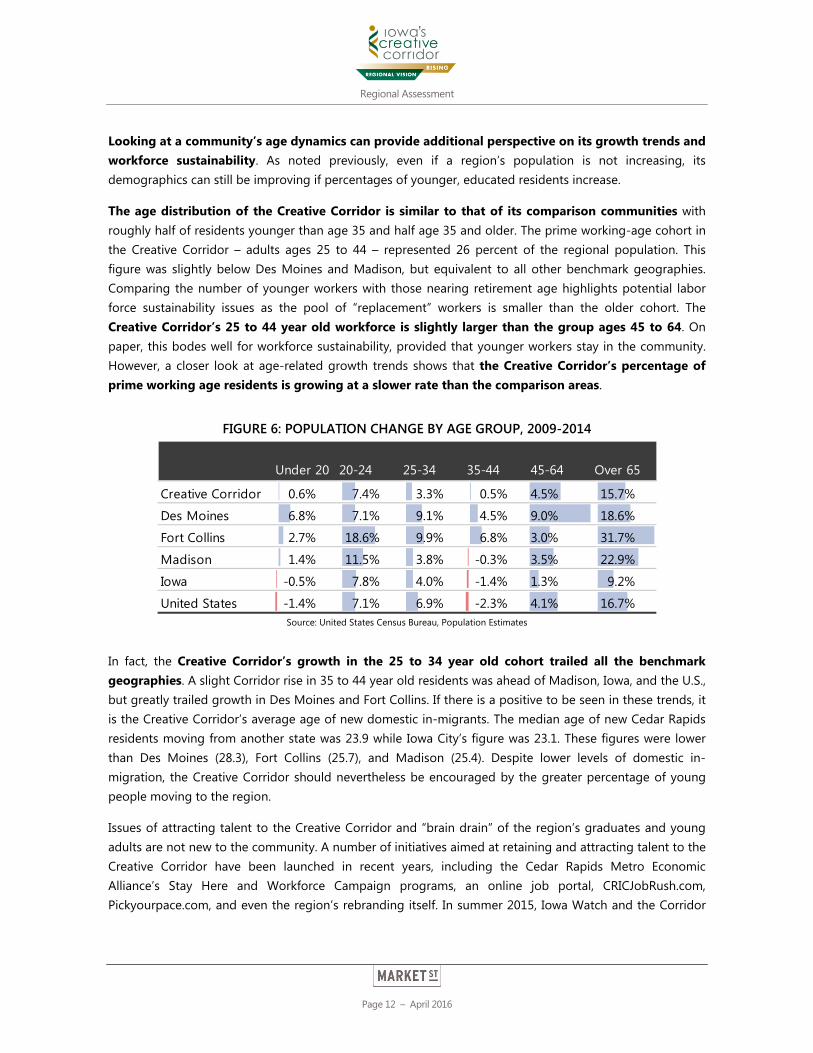
The age distribution of the Creative Corridor is similar to that of its comparison communities with roughly half of residents younger than age 35 and half age 35 and older. The prime working-age cohort in the Creative Corridor – adults ages 25 to 44 – represented 26 percent of the regional population. This figure was slightly below Des Moines and Madison, but equivalent to all other benchmark geographies. Comparing the number of younger workers with those nearing retirement age highlights potential labor force sustainability issues as the pool of “replacement” workers is smaller than the older cohort. The Creative Corridor’s 25 to 44 year old workforce is slightly larger than the group ages 45 to 64. On paper, this bodes well for workforce sustainability, provided that younger workers stay in the community. However, a closer look at age-related growth trends shows that the Creative Corridor’s percentage of prime working age residents is growing at a slower rate than the comparison areas.
FIGURE 6: POPULATION CHANGE BY AGE GROUP, 2009-2014
Source: United States Census Bureau, Population Estimates
In fact, the Creative Corridor’s growth in the 25 to 34 year old cohort trailed all the benchmark geographies. A slight Corridor rise in 35 to 44 year old residents was ahead of Madison, Iowa, and the U.S., but greatly trailed growth in Des Moines and Fort Collins. If there is a positive to be seen in these trends, it is the Creative Corridor’s average age of new domestic in-migrants. The median age of new Cedar Rapids residents moving from another state was 23.9 while Iowa City’s figure was 23.1. These figures were lower than Des Moines (28.3), Fort Collins (25.7), and Madison (25.4). Despite lower levels of domestic in-migration, the Creative Corridor should nevertheless be encouraged by the greater percentage of young people moving to the region.
Issues of attracting talent to the Creative Corridor and “brain drain” of the region’s graduates and young adults are not new to the community. A number of initiatives aimed at retaining and attracting talent to the Creative Corridor have been launched in recent years, including the Cedar Rapids Metro Economic Alliance’s Stay Here and Workforce Campaign programs, an online job portal, CRICJobRush.com, Pickyourpace.com, and even the region’s rebranding itself. In summer 2015, Iowa Watch and the Corridor
Under 20 20-24 25-34 35-44 45-64 Over 65
Creative Corridor 0.6% 7.4% 3.3% 0.5% 4.5% 15.7%
Des Moines 6.8% 7.1% 9.1% 4.5% 9.0% 18.6%
Fort Collins 2.7% 18.6% 9.9% 6.8% 3.0% 31.7%
Madison 1.4% 11.5% 3.8% -0.3% 3.5% 22.9%
Iowa -0.5% 7.8% 4.0% -1.4% 1.3% 9.2%
United States -1.4% 7.1% 6.9% -2.3% 4.1% 16.7%
Regional Assessment
Page 13 – April 2016
Business Journal hosted a forum dedicated to brain drain that examined this topic in detail and sought ideas on how to address these issues.
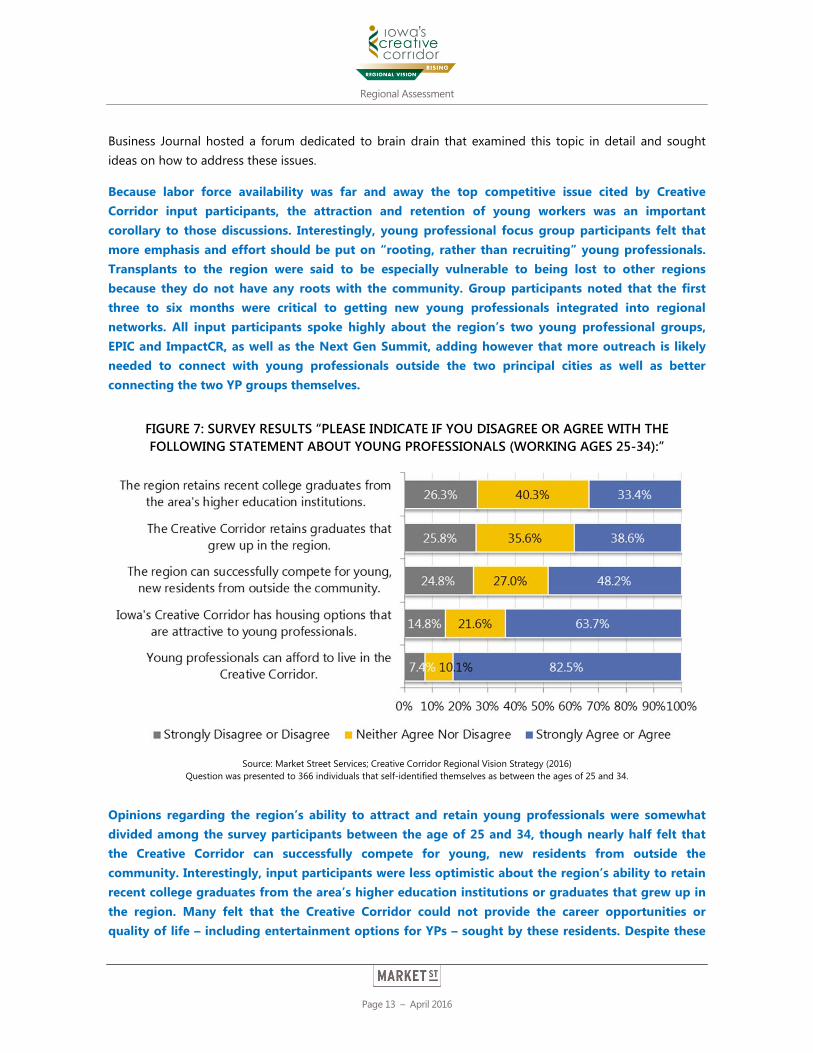
Because labor force availability was far and away the top competitive issue cited by Creative Corridor input participants, the attraction and retention of young workers was an important corollary to those discussions. Interestingly, young professional focus group participants felt that more emphasis and effort should be put on “rooting, rather than recruiting” young professionals. Transplants to the region were said to be especially vulnerable to being lost to other regions because they do not have any roots with the community. Group participants noted that the first three to six months were critical to getting new young professionals integrated into regional networks. All input participants spoke highly about the region’s two young professional groups, EPIC and ImpactCR, as well as the Next Gen Summit, adding however that more outreach is likely needed to connect with young professionals outside the two principal cities as well as better connecting the two YP groups themselves.
FIGURE 7: SURVEY RESULTS “PLEASE INDICATE IF YOU DISAGREE OR AGREE WITH THE FOLLOWING STATEMENT ABOUT YOUNG PROFESSIONALS (WORKING AGES 25-34):”
Source: Market Street Services; Creative Corridor Regional Vision Strategy (2016)
Question was presented to 366 individuals that self-identified themselves as between the ages of 25 and 34.
Opinions regarding the region’s ability to attract and retain young professionals were somewhat divided among the survey participants between the age of 25 and 34, though nearly half felt that the Creative Corridor can successfully compete for young, new residents from outside the community. Interestingly, input participants were less optimistic about the region’s ability to retain recent college graduates from the area’s higher education institutions or graduates that grew up in the region. Many felt that the Creative Corridor could not provide the career opportunities or quality of life – including entertainment options for YPs – sought by these residents. Despite these
Regional Assessment
Page 14 – April 2016
perceived challenges, input participants nevertheless acknowledged that many expatriate residents were returning to the Corridor later in life.
The next section of the Regional Assessment looks more specifically at population dynamics related to perceived and actual workforce quality and sustainability.
KEY TAKEAWAYS When viewed against its benchmark regions, the Creative Corridor’s population trends compare
favorably, though population growth in the seven counties varied widely.
The majority of Creative Corridor population growth stemmed from a natural change, while international migration accounted for a larger portion of net migration.
o Domestic migration patterns reveal that the main source of new, domestic migrants to the Creative Corridor were from other counties in Iowa, while the top destinations for out-migrants were Des Moines and large, out-of-state metro counties.
Similar to national trends, the Creative Corridor is becoming more diverse, yet still remains predominantly White, non-Hispanic.
While, the Creative Corridor’s 25 to 44 year old workforce is slightly larger than the group ages 45 to 64, growth trends indicate that the region’s percentage of prime working age residents is growing at a slower rate than the comparison areas.
The region’s in-migrant profile shows that the Corridor has been able to attract young, educated workers, but not in numbers sufficient to allay concerns over workforce sustainability.
Regional Assessment
Page 15 – April 2016
A Quality but Constrained Workforce with Strong Resident Wellbeing The people in a community are its greatest asset, which is why workforce capacity is a top concern for regions across the country. Because every business requires qualified, reliable employees, workforce availability and quality are key site location components and the most important competitive criteria in today’s knowledge-based economy. Regions must ensure they are effectively satisfying employer needs in all sectors by effectively formalizing integrated college and career preparation “pipelines” as well as attracting top talent to the community. Opportunities should be provided for all residents regardless of race, class, ethnicity, age, gender, or personal background.
The most established indicator of a region’s workforce skills capacity is its rate of educational attainment. Some of the top “talent hubs” in the nation now feature upwards of 40 to 50 percent of the working-age population with at least a bachelor’s degree. However, the number of adults with two-year degrees and career-specific certificates is also critical to accommodating the labor demands of employers in production fields and other sectors.
Data show that higher levels of education lead to higher wages, lower unemployment rates, and, ultimately, higher levels of personal well-being and prosperity. In 2014, the average U.S. unemployment rate for adults with a high school diploma was 6 percent with weekly earnings averaging $668. For workers with a bachelor’s degree, unemployment dropped to roughly 3.5 percent while earnings rose to $1,101 per week. On average, a full-time worker in 2014 with a bachelor’s degree would have earned approximately $22,500 more than one with only a high school diploma.
Attainment rates show that the Creative Corridor has a well-educated workforce, with nearly half of adults possessing an associate’s degree or higher. Compared to the benchmark communities, the Creative Corridor has a greater share of residents with an associate’s degree or higher than Des Moines, Iowa, and the United States. The region’s percentage of bachelor’s-plus degree holders notably trails Fort Collins and Madison, but it should be noted that these communities represent some of the best educated workforces in the nation. This is partially a reflection of the regions’ dominant sectors; Madison has a large concentration of jobs in information and management of companies sectors while Fort Collins is especially strong in professional, scientific, and technical services employment. Overall, the Creative Corridor’s bachelor’s-and-above attainment rate of over 37 percent compares very favorably with most U.S. regions.

Regional Assessment
Page 16 – April 2016
FIGURE 8: EDUCATIONAL ATTAINMENT, 2014
Source: United States Census Bureau, American Community Survey 1 yr. estimates
The Creative Corridor has seen increases in the educational attainment of its residents over the past five years equivalent to most of its comparison geographies. Between 2009 and 2014, the region experienced a 14.3 percent increase in the number of residents with a bachelor’s degree or higher. This was above only the U.S. figure, but roughly equivalent with trends in Des Moines and Iowa. Fort Collins and, especially, Madison saw significant increases in bachelor’s-plus attainment. The Creative Corridor also lagged all comparison areas in rise in resident attainment of bachelor’s degrees. This would seem to indicate that more can be done to retain graduates of regional colleges and universities, most prominently the University of Iowa.
FIGURE 9: POPULATION CHANGE BY EDUCATIONAL ATTAINMENT, 2009-2014
Source: United States Census Bureau, American Community Survey 1 yr. estimates
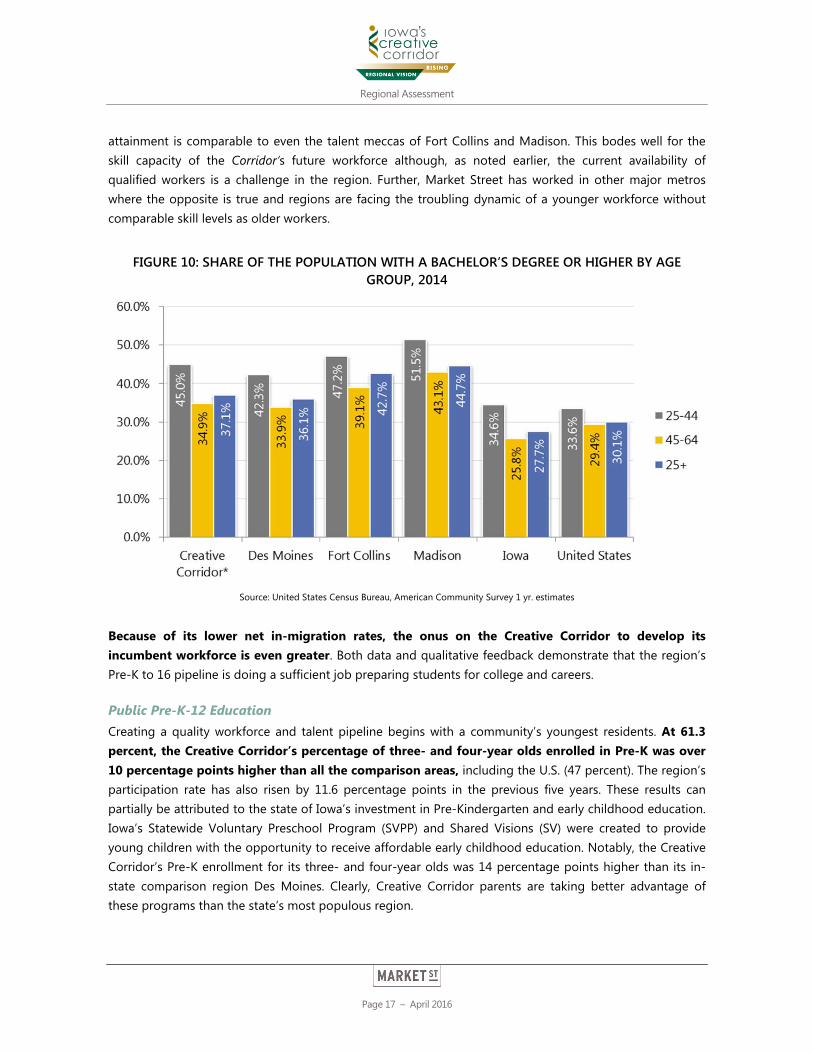
A very positive trend is the percentage of Creative Corridor residents ages 25 to 44 with a bachelor’s degree or above. As can be seen in figure 10, the Creative Corridor’s young professional workforce degree
Less than a HS Diploma
HS Diploma
Some college, no degree
Assoc.'s degree
Bachelor's degree
Graduate or prof'l degree BA+
Creative Corridor* -10.6% 4.8% 2.3% 7.9% 8.6% 26.5% 14.3%Des Moines -4.3% 7.6% -1.5% 18.7% 10.3% 30.1% 15.7%Fort Collins -25.8% 13.2% 12.7% 22.6% 24.6% 6.3% 17.5%Madison 6.2% 0.5% 14.7% 16.1% 24.6% 27.9% 25.9%Iowa -13.7% 0.2% 0.3% 15.8% 9.5% 27.2% 14.7%United States -6.3% 2.9% 4.1% 15.1% 12.2% 17.3% 14.0%
Regional Assessment
Page 17 – April 2016
attainment is comparable to even the talent meccas of Fort Collins and Madison. This bodes well for the skill capacity of the Corridor’s future workforce although, as noted earlier, the current availability of qualified workers is a challenge in the region. Further, Market Street has worked in other major metros where the opposite is true and regions are facing the troubling dynamic of a younger workforce without comparable skill levels as older workers.
FIGURE 10: SHARE OF THE POPULATION WITH A BACHELOR’S DEGREE OR HIGHER BY AGE GROUP, 2014
Source: United States Census Bureau, American Community Survey 1 yr. estimates
Because of its lower net in-migration rates, the onus on the Creative Corridor to develop its incumbent workforce is even greater. Both data and qualitative feedback demonstrate that the region’s Pre-K to 16 pipeline is doing a sufficient job preparing students for college and careers.
Public Pre-K-12 Education Creating a quality workforce and talent pipeline begins with a community’s youngest residents. At 61.3 percent, the Creative Corridor’s percentage of three- and four-year olds enrolled in Pre-K was over 10 percentage points higher than all the comparison areas, including the U.S. (47 percent). The region’s participation rate has also risen by 11.6 percentage points in the previous five years. These results can partially be attributed to the state of Iowa’s investment in Pre-Kindergarten and early childhood education. Iowa’s Statewide Voluntary Preschool Program (SVPP) and Shared Visions (SV) were created to provide young children with the opportunity to receive affordable early childhood education. Notably, the Creative Corridor’s Pre-K enrollment for its three- and four-year olds was 14 percentage points higher than its in-state comparison region Des Moines. Clearly, Creative Corridor parents are taking better advantage of these programs than the state’s most populous region.
Regional Assessment
Page 18 – April 2016
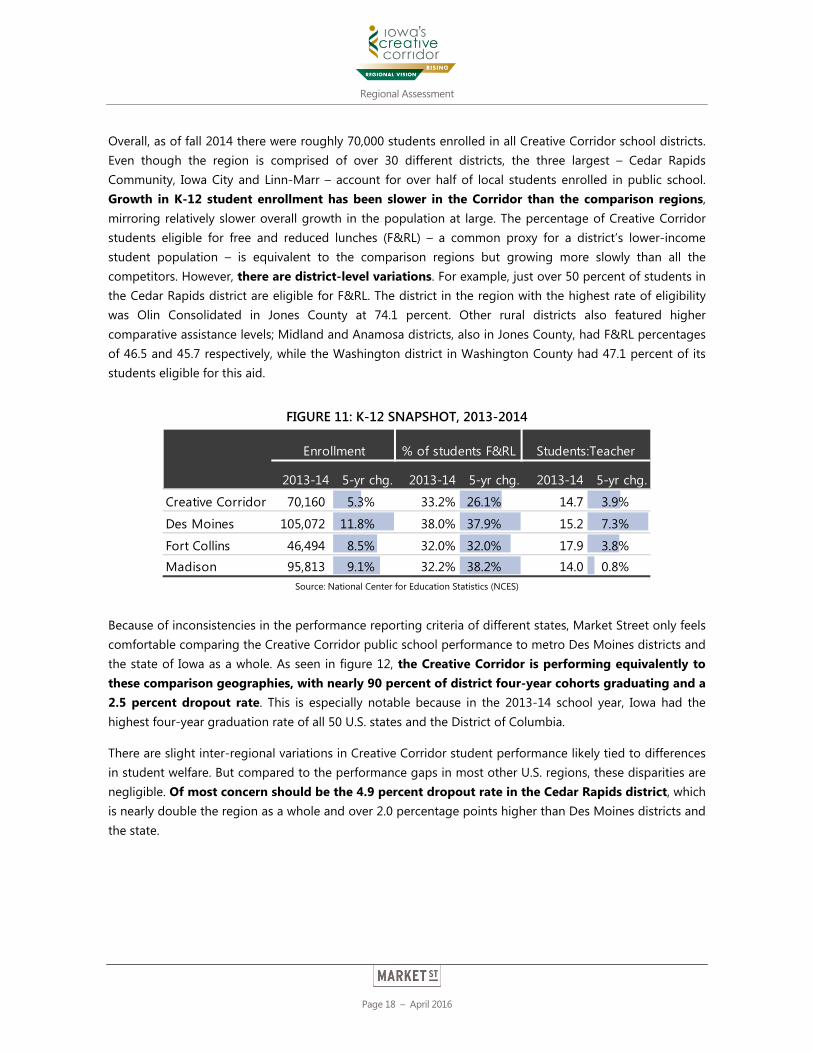
Overall, as of fall 2014 there were roughly 70,000 students enrolled in all Creative Corridor school districts. Even though the region is comprised of over 30 different districts, the three largest – Cedar Rapids Community, Iowa City and Linn-Marr – account for over half of local students enrolled in public school. Growth in K-12 student enrollment has been slower in the Corridor than the comparison regions, mirroring relatively slower overall growth in the population at large. The percentage of Creative Corridor students eligible for free and reduced lunches (F&RL) – a common proxy for a district’s lower-income student population – is equivalent to the comparison regions but growing more slowly than all the competitors. However, there are district-level variations. For example, just over 50 percent of students in the Cedar Rapids district are eligible for F&RL. The district in the region with the highest rate of eligibility was Olin Consolidated in Jones County at 74.1 percent. Other rural districts also featured higher comparative assistance levels; Midland and Anamosa districts, also in Jones County, had F&RL percentages of 46.5 and 45.7 respectively, while the Washington district in Washington County had 47.1 percent of its students eligible for this aid.
FIGURE 11: K-12 SNAPSHOT, 2013-2014
Source: National Center for Education Statistics (NCES)
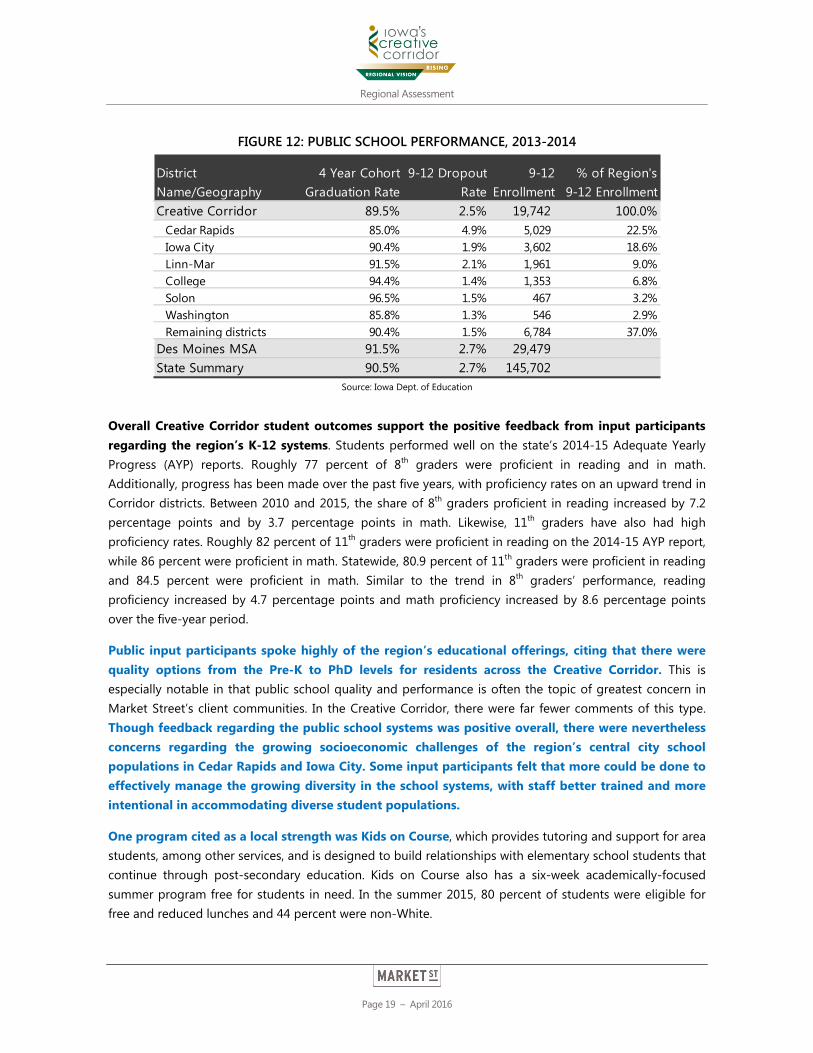
Because of inconsistencies in the performance reporting criteria of different states, Market Street only feels comfortable comparing the Creative Corridor public school performance to metro Des Moines districts and the state of Iowa as a whole. As seen in figure 12, the Creative Corridor is performing equivalently to these comparison geographies, with nearly 90 percent of district four-year cohorts graduating and a 2.5 percent dropout rate. This is especially notable because in the 2013-14 school year, Iowa had the highest four-year graduation rate of all 50 U.S. states and the District of Columbia.
There are slight inter-regional variations in Creative Corridor student performance likely tied to differences in student welfare. But compared to the performance gaps in most other U.S. regions, these disparities are negligible. Of most concern should be the 4.9 percent dropout rate in the Cedar Rapids district, which is nearly double the region as a whole and over 2.0 percentage points higher than Des Moines districts and the state.
2013-14 5-yr chg. 2013-14 5-yr chg. 2013-14 5-yr chg.
Creative Corridor 70,160 5.3% 33.2% 26.1% 14.7 3.9%
Des Moines 105,072 11.8% 38.0% 37.9% 15.2 7.3%
Fort Collins 46,494 8.5% 32.0% 32.0% 17.9 3.8%Madison 95,813 9.1% 32.2% 38.2% 14.0 0.8%
Students:Teacher% of students F&RLEnrollment
Regional Assessment
Page 19 – April 2016
FIGURE 12: PUBLIC SCHOOL PERFORMANCE, 2013-2014
Source: Iowa Dept. of Education
Overall Creative Corridor student outcomes support the positive feedback from input participants regarding the region’s K-12 systems. Students performed well on the state’s 2014-15 Adequate Yearly Progress (AYP) reports. Roughly 77 percent of 8th graders were proficient in reading and in math. Additionally, progress has been made over the past five years, with proficiency rates on an upward trend in Corridor districts. Between 2010 and 2015, the share of 8th graders proficient in reading increased by 7.2 percentage points and by 3.7 percentage points in math. Likewise, 11th graders have also had high proficiency rates. Roughly 82 percent of 11th graders were proficient in reading on the 2014-15 AYP report, while 86 percent were proficient in math. Statewide, 80.9 percent of 11th graders were proficient in reading and 84.5 percent were proficient in math. Similar to the trend in 8th graders’ performance, reading proficiency increased by 4.7 percentage points and math proficiency increased by 8.6 percentage points over the five-year period.
Public input participants spoke highly of the region’s educational offerings, citing that there were quality options from the Pre-K to PhD levels for residents across the Creative Corridor. This is especially notable in that public school quality and performance is often the topic of greatest concern in Market Street’s client communities. In the Creative Corridor, there were far fewer comments of this type. Though feedback regarding the public school systems was positive overall, there were nevertheless concerns regarding the growing socioeconomic challenges of the region’s central city school populations in Cedar Rapids and Iowa City. Some input participants felt that more could be done to effectively manage the growing diversity in the school systems, with staff better trained and more intentional in accommodating diverse student populations.
One program cited as a local strength was Kids on Course, which provides tutoring and support for area students, among other services, and is designed to build relationships with elementary school students that continue through post-secondary education. Kids on Course also has a six-week academically-focused summer program free for students in need. In the summer 2015, 80 percent of students were eligible for free and reduced lunches and 44 percent were non-White.
District Name/Geography
4 Year Cohort Graduation Rate
9-12 Dropout Rate
9-12 Enrollment
% of Region's 9-12 Enrollment
Creative Corridor 89.5% 2.5% 19,742 100.0%Cedar Rapids 85.0% 4.9% 5,029 22.5%Iowa City 90.4% 1.9% 3,602 18.6%Linn-Mar 91.5% 2.1% 1,961 9.0%College 94.4% 1.4% 1,353 6.8%Solon 96.5% 1.5% 467 3.2%Washington 85.8% 1.3% 546 2.9%Remaining districts 90.4% 1.5% 6,784 37.0%
Des Moines MSA 91.5% 2.7% 29,479 State Summary 90.5% 2.7% 145,702
Regional Assessment
Page 20 – April 2016
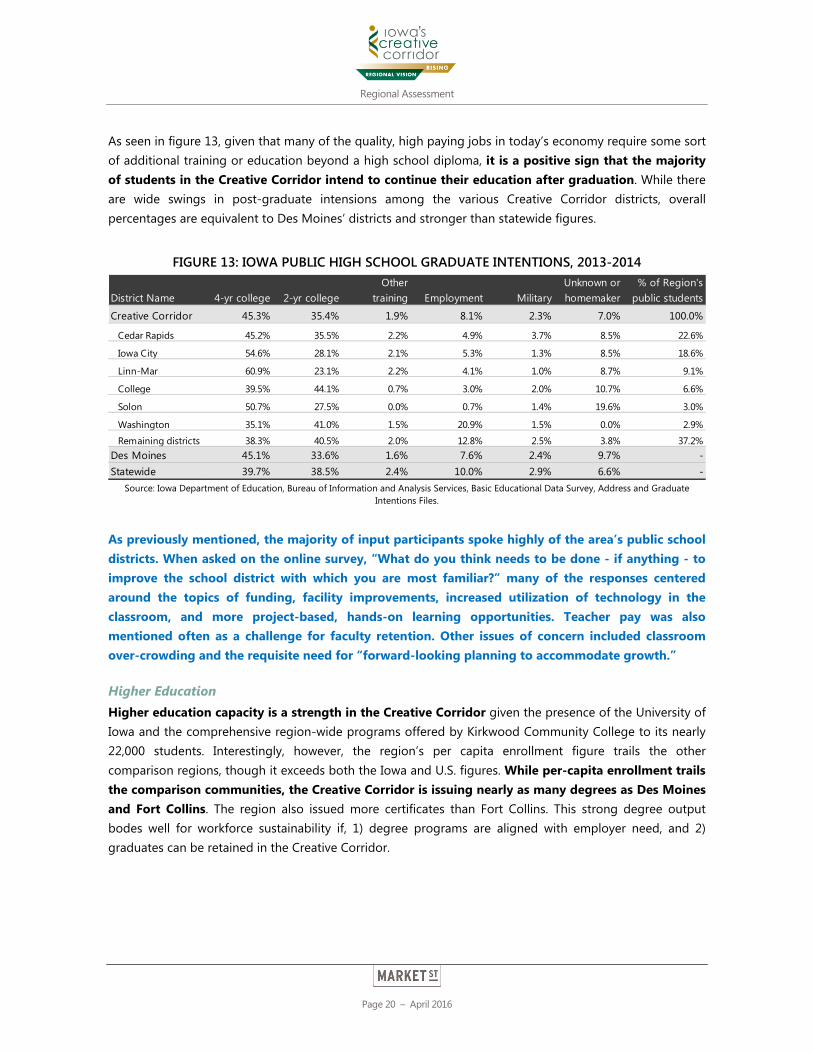
As seen in figure 13, given that many of the quality, high paying jobs in today’s economy require some sort of additional training or education beyond a high school diploma, it is a positive sign that the majority of students in the Creative Corridor intend to continue their education after graduation. While there are wide swings in post-graduate intensions among the various Creative Corridor districts, overall percentages are equivalent to Des Moines’ districts and stronger than statewide figures.
FIGURE 13: IOWA PUBLIC HIGH SCHOOL GRADUATE INTENTIONS, 2013-2014
Source: Iowa Department of Education, Bureau of Information and Analysis Services, Basic Educational Data Survey, Address and Graduate
Intentions Files.
As previously mentioned, the majority of input participants spoke highly of the area’s public school districts. When asked on the online survey, “What do you think needs to be done - if anything - to improve the school district with which you are most familiar?” many of the responses centered around the topics of funding, facility improvements, increased utilization of technology in the classroom, and more project-based, hands-on learning opportunities. Teacher pay was also mentioned often as a challenge for faculty retention. Other issues of concern included classroom over-crowding and the requisite need for “forward-looking planning to accommodate growth.”
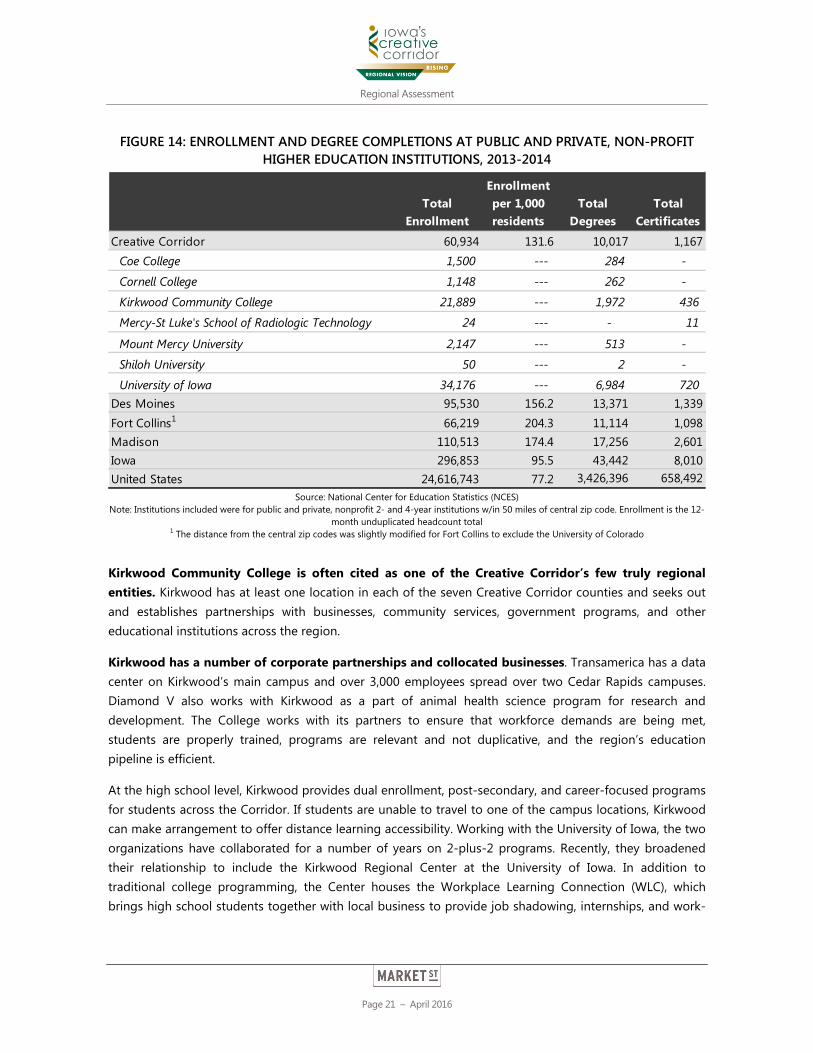
Higher Education Higher education capacity is a strength in the Creative Corridor given the presence of the University of Iowa and the comprehensive region-wide programs offered by Kirkwood Community College to its nearly 22,000 students. Interestingly, however, the region’s per capita enrollment figure trails the other comparison regions, though it exceeds both the Iowa and U.S. figures. While per-capita enrollment trails the comparison communities, the Creative Corridor is issuing nearly as many degrees as Des Moines and Fort Collins. The region also issued more certificates than Fort Collins. This strong degree output bodes well for workforce sustainability if, 1) degree programs are aligned with employer need, and 2) graduates can be retained in the Creative Corridor.
District Name 4-yr college 2-yr collegeOther
training Employment MilitaryUnknown or homemaker
% of Region's public students
Creative Corridor 45.3% 35.4% 1.9% 8.1% 2.3% 7.0% 100.0%
Cedar Rapids 45.2% 35.5% 2.2% 4.9% 3.7% 8.5% 22.6%
Iowa City 54.6% 28.1% 2.1% 5.3% 1.3% 8.5% 18.6%
Linn-Mar 60.9% 23.1% 2.2% 4.1% 1.0% 8.7% 9.1%
College 39.5% 44.1% 0.7% 3.0% 2.0% 10.7% 6.6%
Solon 50.7% 27.5% 0.0% 0.7% 1.4% 19.6% 3.0%
Washington 35.1% 41.0% 1.5% 20.9% 1.5% 0.0% 2.9%
Remaining districts 38.3% 40.5% 2.0% 12.8% 2.5% 3.8% 37.2%Des Moines 45.1% 33.6% 1.6% 7.6% 2.4% 9.7% -Statewide 39.7% 38.5% 2.4% 10.0% 2.9% 6.6% -
Regional Assessment
Page 21 – April 2016
FIGURE 14: ENROLLMENT AND DEGREE COMPLETIONS AT PUBLIC AND PRIVATE, NON-PROFIT HIGHER EDUCATION INSTITUTIONS, 2013-2014
Source: National Center for Education Statistics (NCES)
Note: Institutions included were for public and private, nonprofit 2- and 4-year institutions w/in 50 miles of central zip code. Enrollment is the 12-month unduplicated headcount total
1 The distance from the central zip codes was slightly modified for Fort Collins to exclude the University of Colorado
Kirkwood Community College is often cited as one of the Creative Corridor’s few truly regional entities. Kirkwood has at least one location in each of the seven Creative Corridor counties and seeks out and establishes partnerships with businesses, community services, government programs, and other educational institutions across the region.
Kirkwood has a number of corporate partnerships and collocated businesses. Transamerica has a data center on Kirkwood’s main campus and over 3,000 employees spread over two Cedar Rapids campuses. Diamond V also works with Kirkwood as a part of animal health science program for research and development. The College works with its partners to ensure that workforce demands are being met, students are properly trained, programs are relevant and not duplicative, and the region’s education pipeline is efficient.
At the high school level, Kirkwood provides dual enrollment, post-secondary, and career-focused programs for students across the Corridor. If students are unable to travel to one of the campus locations, Kirkwood can make arrangement to offer distance learning accessibility. Working with the University of Iowa, the two organizations have collaborated for a number of years on 2-plus-2 programs. Recently, they broadened their relationship to include the Kirkwood Regional Center at the University of Iowa. In addition to traditional college programming, the Center houses the Workplace Learning Connection (WLC), which brings high school students together with local business to provide job shadowing, internships, and work-
Total Enrollment
Enrollment per 1,000 residents
Total Degrees
Total Certificates
Creative Corridor 60,934 131.6 10,017 1,167Coe College 1,500 --- 284 -
Cornell College 1,148 --- 262 -
Kirkwood Community College 21,889 --- 1,972 436
Mercy-St Luke's School of Radiologic Technology 24 --- - 11
Mount Mercy University 2,147 --- 513 -
Shiloh University 50 --- 2 -
University of Iowa 34,176 --- 6,984 720 Des Moines 95,530 156.2 13,371 1,339Fort Collins1 66,219 204.3 11,114 1,098Madison 110,513 174.4 17,256 2,601Iowa 296,853 95.5 43,442 8,010United States 24,616,743 77.2 3,426,396 658,492
Regional Assessment
Page 22 – April 2016
based learning opportunities. Kirkwood also serves 4,500 students enrolled in adult literacy, English language acquisition, GED preparation, adult high school, and other related programs.
Many input participants, particularly those from the business community, praised Kirkwood for its industry partnerships, citing it as one of the key strengths in the region. One online survey respondent stated, “I think Kirkwood Community College is doing a good job working with the industries in the area to determine their issues and what types of skilled workers are needed.” Another remarked, “Kirkwood should be applauded and supported for its efforts to add needed training programs quickly and efficiently.” Potential new/enhanced training opportunities noted by survey respondents included computer science, IT, and software development programming in addition to a renewed focus on trades-based training.
Needless to say, the University of Iowa exerts a strong presence over the Creative Corridor. Its nearly 35,000 students comprise a significant part of the Iowa City population while administration, faculty, staff, and others associated with the university are the region’s dominant employment base at nearly 23,000 persons, roughly 35,000 if you add the University of Iowa hospital system. Combined, nearly 70,000 individuals out of a region of 463,000 have a direct relationship with the University of Iowa. As will be discussed more in the regionalism section of this report, this influence extends far and wide in Creative Corridor policies, perspectives, and politics.
The university not only serves to educate students, but also acts as a powerful Creative Corridor talent magnet for students and professionals alike. From a talent perspective, the University of Iowa not only draws students from across the Midwest but is increasingly attracting international students, especially from China, to the Creative Corridor. Some of these trends are reflected in the international migration data seen in the first section of this report. However, a recent annual report by the University of Iowa showed that roughly half of students with bachelor’s degrees stayed in the state after graduation. Data were not available to determine how many of those retained graduates matriculated to the university from the Creative Corridor or elsewhere in Iowa.
As could be expected, a high percentage of public input respondents identified the University of Iowa as a major Creative Corridor strength, if not its top asset. From its key role as a talent attractor to the potential to retain its graduates to work in the local economy to the amenities drawn to the Corridor to capitalize on the student population to the urban assets being developed in Downtown Iowa City, stakeholders feel the university is a transformative presence. Beyond simply attracting students, many local residents identified the University of Iowa as the most marketable asset to attract young professionals regardless of life stage, in part because it has made the Creative Corridor a more progressive, culturally and politically aware, inclusive and tolerant, and thoughtful region. Additionally, as one survey participant noted, “Even if people don't know exactly where we are off the top of their heads, we have the Big Ten brand that is nationally recognized and can be built on.”
Regional Assessment
Page 23 – April 2016
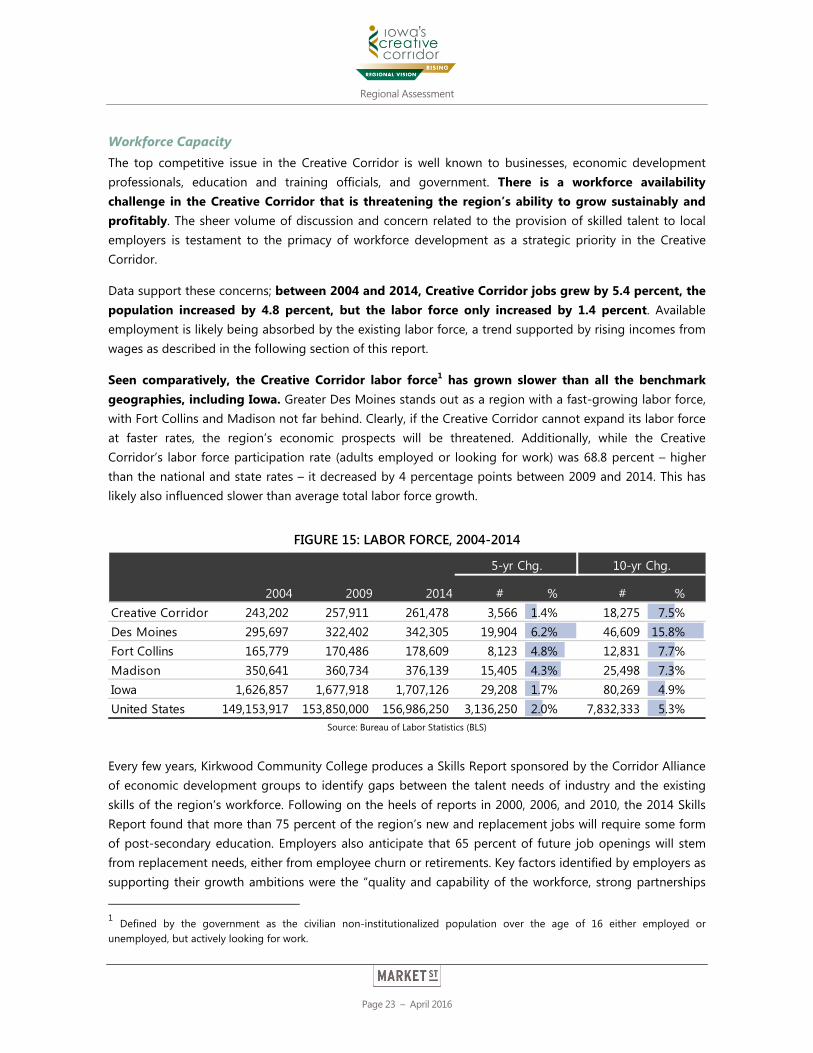
Workforce Capacity The top competitive issue in the Creative Corridor is well known to businesses, economic development professionals, education and training officials, and government. There is a workforce availability challenge in the Creative Corridor that is threatening the region’s ability to grow sustainably and profitably. The sheer volume of discussion and concern related to the provision of skilled talent to local employers is testament to the primacy of workforce development as a strategic priority in the Creative Corridor.
Data support these concerns; between 2004 and 2014, Creative Corridor jobs grew by 5.4 percent, the population increased by 4.8 percent, but the labor force only increased by 1.4 percent. Available employment is likely being absorbed by the existing labor force, a trend supported by rising incomes from wages as described in the following section of this report.
Seen comparatively, the Creative Corridor labor force1 has grown slower than all the benchmark geographies, including Iowa. Greater Des Moines stands out as a region with a fast-growing labor force, with Fort Collins and Madison not far behind. Clearly, if the Creative Corridor cannot expand its labor force at faster rates, the region’s economic prospects will be threatened. Additionally, while the Creative Corridor’s labor force participation rate (adults employed or looking for work) was 68.8 percent – higher than the national and state rates – it decreased by 4 percentage points between 2009 and 2014. This has likely also influenced slower than average total labor force growth.
FIGURE 15: LABOR FORCE, 2004-2014
Source: Bureau of Labor Statistics (BLS)
Every few years, Kirkwood Community College produces a Skills Report sponsored by the Corridor Alliance of economic development groups to identify gaps between the talent needs of industry and the existing skills of the region’s workforce. Following on the heels of reports in 2000, 2006, and 2010, the 2014 Skills Report found that more than 75 percent of the region’s new and replacement jobs will require some form of post-secondary education. Employers also anticipate that 65 percent of future job openings will stem from replacement needs, either from employee churn or retirements. Key factors identified by employers as supporting their growth ambitions were the “quality and capability of the workforce, strong partnerships
1 Defined by the government as the civilian non-institutionalized population over the age of 16 either employed or unemployed, but actively looking for work.
2004 2009 2014 # % # %Creative Corridor 243,202 257,911 261,478 3,566 1.4% 18,275 7.5%Des Moines 295,697 322,402 342,305 19,904 6.2% 46,609 15.8%Fort Collins 165,779 170,486 178,609 8,123 4.8% 12,831 7.7%Madison 350,641 360,734 376,139 15,405 4.3% 25,498 7.3%Iowa 1,626,857 1,677,918 1,707,126 29,208 1.7% 80,269 4.9%United States 149,153,917 153,850,000 156,986,250 3,136,250 2.0% 7,832,333 5.3%
5-yr Chg. 10-yr Chg.
Regional Assessment
Page 24 – April 2016
with regional educational institutions (University of Iowa, Kirkwood Community College, private colleges, K-12), a geographic location that supports commerce and community involvement, and an economy that is showing signs of recovery.”
Roughly three-quarters of employers responding to the Skills 2014 Report felt that the area had strong job applicants and a current workforce with the soft skills and occupational skills necessary to be effective employees. What these results imply is that the Creative Corridor’s current workforce meets employer needs, but there are simply not enough available adults to satisfy businesses’ demands. This assessment was echoed by an input participant who remarked that “the region has the appropriate offerings for degree programs, but keeping the folks in the region is the challenge.”
Of online survey respondents that self-identified as a manger, executive, or business owner, roughly 46 percent reported that they “disagreed” or “strongly disagreed” with the statement “My business has no problem finding qualified employees locally,” and “My business has no trouble recruiting workers from outside the region to the Creative Corridor.”
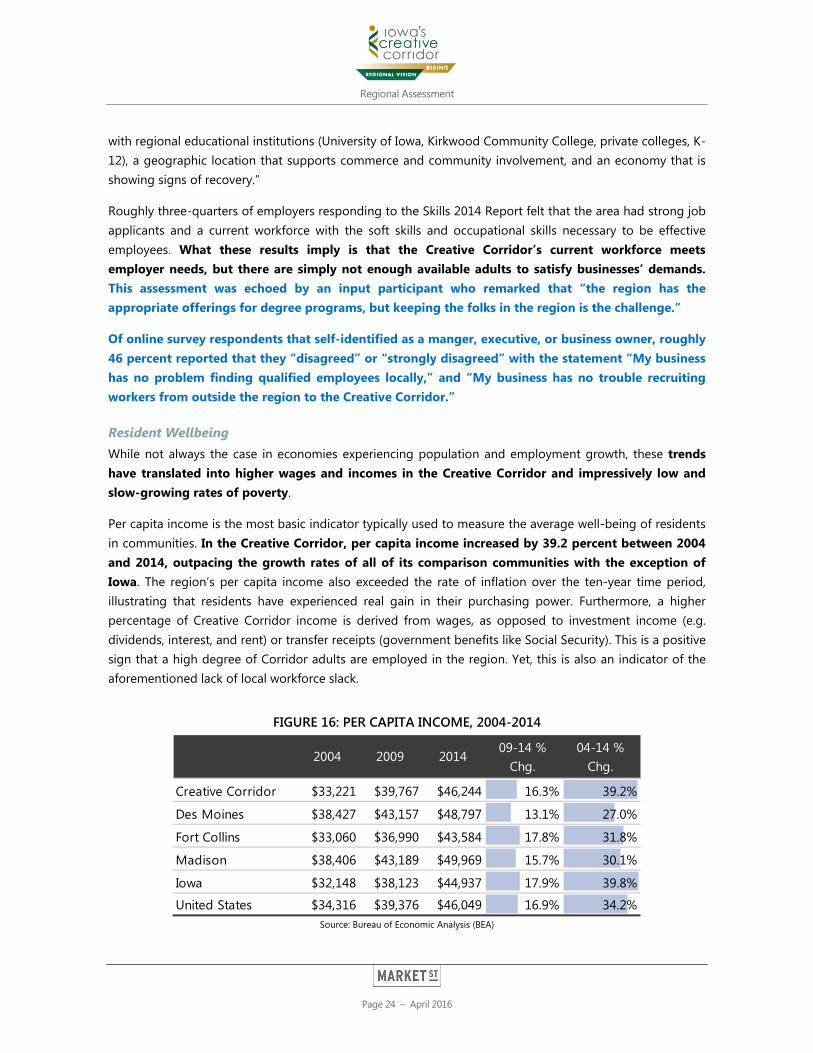
Resident Wellbeing While not always the case in economies experiencing population and employment growth, these trends have translated into higher wages and incomes in the Creative Corridor and impressively low and slow-growing rates of poverty.
Per capita income is the most basic indicator typically used to measure the average well-being of residents in communities. In the Creative Corridor, per capita income increased by 39.2 percent between 2004 and 2014, outpacing the growth rates of all of its comparison communities with the exception of Iowa. The region’s per capita income also exceeded the rate of inflation over the ten-year time period, illustrating that residents have experienced real gain in their purchasing power. Furthermore, a higher percentage of Creative Corridor income is derived from wages, as opposed to investment income (e.g. dividends, interest, and rent) or transfer receipts (government benefits like Social Security). This is a positive sign that a high degree of Corridor adults are employed in the region. Yet, this is also an indicator of the aforementioned lack of local workforce slack.
FIGURE 16: PER CAPITA INCOME, 2004-2014
Source: Bureau of Economic Analysis (BEA)
2004 2009 201409-14 %
Chg.04-14 %
Chg.
Creative Corridor $33,221 $39,767 $46,244 16.3% 39.2%
Des Moines $38,427 $43,157 $48,797 13.1% 27.0%
Fort Collins $33,060 $36,990 $43,584 17.8% 31.8%
Madison $38,406 $43,189 $49,969 15.7% 30.1%
Iowa $32,148 $38,123 $44,937 17.9% 39.8%
United States $34,316 $39,376 $46,049 16.9% 34.2%
Regional Assessment
Page 25 – April 2016
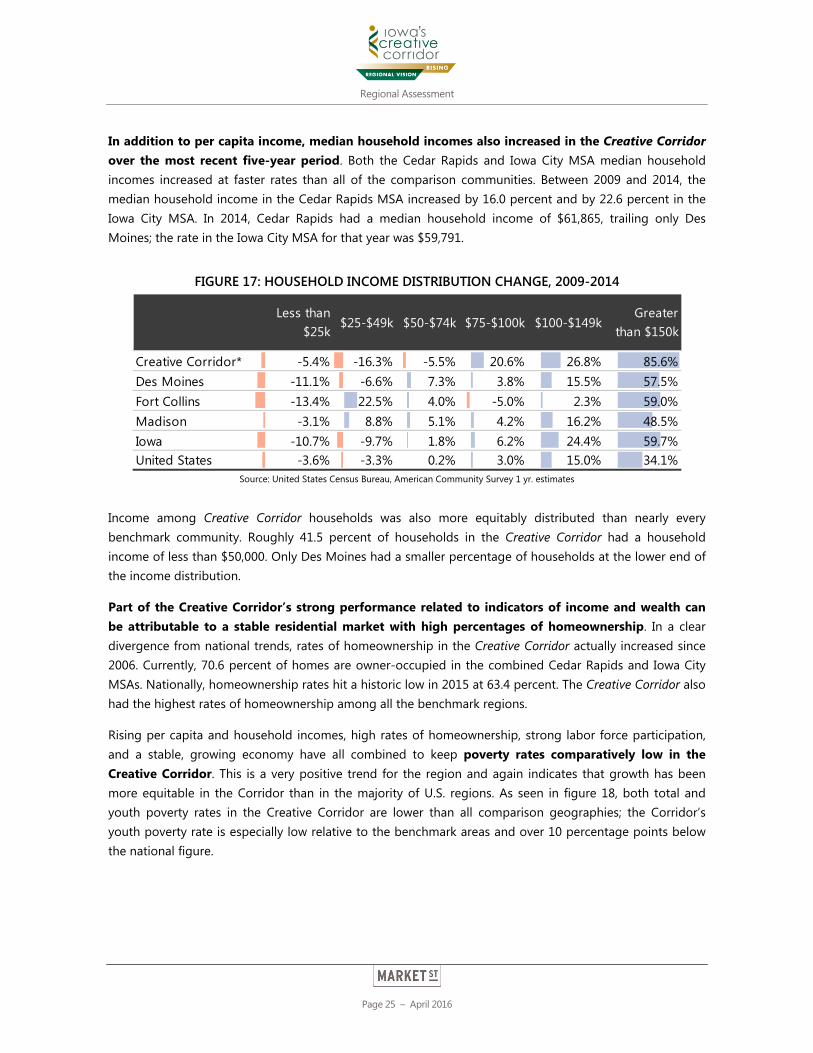
In addition to per capita income, median household incomes also increased in the Creative Corridor over the most recent five-year period. Both the Cedar Rapids and Iowa City MSA median household incomes increased at faster rates than all of the comparison communities. Between 2009 and 2014, the median household income in the Cedar Rapids MSA increased by 16.0 percent and by 22.6 percent in the Iowa City MSA. In 2014, Cedar Rapids had a median household income of $61,865, trailing only Des Moines; the rate in the Iowa City MSA for that year was $59,791.
FIGURE 17: HOUSEHOLD INCOME DISTRIBUTION CHANGE, 2009-2014
Source: United States Census Bureau, American Community Survey 1 yr. estimates
Income among Creative Corridor households was also more equitably distributed than nearly every benchmark community. Roughly 41.5 percent of households in the Creative Corridor had a household income of less than $50,000. Only Des Moines had a smaller percentage of households at the lower end of the income distribution.
Part of the Creative Corridor’s strong performance related to indicators of income and wealth can be attributable to a stable residential market with high percentages of homeownership. In a clear divergence from national trends, rates of homeownership in the Creative Corridor actually increased since 2006. Currently, 70.6 percent of homes are owner-occupied in the combined Cedar Rapids and Iowa City MSAs. Nationally, homeownership rates hit a historic low in 2015 at 63.4 percent. The Creative Corridor also had the highest rates of homeownership among all the benchmark regions.
Rising per capita and household incomes, high rates of homeownership, strong labor force participation, and a stable, growing economy have all combined to keep poverty rates comparatively low in the Creative Corridor. This is a very positive trend for the region and again indicates that growth has been more equitable in the Corridor than in the majority of U.S. regions. As seen in figure 18, both total and youth poverty rates in the Creative Corridor are lower than all comparison geographies; the Corridor’s youth poverty rate is especially low relative to the benchmark areas and over 10 percentage points below the national figure.
Less than $25k
$25-$49k $50-$74k $75-$100k $100-$149kGreater
than $150k
Creative Corridor* -5.4% -16.3% -5.5% 20.6% 26.8% 85.6%Des Moines -11.1% -6.6% 7.3% 3.8% 15.5% 57.5%Fort Collins -13.4% 22.5% 4.0% -5.0% 2.3% 59.0%Madison -3.1% 8.8% 5.1% 4.2% 16.2% 48.5%Iowa -10.7% -9.7% 1.8% 6.2% 24.4% 59.7%United States -3.6% -3.3% 0.2% 3.0% 15.0% 34.1%
Regional Assessment
Page 26 – April 2016
FIGURE 18: POVERTY RATES, 2014
Source: U.S. Census Bureau, SAIPE
Not only are total and youth poverty rates in the Creative Corridor low, they are comparatively more stable. Only Fort Collins experienced more positive poverty trends than the Corridor from 2009 to 2014, while the Creative Corridor’s ten-year performance from 2004 to 2014 was stronger than all comparison geographies for both poverty measures.
FIGURE 19: CHANGE IN POVERTY RATES, 2009-2014
Source: United States Census Bureau, SAIPE
Poverty, per capita income, household income, and homeownership trends in the Creative Corridor are all extremely positive and convey that the average Corridor resident is better off than the average American. Even during the Great Recession, the region proved resilient.
Even so, although the Creative Corridor’s measures of individual and household wellbeing are strong, aggregating data at the regional level almost always masks certain local issues that must be acknowledged
5-yr Chg. 10-yr Chg. 5-yr Chg. 10-yr Chg.Creative Corridor 4.0% 26.6% -0.3% 18.3%Des Moines 26.1% 46.9% 19.4% 61.2%Fort Collins -5.6% 55.3% -2.4% 24.5%Madison 6.6% 47.9% 27.5% 46.0%Iowa 7.7% 21.0% 0.9% 25.6%United States 12.5% 30.2% 7.0% 20.3%
Poverty Rate, All Ages Poverty Rate, Age 0-17
Regional Assessment
Page 27 – April 2016
and addressed strategically. In the Corridor, there are areas – principally in core urban neighborhoods – where unemployment and poverty rates are considerably higher than the regional average, with correspondingly lower median family incomes. Many of these neighborhoods have relatively high populations of individuals of color, recent immigrants and refugees, and young children. While these features are not uncommon in urban areas in Iowa or elsewhere in the U.S., allowing these trends to perpetuate risks further constraining an already tight workforce and exacerbating issues related to public safety, public health, and educational performance and attainment.
As was noted previously, numerous stakeholders expressed concern over academic performance, graduation rates, degree attainment, and workplace outcomes of certain central-core neighborhood populations in the Creative Corridor. If reading proficiency and academic achievement are not addressed, these children face limited prospects for the future while the Corridor’s workforce will continue to perform at less than full capacity.
In the next section of this report, the focus will shift from people to companies, with an examination of trends across a variety of indicators to determine the recent and current strength of the Creative Corridor economy and explain how the region has built wealth.
KEY TAKEAWAYS Educational attainment rates show that the Creative Corridor has a well-educated workforce, with
nearly half of adults possessing an associate’s degree or higher. The Corridor’s educational attainment rate of residents between the ages of 25 and 44 rivaled that of its comparison communities.
Performance outcomes and measures support input regarding the Creative Corridor’s strong Pre-K to 16 talent pipeline. High proficiency rates and high school graduation rates coupled with low dropout rates make the Corridor’s public systems competitive, although intra-regional performance is somewhat divergent.
Higher education capacity is a regional strength in the Creative Corridor. Output of graduates is high, with the number of degrees and certificates awarded comparable to the Corridor’s comparison communities. Additionally, the University of Iowa acts as a strong attractor of talent.
Workforce capacity and availability are top concerns for the region. Growth in the Creative Corridor labor force trails that of its comparison communities and has not kept up with the pace of job growth.
Population and employment growth trends have translated into higher wages and incomes in the Creative Corridor and impressively low and slow-growing rates of poverty. These also indicate a more equitable wealth distribution than in most of the comparison communities.
Regional Assessment
Page 28 – April 2016
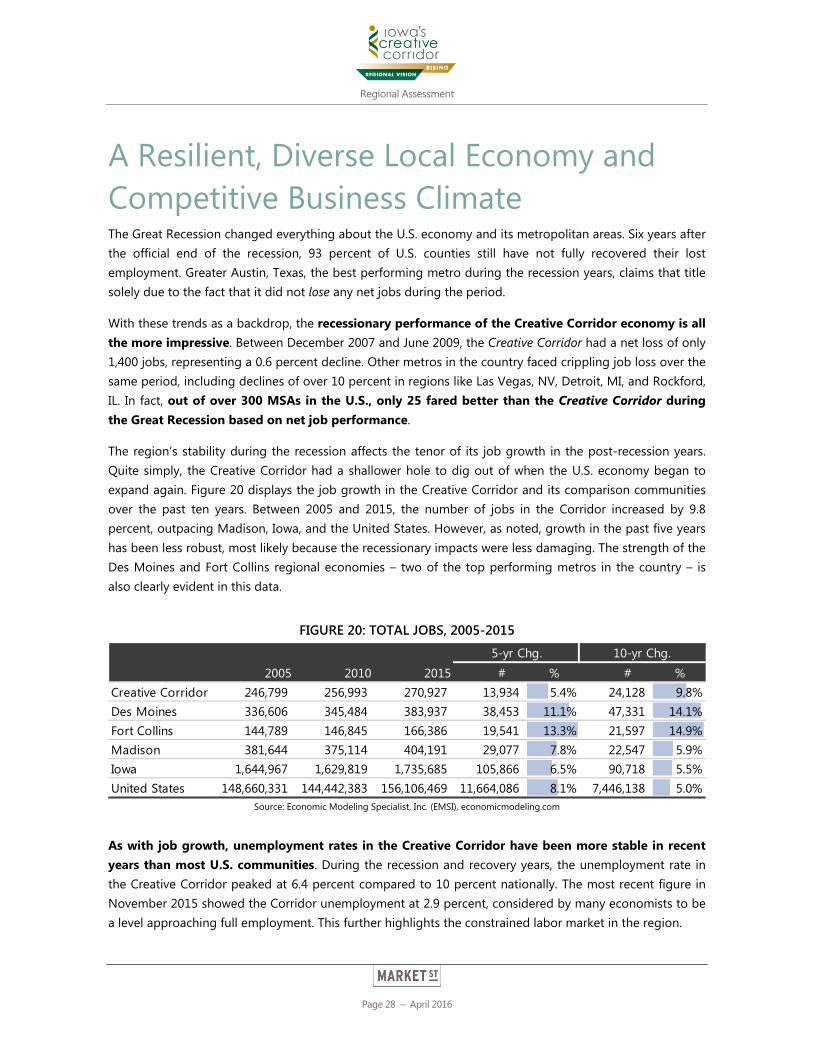
A Resilient, Diverse Local Economy and Competitive Business Climate The Great Recession changed everything about the U.S. economy and its metropolitan areas. Six years after the official end of the recession, 93 percent of U.S. counties still have not fully recovered their lost employment. Greater Austin, Texas, the best performing metro during the recession years, claims that title solely due to the fact that it did not lose any net jobs during the period.
With these trends as a backdrop, the recessionary performance of the Creative Corridor economy is all the more impressive. Between December 2007 and June 2009, the Creative Corridor had a net loss of only 1,400 jobs, representing a 0.6 percent decline. Other metros in the country faced crippling job loss over the same period, including declines of over 10 percent in regions like Las Vegas, NV, Detroit, MI, and Rockford, IL. In fact, out of over 300 MSAs in the U.S., only 25 fared better than the Creative Corridor during the Great Recession based on net job performance.
The region’s stability during the recession affects the tenor of its job growth in the post-recession years. Quite simply, the Creative Corridor had a shallower hole to dig out of when the U.S. economy began to expand again. Figure 20 displays the job growth in the Creative Corridor and its comparison communities over the past ten years. Between 2005 and 2015, the number of jobs in the Corridor increased by 9.8 percent, outpacing Madison, Iowa, and the United States. However, as noted, growth in the past five years has been less robust, most likely because the recessionary impacts were less damaging. The strength of the Des Moines and Fort Collins regional economies – two of the top performing metros in the country – is also clearly evident in this data.
FIGURE 20: TOTAL JOBS, 2005-2015
Source: Economic Modeling Specialist, Inc. (EMSI), economicmodeling.com
As with job growth, unemployment rates in the Creative Corridor have been more stable in recent years than most U.S. communities. During the recession and recovery years, the unemployment rate in the Creative Corridor peaked at 6.4 percent compared to 10 percent nationally. The most recent figure in November 2015 showed the Corridor unemployment at 2.9 percent, considered by many economists to be a level approaching full employment. This further highlights the constrained labor market in the region.
2005 2010 2015 # % # %Creative Corridor 246,799 256,993 270,927 13,934 5.4% 24,128 9.8%Des Moines 336,606 345,484 383,937 38,453 11.1% 47,331 14.1%Fort Collins 144,789 146,845 166,386 19,541 13.3% 21,597 14.9%Madison 381,644 375,114 404,191 29,077 7.8% 22,547 5.9%Iowa 1,644,967 1,629,819 1,735,685 105,866 6.5% 90,718 5.5%United States 148,660,331 144,442,383 156,106,469 11,664,086 8.1% 7,446,138 5.0%
5-yr Chg. 10-yr Chg.
Regional Assessment
Page 29 – April 2016
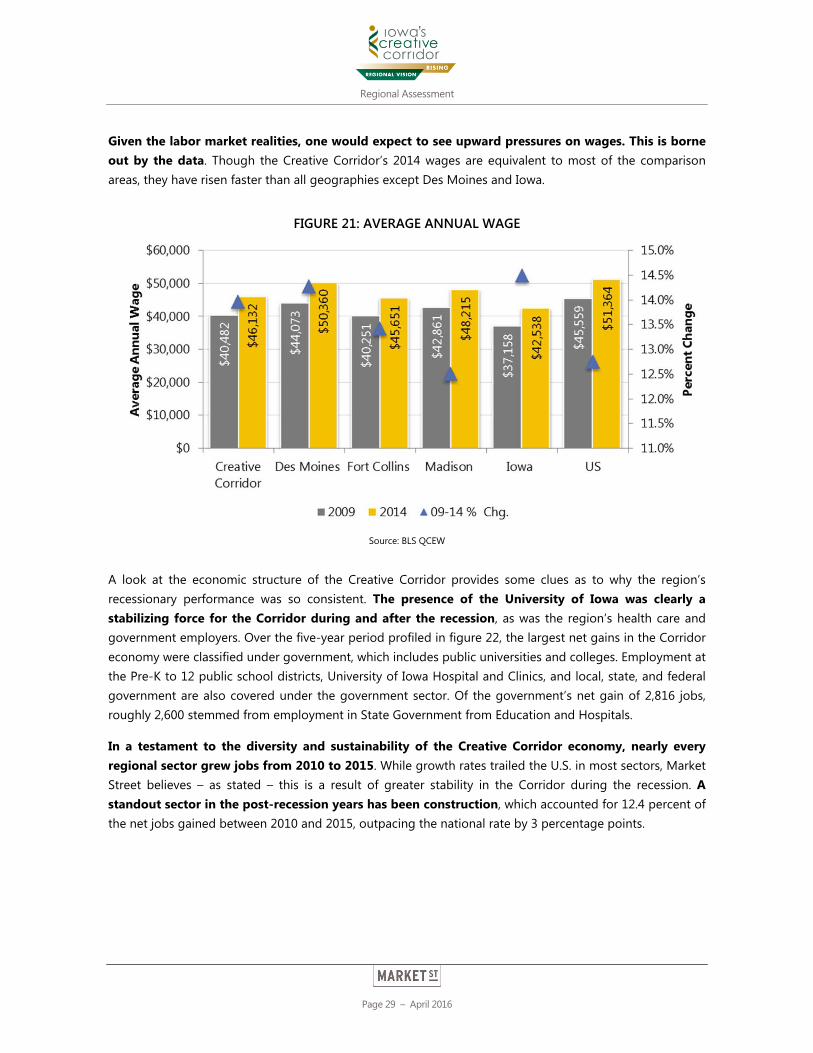
Given the labor market realities, one would expect to see upward pressures on wages. This is borne out by the data. Though the Creative Corridor’s 2014 wages are equivalent to most of the comparison areas, they have risen faster than all geographies except Des Moines and Iowa.
FIGURE 21: AVERAGE ANNUAL WAGE
Source: BLS QCEW
A look at the economic structure of the Creative Corridor provides some clues as to why the region’s recessionary performance was so consistent. The presence of the University of Iowa was clearly a stabilizing force for the Corridor during and after the recession, as was the region’s health care and government employers. Over the five-year period profiled in figure 22, the largest net gains in the Corridor economy were classified under government, which includes public universities and colleges. Employment at the Pre-K to 12 public school districts, University of Iowa Hospital and Clinics, and local, state, and federal government are also covered under the government sector. Of the government’s net gain of 2,816 jobs, roughly 2,600 stemmed from employment in State Government from Education and Hospitals.
In a testament to the diversity and sustainability of the Creative Corridor economy, nearly every regional sector grew jobs from 2010 to 2015. While growth rates trailed the U.S. in most sectors, Market Street believes – as stated – this is a result of greater stability in the Corridor during the recession. A standout sector in the post-recession years has been construction, which accounted for 12.4 percent of the net jobs gained between 2010 and 2015, outpacing the national rate by 3 percentage points.
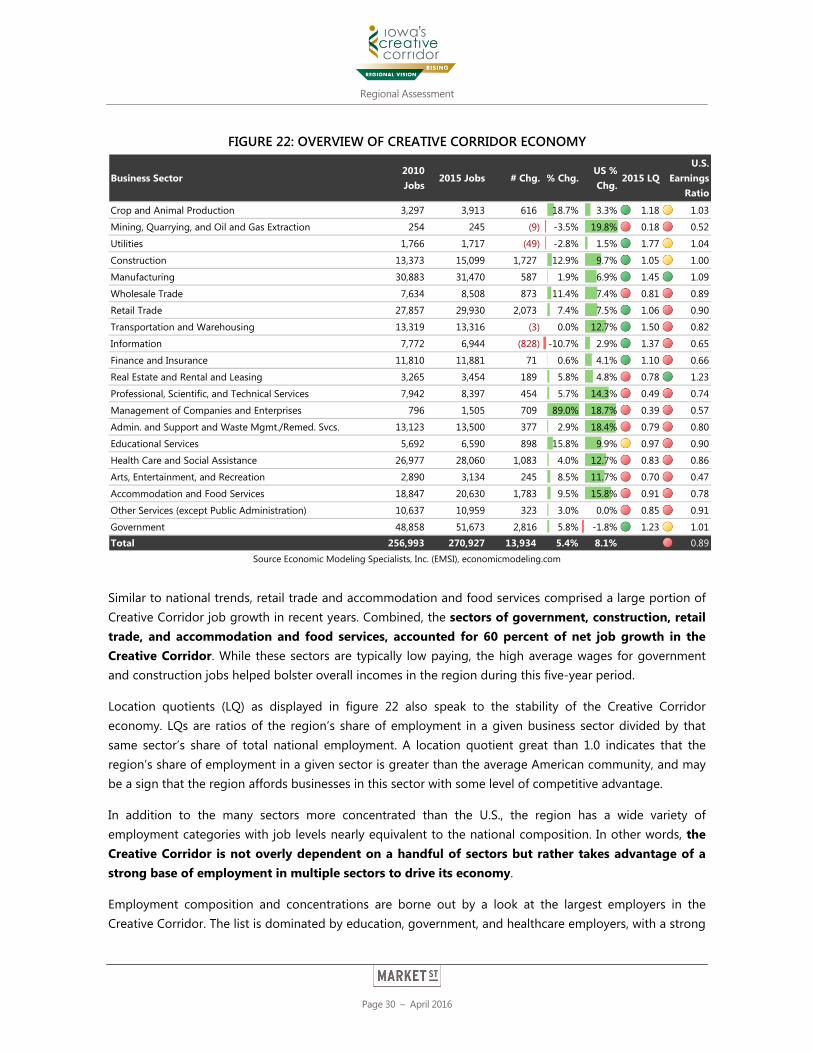
Regional Assessment
Page 30 – April 2016
FIGURE 22: OVERVIEW OF CREATIVE CORRIDOR ECONOMY
Source Economic Modeling Specialists, Inc. (EMSI), economicmodeling.com
Similar to national trends, retail trade and accommodation and food services comprised a large portion of Creative Corridor job growth in recent years. Combined, the sectors of government, construction, retail trade, and accommodation and food services, accounted for 60 percent of net job growth in the Creative Corridor. While these sectors are typically low paying, the high average wages for government and construction jobs helped bolster overall incomes in the region during this five-year period.
Location quotients (LQ) as displayed in figure 22 also speak to the stability of the Creative Corridor economy. LQs are ratios of the region’s share of employment in a given business sector divided by that same sector’s share of total national employment. A location quotient great than 1.0 indicates that the region’s share of employment in a given sector is greater than the average American community, and may be a sign that the region affords businesses in this sector with some level of competitive advantage.
In addition to the many sectors more concentrated than the U.S., the region has a wide variety of employment categories with job levels nearly equivalent to the national composition. In other words, the Creative Corridor is not overly dependent on a handful of sectors but rather takes advantage of a strong base of employment in multiple sectors to drive its economy.
Employment composition and concentrations are borne out by a look at the largest employers in the Creative Corridor. The list is dominated by education, government, and healthcare employers, with a strong
Business Sector2010 Jobs
2015 Jobs # Chg. % Chg.US % Chg.
2015 LQU.S.
Earnings Ratio
Crop and Animal Production 3,297 3,913 616 18.7% 3.3% 1.18 1.03
Mining, Quarrying, and Oil and Gas Extraction 254 245 (9) -3.5% 19.8% 0.18 0.52
Utilities 1,766 1,717 (49) -2.8% 1.5% 1.77 1.04
Construction 13,373 15,099 1,727 12.9% 9.7% 1.05 1.00
Manufacturing 30,883 31,470 587 1.9% 6.9% 1.45 1.09
Wholesale Trade 7,634 8,508 873 11.4% 7.4% 0.81 0.89
Retail Trade 27,857 29,930 2,073 7.4% 7.5% 1.06 0.90
Transportation and Warehousing 13,319 13,316 (3) 0.0% 12.7% 1.50 0.82
Information 7,772 6,944 (828) -10.7% 2.9% 1.37 0.65
Finance and Insurance 11,810 11,881 71 0.6% 4.1% 1.10 0.66
Real Estate and Rental and Leasing 3,265 3,454 189 5.8% 4.8% 0.78 1.23
Professional, Scientific, and Technical Services 7,942 8,397 454 5.7% 14.3% 0.49 0.74
Management of Companies and Enterprises 796 1,505 709 89.0% 18.7% 0.39 0.57
Admin. and Support and Waste Mgmt./Remed. Svcs. 13,123 13,500 377 2.9% 18.4% 0.79 0.80
Educational Services 5,692 6,590 898 15.8% 9.9% 0.97 0.90
Health Care and Social Assistance 26,977 28,060 1,083 4.0% 12.7% 0.83 0.86
Arts, Entertainment, and Recreation 2,890 3,134 245 8.5% 11.7% 0.70 0.47
Accommodation and Food Services 18,847 20,630 1,783 9.5% 15.8% 0.91 0.78
Other Services (except Public Administration) 10,637 10,959 323 3.0% 0.0% 0.85 0.91
Government 48,858 51,673 2,816 5.8% -1.8% 1.23 1.01Total 256,993 270,927 13,934 5.4% 8.1% 0.89
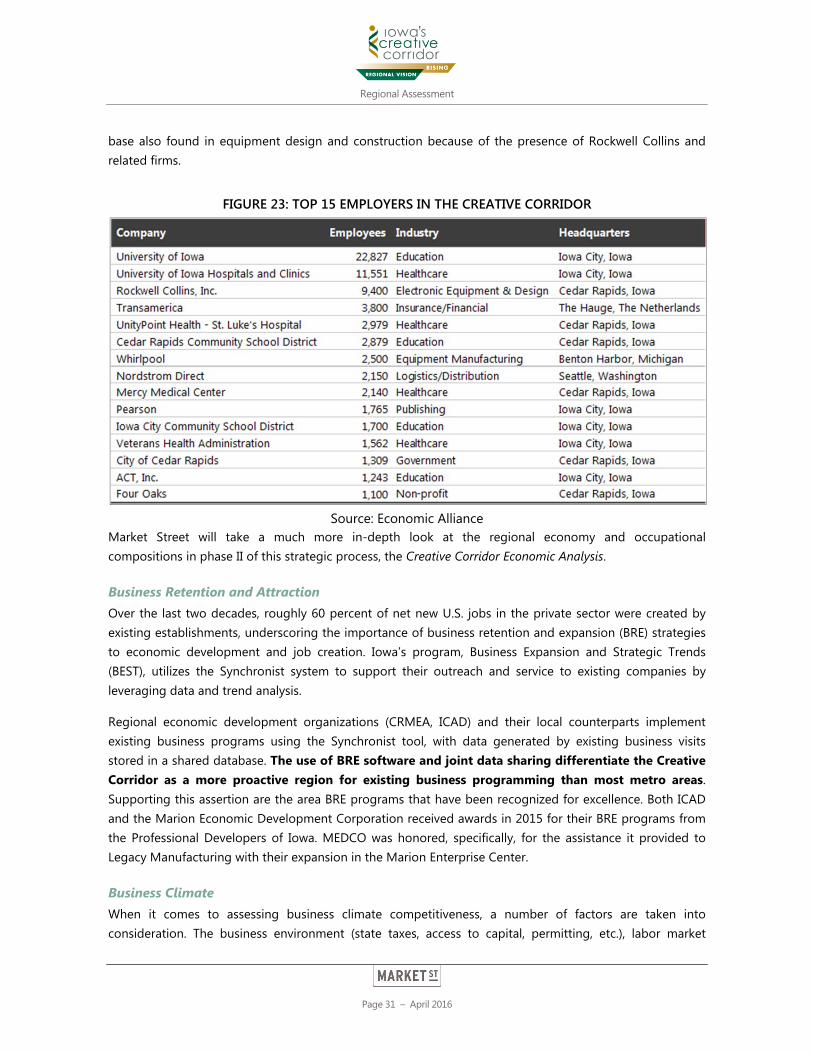
Regional Assessment
Page 31 – April 2016
base also found in equipment design and construction because of the presence of Rockwell Collins and related firms.
FIGURE 23: TOP 15 EMPLOYERS IN THE CREATIVE CORRIDOR
Source: Economic Alliance
Market Street will take a much more in-depth look at the regional economy and occupational compositions in phase II of this strategic process, the Creative Corridor Economic Analysis.
Business Retention and Attraction Over the last two decades, roughly 60 percent of net new U.S. jobs in the private sector were created by existing establishments, underscoring the importance of business retention and expansion (BRE) strategies to economic development and job creation. Iowa’s program, Business Expansion and Strategic Trends (BEST), utilizes the Synchronist system to support their outreach and service to existing companies by leveraging data and trend analysis.
Regional economic development organizations (CRMEA, ICAD) and their local counterparts implement existing business programs using the Synchronist tool, with data generated by existing business visits stored in a shared database. The use of BRE software and joint data sharing differentiate the Creative Corridor as a more proactive region for existing business programming than most metro areas. Supporting this assertion are the area BRE programs that have been recognized for excellence. Both ICAD and the Marion Economic Development Corporation received awards in 2015 for their BRE programs from the Professional Developers of Iowa. MEDCO was honored, specifically, for the assistance it provided to Legacy Manufacturing with their expansion in the Marion Enterprise Center.
Business Climate When it comes to assessing business climate competitiveness, a number of factors are taken into consideration. The business environment (state taxes, access to capital, permitting, etc.), labor market
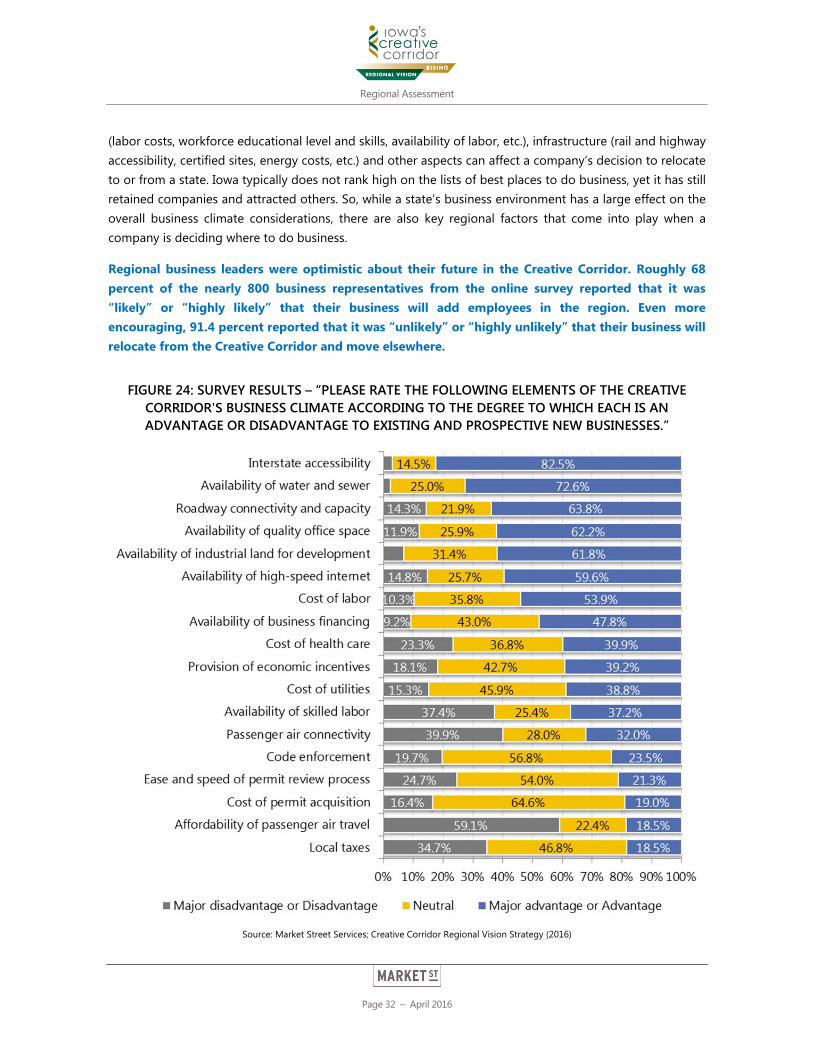
Regional Assessment
Page 32 – April 2016
(labor costs, workforce educational level and skills, availability of labor, etc.), infrastructure (rail and highway accessibility, certified sites, energy costs, etc.) and other aspects can affect a company’s decision to relocate to or from a state. Iowa typically does not rank high on the lists of best places to do business, yet it has still retained companies and attracted others. So, while a state’s business environment has a large effect on the overall business climate considerations, there are also key regional factors that come into play when a company is deciding where to do business.
Regional business leaders were optimistic about their future in the Creative Corridor. Roughly 68 percent of the nearly 800 business representatives from the online survey reported that it was “likely” or “highly likely” that their business will add employees in the region. Even more encouraging, 91.4 percent reported that it was “unlikely” or “highly unlikely” that their business will relocate from the Creative Corridor and move elsewhere.
FIGURE 24: SURVEY RESULTS – “PLEASE RATE THE FOLLOWING ELEMENTS OF THE CREATIVE CORRIDOR'S BUSINESS CLIMATE ACCORDING TO THE DEGREE TO WHICH EACH IS AN ADVANTAGE OR DISADVANTAGE TO EXISTING AND PROSPECTIVE NEW BUSINESSES.”
Source: Market Street Services; Creative Corridor Regional Vision Strategy (2016)
Regional Assessment
Page 33 – April 2016
Question was presented to 785 individuals that self-identified themselves as owners, executives, or managers at their place of employment.
Figure 24 displays survey participants’ responses regarding various business environment considerations of the Creative Corridor. Transportation accessibility, water and sewer capacity, office space, and land availability ranked highly, while costs associated with taxes, air travel, and permitting process finished poorly.
Key categories are profiled in more detail below.
Location and connectivity: According to Area Development’s 29th Annual Corporate Survey of 252 decision-makers at companies with sales of one billion or more, the number one site selection factor in 2015 was highway accessibility. In the Creative Corridor, roughly eight out of ten survey respondents from the business community felt that the region’s interstate accessibility was a “major advantage” or “advantage,” while 63.8 percent felt that roadway connectivity and capacity were advantages. The region’s competitive advantage regarding location and access to both roadways and rail lines is visible in the high location quotient in the region’s transportation and warehousing business sector. Roughly 6 percent of private sector jobs in the Creative Corridor are in transportation and warehousing. I-80 and I-380 were both cited by input participants as strengths of the region. While there were complaints regarding the congestion along I-380, people were optimistic about the potential of expanding it to six lanes, as well as the extension of Highway 100 that will help to divert some of the traffic off I-380. Others, however, noted that perceptions of traffic are relative, and the drive along I-380 in the Creative Corridor was rarely congested.
The Eastern Iowa Airport is the principal passenger and cargo airport in the Creative Corridor. Roughly 84 million pounds of cargo went through the airport over the past year, an increase of 33.3 percent since 2010. Passenger travel has also increased over the past five years, with over a half a million departures between October 2014 and 2015. Overall, passenger departures increased by 21.1 percent. Some input participants felt that passenger air costs were too high and flight options too infrequent. Nearly 60 percent of survey respondents felt that the affordability of air travel was a “disadvantage” or “major disadvantage” to the region’s existing and prospective new businesses. Nevertheless, according to the Bureau of Transportation Statistics, average airfare for departing passengers out of Eastern Iowa Airport in the 2015 second quarter was $402, which was only slightly higher than the $394 average airfare out of Des Moines International. The presence of Eastern Iowa Airport is supplemented by multiple general aviation facilities across the Corridor which not only accommodate private air travel but also provide compelling opportunities for fixed-base operator service expansion and economic development.
Utilities and communications: Availability of water and sewer was rated highly favorable by input participants from the business community, with 72.6 percent rating it as an advantage to the region’s business climate. Given the demands of the local economy, the region is well equipped with water and wastewater treatment infrastructure. Both Cedar Rapids and Iowa City
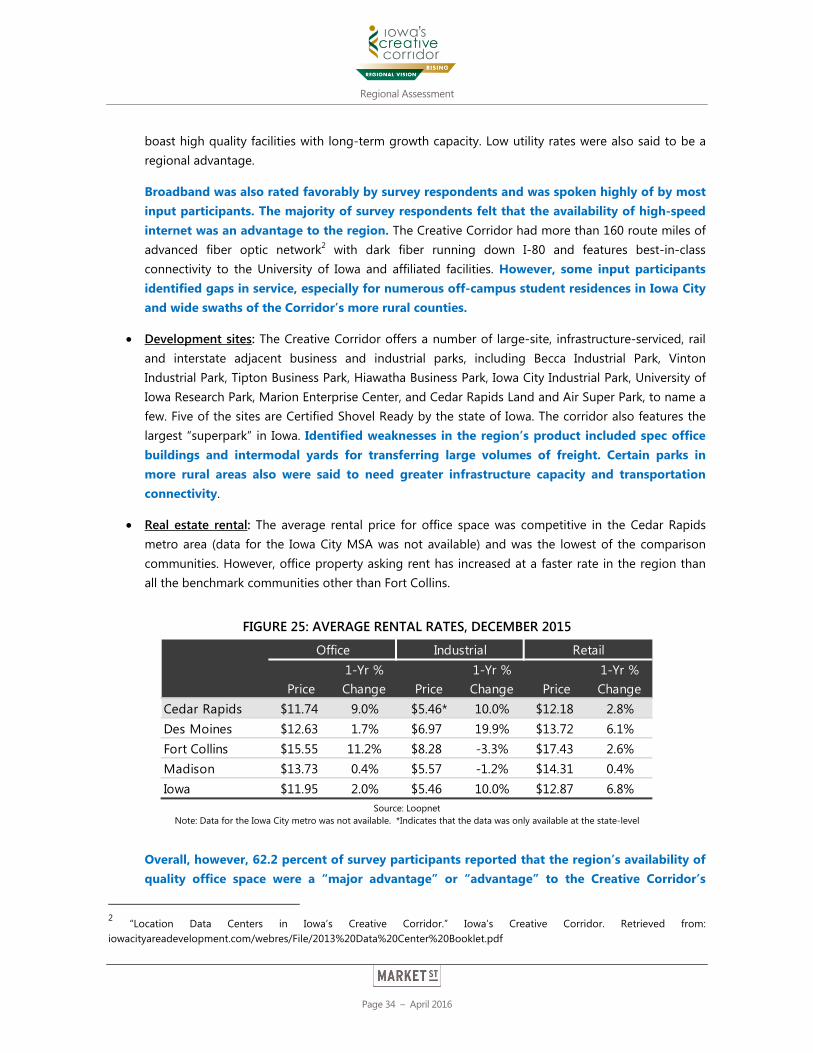
Regional Assessment
Page 34 – April 2016
boast high quality facilities with long-term growth capacity. Low utility rates were also said to be a regional advantage.
Broadband was also rated favorably by survey respondents and was spoken highly of by most input participants. The majority of survey respondents felt that the availability of high-speed internet was an advantage to the region. The Creative Corridor had more than 160 route miles of advanced fiber optic network2 with dark fiber running down I-80 and features best-in-class connectivity to the University of Iowa and affiliated facilities. However, some input participants identified gaps in service, especially for numerous off-campus student residences in Iowa City and wide swaths of the Corridor’s more rural counties.
Development sites: The Creative Corridor offers a number of large-site, infrastructure-serviced, rail and interstate adjacent business and industrial parks, including Becca Industrial Park, Vinton Industrial Park, Tipton Business Park, Hiawatha Business Park, Iowa City Industrial Park, University of Iowa Research Park, Marion Enterprise Center, and Cedar Rapids Land and Air Super Park, to name a few. Five of the sites are Certified Shovel Ready by the state of Iowa. The corridor also features the largest “superpark” in Iowa. Identified weaknesses in the region’s product included spec office buildings and intermodal yards for transferring large volumes of freight. Certain parks in more rural areas also were said to need greater infrastructure capacity and transportation connectivity.
Real estate rental: The average rental price for office space was competitive in the Cedar Rapids metro area (data for the Iowa City MSA was not available) and was the lowest of the comparison communities. However, office property asking rent has increased at a faster rate in the region than all the benchmark communities other than Fort Collins.
FIGURE 25: AVERAGE RENTAL RATES, DECEMBER 2015
Source: Loopnet
Note: Data for the Iowa City metro was not available. *Indicates that the data was only available at the state-level
Overall, however, 62.2 percent of survey participants reported that the region’s availability of quality office space were a “major advantage” or “advantage” to the Creative Corridor’s
2 “Location Data Centers in Iowa’s Creative Corridor.” Iowa’s Creative Corridor. Retrieved from: iowacityareadevelopment.com/webres/File/2013%20Data%20Center%20Booklet.pdf
Price1-Yr % Change Price
1-Yr % Change Price
1-Yr % Change
Cedar Rapids $11.74 9.0% $5.46* 10.0% $12.18 2.8%Des Moines $12.63 1.7% $6.97 19.9% $13.72 6.1%Fort Collins $15.55 11.2% $8.28 -3.3% $17.43 2.6%Madison $13.73 0.4% $5.57 -1.2% $14.31 0.4%Iowa $11.95 2.0% $5.46 10.0% $12.87 6.8%
Office Industrial Retail
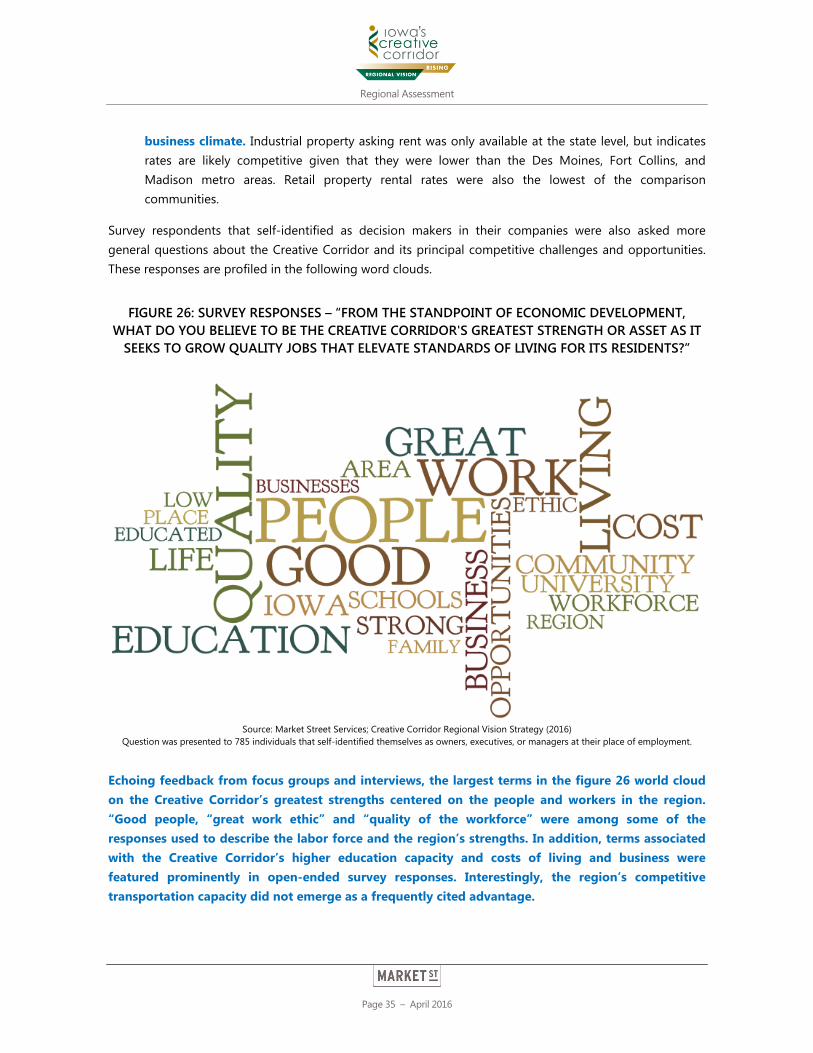
Regional Assessment
Page 35 – April 2016
business climate. Industrial property asking rent was only available at the state level, but indicates rates are likely competitive given that they were lower than the Des Moines, Fort Collins, and Madison metro areas. Retail property rental rates were also the lowest of the comparison communities.
Survey respondents that self-identified as decision makers in their companies were also asked more general questions about the Creative Corridor and its principal competitive challenges and opportunities. These responses are profiled in the following word clouds.
FIGURE 26: SURVEY RESPONSES – “FROM THE STANDPOINT OF ECONOMIC DEVELOPMENT, WHAT DO YOU BELIEVE TO BE THE CREATIVE CORRIDOR'S GREATEST STRENGTH OR ASSET AS IT
SEEKS TO GROW QUALITY JOBS THAT ELEVATE STANDARDS OF LIVING FOR ITS RESIDENTS?”
Source: Market Street Services; Creative Corridor Regional Vision Strategy (2016)
Question was presented to 785 individuals that self-identified themselves as owners, executives, or managers at their place of employment.
Echoing feedback from focus groups and interviews, the largest terms in the figure 26 world cloud on the Creative Corridor’s greatest strengths centered on the people and workers in the region. “Good people, “great work ethic” and “quality of the workforce” were among some of the responses used to describe the labor force and the region’s strengths. In addition, terms associated with the Creative Corridor’s higher education capacity and costs of living and business were featured prominently in open-ended survey responses. Interestingly, the region’s competitive transportation capacity did not emerge as a frequently cited advantage.
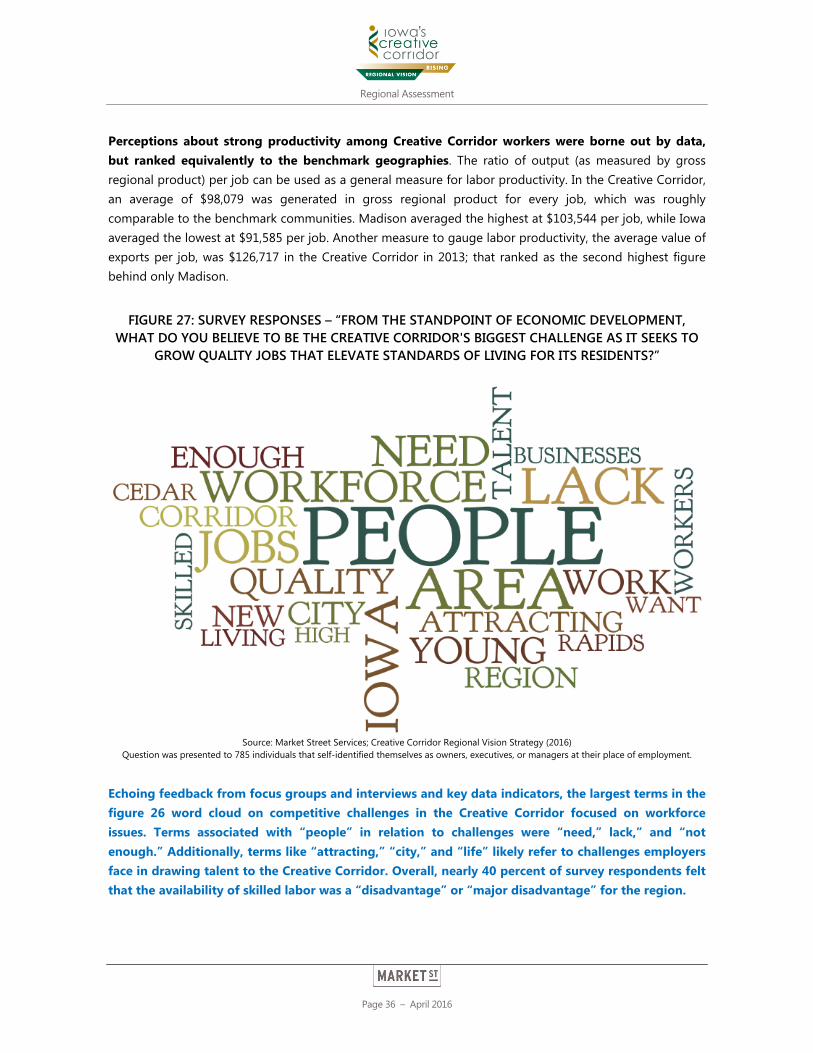
Regional Assessment
Page 36 – April 2016
Perceptions about strong productivity among Creative Corridor workers were borne out by data, but ranked equivalently to the benchmark geographies. The ratio of output (as measured by gross regional product) per job can be used as a general measure for labor productivity. In the Creative Corridor, an average of $98,079 was generated in gross regional product for every job, which was roughly comparable to the benchmark communities. Madison averaged the highest at $103,544 per job, while Iowa averaged the lowest at $91,585 per job. Another measure to gauge labor productivity, the average value of exports per job, was $126,717 in the Creative Corridor in 2013; that ranked as the second highest figure behind only Madison.
FIGURE 27: SURVEY RESPONSES – “FROM THE STANDPOINT OF ECONOMIC DEVELOPMENT, WHAT DO YOU BELIEVE TO BE THE CREATIVE CORRIDOR'S BIGGEST CHALLENGE AS IT SEEKS TO
GROW QUALITY JOBS THAT ELEVATE STANDARDS OF LIVING FOR ITS RESIDENTS?”
Source: Market Street Services; Creative Corridor Regional Vision Strategy (2016)
Question was presented to 785 individuals that self-identified themselves as owners, executives, or managers at their place of employment.
Echoing feedback from focus groups and interviews and key data indicators, the largest terms in the figure 26 word cloud on competitive challenges in the Creative Corridor focused on workforce issues. Terms associated with “people” in relation to challenges were “need,” lack,” and “not enough.” Additionally, terms like “attracting,” “city,” and “life” likely refer to challenges employers face in drawing talent to the Creative Corridor. Overall, nearly 40 percent of survey respondents felt that the availability of skilled labor was a “disadvantage” or “major disadvantage” for the region.
Regional Assessment
Page 37 – April 2016
Concerns over labor availability in the Creative Corridor echo those from corporate leaders across the country. In Area Development magazine’s most recent Annual Corporate Survey, 50 percent of corporate respondents rated the availability of skilled labor as a “very important” location factor, which ranked fifth among their principal competitive concerns. Site location professionals have also expressed more vocally in recent years that talent dynamics are now the top selection criteria valued by most clients.
The Creative Corridor’s constrained labor capacity must be a priority strategic concern for its Regional Vision and strategic activities moving forward. Job creation can be achieved by three primary sources – business expansion/retention, business recruitment/relocation, and entrepreneurship – and all three require an available and sustainable workforce to be successful. The next section of this report explores these dynamics and others as they relate to the region’s entrepreneurial capacity and ecosystem.
KEY TAKEAWAYS The Creative Corridor’s diverse economy proved resilient throughout the recession, while nearly
every business sector has continued to add jobs since 2009.
The Creative Corridor has a constrained labor market with an extremely low unemployment rate.
o The low unemployment rates put upward pressure on average wages in the region, which increased at faster rates than all the comparison communities with the exception of Des Moines and Iowa.
The Creative Corridor has a competitive business climate to offer new and potential companies. Regional business leaders are optimistic about future hiring, worry about the supply of available labor.
o Leaders’ assessments of a productive Corridor workforce were borne out by data.

Regional Assessment
Page 38 – April 2016
Strong Entrepreneurial Legacy with a Still-Evolving Startup Ecosystem As one stakeholder said, “The bedrock of our community has been what we’ve built ourselves.” The Creative Corridor boasts a number of homegrown companies and established entrepreneurs, with the business sectors they operate in as diverse as the overall economy itself. Although several established entrepreneurial firms are now large, third or fourth-generation family-owned companies, others have since merged or been taken over by multi-national corporations. Companies like Rockwell Collins, CRST, Hupp Electric Motors, TrueNorth, ACT, Apache, and Diamond V, to name a few, all got their start in the region and have continued to provide jobs for thousands of local residents and serve as critical assets for worker retention and attraction. While the Creative Corridor’s entrepreneurial “ecosystem” in the modern tech economy is still evolving, the presence of the University of Iowa, research-intensive companies, established entrepreneurial mentors, capital availability (for those who know where to look), and an active event and networking culture provide a solid base for future expansion. Integrated DNA Technologies and, more recently, Higher Learning Technologies, are examples of startups that have succeeded in the Creative Corridor.
While conceptions about what constitutes a “small business” vary, the SBA Office of Advocacy defines them as companies with fewer than 500 employees. According to the Office of Advocacy, 63 percent of net new jobs created between 1993 and mid-2013 stemmed from these small businesses. Slightly under half of the Creative Corridor’s jobs are in SBA-defined small businesses, with their growth from 2009 to 2014 trailing all the comparison geographies, most notably Des Moines, Fort Collins, and Iowa. Of the approximately 13,000 Corridor jobs created during this period, only 9.1 percent were in small businesses. The Creative Corridor’s overall growth and expansion of 500 employee and larger firms has been more equivalent to the benchmarks.
FIGURE 28: EMPLOYEES BY FIRM SIZE, Q4 2009-Q4 2014
Source: United States Census Bureau, Quarterly Workforce Indicators (QWI)
At Establishments with fewer than 500 employees
At Establishments with more than 500 employees
At Establishments with fewer than 500 employees
At Establishments with more than 500 employees
Creative Corridor 97,356 104,947 1.2% 12.8%
Des Moines 134,888 168,988 7.3% 9.6%
Fort Collins 67,746 43,688 11.8% 15.3%
Madison 156,238 135,899 8.7% 10.5%
Iowa 677,402 613,908 2.0% 13.3%
5-year % ChangeQ4 2014 Jobs
Regional Assessment
Page 39 – April 2016
While these data would seem to imply that the Creative Corridor’s small business sector is less dynamic than well-known startup hubs like Fort Collins and Madison, additional data analysis is necessary to confirm this assessment.
Examining the Creative Corridor’s share of employment at firms with fewer than 50 employees, the narrative changes slightly. In Q4 of 2014, the Corridor had nearly 28 percent of its jobs in 50-and-less employee firms. This was greater than Des Moines (23.3 percent), but trailed the other comparison areas. In Fort Collins, over 40 percent of jobs are in firms of this size. More concerning for the Creative Corridor is that the share of jobs in 50 employee and less firms decreased by 2.5 percentage points from Q4 2009 to Q4 2014, the largest drop of all the benchmark geographies.
So-called “self-employment” refers to an individual who works for him or herself as opposed to an employer that pays them a salary or wage. It is considered a viable proxy for a community’s entrepreneurship capacity. In the Creative Corridor, 5.3 percent of total employment is comprised by those who are self-employed. This figure is equivalent to Des Moines, greater than Madison (4.6 percent), and trails Fort Collins (7.0 percent), Iowa (6.8 percent), and the U.S. (6.3 percent). That said, the Corridor’s self-employment rates declined less than all the comparison areas over the past five years – a period that was difficult for small businesses across the country.
Finally, looking at the dynamics of “young” firms (those in business less than 10 years), provides even more perspective on entrepreneurial dynamics. While the percentage of the overall economy comprised by these firms in the Creative Corridor is equivalent to the benchmarks, its five year performance has been notably worse than all the comparables except Madison.
FIGURE 29: EMPLOYEES BY FIRMS AGE, +/- 10 YEARS, Q4 2009-Q4 2014
Source: United States Census Bureau, Quarterly Workforce Indicators (QWI)
The general takeaway from this analysis is that the Creative Corridor has a slightly less robust base of small businesses as the state, nation, and Des Moines, and notably less capacity than acknowledged startup hubs in Fort Collins and Madison. Seen broadly, the small business momentum in the Corridor in recent years has also been declining based on data examined.
Regional Assessment
Page 40 – April 2016
Despite this conclusion, there has not been a complete dearth of small business success stories in the recent history of the Creative Corridor, some of which represent the region’s fastest growing companies. These include Clickstop, which launched in 2005, Involta in 2007, Health Solutions in 2004, and Ready Wireless in 2008; all of these firms have been on Inc.’s 5000 fastest-growing private companies in America list.
On the whole, public input participants were complimentary of the Creative Corridor’s startup ecosystem and hopeful for the future. This was especially true for the potential to start a business, though not necessarily scale it. Multiple resources were said to exist to launch a concept, including small business competitions, incubation and coworking facilities, a 1 Million Cups program, networking events, seed capital investment opportunities, and others. There is camaraderie among entrepreneurs in the Corridor and willingness to support and mentor fledgling founders that was said to be more authentic than in many communities, largely because of the comparatively small breadth of the ecosystem. One participant said that Creative Corridor entrepreneurs have “one degree instead of six degrees of separation.”
According to input respondents, challenges arise when a startup tries to scale to a more sustainable size and market reach. Finding sources for Series A, B, and later-stage capital investment rounds as well as sourcing the talent necessary to grow technology businesses were said to be the principal challenges to growing a startup in the Creative Corridor. Founders have to bootstrap in the Corridor to a greater degree than in more established entrepreneurial hubs and plumb every possible resource for advice, mentorship, capital, and identification of potential employees, whether local or virtual. While this is a common issue in regions across the country, the Creative Corridor is not necessarily on the radar of the most well-known venture capital firms. One input respondent said that a VC from Silicon Valley was dismayed that he actually had to take a connecting flight to reach the Creative Corridor. In addition to this lack of external awareness, respondents said there is an underdeveloped – though growing – understanding among local residents that entrepreneurship is a viable career path.
Focus group participants admitted that it is difficult to change people’s perceptions about the Corridor because traditional television ads do not work in the venture capital and entrepreneurial world; it takes a grassroots effort to really get people to start looking at Iowa. Further, the Creative Corridor cannot tout any “homeruns” to build and expand the investor pool and interest in Iowa. Still, individuals from the entrepreneurial and startup community felt that many of the pieces were in place to start changing those perceptions and that “the ecosystem is coming.”
Average small business loan size in the Creative Corridor was the highest of all the comparison communities and had the largest increase over the past ten years. This could indicate either less restrictive access to loans in the Corridor, a greater need for capital, or both.
One contributor to the growth of the Creative Corridor’s startup ecosystem is a relatively new Cedar Rapids Community School District program called Iowa BIG. Students who are a part of the BIG program attend classes part-time at the Vault, a co-working space for entrepreneurs. The goal is to foster student interest by providing hands-on, competency-based learning.
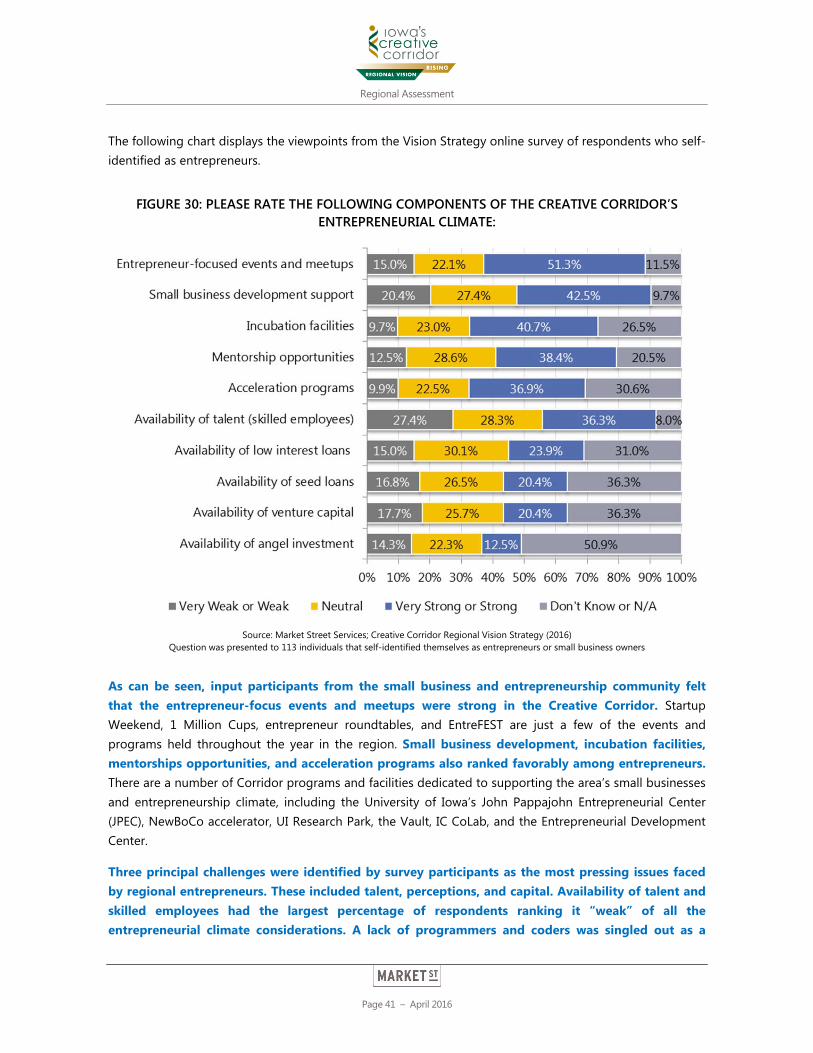
Regional Assessment
Page 41 – April 2016
The following chart displays the viewpoints from the Vision Strategy online survey of respondents who self-identified as entrepreneurs.
FIGURE 30: PLEASE RATE THE FOLLOWING COMPONENTS OF THE CREATIVE CORRIDOR’S ENTREPRENEURIAL CLIMATE:
Source: Market Street Services; Creative Corridor Regional Vision Strategy (2016)
Question was presented to 113 individuals that self-identified themselves as entrepreneurs or small business owners
As can be seen, input participants from the small business and entrepreneurship community felt that the entrepreneur-focus events and meetups were strong in the Creative Corridor. Startup Weekend, 1 Million Cups, entrepreneur roundtables, and EntreFEST are just a few of the events and programs held throughout the year in the region. Small business development, incubation facilities, mentorships opportunities, and acceleration programs also ranked favorably among entrepreneurs. There are a number of Corridor programs and facilities dedicated to supporting the area’s small businesses and entrepreneurship climate, including the University of Iowa’s John Pappajohn Entrepreneurial Center (JPEC), NewBoCo accelerator, UI Research Park, the Vault, IC CoLab, and the Entrepreneurial Development Center.
Three principal challenges were identified by survey participants as the most pressing issues faced by regional entrepreneurs. These included talent, perceptions, and capital. Availability of talent and skilled employees had the largest percentage of respondents ranking it “weak” of all the entrepreneurial climate considerations. A lack of programmers and coders was singled out as a
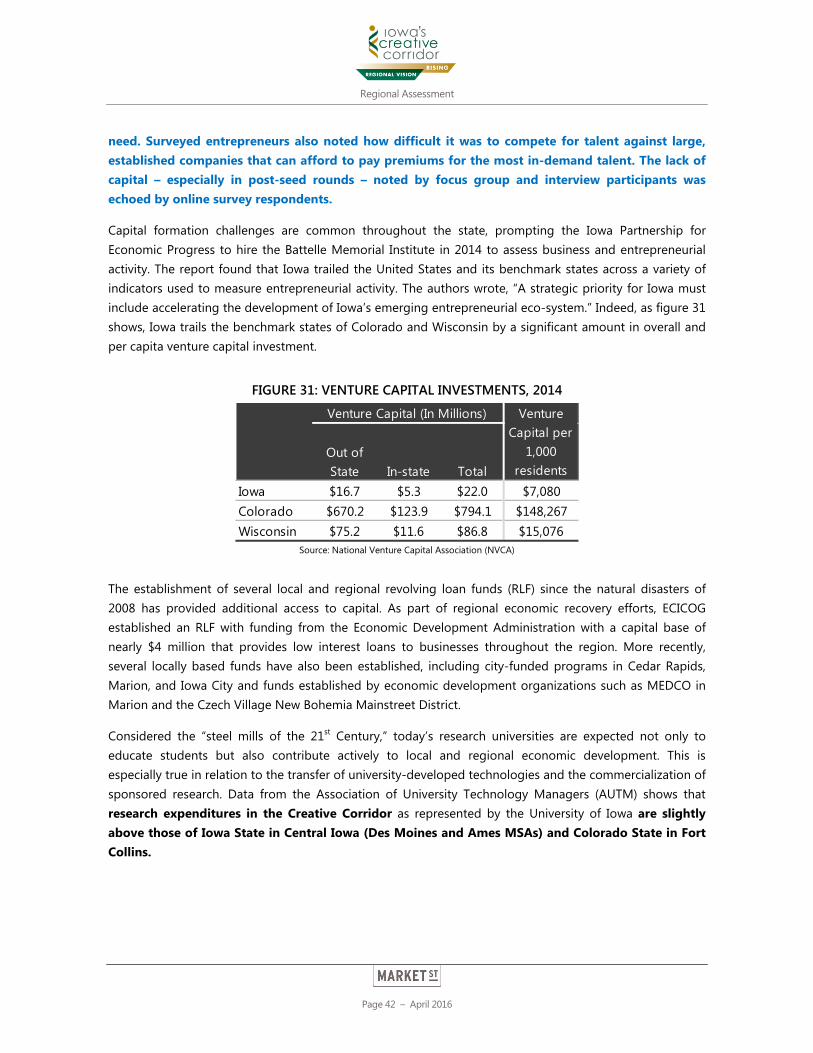
Regional Assessment
Page 42 – April 2016
need. Surveyed entrepreneurs also noted how difficult it was to compete for talent against large, established companies that can afford to pay premiums for the most in-demand talent. The lack of capital – especially in post-seed rounds – noted by focus group and interview participants was echoed by online survey respondents.
Capital formation challenges are common throughout the state, prompting the Iowa Partnership for Economic Progress to hire the Battelle Memorial Institute in 2014 to assess business and entrepreneurial activity. The report found that Iowa trailed the United States and its benchmark states across a variety of indicators used to measure entrepreneurial activity. The authors wrote, “A strategic priority for Iowa must include accelerating the development of Iowa’s emerging entrepreneurial eco-system.” Indeed, as figure 31 shows, Iowa trails the benchmark states of Colorado and Wisconsin by a significant amount in overall and per capita venture capital investment.
FIGURE 31: VENTURE CAPITAL INVESTMENTS, 2014
Source: National Venture Capital Association (NVCA)
The establishment of several local and regional revolving loan funds (RLF) since the natural disasters of 2008 has provided additional access to capital. As part of regional economic recovery efforts, ECICOG established an RLF with funding from the Economic Development Administration with a capital base of nearly $4 million that provides low interest loans to businesses throughout the region. More recently, several locally based funds have also been established, including city-funded programs in Cedar Rapids, Marion, and Iowa City and funds established by economic development organizations such as MEDCO in Marion and the Czech Village New Bohemia Mainstreet District.
Considered the “steel mills of the 21st Century,” today’s research universities are expected not only to educate students but also contribute actively to local and regional economic development. This is especially true in relation to the transfer of university-developed technologies and the commercialization of sponsored research. Data from the Association of University Technology Managers (AUTM) shows that research expenditures in the Creative Corridor as represented by the University of Iowa are slightly above those of Iowa State in Central Iowa (Des Moines and Ames MSAs) and Colorado State in Fort Collins.
Out of State In-state Total
Iowa $16.7 $5.3 $22.0 $7,080Colorado $670.2 $123.9 $794.1 $148,267Wisconsin $75.2 $11.6 $86.8 $15,076
Venture Capital (In Millions) Venture Capital per
1,000 residents
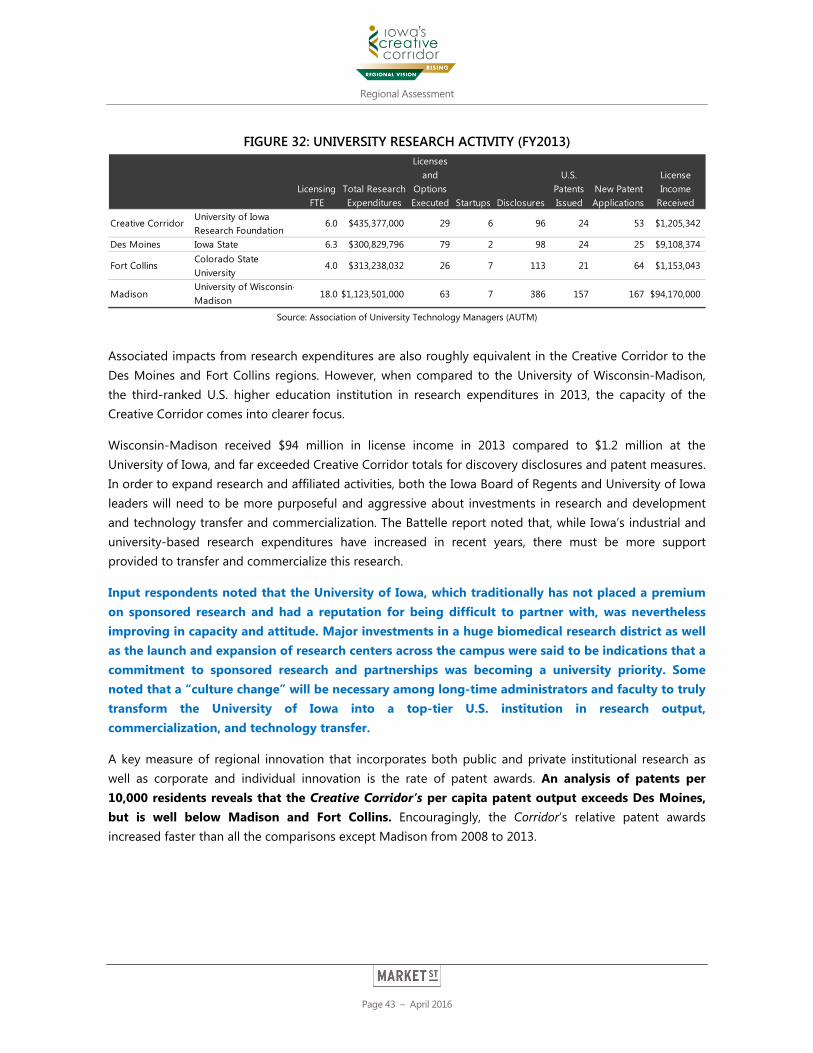
Regional Assessment
Page 43 – April 2016
FIGURE 32: UNIVERSITY RESEARCH ACTIVITY (FY2013)
Source: Association of University Technology Managers (AUTM)
Associated impacts from research expenditures are also roughly equivalent in the Creative Corridor to the Des Moines and Fort Collins regions. However, when compared to the University of Wisconsin-Madison, the third-ranked U.S. higher education institution in research expenditures in 2013, the capacity of the Creative Corridor comes into clearer focus.
Wisconsin-Madison received $94 million in license income in 2013 compared to $1.2 million at the University of Iowa, and far exceeded Creative Corridor totals for discovery disclosures and patent measures. In order to expand research and affiliated activities, both the Iowa Board of Regents and University of Iowa leaders will need to be more purposeful and aggressive about investments in research and development and technology transfer and commercialization. The Battelle report noted that, while Iowa’s industrial and university-based research expenditures have increased in recent years, there must be more support provided to transfer and commercialize this research.
Input respondents noted that the University of Iowa, which traditionally has not placed a premium on sponsored research and had a reputation for being difficult to partner with, was nevertheless improving in capacity and attitude. Major investments in a huge biomedical research district as well as the launch and expansion of research centers across the campus were said to be indications that a commitment to sponsored research and partnerships was becoming a university priority. Some noted that a “culture change” will be necessary among long-time administrators and faculty to truly transform the University of Iowa into a top-tier U.S. institution in research output, commercialization, and technology transfer.
A key measure of regional innovation that incorporates both public and private institutional research as well as corporate and individual innovation is the rate of patent awards. An analysis of patents per 10,000 residents reveals that the Creative Corridor’s per capita patent output exceeds Des Moines, but is well below Madison and Fort Collins. Encouragingly, the Corridor’s relative patent awards increased faster than all the comparisons except Madison from 2008 to 2013.
Licensing FTE
Total Research Expenditures
Licenses and
Options Executed Startups Disclosures
U.S. Patents Issued
New Patent Applications
License Income
Received
Creative CorridorUniversity of Iowa Research Foundation
6.0 $435,377,000 29 6 96 24 53 $1,205,342
Des Moines Iowa State 6.3 $300,829,796 79 2 98 24 25 $9,108,374
Fort CollinsColorado State University
4.0 $313,238,032 26 7 113 21 64 $1,153,043
MadisonUniversity of Wisconsin-Madison
18.0 $1,123,501,000 63 7 386 157 167 $94,170,000
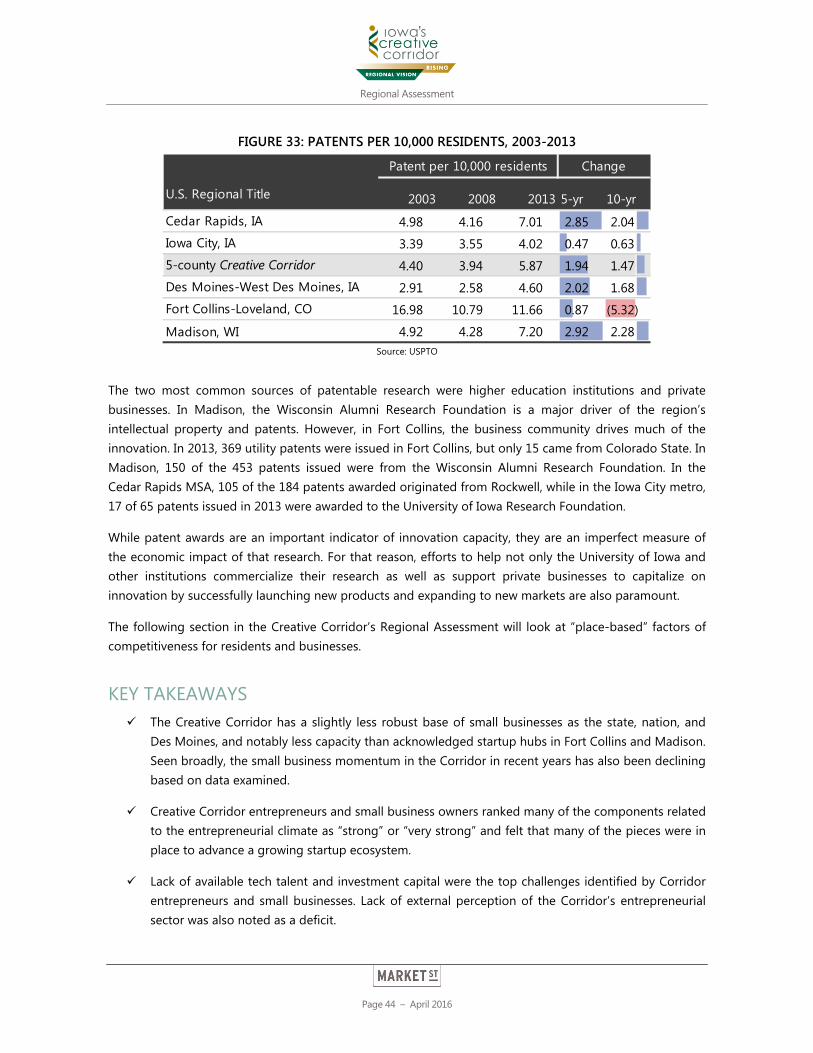
Regional Assessment
Page 44 – April 2016
FIGURE 33: PATENTS PER 10,000 RESIDENTS, 2003-2013
Source: USPTO
The two most common sources of patentable research were higher education institutions and private businesses. In Madison, the Wisconsin Alumni Research Foundation is a major driver of the region’s intellectual property and patents. However, in Fort Collins, the business community drives much of the innovation. In 2013, 369 utility patents were issued in Fort Collins, but only 15 came from Colorado State. In Madison, 150 of the 453 patents issued were from the Wisconsin Alumni Research Foundation. In the Cedar Rapids MSA, 105 of the 184 patents awarded originated from Rockwell, while in the Iowa City metro, 17 of 65 patents issued in 2013 were awarded to the University of Iowa Research Foundation.
While patent awards are an important indicator of innovation capacity, they are an imperfect measure of the economic impact of that research. For that reason, efforts to help not only the University of Iowa and other institutions commercialize their research as well as support private businesses to capitalize on innovation by successfully launching new products and expanding to new markets are also paramount.
The following section in the Creative Corridor’s Regional Assessment will look at “place-based” factors of competitiveness for residents and businesses.
KEY TAKEAWAYS The Creative Corridor has a slightly less robust base of small businesses as the state, nation, and
Des Moines, and notably less capacity than acknowledged startup hubs in Fort Collins and Madison. Seen broadly, the small business momentum in the Corridor in recent years has also been declining based on data examined.
Creative Corridor entrepreneurs and small business owners ranked many of the components related to the entrepreneurial climate as “strong” or “very strong” and felt that many of the pieces were in place to advance a growing startup ecosystem.
Lack of available tech talent and investment capital were the top challenges identified by Corridor entrepreneurs and small businesses. Lack of external perception of the Corridor’s entrepreneurial sector was also noted as a deficit.
U.S. Regional Title 2003 2008 2013 5-yr 10-yr
Cedar Rapids, IA 4.98 4.16 7.01 2.85 2.04Iowa City, IA 3.39 3.55 4.02 0.47 0.635-county Creative Corridor 4.40 3.94 5.87 1.94 1.47Des Moines-West Des Moines, IA 2.91 2.58 4.60 2.02 1.68Fort Collins-Loveland, CO 16.98 10.79 11.66 0.87 (5.32)
Madison, WI 4.92 4.28 7.20 2.92 2.28
Patent per 10,000 residents Change

Regional Assessment
Page 45 – April 2016
The Creative Corridor’s per capita patent output exceeds Des Moines, but is well below Madison and Fort Collins. The rate of patent awards in the Corridor increased faster than nearly all the comparison areas.
Regional Assessment
Page 46 – April 2016
A Nice Place to Live but Not Without Challenges With the competition for talent more intense than ever and the trend of young professionals choosing a place to live before finding a job, community and economic development professionals have no choice but to consider quality of life and quality of place factors when assessing their own communities. An employment opportunity and job offer is no longer enough to attract workers; today’s talent is demanding more from the communities they call home. Trends show that the presence of walkable neighborhoods, cultural activities, entertainment options, as well as old standbys such as good schools and safe streets are high on the lists of not only talent but also businesses looking for places to call home. Above all, the cultivation of community assets, amenities, and resources should provide a wide range of choices for individuals whatever their stage of life, race and ethnicity, personal or political preferences, or religions.
A key demographic to take into account when thinking about quality of life and place is the young professional cohort. As discussed in this report’s section on talent, YPs represent the future and will largely determine the long-term sustainability of regional businesses across multiple sectors. Without sufficient capacity of next-generation talent, employers will go elsewhere. Certainly, the University of Iowa is a major asset for the attraction of YPs in that thousands of students come to the Creative Corridor every year to enter the university. Doing everything possible to ensure that university graduates have options to stay if desired has been and should be a priority strategic concern for the Corridor.
Young professional participants in focus groups and interviews were especially complimentary of efforts in recent years to make the downtowns of Cedar Rapids and Iowa City more dense, urban, and pedestrian and bike-friendly. Respondents spoke especially highly about the growth in the NewBo and Czech Village areas of Cedar Rapids. The subject of affordable housing came up often during conversations with young professionals. They reported that the issue is not just simply being able to afford a home, but more about being able to afford a quality home in the type of environment they prefer – for example, downtown Iowa City.
These preferences can also be seen in the word cloud created from the top responses of young professional online survey respondents as seen in figure 34.
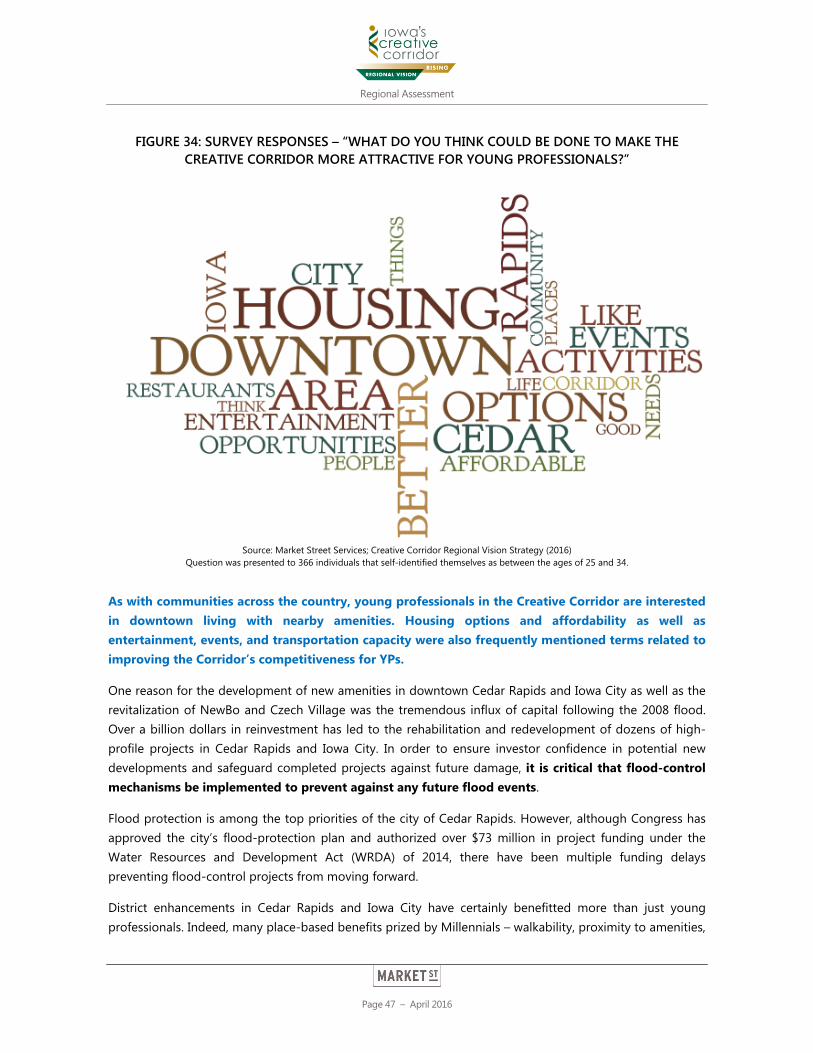
Regional Assessment
Page 47 – April 2016
FIGURE 34: SURVEY RESPONSES – “WHAT DO YOU THINK COULD BE DONE TO MAKE THE CREATIVE CORRIDOR MORE ATTRACTIVE FOR YOUNG PROFESSIONALS?”
Source: Market Street Services; Creative Corridor Regional Vision Strategy (2016)
Question was presented to 366 individuals that self-identified themselves as between the ages of 25 and 34.
As with communities across the country, young professionals in the Creative Corridor are interested in downtown living with nearby amenities. Housing options and affordability as well as entertainment, events, and transportation capacity were also frequently mentioned terms related to improving the Corridor’s competitiveness for YPs.
One reason for the development of new amenities in downtown Cedar Rapids and Iowa City as well as the revitalization of NewBo and Czech Village was the tremendous influx of capital following the 2008 flood. Over a billion dollars in reinvestment has led to the rehabilitation and redevelopment of dozens of high-profile projects in Cedar Rapids and Iowa City. In order to ensure investor confidence in potential new developments and safeguard completed projects against future damage, it is critical that flood-control mechanisms be implemented to prevent against any future flood events.
Flood protection is among the top priorities of the city of Cedar Rapids. However, although Congress has approved the city’s flood-protection plan and authorized over $73 million in project funding under the Water Resources and Development Act (WRDA) of 2014, there have been multiple funding delays preventing flood-control projects from moving forward.
District enhancements in Cedar Rapids and Iowa City have certainly benefitted more than just young professionals. Indeed, many place-based benefits prized by Millennials – walkability, proximity to amenities,
Regional Assessment
Page 48 – April 2016
diverse entertainment options – are also valued by adults at all ages. Similarly, factors like good schools and safe streets are also important criteria for Millennials looking for places to live and work.
Overall, online survey respondents expressed strong satisfaction with the Creative Corridor and feel confident they will remain in the region. However, participants were less sure that children, once grown, will choose to live in the Corridor. While 77 percent of respondents reported that it was “very likely” that they will continue to live in the region, only 22.5 percent though it was “very” likely” that their children (once grown) will want to live in the Creative Corridor.
Breaking down quality of life and place into their component parts, the chart in figure 35 lists the most important criteria that typically contribute to a community’s competitiveness in these categories. Many important factors such as quality health care, public safety, cost of living, and arts and culture finished strongly. However, diversity of housing, shopping and nightlife, and, quite clearly, mobility options that do not include a car were identified as key concerns.
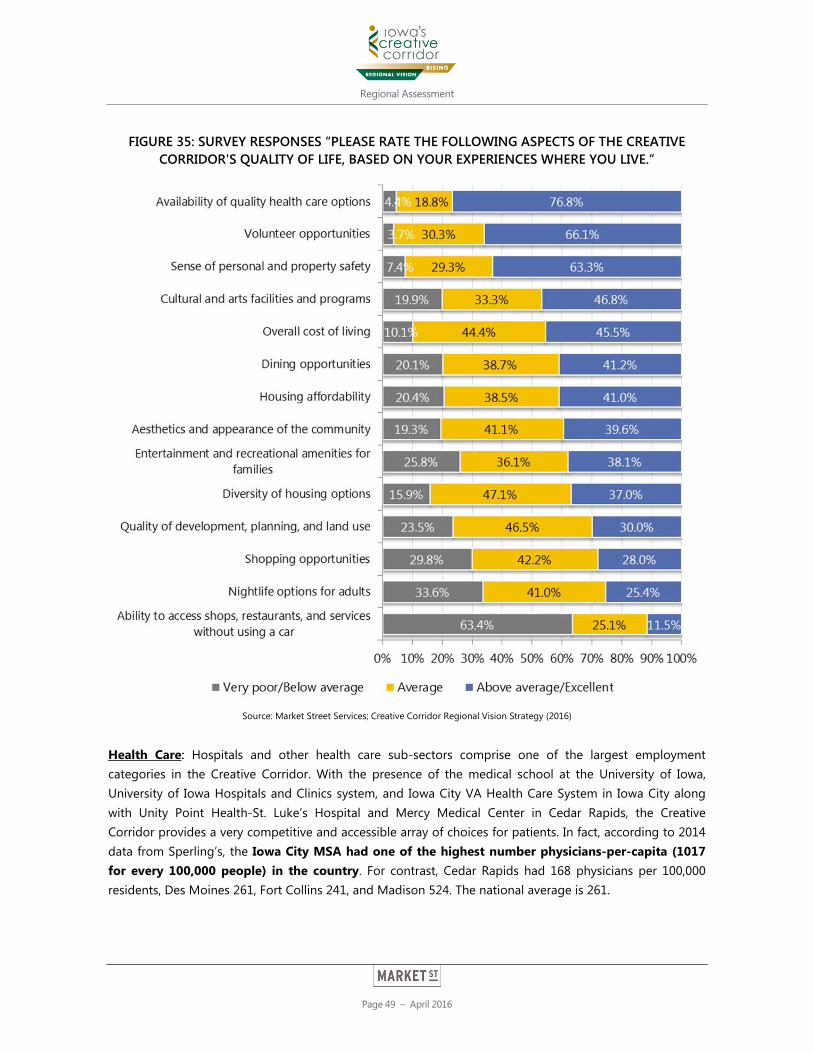
Regional Assessment
Page 49 – April 2016
FIGURE 35: SURVEY RESPONSES “PLEASE RATE THE FOLLOWING ASPECTS OF THE CREATIVE CORRIDOR'S QUALITY OF LIFE, BASED ON YOUR EXPERIENCES WHERE YOU LIVE.”
Source: Market Street Services; Creative Corridor Regional Vision Strategy (2016)
Health Care: Hospitals and other health care sub-sectors comprise one of the largest employment categories in the Creative Corridor. With the presence of the medical school at the University of Iowa, University of Iowa Hospitals and Clinics system, and Iowa City VA Health Care System in Iowa City along with Unity Point Health-St. Luke’s Hospital and Mercy Medical Center in Cedar Rapids, the Creative Corridor provides a very competitive and accessible array of choices for patients. In fact, according to 2014 data from Sperling’s, the Iowa City MSA had one of the highest number physicians-per-capita (1017 for every 100,000 people) in the country. For contrast, Cedar Rapids had 168 physicians per 100,000 residents, Des Moines 261, Fort Collins 241, and Madison 524. The national average is 261.
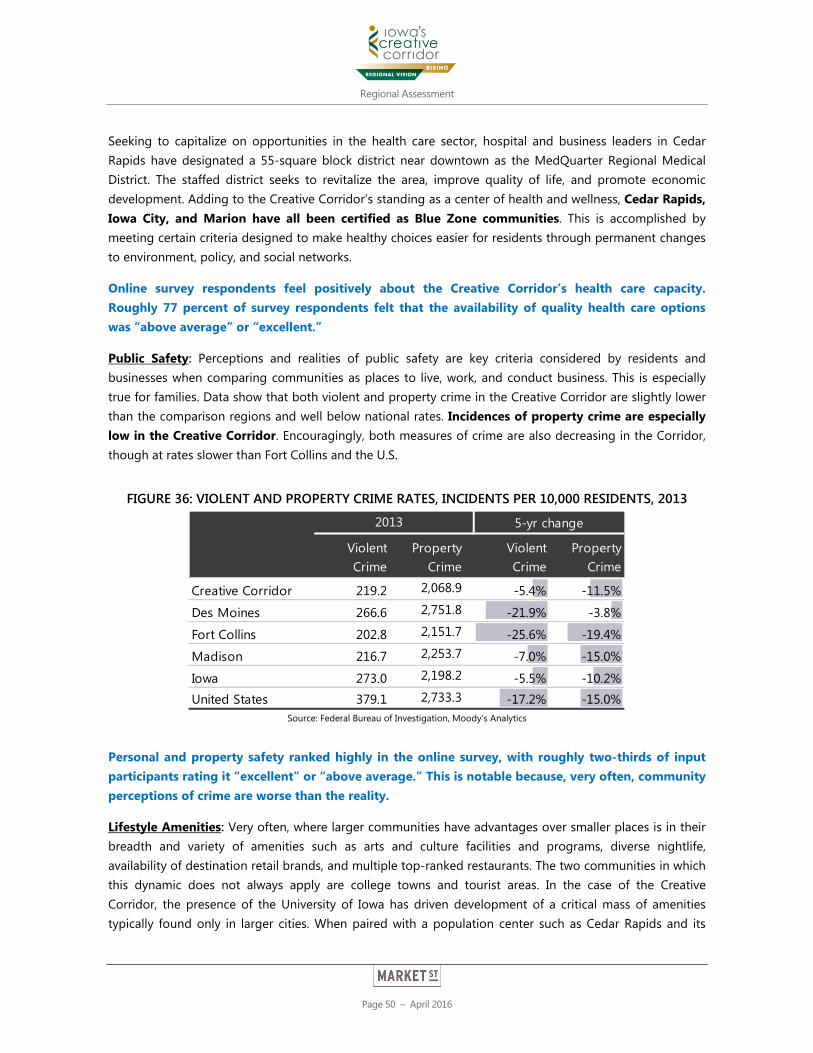
Regional Assessment
Page 50 – April 2016
Seeking to capitalize on opportunities in the health care sector, hospital and business leaders in Cedar Rapids have designated a 55-square block district near downtown as the MedQuarter Regional Medical District. The staffed district seeks to revitalize the area, improve quality of life, and promote economic development. Adding to the Creative Corridor’s standing as a center of health and wellness, Cedar Rapids, Iowa City, and Marion have all been certified as Blue Zone communities. This is accomplished by meeting certain criteria designed to make healthy choices easier for residents through permanent changes to environment, policy, and social networks.
Online survey respondents feel positively about the Creative Corridor’s health care capacity. Roughly 77 percent of survey respondents felt that the availability of quality health care options was “above average” or “excellent.”
Public Safety: Perceptions and realities of public safety are key criteria considered by residents and businesses when comparing communities as places to live, work, and conduct business. This is especially true for families. Data show that both violent and property crime in the Creative Corridor are slightly lower than the comparison regions and well below national rates. Incidences of property crime are especially low in the Creative Corridor. Encouragingly, both measures of crime are also decreasing in the Corridor, though at rates slower than Fort Collins and the U.S.
FIGURE 36: VIOLENT AND PROPERTY CRIME RATES, INCIDENTS PER 10,000 RESIDENTS, 2013
Source: Federal Bureau of Investigation, Moody’s Analytics
Personal and property safety ranked highly in the online survey, with roughly two-thirds of input participants rating it “excellent” or “above average.” This is notable because, very often, community perceptions of crime are worse than the reality.
Lifestyle Amenities: Very often, where larger communities have advantages over smaller places is in their breadth and variety of amenities such as arts and culture facilities and programs, diverse nightlife, availability of destination retail brands, and multiple top-ranked restaurants. The two communities in which this dynamic does not always apply are college towns and tourist areas. In the case of the Creative Corridor, the presence of the University of Iowa has driven development of a critical mass of amenities typically found only in larger cities. When paired with a population center such as Cedar Rapids and its
Violent Crime
Property Crime
Violent Crime
Property Crime
Creative Corridor 219.2 2,068.9 -5.4% -11.5%
Des Moines 266.6 2,751.8 -21.9% -3.8%
Fort Collins 202.8 2,151.7 -25.6% -19.4%
Madison 216.7 2,253.7 -7.0% -15.0%
Iowa 273.0 2,198.2 -5.5% -10.2%United States 379.1 2,733.3 -17.2% -15.0%
2013 5-yr change
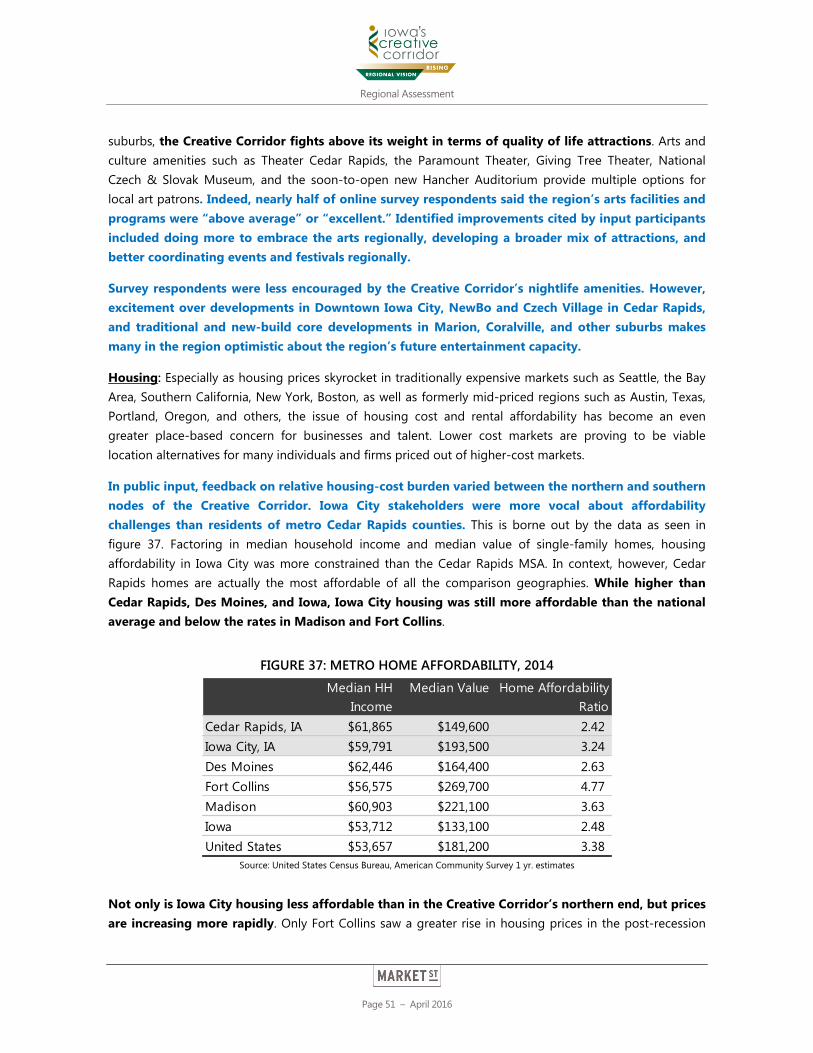
Regional Assessment
Page 51 – April 2016
suburbs, the Creative Corridor fights above its weight in terms of quality of life attractions. Arts and culture amenities such as Theater Cedar Rapids, the Paramount Theater, Giving Tree Theater, National Czech & Slovak Museum, and the soon-to-open new Hancher Auditorium provide multiple options for local art patrons. Indeed, nearly half of online survey respondents said the region’s arts facilities and programs were “above average” or “excellent.” Identified improvements cited by input participants included doing more to embrace the arts regionally, developing a broader mix of attractions, and better coordinating events and festivals regionally.
Survey respondents were less encouraged by the Creative Corridor’s nightlife amenities. However, excitement over developments in Downtown Iowa City, NewBo and Czech Village in Cedar Rapids, and traditional and new-build core developments in Marion, Coralville, and other suburbs makes many in the region optimistic about the region’s future entertainment capacity.
Housing: Especially as housing prices skyrocket in traditionally expensive markets such as Seattle, the Bay Area, Southern California, New York, Boston, as well as formerly mid-priced regions such as Austin, Texas, Portland, Oregon, and others, the issue of housing cost and rental affordability has become an even greater place-based concern for businesses and talent. Lower cost markets are proving to be viable location alternatives for many individuals and firms priced out of higher-cost markets.
In public input, feedback on relative housing-cost burden varied between the northern and southern nodes of the Creative Corridor. Iowa City stakeholders were more vocal about affordability challenges than residents of metro Cedar Rapids counties. This is borne out by the data as seen in figure 37. Factoring in median household income and median value of single-family homes, housing affordability in Iowa City was more constrained than the Cedar Rapids MSA. In context, however, Cedar Rapids homes are actually the most affordable of all the comparison geographies. While higher than Cedar Rapids, Des Moines, and Iowa, Iowa City housing was still more affordable than the national average and below the rates in Madison and Fort Collins.
FIGURE 37: METRO HOME AFFORDABILITY, 2014
Source: United States Census Bureau, American Community Survey 1 yr. estimates
Not only is Iowa City housing less affordable than in the Creative Corridor’s northern end, but prices are increasing more rapidly. Only Fort Collins saw a greater rise in housing prices in the post-recession
Median HH Income
Median Value Home Affordability Ratio
Cedar Rapids, IA $61,865 $149,600 2.42 Iowa City, IA $59,791 $193,500 3.24 Des Moines $62,446 $164,400 2.63 Fort Collins $56,575 $269,700 4.77 Madison $60,903 $221,100 3.63 Iowa $53,712 $133,100 2.48 United States $53,657 $181,200 3.38
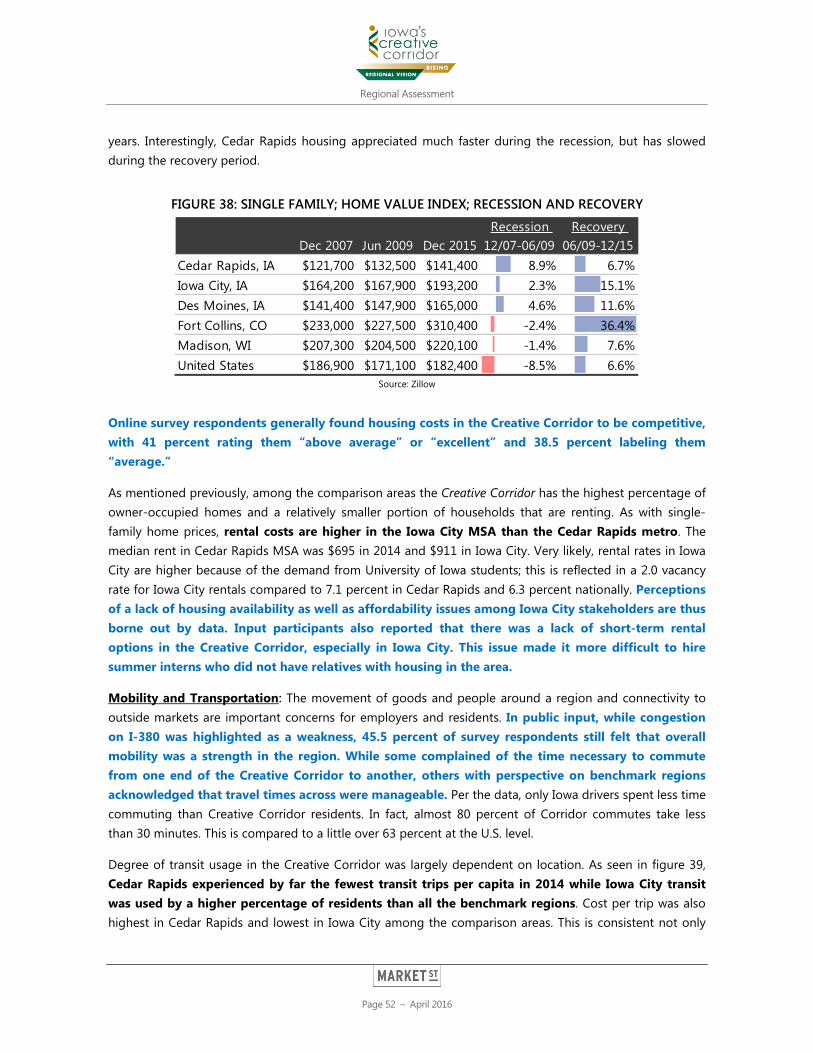
Regional Assessment
Page 52 – April 2016
years. Interestingly, Cedar Rapids housing appreciated much faster during the recession, but has slowed during the recovery period.
FIGURE 38: SINGLE FAMILY; HOME VALUE INDEX; RECESSION AND RECOVERY
Source: Zillow
Online survey respondents generally found housing costs in the Creative Corridor to be competitive, with 41 percent rating them “above average” or “excellent” and 38.5 percent labeling them “average.”
As mentioned previously, among the comparison areas the Creative Corridor has the highest percentage of owner-occupied homes and a relatively smaller portion of households that are renting. As with single-family home prices, rental costs are higher in the Iowa City MSA than the Cedar Rapids metro. The median rent in Cedar Rapids MSA was $695 in 2014 and $911 in Iowa City. Very likely, rental rates in Iowa City are higher because of the demand from University of Iowa students; this is reflected in a 2.0 vacancy rate for Iowa City rentals compared to 7.1 percent in Cedar Rapids and 6.3 percent nationally. Perceptions of a lack of housing availability as well as affordability issues among Iowa City stakeholders are thus borne out by data. Input participants also reported that there was a lack of short-term rental options in the Creative Corridor, especially in Iowa City. This issue made it more difficult to hire summer interns who did not have relatives with housing in the area.
Mobility and Transportation: The movement of goods and people around a region and connectivity to outside markets are important concerns for employers and residents. In public input, while congestion on I-380 was highlighted as a weakness, 45.5 percent of survey respondents still felt that overall mobility was a strength in the region. While some complained of the time necessary to commute from one end of the Creative Corridor to another, others with perspective on benchmark regions acknowledged that travel times across were manageable. Per the data, only Iowa drivers spent less time commuting than Creative Corridor residents. In fact, almost 80 percent of Corridor commutes take less than 30 minutes. This is compared to a little over 63 percent at the U.S. level.
Degree of transit usage in the Creative Corridor was largely dependent on location. As seen in figure 39, Cedar Rapids experienced by far the fewest transit trips per capita in 2014 while Iowa City transit was used by a higher percentage of residents than all the benchmark regions. Cost per trip was also highest in Cedar Rapids and lowest in Iowa City among the comparison areas. This is consistent not only
Dec 2007 Jun 2009 Dec 2015Recession
12/07-06/09Recovery
06/09-12/15Cedar Rapids, IA $121,700 $132,500 $141,400 8.9% 6.7%Iowa City, IA $164,200 $167,900 $193,200 2.3% 15.1%Des Moines, IA $141,400 $147,900 $165,000 4.6% 11.6%Fort Collins, CO $233,000 $227,500 $310,400 -2.4% 36.4%Madison, WI $207,300 $204,500 $220,100 -1.4% 7.6%United States $186,900 $171,100 $182,400 -8.5% 6.6%
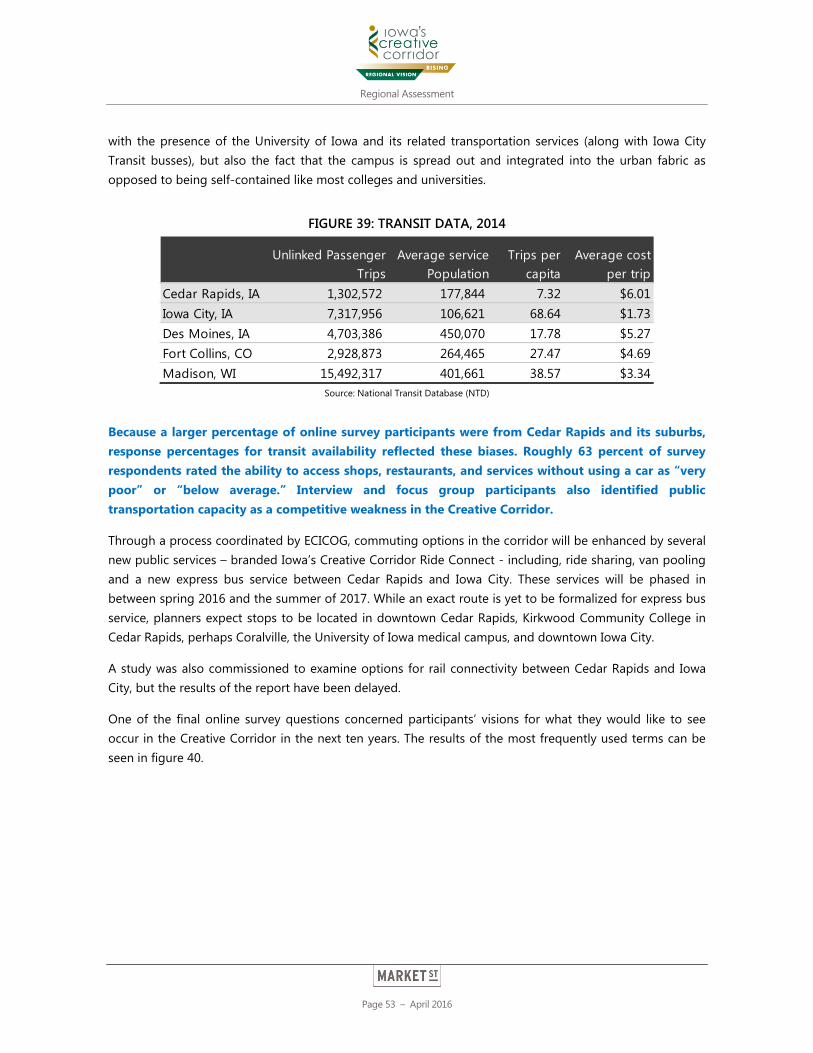
Regional Assessment
Page 53 – April 2016
with the presence of the University of Iowa and its related transportation services (along with Iowa City Transit busses), but also the fact that the campus is spread out and integrated into the urban fabric as opposed to being self-contained like most colleges and universities.
FIGURE 39: TRANSIT DATA, 2014
Source: National Transit Database (NTD)
Because a larger percentage of online survey participants were from Cedar Rapids and its suburbs, response percentages for transit availability reflected these biases. Roughly 63 percent of survey respondents rated the ability to access shops, restaurants, and services without using a car as “very poor” or “below average.” Interview and focus group participants also identified public transportation capacity as a competitive weakness in the Creative Corridor.
Through a process coordinated by ECICOG, commuting options in the corridor will be enhanced by several new public services – branded Iowa’s Creative Corridor Ride Connect - including, ride sharing, van pooling and a new express bus service between Cedar Rapids and Iowa City. These services will be phased in between spring 2016 and the summer of 2017. While an exact route is yet to be formalized for express bus service, planners expect stops to be located in downtown Cedar Rapids, Kirkwood Community College in Cedar Rapids, perhaps Coralville, the University of Iowa medical campus, and downtown Iowa City.
A study was also commissioned to examine options for rail connectivity between Cedar Rapids and Iowa City, but the results of the report have been delayed.
One of the final online survey questions concerned participants’ visions for what they would like to see occur in the Creative Corridor in the next ten years. The results of the most frequently used terms can be seen in figure 40.
Unlinked Passenger Trips
Average service Population
Trips per capita
Average cost per trip
Cedar Rapids, IA 1,302,572 177,844 7.32 $6.01Iowa City, IA 7,317,956 106,621 68.64 $1.73Des Moines, IA 4,703,386 450,070 17.78 $5.27Fort Collins, CO 2,928,873 264,465 27.47 $4.69Madison, WI 15,492,317 401,661 38.57 $3.34
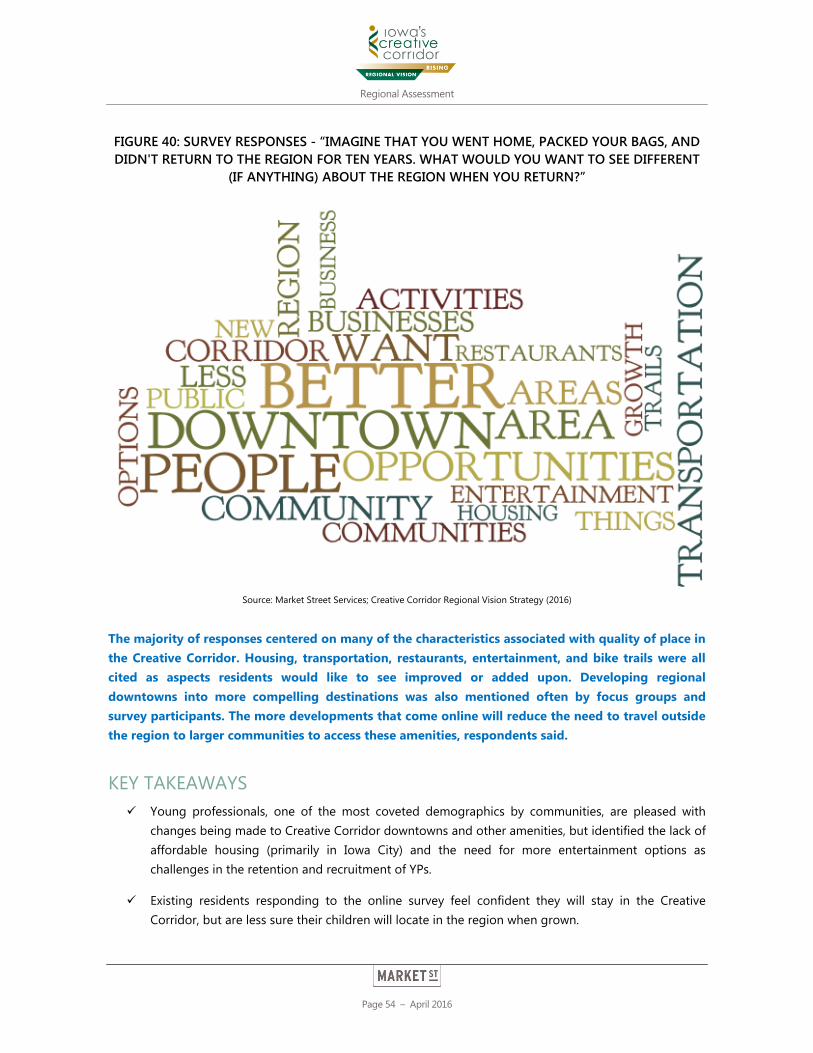
Regional Assessment
Page 54 – April 2016
FIGURE 40: SURVEY RESPONSES - “IMAGINE THAT YOU WENT HOME, PACKED YOUR BAGS, AND DIDN'T RETURN TO THE REGION FOR TEN YEARS. WHAT WOULD YOU WANT TO SEE DIFFERENT
(IF ANYTHING) ABOUT THE REGION WHEN YOU RETURN?”
Source: Market Street Services; Creative Corridor Regional Vision Strategy (2016)
The majority of responses centered on many of the characteristics associated with quality of place in the Creative Corridor. Housing, transportation, restaurants, entertainment, and bike trails were all cited as aspects residents would like to see improved or added upon. Developing regional downtowns into more compelling destinations was also mentioned often by focus groups and survey participants. The more developments that come online will reduce the need to travel outside the region to larger communities to access these amenities, respondents said.
KEY TAKEAWAYS Young professionals, one of the most coveted demographics by communities, are pleased with
changes being made to Creative Corridor downtowns and other amenities, but identified the lack of affordable housing (primarily in Iowa City) and the need for more entertainment options as challenges in the retention and recruitment of YPs.
Existing residents responding to the online survey feel confident they will stay in the Creative Corridor, but are less sure their children will locate in the region when grown.
Regional Assessment
Page 55 – April 2016
Quality health care, public safety, low cost of living, and arts and culture capacity were all identified as quality of life strengths in the Creative Corridor.
Challenges were said to be a lack of housing diversity, insufficient comparative shopping and nightlife amenities, and few viable mobility options besides driving.
Regional Assessment
Page 56 – April 2016
Necessary but Elusive Regionalism The federal government recognized the connectivity between the Cedar Rapids and Iowa City metros when it designated the two-region geography a Combined Statistical Area (CSA) based on data from the 2010 Census. What this means is that commuting, residency, and employment patterns were defined enough to demonstrate that the Creative Corridor was an integrated economy and labor shed. While the notion of regional cohesion is understood objectively by most in the Creative Corridor, subjectively many still feel the divides between the Corridor’s northern and southern nodes present obstacles to building a more unified, collaborative, coordinated and complementary relationship between Cedar Rapids and Iowa City.
Some of the variations between the Cedar Rapids and Iowa City MSAs are quantifiable and understandably lead to the conclusion that Creative Corridor populations have real differences. In addition to the data already referenced in this report related to variations in health care capacity, transit usage, housing costs, public school performance, and other factors, additional differences emerge when trends are compared for the MSAs and their component counties. For example, five-year population growth rates in Johnson County (8.7 percent) are more than double those in Linn County (4.2 percent). Different rates of growth lead to different perceptions of the value of growth and its impact on the community. For example, some input participants were dismayed at the historical and recently renewed “slow-growth” philosophy of the Iowa City Council which they believe drives residential investment to suburban counties and exacerbates the city’s lack of affordable young professional and market-rate housing. Respondents with experience trying to obtain development permits in Iowa City also noted their difficulty in securing these approvals in a timely manner.
Quantitative differences are especially stark between Johnson and Linn counties in relation to educational attainment. In 2014, 51.7 percent of Johnson County adults had a bachelor’s degree or above compared to 30.7 percent in Linn County. Nearly one in four Johnson County adults has earned a Master’s or PhD. Data show that poverty is also higher in Linn County, a fact that leads to more acute health issues than in Johnson. Most recent health rankings show that 7.6 percent of Johnson County residents are considered to be in poor health compared to 11.1 percent in Linn County.
The economies of the two nodes are also different, with Iowa City leveraging a base in education and health care while Cedar Rapids relies more on financial services and production employment. Economic variations affect perceptions of the two communities, with Cedar Rapids seen as more “blue collar” than communities to the south.
Without a doubt, the presence of the University of Iowa in Iowa City influences many of these trends and perceptions. While this reality will not be changing, many in the Creative Corridor see the lines blurring between the influence of the university over its home community and those outside of Iowa City. In fact, some input participants feel that a stronger leadership position from the university on the benefits of regionalism could help bring the two principal communities together. Entities such as Kirkwood Community College are also expanding across the breadth of the Corridor and can truly be considered regional in scope and impact. The Grant Wood Area Education Agency and the local IowaWORKS agency also encompass the Iowa City and Cedar Rapids metros. Complicating matters,
Regional Assessment
Page 57 – April 2016
however, is the fact that entities like this with a footprint spanning the two metros are rare. The Creative Corridor features two MSAs, two metropolitan planning organizations, two United Ways, two principal transit systems, two community foundations; the list can go on.
The issue of regional differences was one of the most common themes to emerge during Regional Vision public input. Many respondents commented on the core challenges of regionalism in the Creative Corridor. Feedback included:
“Iowa City and Cedar Rapids just have different philosophies on things.”
“When you talk about the Creative Corridor, there are differences in opinions and beliefs, even when it comes to the economy and population.”
“Post-flood has not seen the same sense of regionalism. We’ve had to focus on our own issues.
“We’re in silos. No one has looked at the bigger picture.”
“We don’t lack the infrastructure to come together, but need to work on the relationships to build community and networks.”
“The cultures of the two towns are just very different.”
“You have the issue of two extremely different counties that just have different challenges.”
“Folks down here (Iowa City) are still a little trepidacious about talk of working with the north end.”
“We’re not thinking of running up and down the Corridor as something I do.”
Perspectives on regionalism in the Creative Corridor were said by some to be influenced by constituency groups. For example, a young professional said that his generation does not see the region as two separate places. “We just kind of treat it as one chunk.” Interestingly, a mid-career professional echoed that sentiment, noting, “Twenty miles is less of a chasm, especially as I get older.” For some, government has been slower to acknowledge and appreciate regionalism than the business community. Indeed, one government official noted, “There isn’t much of a relationship as opposed to there being a bad relationship.” While informal relationships exist between government representatives in the Iowa City and Cedar Rapids communities, no formal groups or councils are charged with bringing leaders together.
This notion of lack of “common ground” or “neutral territory” was also raised by many input participants. Others noted that what the Corridor needs are opportunities for “shared experiences” that compel constituents to come together in new and productive ways. Trust- and relationship-building were said to be important to ensuring that new connections are made and regionalism becomes more viable in the Corridor. Creating a sense of urgency for regional collaboration as well as defensibly articulating the benefits of these partnerships were also noted as critical to achieving success. One leader said about a regional brand, “We have to believe it before we can sell it.”
Regional Assessment
Page 58 – April 2016
While the challenges of improved regionalism in the Creative Corridor were mentioned often, many stakeholders also said that examples of regional cooperation and integration are becoming more frequent, with the perceived potential of these efforts becoming more pervasive. The prime example cited of these positive trends was the creation of the Creative Corridor brand itself and the recent formation of a joint venture between ICAD and the Cedar Rapids Alliance. Others said they were starting to see more cross-participation on boards and leadership groups. “Before, leadership didn’t even know each other. At least now they’ve been introduced.” Another noted, “If we acknowledged our regionality that would be huge because there are so many ways that we already operate as a region.”
A number of stakeholders in the region are proudly touting themselves as “Corridorians,” a person who lives in Cedar Rapids and works in Iowa City or vice versa. One leader noted, “The biggest thing each city has in common is that a significant workforce lives in the other city.” In fact, numerous opportunities for regional connections were identified, including the linking of bike trails, major highway projects like the I-380 expansion, Forever Green interchange or Tower Terrace construction, or the role that arts can play as a regional binder.
The variations between the north and south nodes of the Creative Corridor themselves were seen by many as an opportunity as opposed to a challenge. One leader noted, “Externally, it’s a strength that we have two anchor cities that complement each other.” Another said, “Each place has its own unique identity, and that’s okay. We offer choices – that’s a good thing.”
Online survey participants also weighed in on the issue of regionalism. Roughly 81 percent of survey participants reported that they were familiar with the Creative Corridor brand. Additionally, there was little variation among the tenor of input responses from the seven different counties of the region. Many survey participants felt that the Creative Corridor was already a cohesive region, although hundreds of others felt differently.
Many stakeholders from the business community felt that it made sense to market the community together rather than as two separate metros. Presenting the Creative Corridor as one region would raise its population profile to nearly half a million people, which would help catch the attention of site selectors, destination retailers, and potential residents.
As the Creative Corridor process moves forward, opportunities to address the barriers impeding improved regionalism as well as strategies to more effectively bind the Corridor’s northern and southern communities will be proposed, discussed, and confirmed.
KEY TAKEAWAYS Despite being a Combined Statistical Area, a lack of perceived regionalism in the Creative Corridor
can be a problem.
Certain differences between Cedar Rapids and Iowa City are quantifiable, while others are based on perceived variations by stakeholders in both communities.

Regional Assessment
Page 59 – April 2016
o The presence of the University of Iowa in Iowa City certainly affects actual and perceived differences in the north and south ends of the Corridor.
Examples of intra-regional coordination are occurring more frequently, while many in the Creative Corridor feel that even the differences between Cedar Rapids and Iowa City are a positive because they provide residents and businesses with choices.
Regional Assessment
Page 60 – April 2016
CONCLUSION The assessment of a community’s competitive position always leads to identification of opportunities to be leveraged and challenges to be addressed. Before a Regional Vision for the Creative Corridor can be formalized and pursued via strategic implementation, it is necessary to frankly analyze, report, and discuss both its positives and negatives in order to determine the optimal path forward for the region.
Trends and current conditions in the Creative Corridor were presented in this report through the lens of six “stories” designed to leverage a narrative format to communicate competitive realities and issues. These stores were:
Strong but Uneven Population Growth and Change
A Quality but Constrained Workforce with Strong Resident Wellbeing
A Resilient, Diverse Local Economy and Competitive Business Climate
Strong Entrepreneurial Legacy with a Still-Evolving Startup Ecosystem
A Nice Place to Live but Not Without Challenges
Necessary but Elusive Regionalism
Key conclusions from these narratives paint the picture of a Creative Corridor moving forward successfully but facing challenges that threaten to dampen or derail that success. However, strong, diverse economic fundamentals, stable anchor employers, dynamic institutional assets, competitive demographic and quality of life factors, and the great, untapped potential of a unified regional presence bode well for a continued dynamism in the Creative Corridor for years to come.
As the phases of the Corridor’s strategic vision process continue, additional research into the region’s economic structure and targeted opportunities will be paired with the findings of the Regional Assessment to establish the framework and key recommendations of the draft Regional Vision Strategy. Upon confirmation of the Creative Corridor’s strategic blueprint, an Implementation Plan will be developed to ensure that the strategy is actionable and benefits from sustained, coordinated, collaborative, and effectively resourced implementation.