country presentations
DESCRIPTION
Country Presentations. Canada. Canada’s Pharmaceutical DNA. and. Key Challenges and. Opportunities. Canada’s Pharmaceutical DNA. Health system. – Population aged 65 and over predicted to reach 25% of total by 2050 – Total expenditure on health (TEH) much higher than OECD average. - PowerPoint PPT PresentationTRANSCRIPT
Country Presentations
Canada
Canada’s Pharmaceutical DNAand
Key Challenges andOpportunities
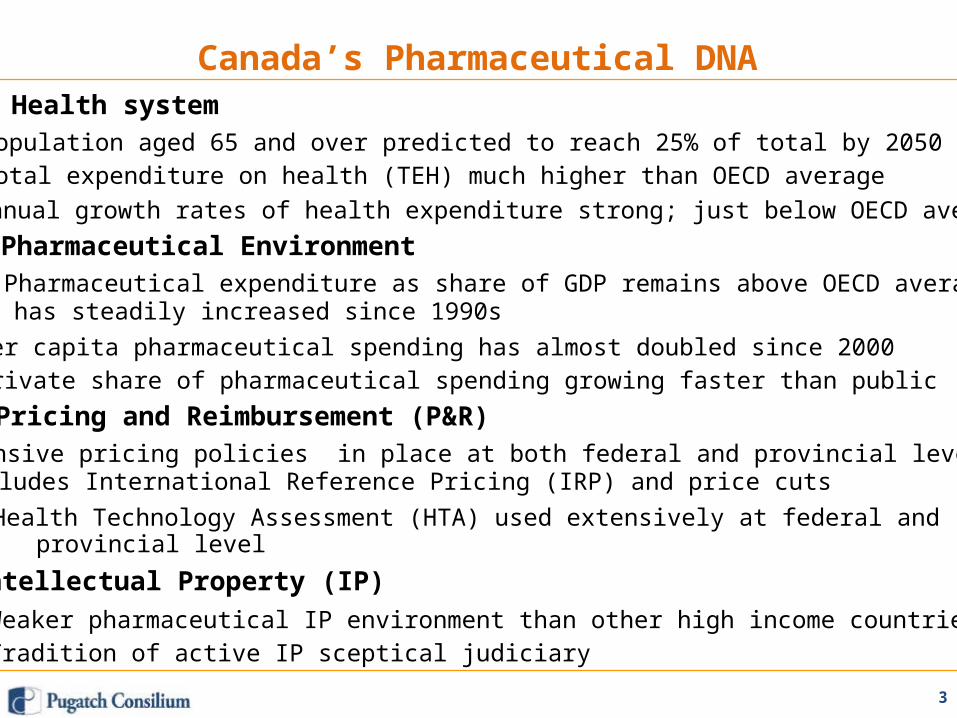
Canada’s Pharmaceutical DNAHealth system
– Population aged 65 and over predicted to reach 25% of total by 2050– Total expenditure on health (TEH) much higher than OECD average– Annual growth rates of health expenditure strong; just below OECD average
Pharmaceutical Environment– Pharmaceutical expenditure as share of GDP remains above OECD average:
has steadily increased since 1990s– Per capita pharmaceutical spending has almost doubled since 2000– Private share of pharmaceutical spending growing faster than public
Pricing and Reimbursement (P&R)– Extensive pricing policies in place at both federal and provincial level:includes International Reference Pricing (IRP) and price cuts– Health Technology Assessment (HTA) used extensively at federal and
provincial levelIntellectual Property (IP)
– Weaker pharmaceutical IP environment than other high income countries– Tradition of active IP sceptical judiciary
3
4
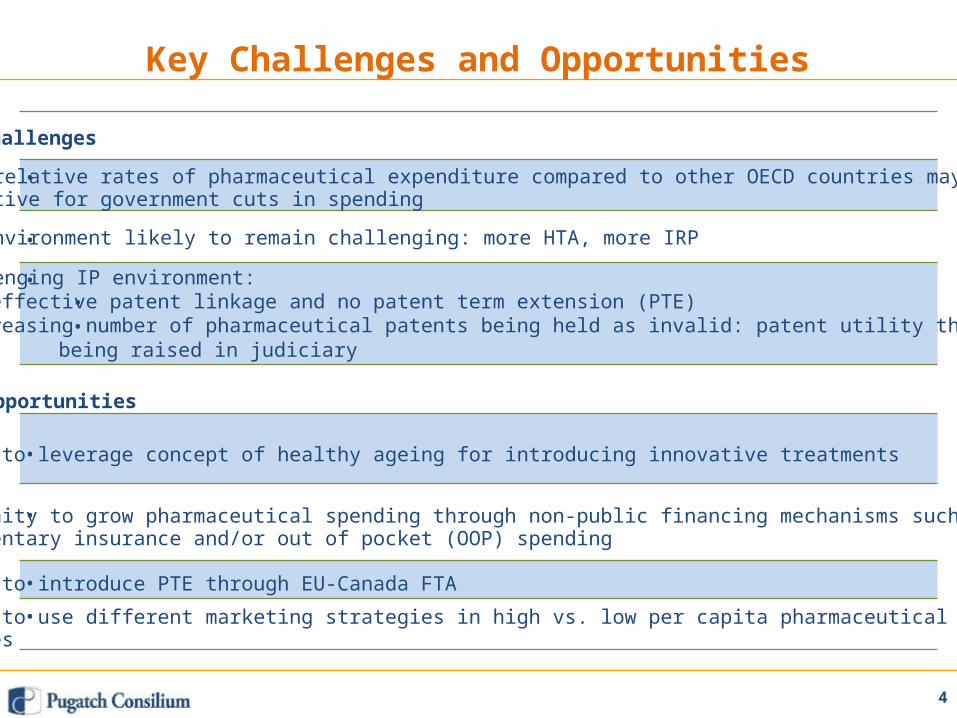
Key Challenges and Opportunities
Challenges
•
•
•
High relative rates of pharmaceutical expenditure compared to other OECD countries may provideincentive for government cuts in spending
P&R environment likely to remain challenging: more HTA, more IRP
Challenging IP environment:••
no effective patent linkage and no patent term extension (PTE)increasing number of pharmaceutical patents being held as invalid: patent utility threshold
being raised in judiciary
Opportunities
•
•
•
•
Ability to leverage concept of healthy ageing for introducing innovative treatments
Opportunity to grow pharmaceutical spending through non-public financing mechanisms such assupplementary insurance and/or out of pocket (OOP) spending
Ability to introduce PTE through EU-Canada FTA
Ability to use different marketing strategies in high vs. low per capita pharmaceutical spendingprovinces
Presentation Overview
5
Presentation Overview
• Demographic background
• Macro-economic background
• Health system overview
• Pharmaceutical overview
• Pricing and reimbursement policies
• Intellectual property environment
• Biopharmaceutical regulatory requirements
• Public procurement policies – pharmaceuticals
6

Demographic Background
7
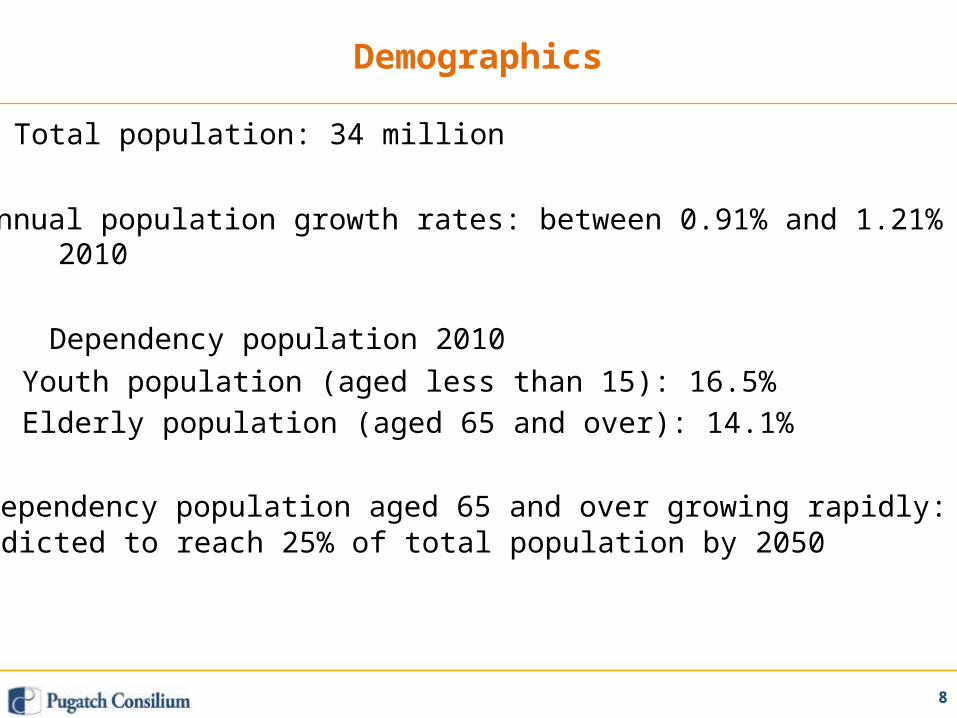
Demographics
• Total population: 34 million
• Annual population growth rates: between 0.91% and 1.21% 2000-2010
• Dependency population 2010– Youth population (aged less than 15): 16.5%– Elderly population (aged 65 and over): 14.1%
• Dependency population aged 65 and over growing rapidly:predicted to reach 25% of total population by 2050
8

9
Source: OECD Stat (2012)
20
15
10
5
02000 2005 2010 2020 2030 2040 2050
Dependency Population, Trend and Forecast, 2000-2050
30
25
Youth Population(agedless than 15) % of total
Population
Elderly population (aged65 and over) % of totalPopulation
Macro-economic Background
10
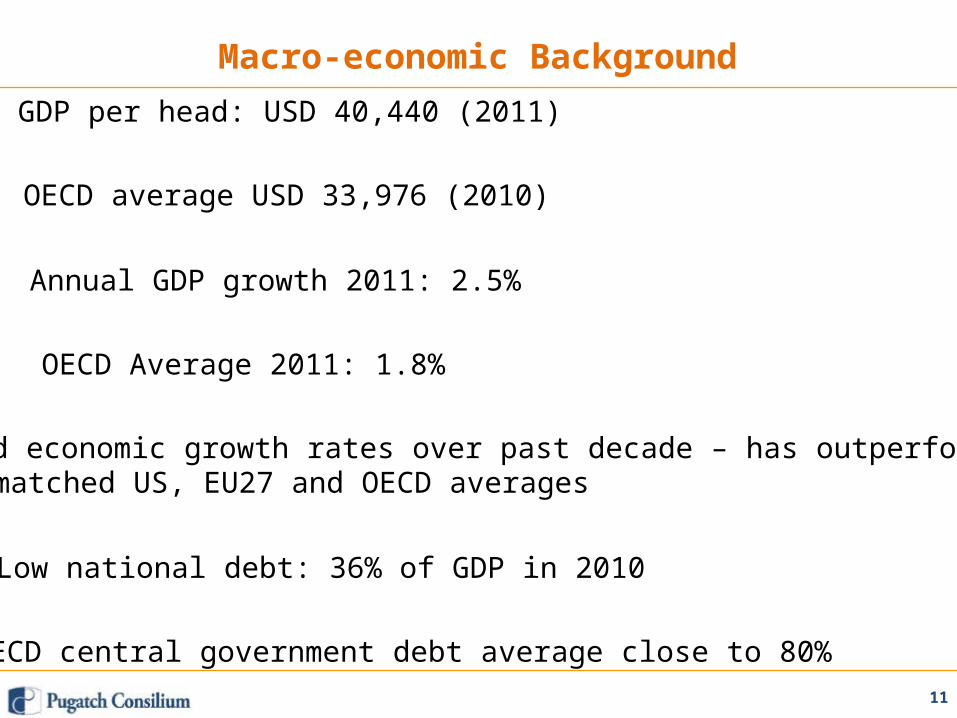
Macro-economic Background• GDP per head: USD 40,440 (2011)
• OECD average USD 33,976 (2010)
• Annual GDP growth 2011: 2.5%
• OECD Average 2011: 1.8%
• Solid economic growth rates over past decade – has outperformed ormatched US, EU27 and OECD averages
• Low national debt: 36% of GDP in 2010
• OECD central government debt average close to 80%11
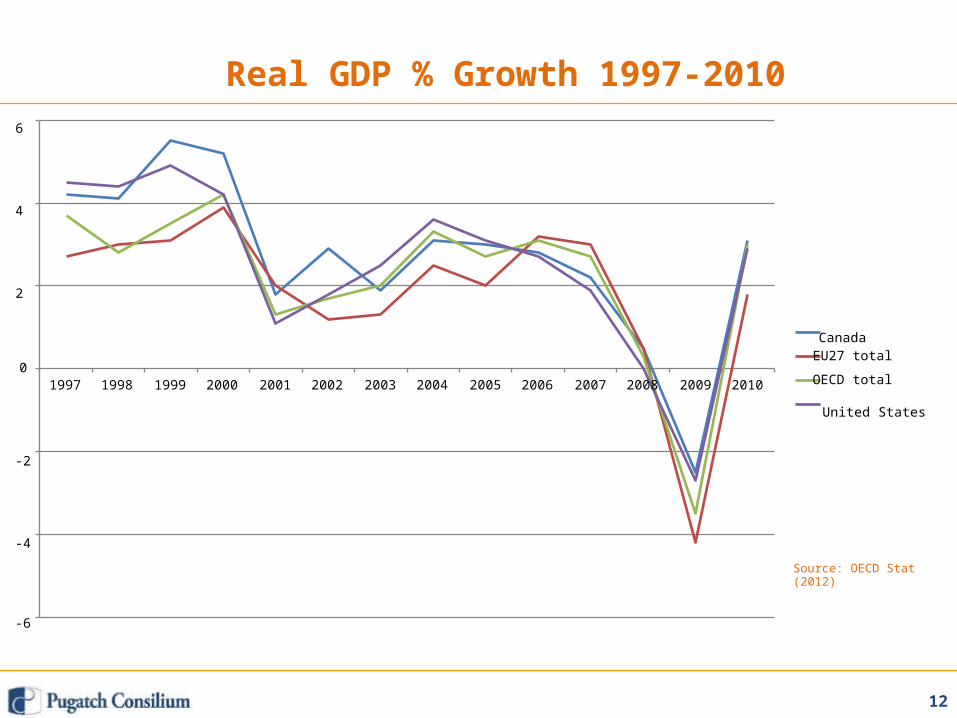
01997 1998 1999 2000 2001 2002 2003 2004 2005 2006 2007 2008 2009 2010
Real GDP % Growth 1997-20106
4
2
CanadaEU27 total
OECD total
United States
-2
-4
Source: OECD Stat(2012)
-6
12
Health System Overview
13
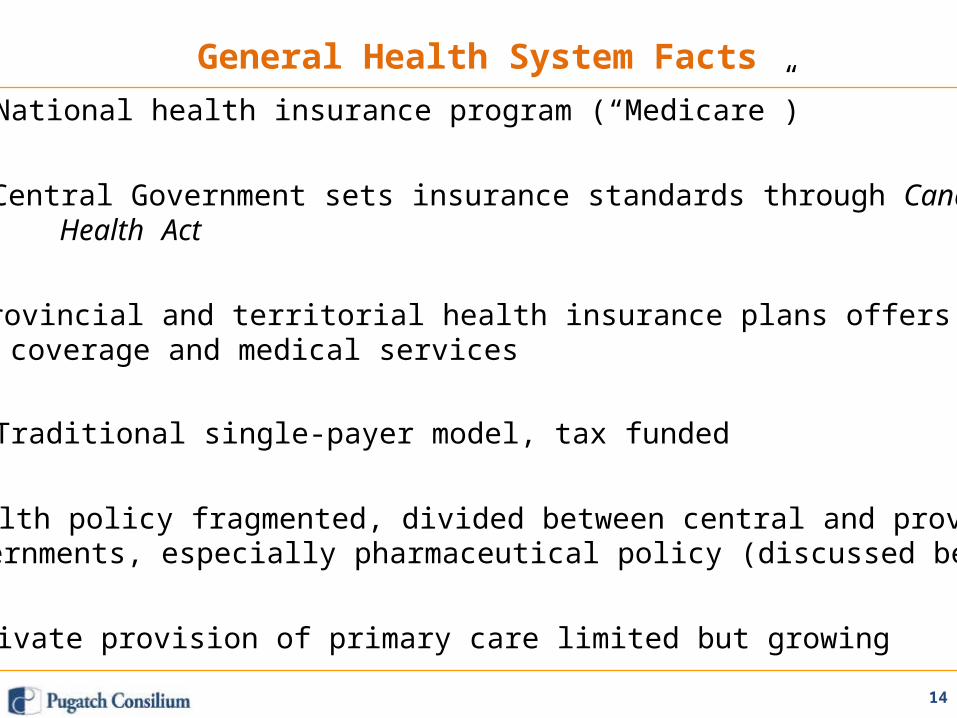
General Health System Facts• National health insurance program (“Medicare”)
• Central Government sets insurance standards through CanadaHealth Act
• 13 provincial and territorial health insurance plans offers actualcoverage and medical services
• Traditional single-payer model, tax funded
• Health policy fragmented, divided between central and provincialgovernments, especially pharmaceutical policy (discussed below)
• Private provision of primary care limited but growing
14
Health Expenditure
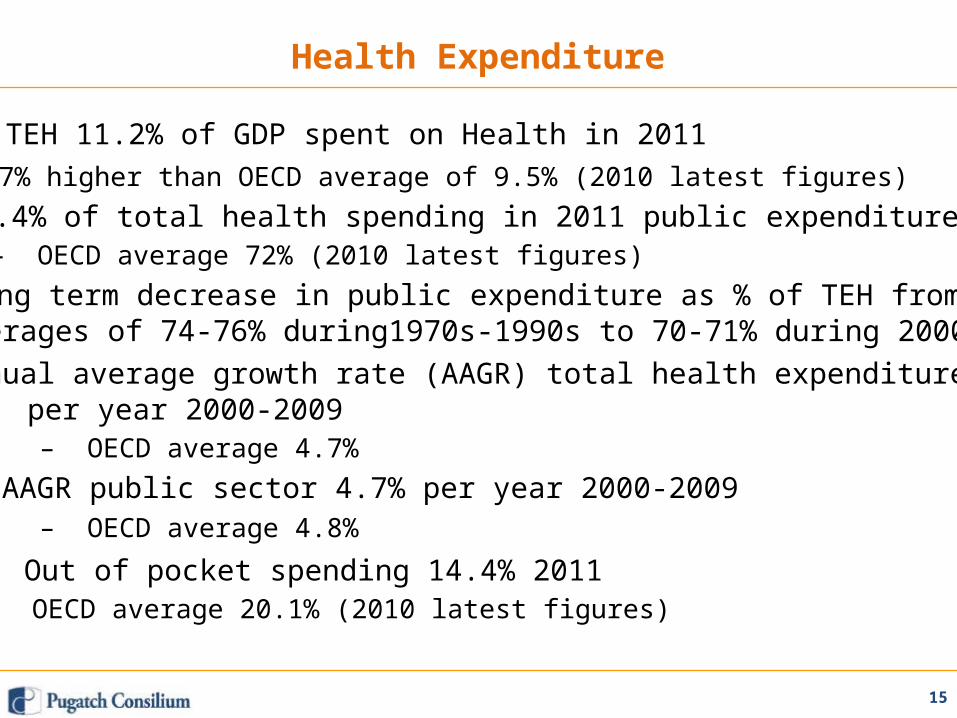
• TEH 11.2% of GDP spent on Health in 2011– 1.7% higher than OECD average of 9.5% (2010 latest figures)
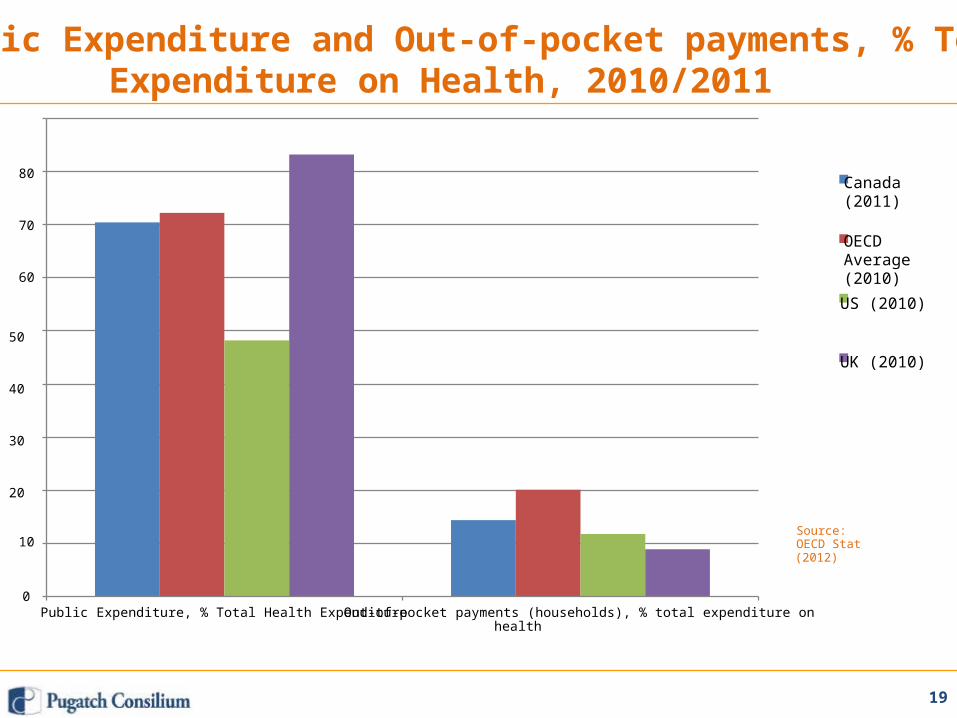
• 70.4% of total health spending in 2011 public expenditure– OECD average 72% (2010 latest figures)
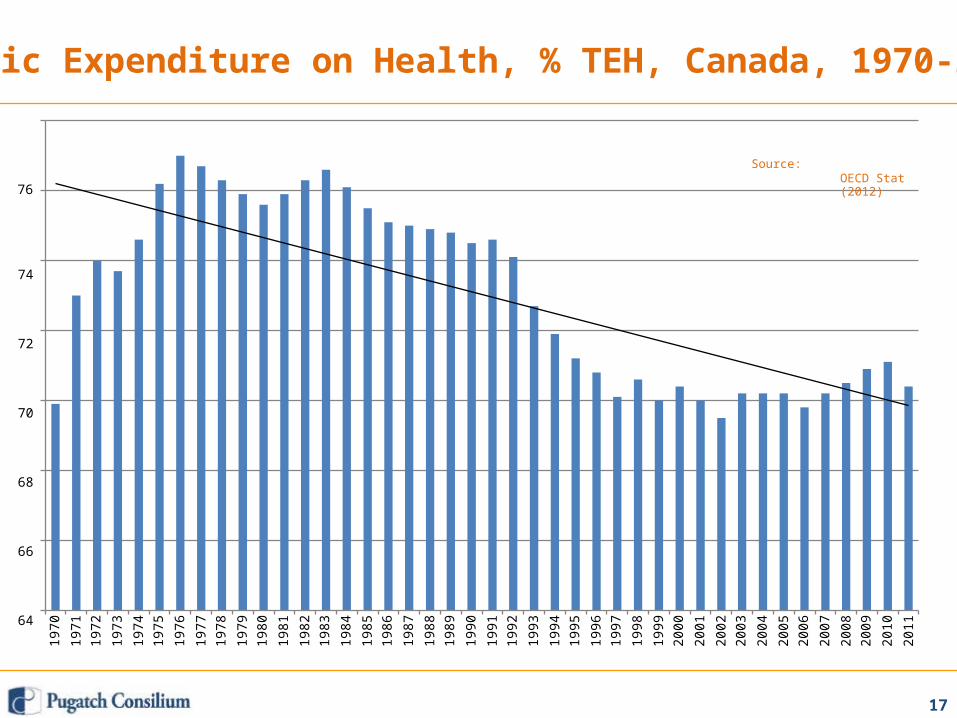
• Long term decrease in public expenditure as % of TEH fromaverages of 74-76% during1970s-1990s to 70-71% during 2000s
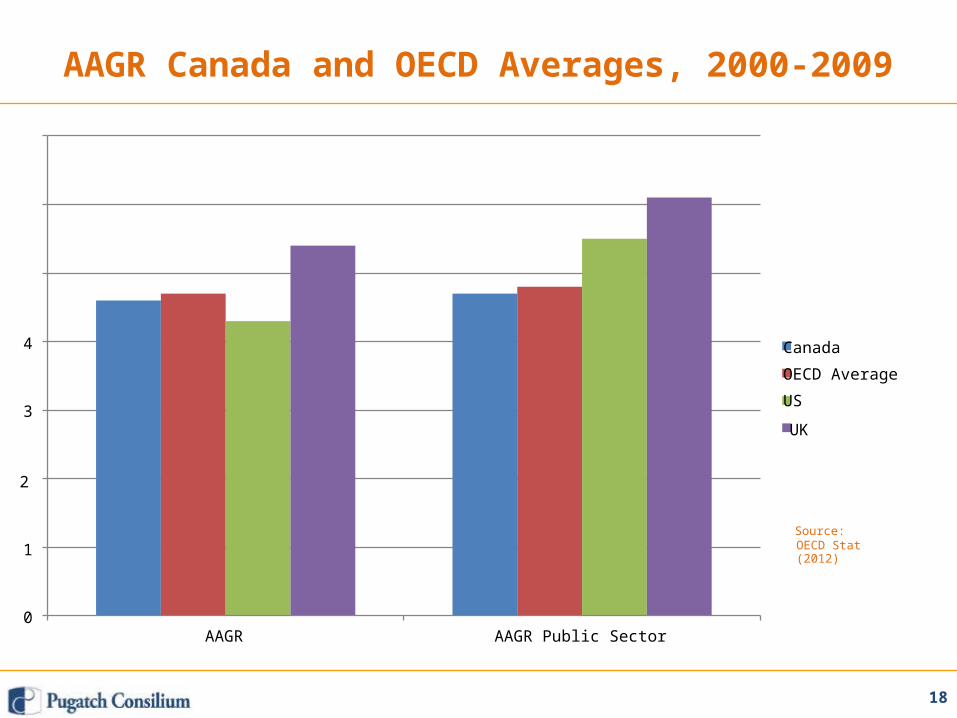
• Annual average growth rate (AAGR) total health expenditure 4.6%per year 2000-2009– OECD average 4.7%
• AAGR public sector 4.7% per year 2000-2009– OECD average 4.8%
• Out of pocket spending 14.4% 2011– OECD average 20.1% (2010 latest figures)
15
(2012)
0.00
16
2.00
6.00
4.00Source:OECD Stat
8.00
16.00
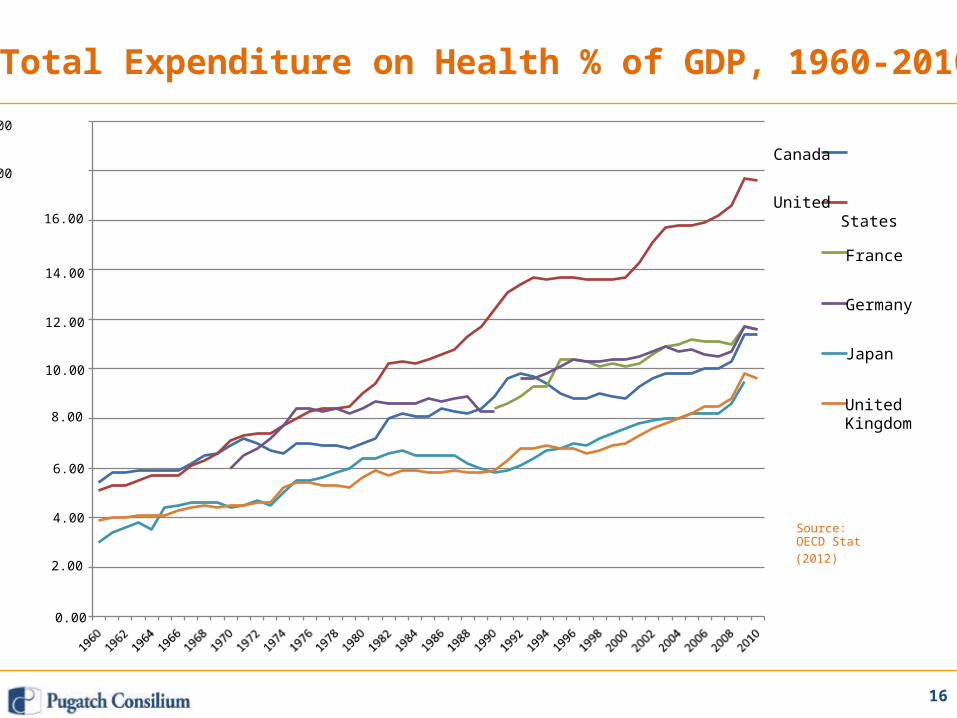
Total Expenditure on Health % of GDP, 1960-201020.00
Canada18.00
UnitedStates
France14.00
Germany12.00
Japan10.00
UnitedKingdom
1970
1971
1972
1973
1974
1975
1976
1977
1978
1979
1980
1981
1982
1983
1984
1985
1986
1987
1988
1989
1990
1991
1992
1993
1994
1995
1996
1997
1998
1999
2000
2001
2002
2003
2004
2005
2006
2007
2008
2009
2010
2011
OECD Stat(2012)
74
72
70
68
66
64
17
76
Public Expenditure on Health, % TEH, Canada, 1970-201178
Source:
18
OECD Stat(2012)1
0
4
3
AAGR Canada and OECD Averages, 2000-2009
7
6
5
AAGR AAGR Public Sector
Canada
OECD Average
US
UK
2
Source:
19
Source:OECD Stat(2012)
0
10
80
70
60
Public Expenditure and Out-of-pocket payments, % TotalExpenditure on Health, 2010/2011
90
Public Expenditure, % Total Health Expenditure Out-of-pocket payments (households), % total expenditure onhealth
Canada(2011)
OECDAverage(2010)US (2010)
50
UK (2010)
40
30
20
Pharmaceutical Overview
20
Pharmaceutical Overview
• Pharmaceuticals are covered through public or private insurance• Within a hospital setting drugs administered are covered throughpublic insurance
• Provinces and territories offer pharmaceutical insurance plans• Plans differ in eligibility, premiums, coverage and formularydesign• Canada top-10 pharmaceutical market in the world – per capita
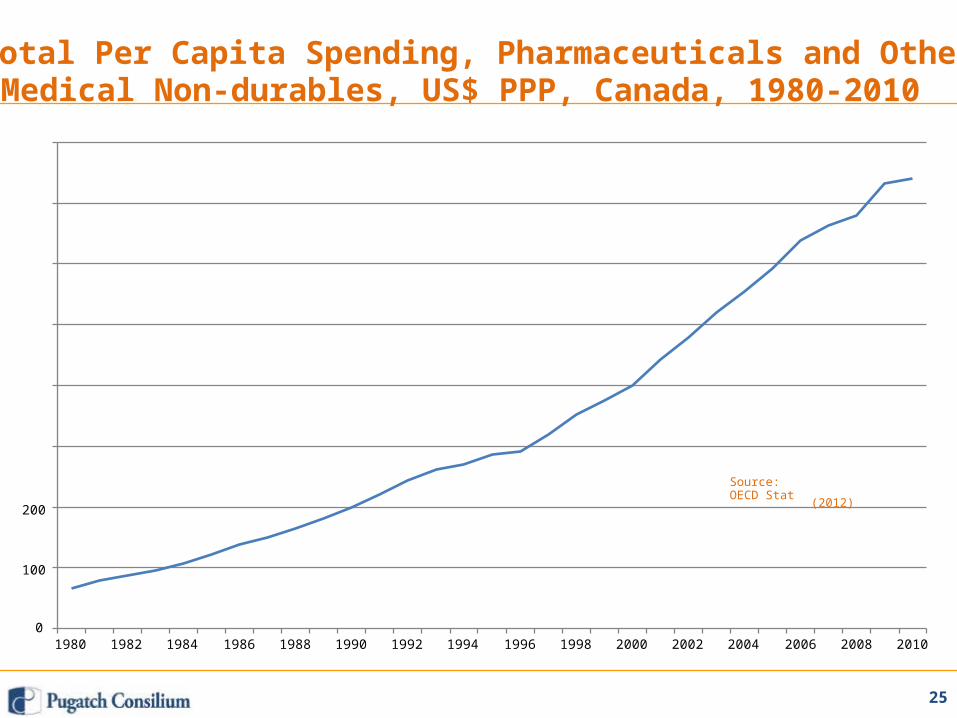
spending 2nd highest in the world• Strong growth in per capita pharmaceutical spending since1990s• Between 2000-2010 per capita spending almost doubled from
USD 400.7 to USD 740.7 (PPP)
21
Pharmaceutical Snapshot
•••••
Total spending on pharmaceuticals in 2011 C$32billion (CIHI)Growth of 4% 2010-2011Lower growth than in the past but still close to TEH AAGRPrescription drugs account for close to 85% of total spendingRelatively even split between public and private financing of
prescription drugs: 45% vs. 55%• Stronger growth rates in private financing (6.8%) vs. public
financing (2.2%)• Large variations in per capita spending from province to
province: C$576 in British Columbia and C$710 in Manitoba vs.C$937 in New Brunswick and C$985 in Nova Scotia
• Large variations in spending growth from province to province:1.4% in British Columbia and 2% in Ontario vs. 7.4% inSaskatchewan and 9.4% in Newfoundland and Labrador
22

Total Expenditure on Pharmaceuticals and Other MedicalNon-durables, % TEH, Canada, 1960-2010
23
Source:OECD Stat
(2012)
18
16
14
12
10
8
6
4
2
0
20
1960 1965 1970 1975 1980 1985 1990 1995 2000 2005 2010
15
10
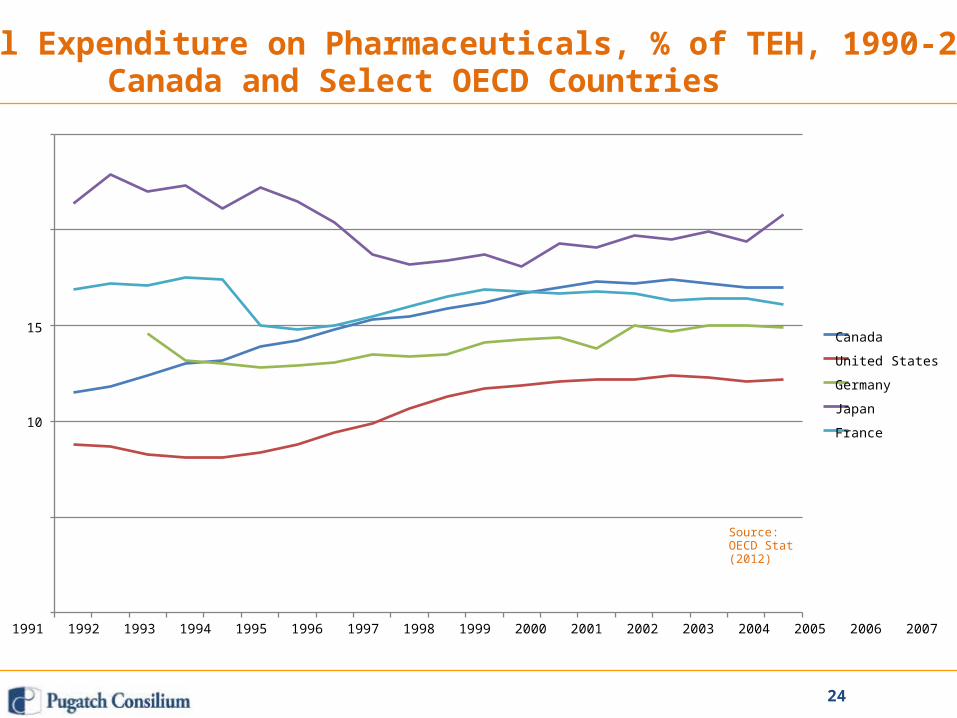
Total Expenditure on Pharmaceuticals, % of TEH, 1990-2009,Canada and Select OECD Countries
25
20
5Source:OECD Stat(2012)
01990 1991 1992 1993 1994 1995 1996 1997 1998 1999 2000 2001 2002 2003 2004 2005 2006 2007 2008 2009
24
Canada
United States
Germany
Japan
France
25
(2012)200
100
0
Total Per Capita Spending, Pharmaceuticals and OtherMedical Non-durables, US$ PPP, Canada, 1980-2010
800
700
600
500
400
300
Source:OECD Stat
1980 1982 1984 1986 1988 1990 1992 1994 1996 1998 2000 2002 2004 2006 2008 2010
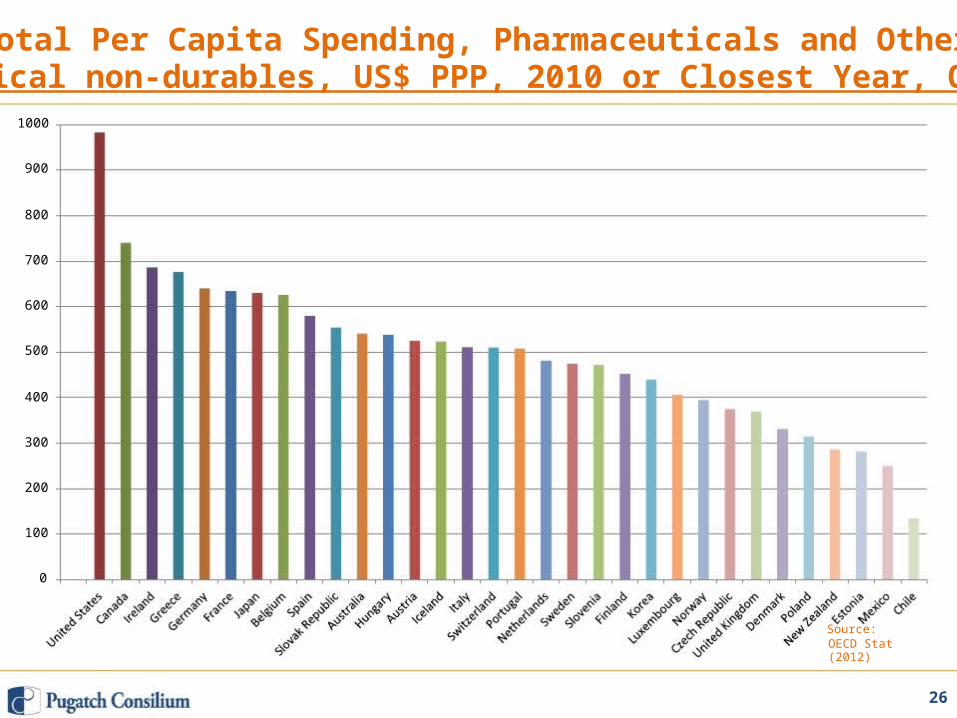
Total Per Capita Spending, Pharmaceuticals and OtherMedical non-durables, US$ PPP, 2010 or Closest Year, OECD
26
Source:OECD Stat(2012)
0
100
200
300
400
500
600
700
800
900
1000
Pricing and ReimbursementPolicies
27
Pricing Policies Patented Medicines
• Patented Medicine Prices Review Board (PMPRB) monitors andsets the price of patented medicines
• Judges whether a price is “excessive” for new patented drugsand existing patented drugs
• PMPRB regulations mandated and guided by s79-103 thePatent Act
• PMPRB uses 2 step process to set and review prices for newpatented drug products:
1.2.
Scientific reviewPrice review
28
Scientific Review
• The purpose of the scientific review process is to establish:“level of therapeutic improvement of a patented drug product”
• Level of therapeutic improvement assessed by Human DrugAdvisory Panel
• Four categories of therapeutic improvement:1.2.3.4.
BreakthroughSubstantial ImprovementModerate ImprovementSlight or No Improvement
29

Price Review Process
• Level of therapeutic improvement used to determine if a price is“excessive”
1.
2.
3.
4.
Breakthrough: excessive price determined by internationalreference pricing (IRP); France, Germany, Italy, Sweden,Switzerland, the United Kingdom, and the United States
Substantial Improvement: price is excessive if higher of IRP priceOR highest non-excessive price compared with drugs intherapeutic class (TCC test)
Moderate Improvement: IRP and/or TCC
Slight or No Improvement: TCC or IRP
30
PMPRB Investigations and Hearings
• PMPRB can initiate investigations into excessive pricing
• If excessive pricing is determined, investigated party can agreeto a lower price and offset any revenue based on excessivepricing (Voluntary Compliance Undertaking)
• If investigated party does not agree to lower price voluntarilyPMPRB can hold hearings and ultimately order price to belowered and double revenue amounts to be offset
• Hearing decisions are subject to federal judicial review
31
Reimbursement Policies
• Prescription drugs covered through private andprovincial/territorial public plans
• Covers 98% of population
• Federal government only provides coverage for a small numberof individuals, circa. 1 million
• Plans vary in scope, coverage and reimbursement policies fromprovince/territory to province/territory
32
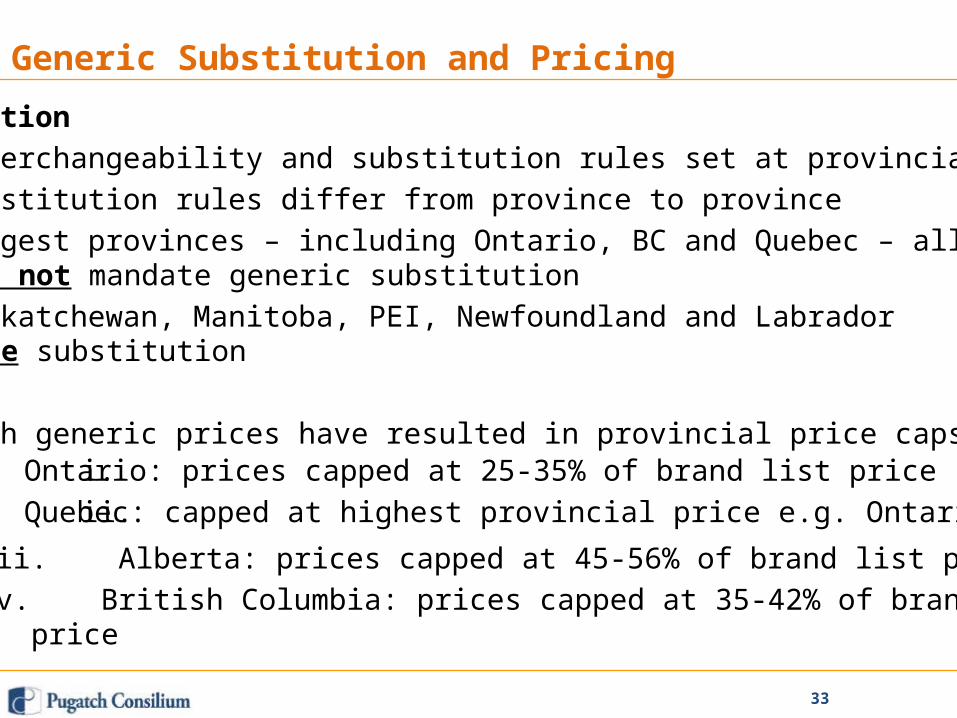
Generic Substitution and Pricing
Substitution• Interchangeability and substitution rules set at provincial level• Substitution rules differ from province to province• Biggest provinces – including Ontario, BC and Quebec – allow,
but do not mandate generic substitution• Saskatchewan, Manitoba, PEI, Newfoundland and Labrador
mandate substitutionPricing• High generic prices have resulted in provincial price caps:i.ii.
Ontario: prices capped at 25-35% of brand list priceQuebec: capped at highest provincial price e.g. Ontario
iii. Alberta: prices capped at 45-56% of brand list priceiv. British Columbia: prices capped at 35-42% of brand list
price
33
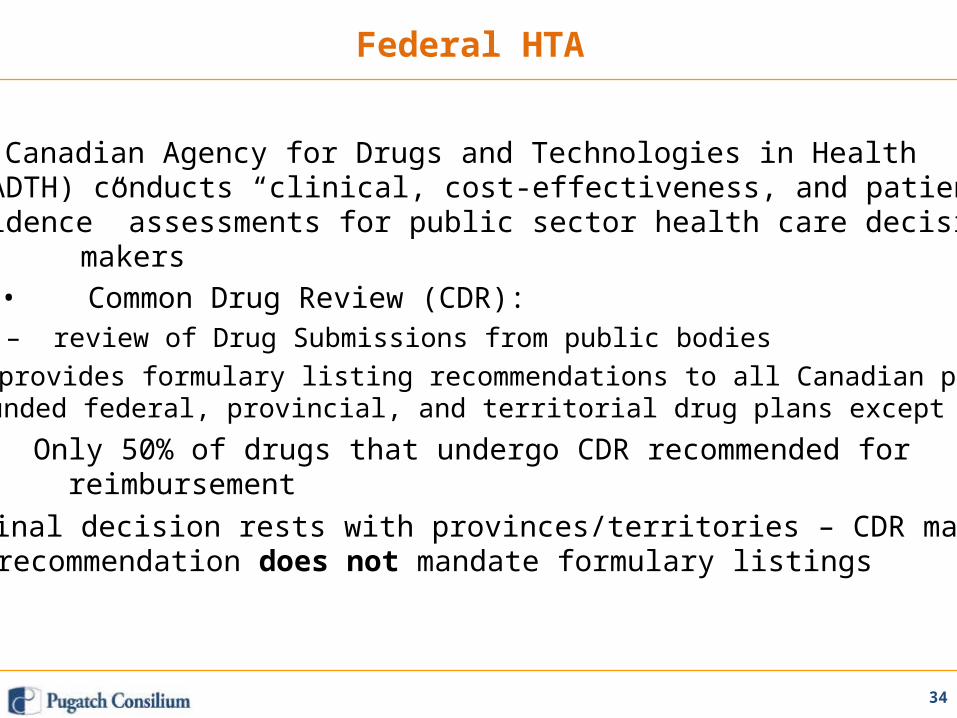
Federal HTA
• Canadian Agency for Drugs and Technologies in Health(CADTH) conducts “clinical, cost-effectiveness, and patientevidence” assessments for public sector health care decision
makers• Common Drug Review (CDR):
– review of Drug Submissions from public bodies– provides formulary listing recommendations to all Canadian publicly
funded federal, provincial, and territorial drug plans except Quebec.• Only 50% of drugs that undergo CDR recommended for
reimbursement• Final decision rests with provinces/territories – CDR makes
recommendation does not mandate formulary listings
34
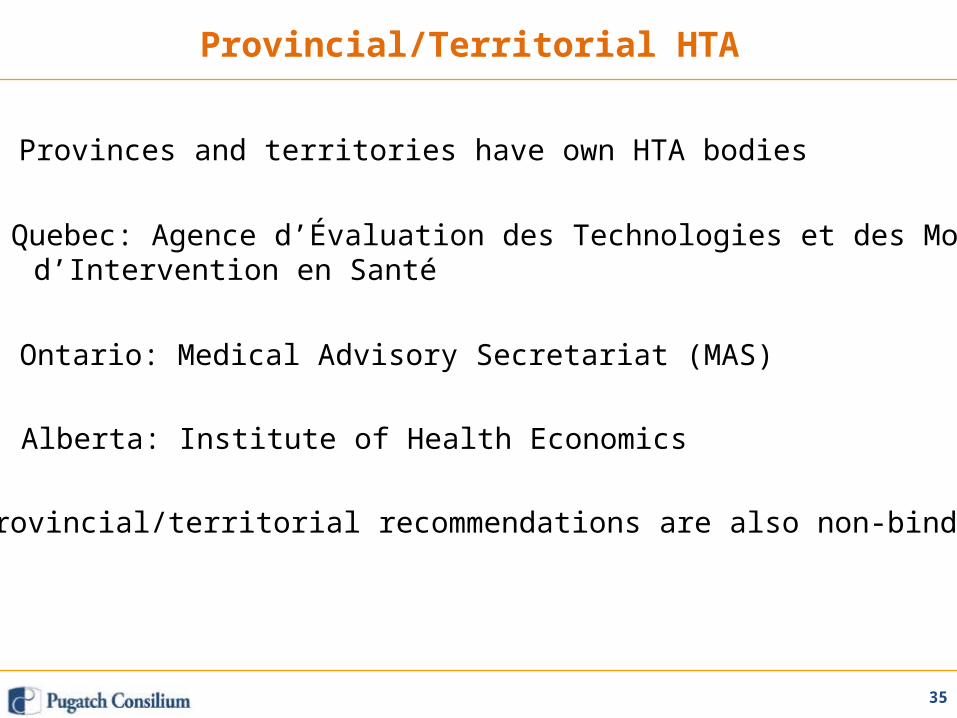
Provincial/Territorial HTA
• Provinces and territories have own HTA bodies
• Quebec: Agence d’Évaluation des Technologies et des Modesd’Intervention en Santé
• Ontario: Medical Advisory Secretariat (MAS)
• Alberta: Institute of Health Economics
• Provincial/territorial recommendations are also non-binding
35

Intellectual PropertyEnvironment
36
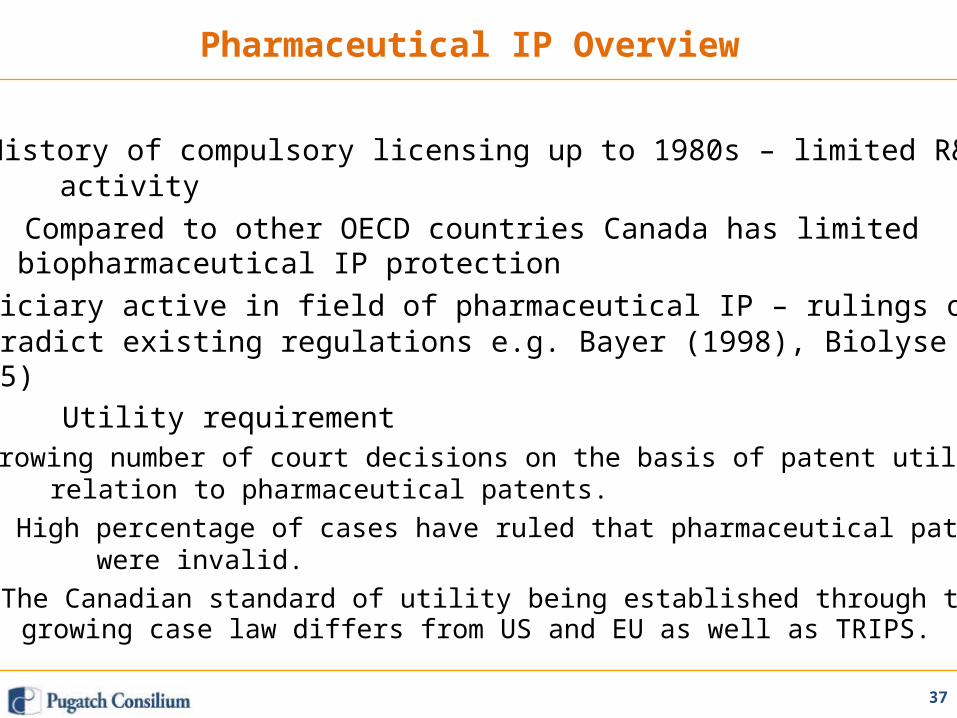
Pharmaceutical IP Overview
• History of compulsory licensing up to 1980s – limited R&Dactivity• Compared to other OECD countries Canada has limited
biopharmaceutical IP protection• Judiciary active in field of pharmaceutical IP – rulings often
contradict existing regulations e.g. Bayer (1998), Biolyse v. BMS(2005)
• Utility requirement– growing number of court decisions on the basis of patent utility in
relation to pharmaceutical patents.– High percentage of cases have ruled that pharmaceutical patents
were invalid.– The Canadian standard of utility being established through this
growing case law differs from US and EU as well as TRIPS.
37
Pharmaceutical ‘Patent Linkage’ Mechanism
• Notice of Compliance mechanism in place
• Requires generic applicants to comment on the patent status ofthe reference product
• Significant weaknesses:– does not provide the patent holder (“first person”) with a right ofappeal– the judicial proceedings determining the merits of the disputed
patent(s) is a summary not full process
38
PTE and RDP
• Canada does not offer patent term extensions forpharmaceutical products – currently under discussion in EU-
Canada FTA
• Canada offers a 8 year regulatory data protection term with thepossibility of a six-month pediatric extension
• RDP regulatory changes in 2006 response to Bayer case –reliance is grounds for data protection
39
Biopharmaceutical RegulatoryRequirements
40
Marketing Authorization for New Chemical Entities
• Health Canada’s (HC) Therapeutic Products Directorate (TPD)responsible for drug testing and approval
• New drug submissions required to undergo safety, efficacy andquality testing by TPD
• Average approval time: 18 months from submission of New DrugSubmission (NDS) until the TPD makes a marketing decision
• Priority review (target of 180 days) available for certain drugs(“extraordinary use new drug submission”)
• HC is an official observer and active participant in InternationalConference on Harmonisation of Technical Requirements forRegistration of Pharmaceuticals for Human Use (ICH)
• ICH guidelines and standards adopted by HC
41
Marketing Authorization for Biologics and Biosimilars
• Biological drugs undergo the same procedure and testingrequirements as new chemical entities
• Subsequent entry biologics (biosimilars) pathway introduced in2010
• Canadian biosimilar pathway resembles that used by theEuropean Medicines Agency (EMA)
• Key difference: Applicants may use biological reference productsthat have not received market approval in Canada
• RDP protection/periods the same for biologics and biosimilars asfor small molecule drugs
42
Public Procurement Policies –Pharmaceuticals
43
Public Procurement Policies – Pharmaceuticals
Overview• Pharmaceutical public procurement carried out at provincial and
hospital level – federal purchasing limited• Procurement guidelines issued by provincial governments• Group purchasing common – circa. 90% of hospital/health care
provider procurement through group purchasing organizationPan-Canadian Purchasing Alliance
• 2010 saw agreement between all provinces (expect Quebec) onestablishment of purchasing alliance
• Stated purpose to “consolidate public sector procurement ofcommon drugs and medical supplies and equipment”
• Relatively few drugs purchased so far• 2012 report of Council of Federation announced acceleration of
purchasing of branded drugs and expansion to include generics
44

Thank you!
45