counterfeit prevention & detection strategies, how to do it, when to do it
DESCRIPTION
Methodologies for mitigating counterfeit componentsTRANSCRIPT

Counterfeit Prevention &
Detection Strategies:
How To Do It, When To Do ItGreg Caswell
DfR Solutions, LLC
College Park, MD USA
Purpose
• Provide insight into the relative capabilities
and costs of the different methodologies for
identifying and mitigating counterfeit
electronic components from reaching
installation in an application
Outline
• Introduction
• Supply Chain Issues
• Decision Matrix and Case Study Example
• Detection Techniques– Visual Inspection
– X-Ray
– Electrical Characterization
– Mechanical Robustness
– DPA
• Conclusions
Introduction• This presentation addresses the unique sources of counterfeit components and
provides insights into how they occur.
– Counterfeit components are a rapidly growing area of concern. The Department of Commerce has identified a 141% increase in the last three years alone!
– Counterfeit Parts are no longer an emerging threat: they’re real, and they’re here to stay.
– A counterfeit is any item that is not as it is represented with the intention to deceive its’ buyer or user. The misrepresentation is often driven by the known presence of defects or other inadequacies in regards to performance. Whether it is used for a commercial, medical or military application, a counterfeit component can cause catastrophic failure at a critical time.
– Detection methodologies, such as visual inspection, mechanical robustness, X-Ray, XRF, C-SAM, Infrared Thermography, electrical characterization, decapsulation, and marking evaluations will be compared and contrasted.
– Multiple examples of counterfeit parts identified using these techniques will be highlighted.

5
Environmental Legislation
• Providing additional opportunities
– Recycling
– Need for obsolete SnPb parts

6
EIA/G-12 Committee Strategy
• TB-0003-2009 Counterfeit Parts & Materials
Risk Mitigation
Prevention
Detection
Mitigation
7
Prevention
• EIA/G-12 Recommendation
– “<sic> only procure from the Original Component Manufacturer (OCM) that makes and warranties the part or material or their designated franchisees.”
• Procuring from OCM’s
– Unrealistic for Military / Government programs
– Volumes too low
• Procuring from designated franchisees
– Component availability from designated franchisees is often similar to that of OCM
8
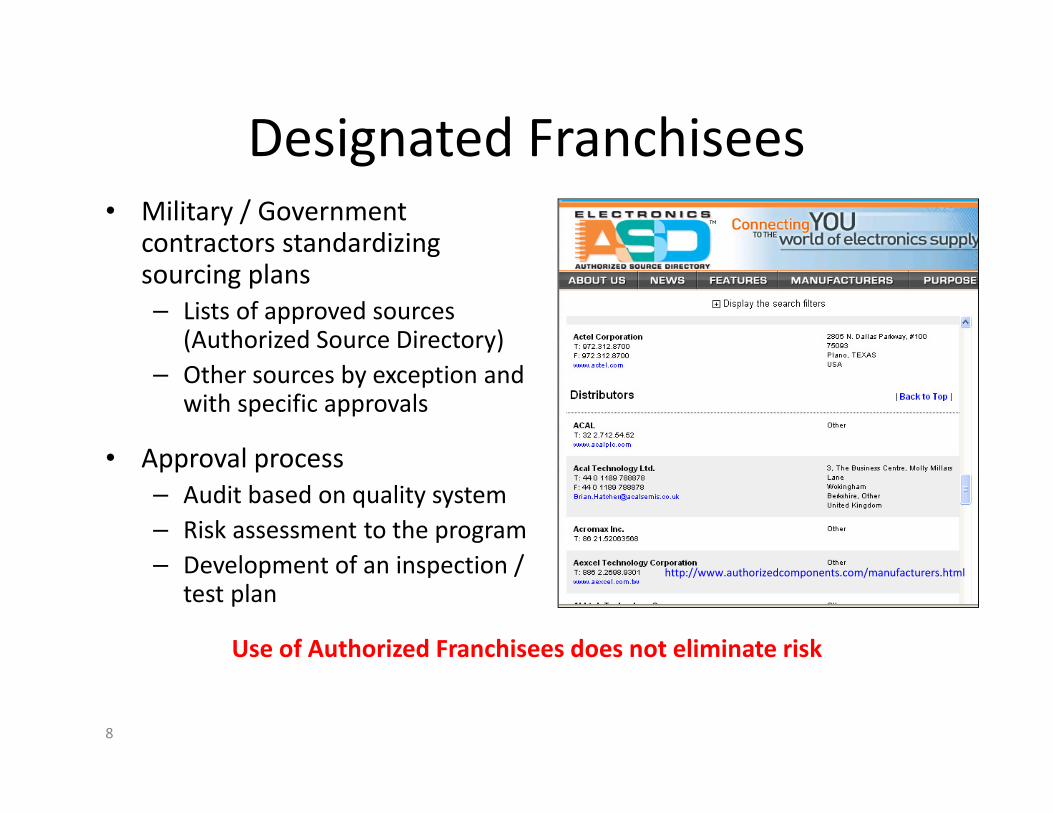
Designated Franchisees• Military / Government
contractors standardizing sourcing plans
– Lists of approved sources(Authorized Source Directory)
– Other sources by exception and with specific approvals
• Approval process
– Audit based on quality system
– Risk assessment to the program
– Development of an inspection / test plan
http://www.authorizedcomponents.com/manufacturers.html
Use of Authorized Franchisees does not eliminate risk

9
Complex Supply Chains
• Multiple points of entry
• Porous return policies
Lloyd Condra, Boeing
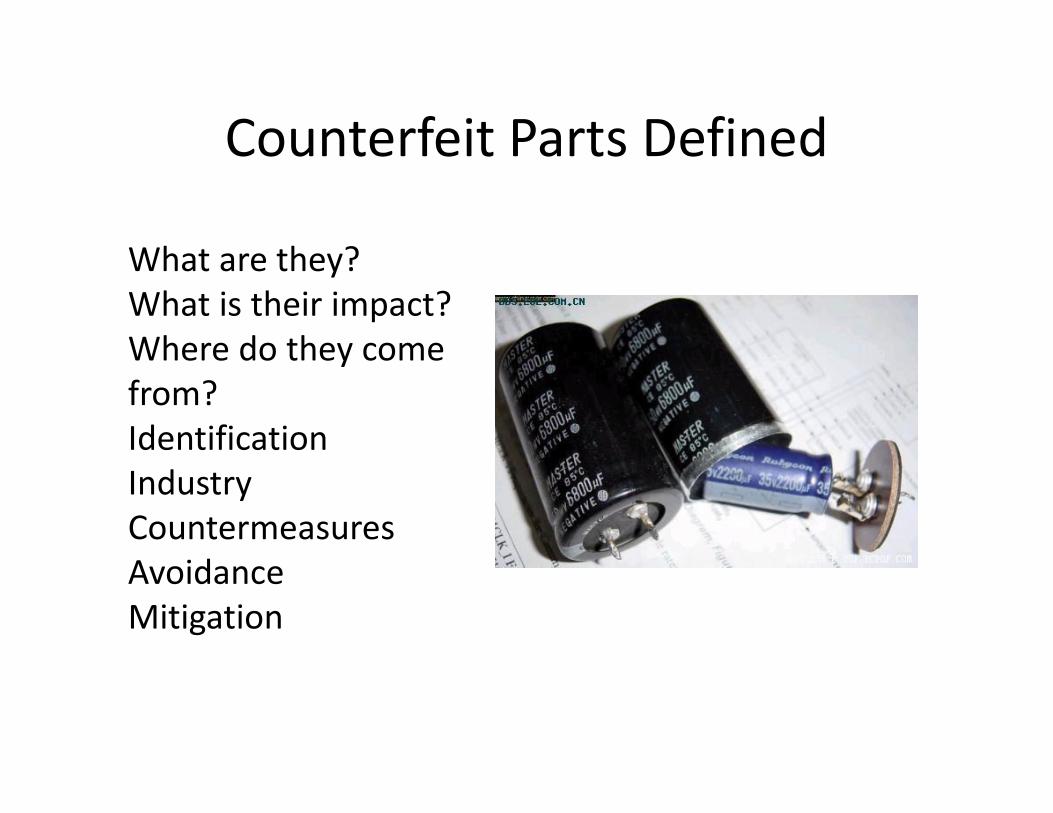
Counterfeit Parts Defined
What are they?
What is their impact?
Where do they come
from?
Identification
Industry
Countermeasures
Avoidance
Mitigation
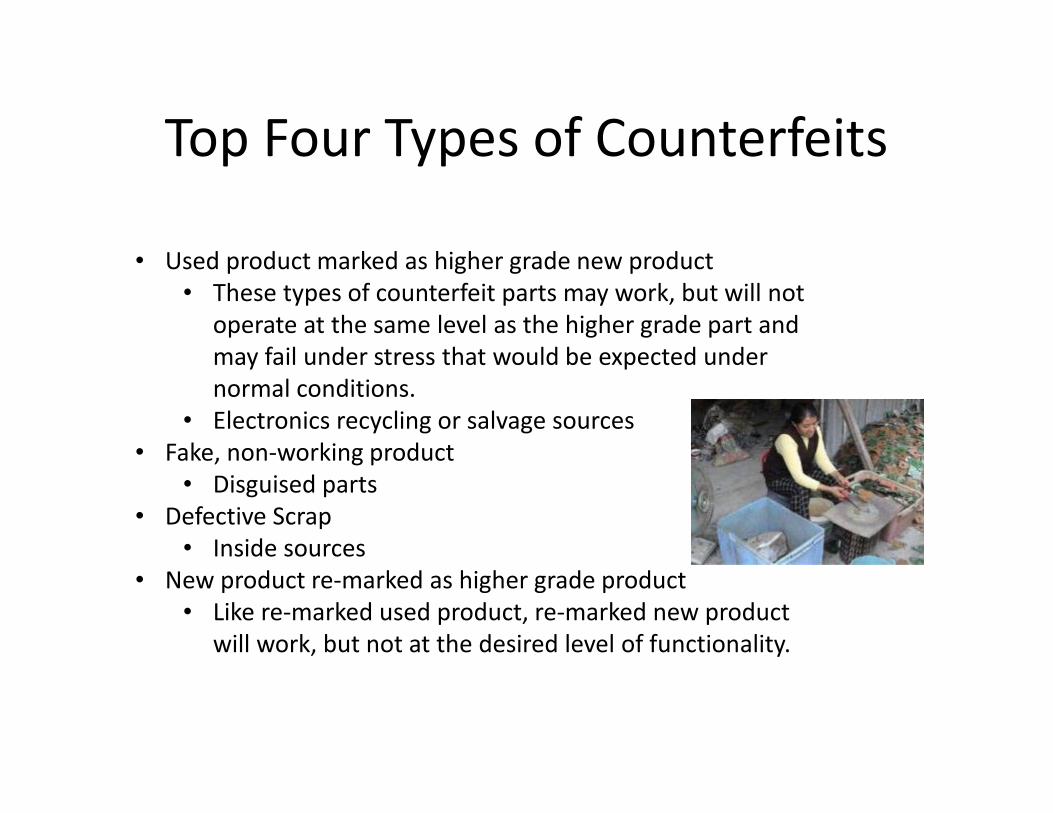
Top Four Types of Counterfeits
• Used product marked as higher grade new product
• These types of counterfeit parts may work, but will not
operate at the same level as the higher grade part and
may fail under stress that would be expected under
normal conditions.
• Electronics recycling or salvage sources
• Fake, non-working product
• Disguised parts
• Defective Scrap
• Inside sources
• New product re-marked as higher grade product
• Like re-marked used product, re-marked new product
will work, but not at the desired level of functionality.

Primary Sources of Counterfeit Parts
• Most counterfeit parts come from parts brokers
that deal in small and odd lots
• Low volume of obsolete parts bought off the
internet
• Authorized parts distributors rarely have
counterfeits because they receive them directly
from the original component manufacturer (OCM)
• Regions with highest counterfeit activity:
• China
• Middle East
• Eastern Europe
• But truly a global problem!
13
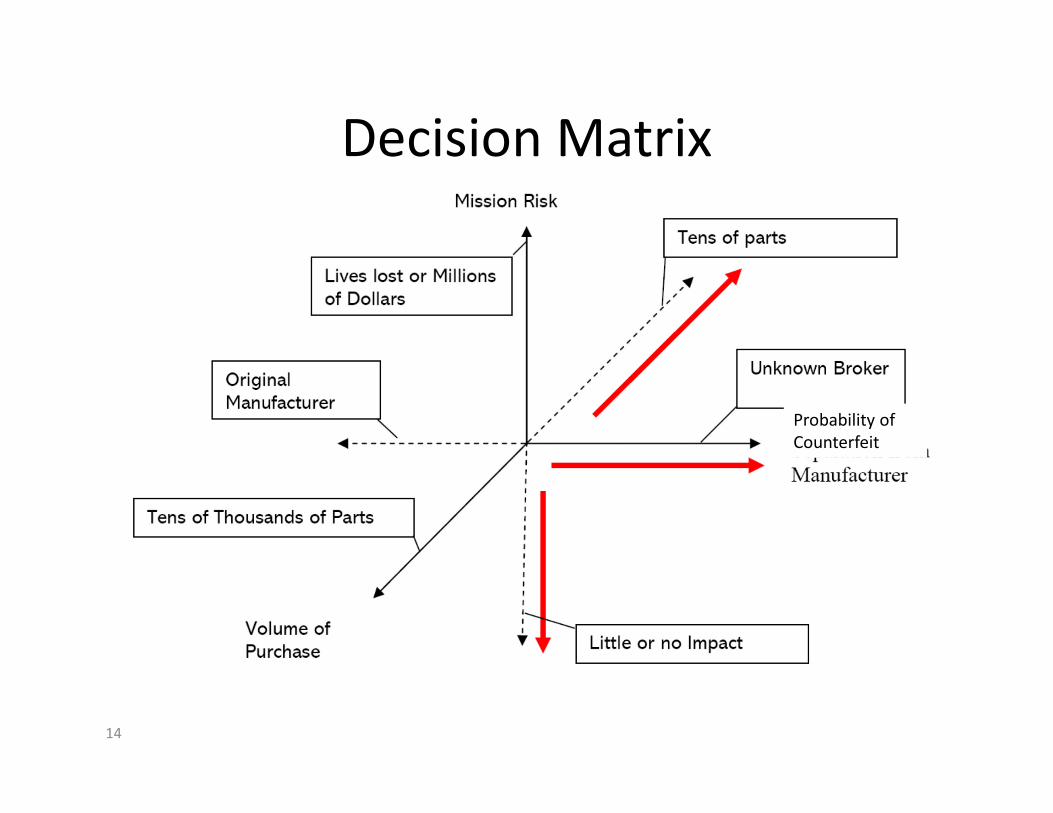
Decision Process
• If prevention is not realistic, when to detect? How
to mitigate?
• Entry for counterfeit components is cost
– Cost to procure < cost of redesign (+ requal, etc.)
– If cost to mitigate is too high, then simply redesign
• How to determine the appropriate cost to detect
and mitigate?
– Driven by probability / mission risk / volume matrix
14
Decision Matrix
Probability of
Counterfeit
15
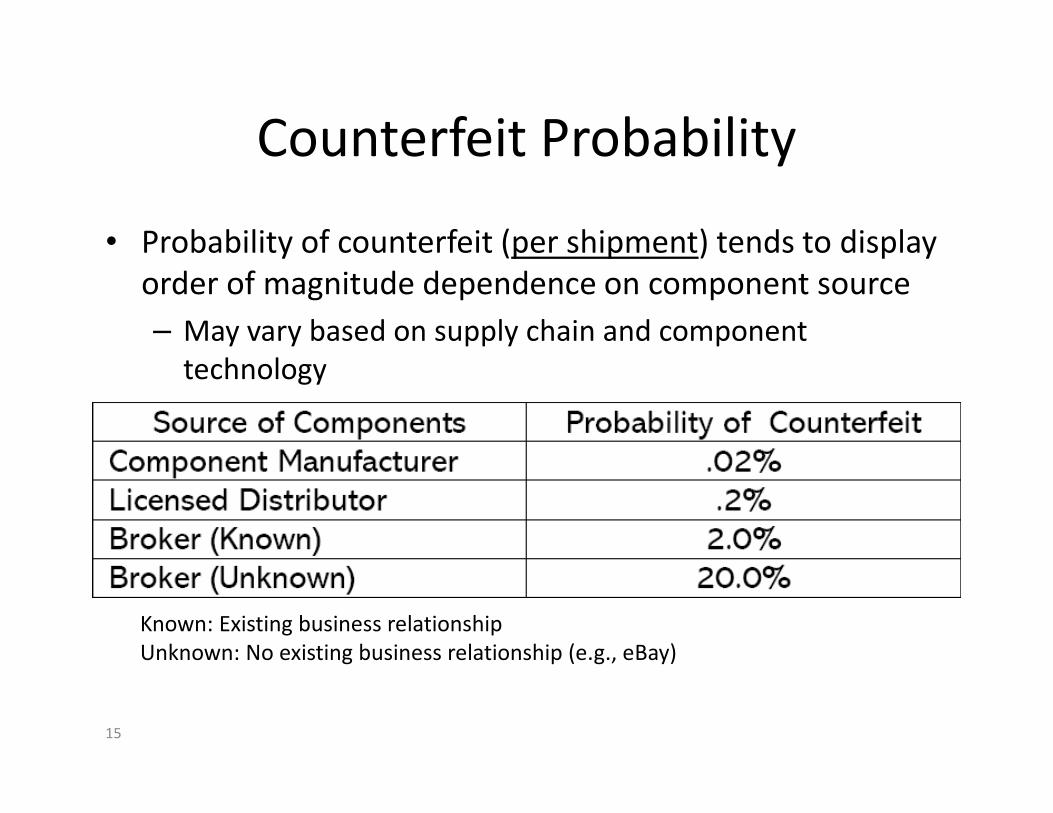
Counterfeit Probability
• Probability of counterfeit (per shipment) tends to display
order of magnitude dependence on component source
– May vary based on supply chain and component
technology
Known: Existing business relationship
Unknown: No existing business relationship (e.g., eBay)
16
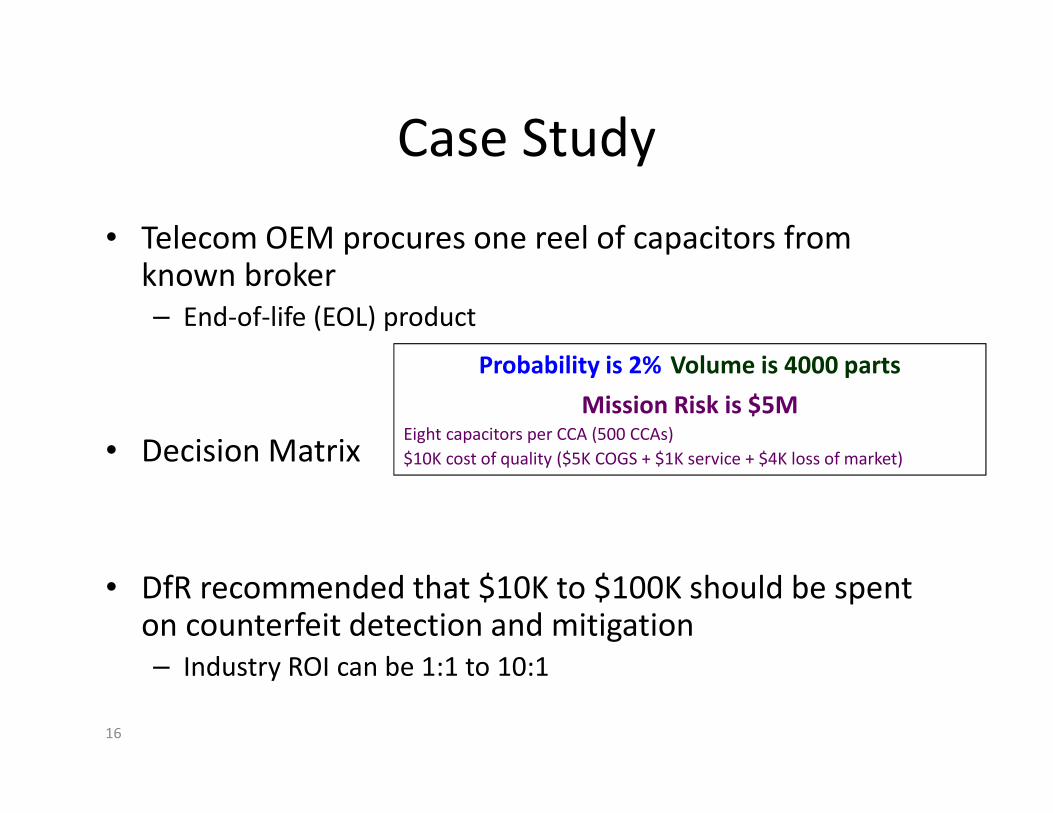
Case Study
• Telecom OEM procures one reel of capacitors from known broker
– End-of-life (EOL) product
• Decision Matrix
• DfR recommended that $10K to $100K should be spent on counterfeit detection and mitigation
– Industry ROI can be 1:1 to 10:1
Probability is 2% Volume is 4000 parts
Mission Risk is $5MEight capacitors per CCA (500 CCAs)
$10K cost of quality ($5K COGS + $1K service + $4K loss of market)
17
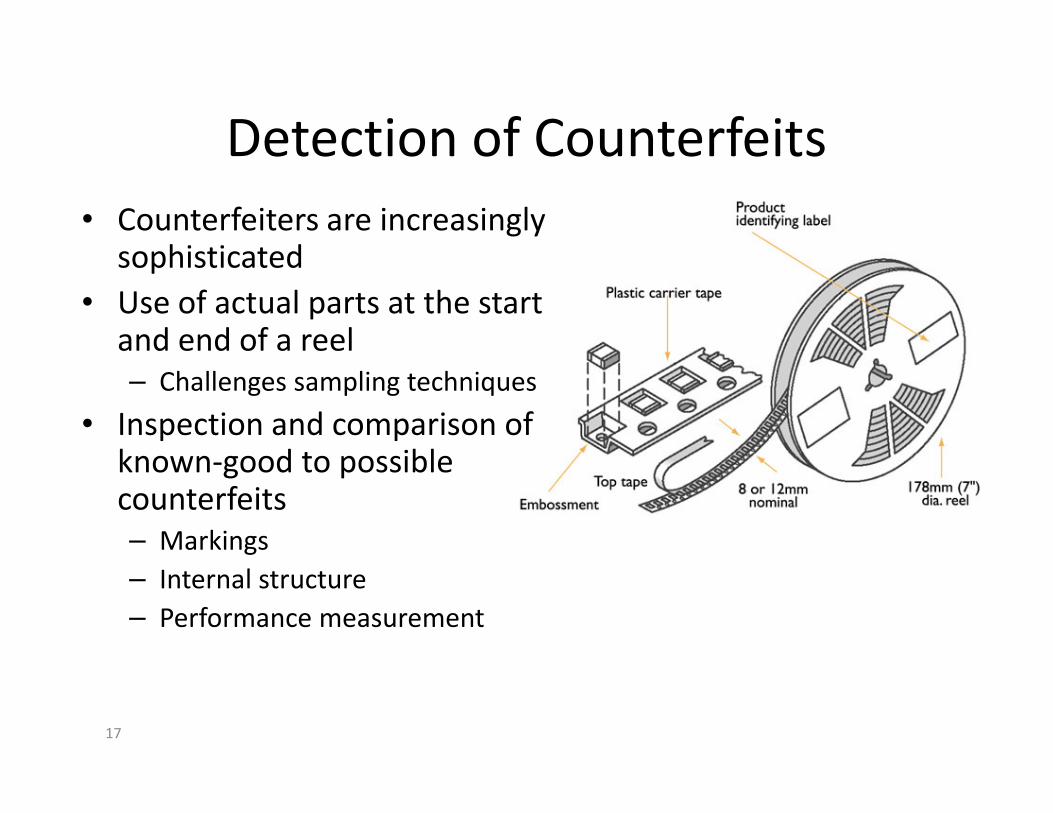
Detection of Counterfeits
• Counterfeiters are increasingly sophisticated
• Use of actual parts at the start and end of a reel
– Challenges sampling techniques
• Inspection and comparison of known-good to possible counterfeits
– Markings
– Internal structure
– Performance measurement

18
Detection Techniques
T. Apple 610-531-5484
Visual /
Marking
Inspec-
tion
Verificati
on of
Manuf.
LDC,
SNs, etc.
Mater-ial
Analy-sisSeal Test
Radio-
graphicDPA
Minimal
Electrical
Test
Full
Electri-
cal Test
(Am-
bient)
Full
Electrical
Test (Hot
/ Cold Am-
bient)
Test &
Burn-in
Test,
Burn-in
and QCI
No Die / Non-
functionalNo No No No Yes Yes Yes Yes Yes Yes Yes
Material Content P No Yes No No Yes No No No No No
Wrong Die P P No No P Yes Yes Yes Yes Yes Yes
Re-used /
Repaired /
Salvaged
P No P P P P No No No No No
Scrapped /
RejectP No No P P P P P P Yes Yes
Mechanical
DamageYes No No P P Yes P P P P P
Mis-Handling /
StorageNo No No P No P P Yes Yes Yes Yes
Manufacturer
ChangeP P P No P Yes P P P P P
Less Reliable
PartsP P P No No P No P P P P
Reliability /
Quality IssueNo No No No P P No P P Yes Yes
ESD / EOS
DamageNo No No No No P P P P Yes Yes
Counterfeit with
functional dieP P P No P P P P Yes Yes Yes
Temperature
Range
Upmarking
No P No No No P No No Yes Yes Yes
Code:
This chart was developed from one created by Mark Marshall of Integra Technologies.
No = Unlikely to Find
Shading:
Green = Low Cost / Easily Accomplished
Yellow = Moderate Cost / Some time involved
Red = High Cost / Significant time to accomplish
Dotted Pattern = Will be found at first electrical test
Counte
rfeit C
oncern
P = Possibly Find
Yes = Probably Find
Detection/Risk Mitigation Methods
19
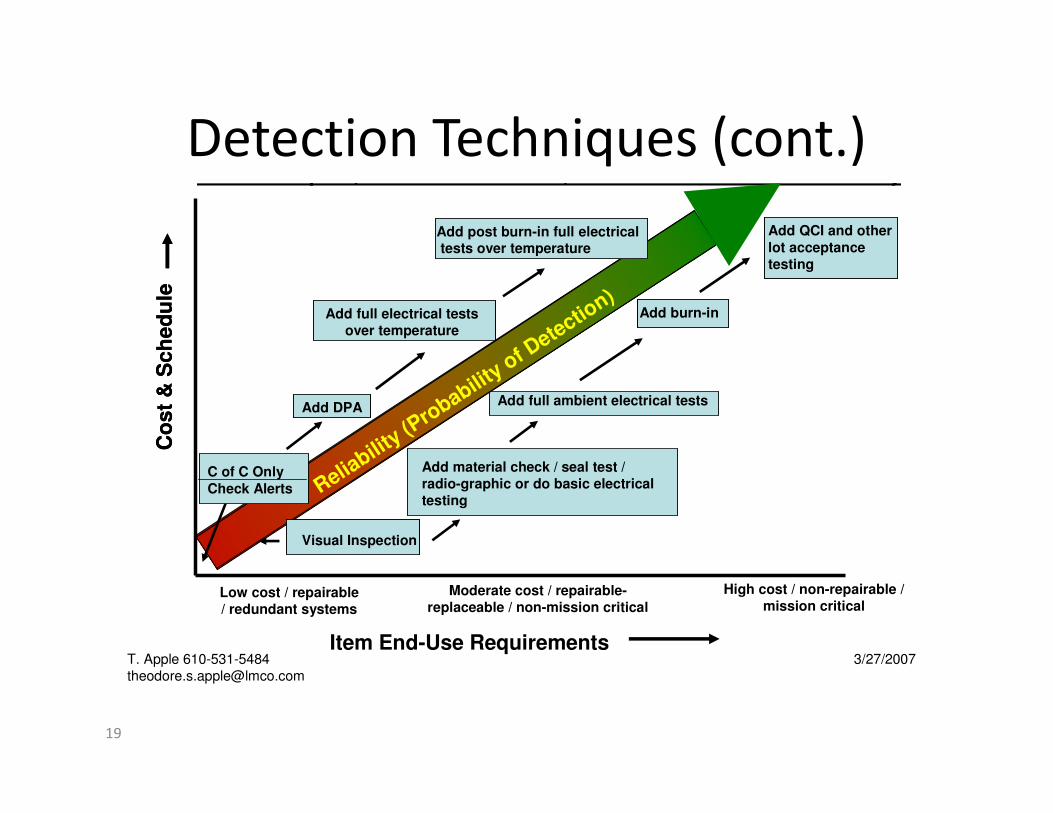
Detection Techniques (cont.)
Add material check / seal test / radio-graphic or do basic electrical testing
Add full ambient electrical tests
Moderate cost / repairable-replaceable / non-mission critical
Add QCI and other
lot acceptance testing
Add QCI and other
lot acceptance testing
Co
st
& S
ch
ed
ule
Co
st
& S
ch
ed
ule
The more spent, the more time taken, the more confidence in reliability
Add DPAAdd DPA
Add full electrical tests over temperature
Add full electrical tests over temperature
Add burn-inAdd burn-in
T. Apple [email protected]
3/27/2007Item End-Use Requirements
Low cost / repairable / redundant systems
High cost / non-repairable / mission critical
Reliabilit
y (Pro
bability o
f Dete
ction)
Add post burn-in full electricaltests over temperature
Add post burn-in full electricaltests over temperature
C of C Only
Check Alerts
Visual InspectionVisual Inspection
20
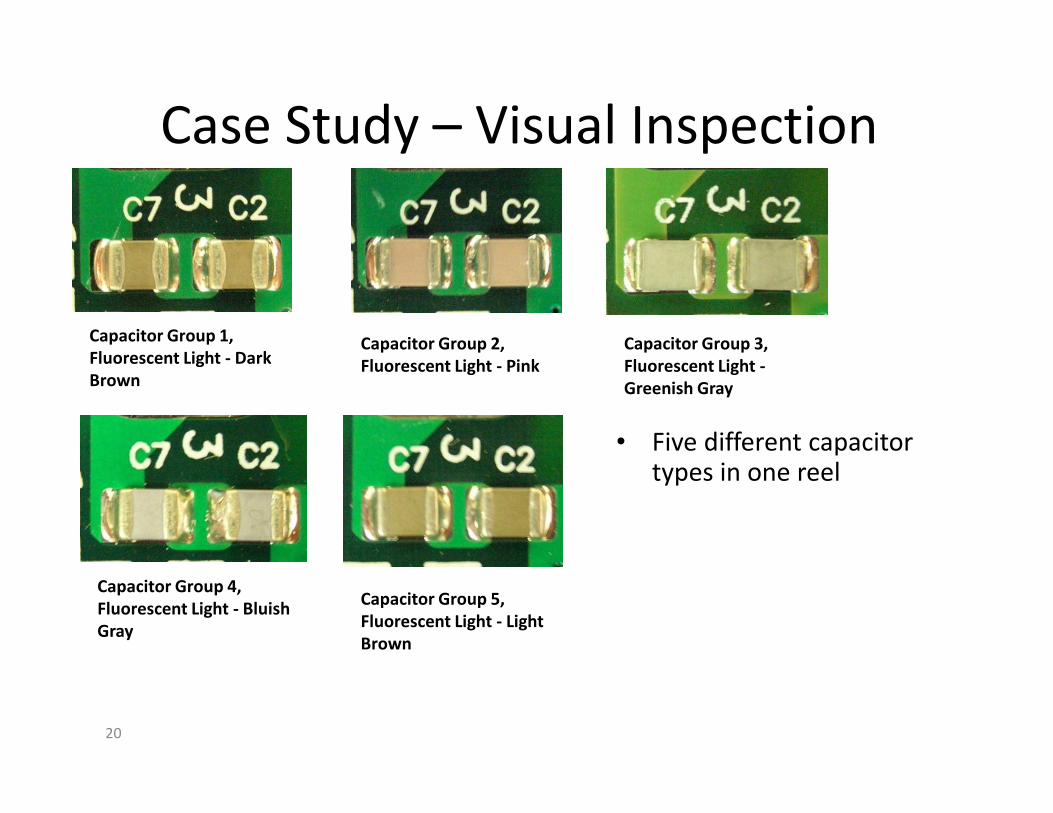
Case Study – Visual Inspection
• Five different capacitor types in one reel
Capacitor Group 1,
Fluorescent Light - Dark
Brown
Capacitor Group 2,
Fluorescent Light - Pink
Capacitor Group 3,
Fluorescent Light -
Greenish Gray
Capacitor Group 5,
Fluorescent Light - Light
Brown
Capacitor Group 4,
Fluorescent Light - Bluish
Gray
21
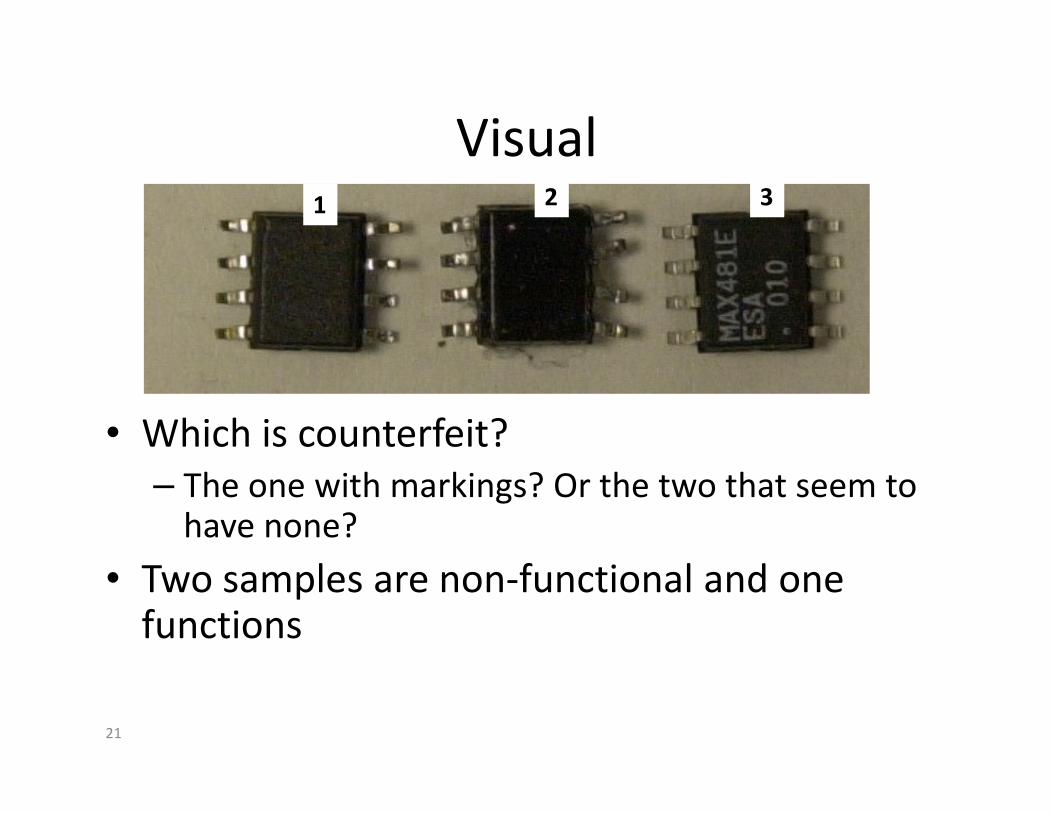
Visual
• Which is counterfeit?
– The one with markings? Or the two that seem to have none?
• Two samples are non-functional and one functions
1 2 3
22
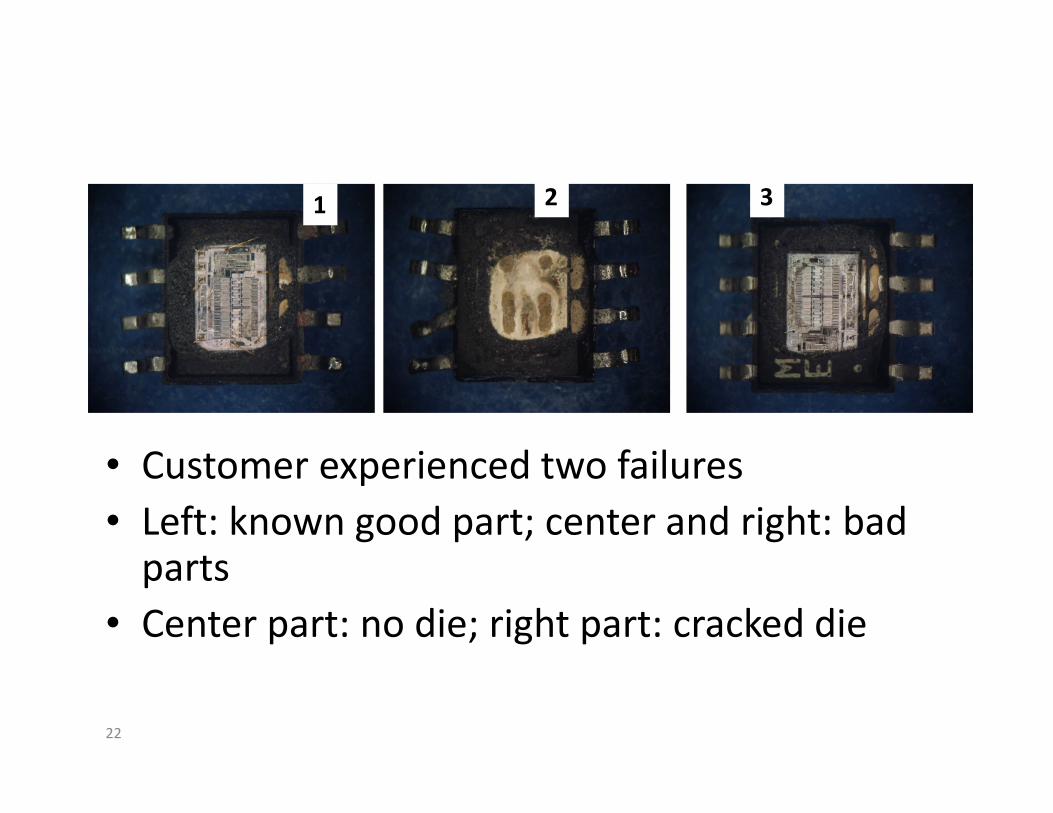
• Customer experienced two failures
• Left: known good part; center and right: bad parts
• Center part: no die; right part: cracked die
1 2 3

23
Date Code Marking - Differences2.22
12.00
3.18
12.00
Smooth
Even
Textured
Uneven
Registration (mm)
Surface
Lettering
Uniform
depth
Uneven
depth

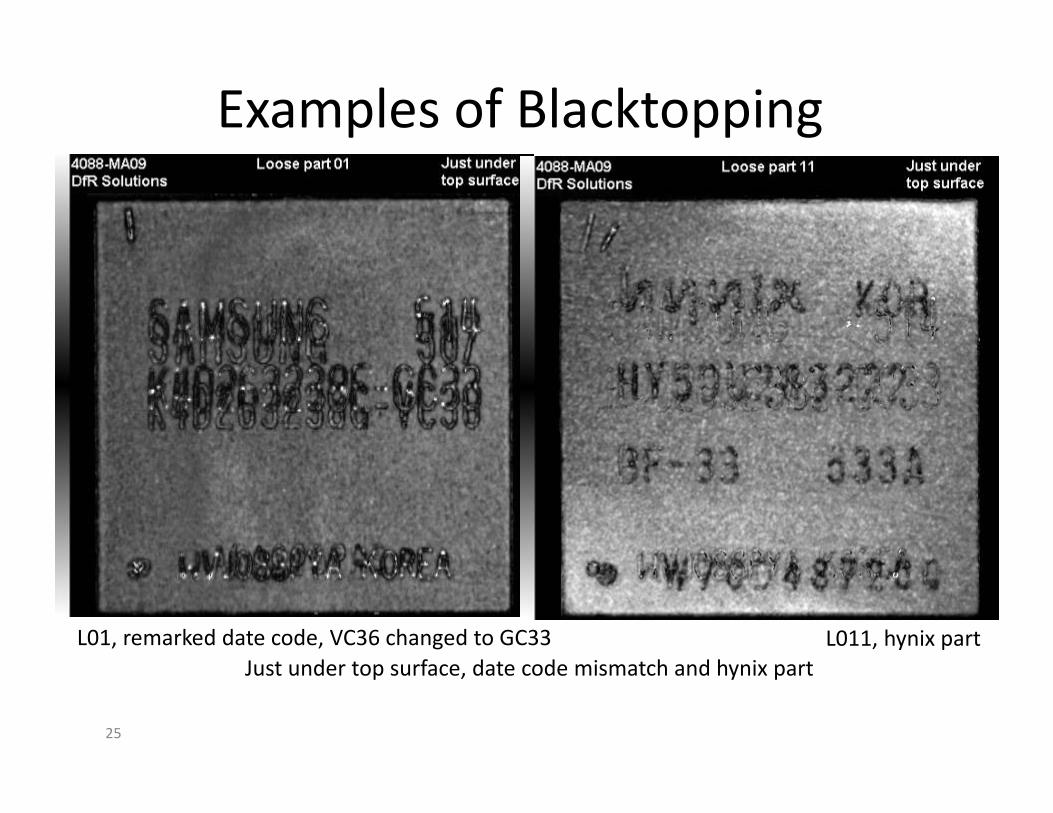
Blacktopping Defined
• Blacktopping is a counterfeiting technique where the counterfeiter:
– Takes components, usually real, but discarded
– Sands them to remove the original component marking
– Blacktops them in order to hide the original marking
– Prints them with fake markings.
– Investigators able to dissolve the blacktop with a solvent solution that revealed the true identity of the components.
• Many blacktopped components can be uncovered by vigorously wiping acetone on the component
– But, methods used to blacktop sanded parts improve daily
25
Examples of Blacktopping
Just under top surface, date code mismatch and hynix part
L01, remarked date code, VC36 changed to GC33 L011, hynix part
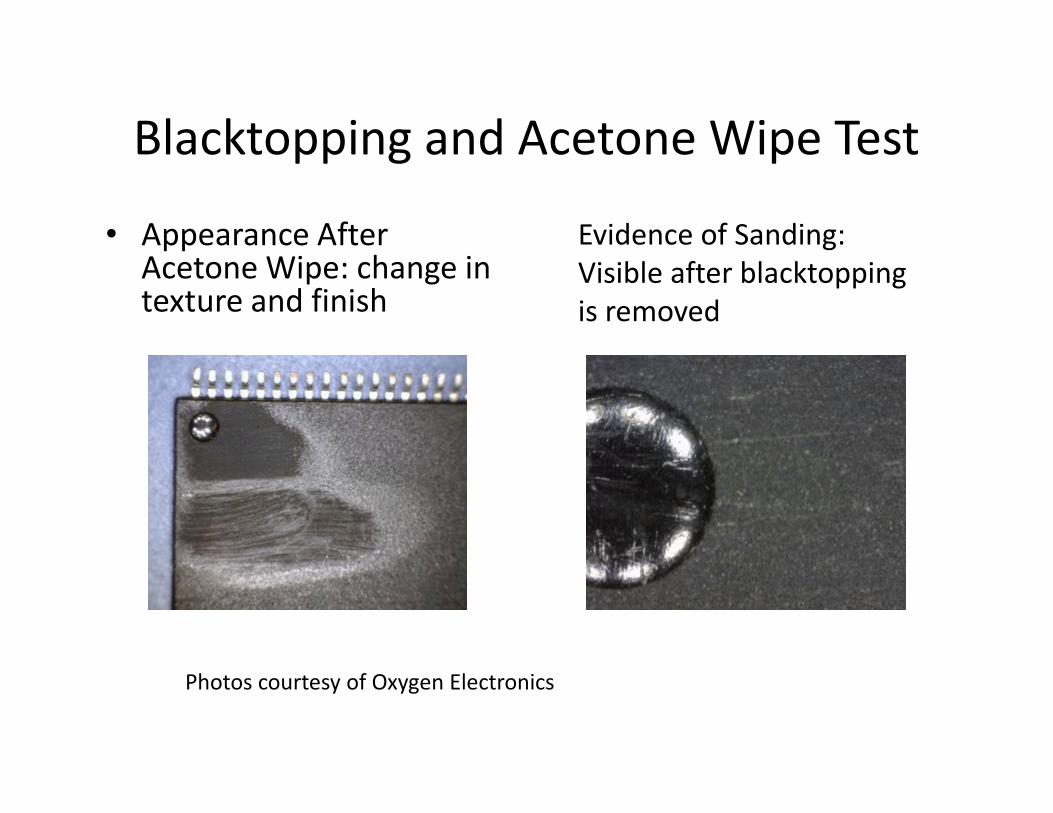
Blacktopping and Acetone Wipe Test
• Appearance After Acetone Wipe: change in texture and finish
Evidence of Sanding:
Visible after blacktopping
is removed
Photos courtesy of Oxygen Electronics
27
Visual Inspection Cost vs. Benefit
• $1K to $3K
• Identify color differences in parts
• Ascertain marking
imperfections/changes/blacktopping
• Lead finish and variability
• Co-planarity of leads – reused parts
28
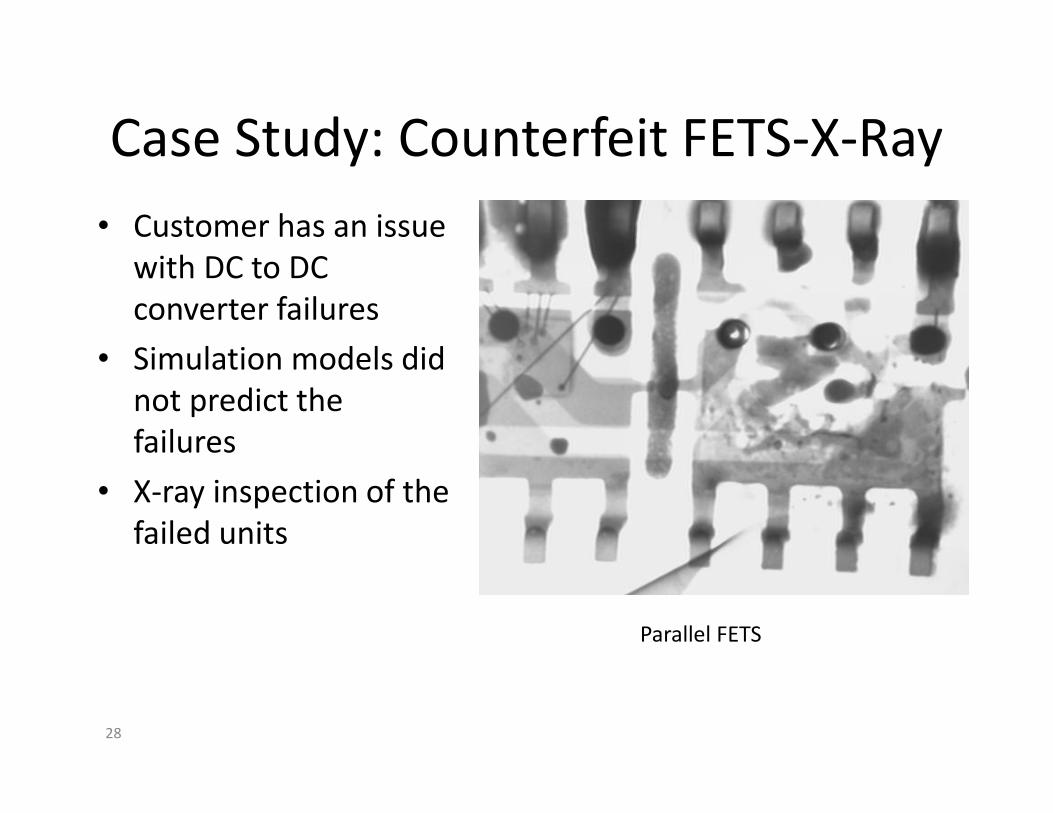
Case Study: Counterfeit FETS-X-Ray
• Customer has an issue
with DC to DC
converter failures
• Simulation models did
not predict the
failures
• X-ray inspection of the
failed units
Parallel FETS

29
Loose Parts
EZ609
Z436, Z536 Z536 Z536
Z536

30
Summary
This is not an STS25NH3LL Part, does not meet
resistance specifications.
Its higher drain to source resistance will cause its
parallel FET partner to carry all the current. This part is
present in the failed KT Master module
FETs with large die have similar
resistances and electrical
performance, regardless of
lead frame style
31
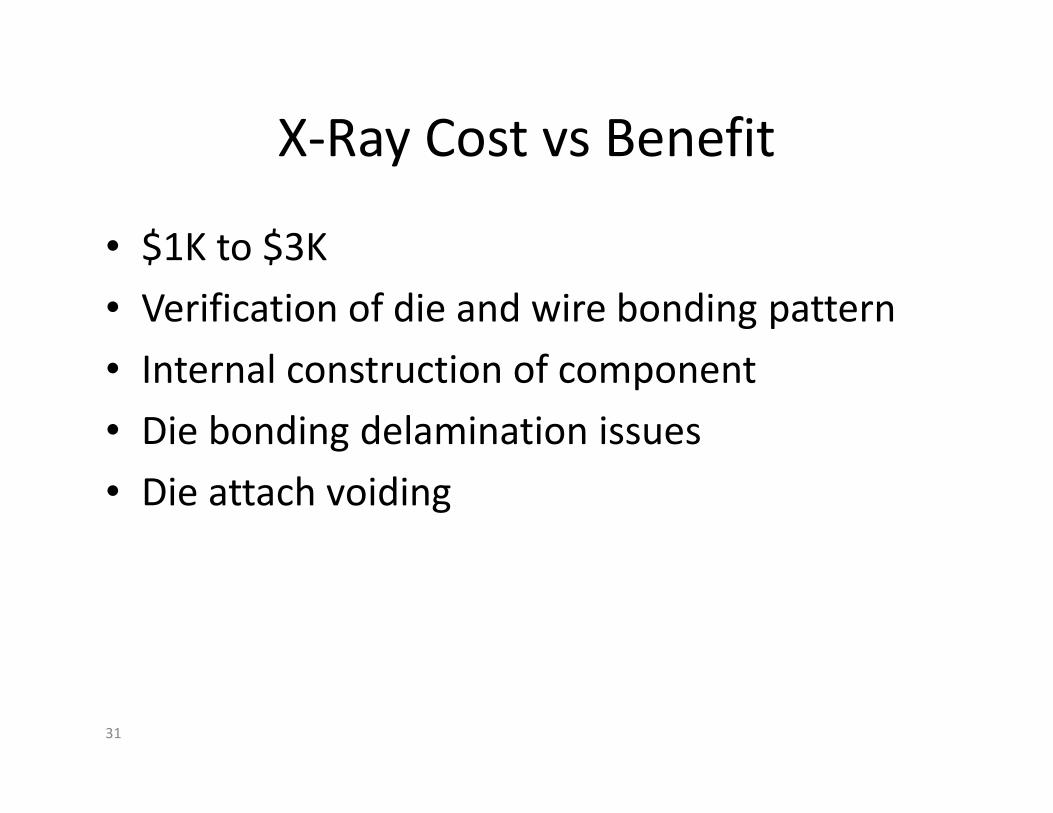
X-Ray Cost vs Benefit
• $1K to $3K
• Verification of die and wire bonding pattern
• Internal construction of component
• Die bonding delamination issues
• Die attach voiding
32
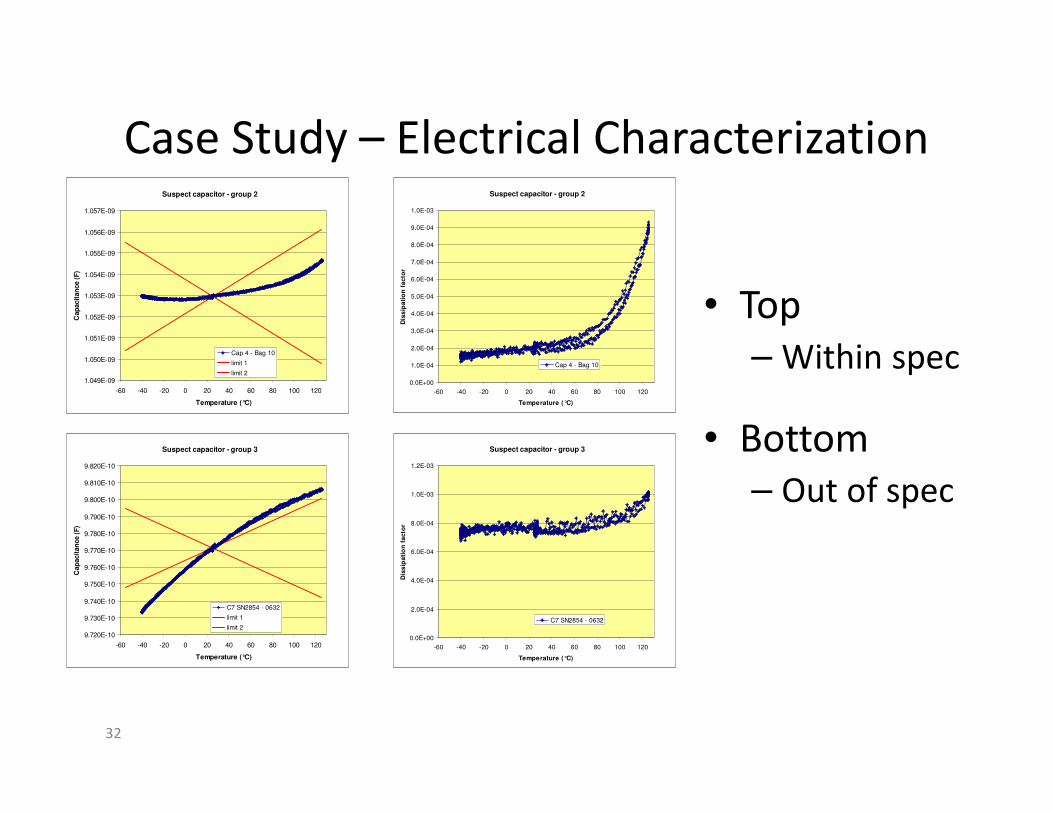
Case Study – Electrical Characterization
Suspect capacitor - group 3
9.720E-10
9.730E-10
9.740E-10
9.750E-10
9.760E-10
9.770E-10
9.780E-10
9.790E-10
9.800E-10
9.810E-10
9.820E-10
-60 -40 -20 0 20 40 60 80 100 120
Temperature (°C)
Cap
acit
an
ce (
F)
C7 SN2854 - 0632
limit 1
limit 2
Suspect capacitor - group 3
0.0E+00
2.0E-04
4.0E-04
6.0E-04
8.0E-04
1.0E-03
1.2E-03
-60 -40 -20 0 20 40 60 80 100 120
Temperature (°C)
Dis
sip
ati
on
fa
cto
r
C7 SN2854 - 0632
Suspect capacitor - group 2
1.049E-09
1.050E-09
1.051E-09
1.052E-09
1.053E-09
1.054E-09
1.055E-09
1.056E-09
1.057E-09
-60 -40 -20 0 20 40 60 80 100 120
Temperature (°C)
Cap
acit
an
ce (
F)
Cap 4 - Bag 10
limit 1
limit 2
Suspect capacitor - group 2
0.0E+00
1.0E-04
2.0E-04
3.0E-04
4.0E-04
5.0E-04
6.0E-04
7.0E-04
8.0E-04
9.0E-04
1.0E-03
-60 -40 -20 0 20 40 60 80 100 120
Temperature (°C)D
iss
ipa
tio
n f
acto
r
Cap 4 - Bag 10
• Top
– Within spec
• Bottom
– Out of spec
33
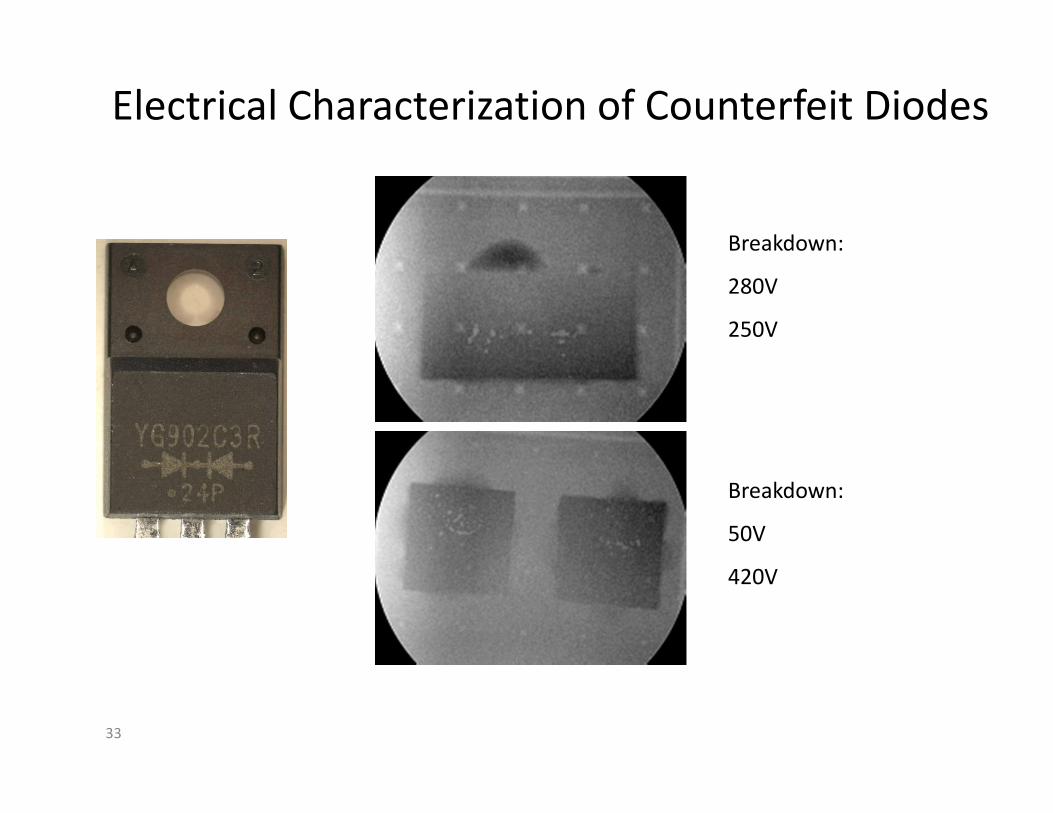
Electrical Characterization of Counterfeit Diodes
Breakdown:
280V
250V
Breakdown:
50V
420V
34
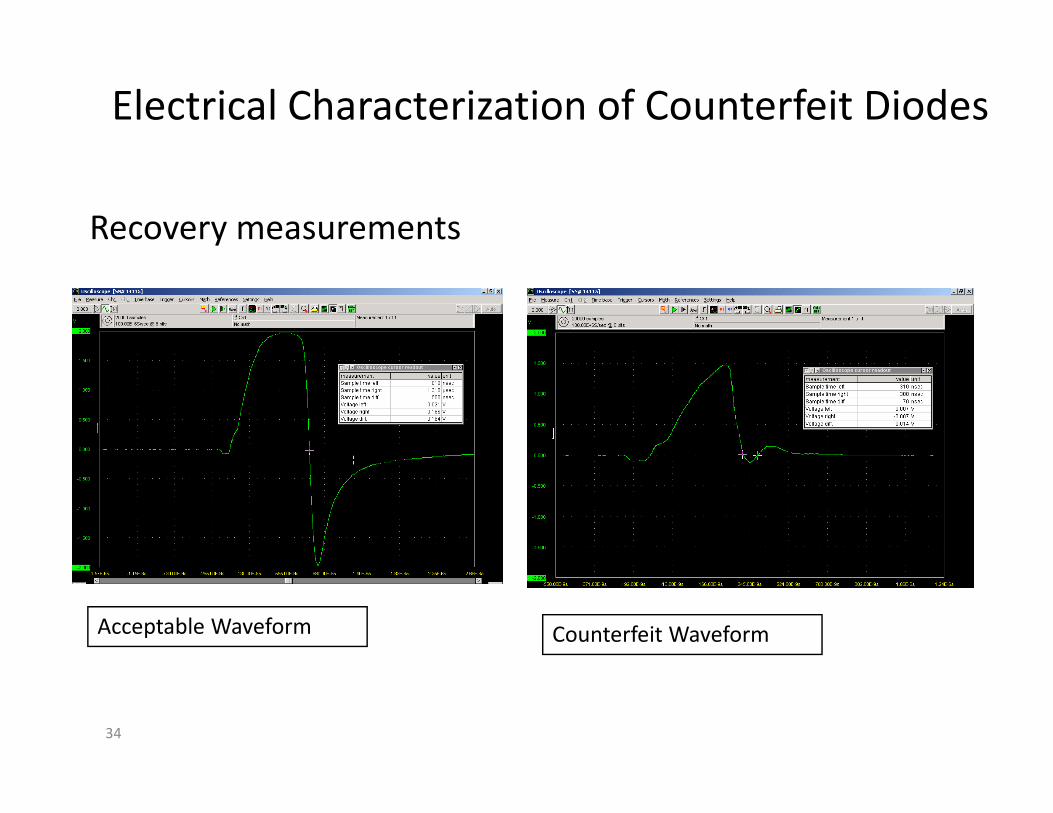
Electrical Characterization of Counterfeit Diodes
Acceptable Waveform Counterfeit Waveform
Recovery measurements

35
Electrical Characterization Cost vs. Benefit
• $3K to $6K – passives, simple actives
• One temperature for evaluation
• $15K to $80K – characterization of complex IC, fixturing, test equipment
• Potential for circuit board design, layout and fabrication costs to enable testing
• COMMENT: you can’t afford the risk associated with buying expensive ICs from unknown suppliers
36
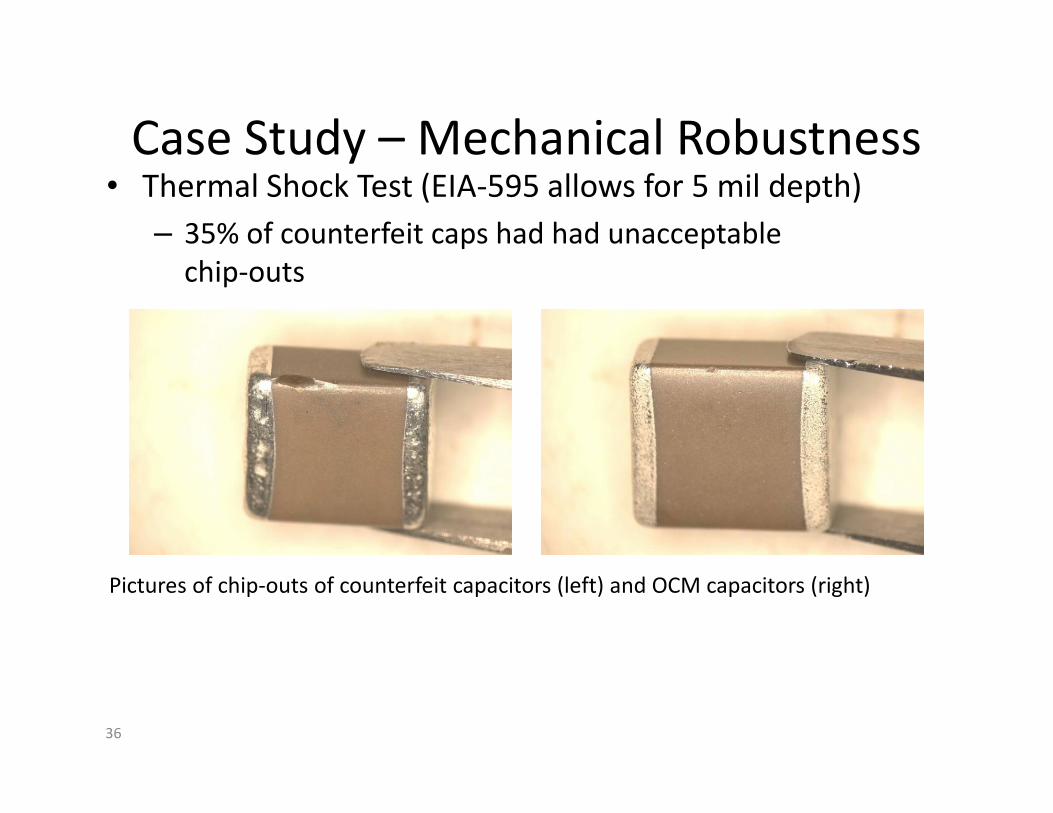
Case Study – Mechanical Robustness• Thermal Shock Test (EIA-595 allows for 5 mil depth)
– 35% of counterfeit caps had had unacceptable
chip-outs
Pictures of chip-outs of counterfeit capacitors (left) and OCM capacitors (right)
37
Mechanical Robustness-Cost vs. Benefit
• $2K to $5K
• Thermal cycling or other testing to verify
component is not counterfeit
38
DPA
• $7 to $10K passives
• $8 to $12K actives
• Step by Step analytical approach to identifying
whether a device is counterfeit using all tools
available.
39
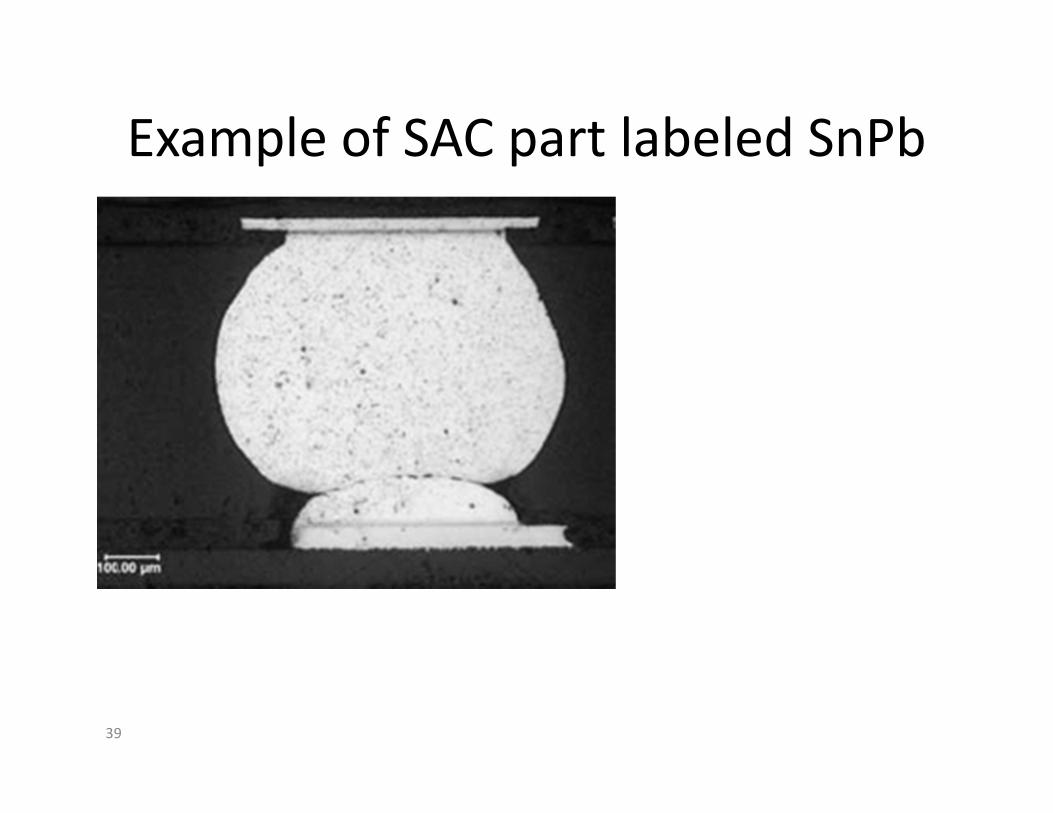
Example of SAC part labeled SnPb
40
Conclusion
• Counterfeits are a real threat and growing– Complex supply chain provides multiple entry
points
• Risk needs to be managed through a decision matrix– Probability / Mission Risk / Volumes
• Helps provide clear boundaries and guidelines for mitigation practices
• Costs are not prohibitive and should be chosen as a function of risk mitigation