cottonwood creek and tributaries, idaho water quality monitoring project, 2015 · 2019-03-10 ·...
TRANSCRIPT
Cottonwood Creek and Tributaries, Idaho Water Quality Monitoring Project, 2015
Prepared by: Alicia Helfrick and Ken Clark, Nez Perce Tribe Water Resources Division Prepared for: U.S. Environmental Protection Agency
Date: October 2017

ii
Acknowledgements This report was greatly improved from comments made by Linda Nemeth. Casey McCormack and Ryan Boylan conducted the fieldwork for this project.
iii
Table of Contents Acknowledgements ..............................................................................................................ii List of Tables ....................................................................................................................... iv
List of Figures ....................................................................................................................... v
Acronyms and Abbreviations ............................................................................................ viii Introduction ........................................................................................................................ 1
Water Quality Monitoring Program and Assessment Methodology .................................. 2
Water Quality Limited Segments .................................................................................... 2
Sampling Protocols ......................................................................................................... 2
Field Measurements ....................................................................................................... 3
Flow Measurements ....................................................................................................... 4
Quality Assurance and Quality Control (QA/QC) ............................................................ 4
Data Handling .................................................................................................................. 5
Cottonwood Creek Monitoring Overview ...................................................................... 5
Monitoring Site Descriptions .......................................................................................... 6
Cottonwood Creek Watershed Description ........................................................................ 8
Climate ............................................................................................................................ 8
Fisheries .......................................................................................................................... 8
Land Uses/Ownership ..................................................................................................... 9
Pollutants of Concern and Associated Water Quality Criteria ....................................... 9
Dissolved Oxygen ........................................................................................................ 9
Water Temperature .................................................................................................... 9
Specific Conductance ................................................................................................ 10
pH .............................................................................................................................. 10
Total Suspended Solids and Turbidity ....................................................................... 10
Nitrate+Nitrite (NO3+NO2) and Ammonia (NH3) ...................................................... 11
Phosphorus ............................................................................................................... 11
Bacteria (E. coli) ........................................................................................................ 12
Applicable Criterion/Standards and Analysis Techniques ............................................ 12
Data Analysis Results ....................................................................................................... 14
Cottonwood Creek main stem (01501A, 01508A, 01514A, 01517A). .......................... 14
01501A: Cottonwood Creek at Mouth ..................................................................... 14
01508A: Cottonwood Creek at Cottonwood Creek Road ......................................... 21
01514A: Cottonwood Creek at Tribal Allotment #1801 (TA #1801) ......................... 26
01517A: Cottonwood Creek in headwaters near Fairview Road.............................. 31
Cottonwood Creek main stem Summary:................................................................. 34
Magpie Creek (04901A, 04901B, 04903A, 11001A). .................................................... 39
Coyote Creek (01801A). ................................................................................................ 47
Star Mill Creek (07701A). .............................................................................................. 54
Pickle Canyon Creek (05903A) ...................................................................................... 58
Designated Beneficial Use Support Status ........................................................................ 63
Conclusions ....................................................................................................................... 65
Recommendations ............................................................................................................ 67
References ........................................................................................................................ 68
iv
Appendix A: Spring Creek (Nez 931) ................................................................................. 69
Appendix B: Raw Data ....................................................................................................... 73
List of Tables Table 1. Atlas of Tribal Water Resources ............................................................................ 1
Table 2. Water quality parameters for laboratory analysis ................................................ 3
Table 3. Field Measurements. ............................................................................................. 4
Table 4. General spawning and incubation periods for select salmonids found in the Clearwater River and its tributaries .............................................................................. 8
Table 5. Pollutant targets used to measure exceedances ................................................ 13
Table 6. Descriptive statistics for Cottonwood Creek at mouth (01501A), December 2014-December 2015. ................................................................................................ 14
Table 7. Continuous temperature exceedances for Cottonwood Creek (01501A) from June – December, 2015 .............................................................................................. 18
Table 8. Comparison of descriptive statistics from Cottonwood Creek (01501A), 2004 and 2015. .................................................................................................................... 18
Table 9. Descriptive statistics for Cottonwood Creek at Cottonwood Creek Road (01508A), 2015. ........................................................................................................... 21
Table 10. Continuous temperature exceedances for Cottonwood Creek at Cottonwood Creek Road (01508A) from June – December, 2015 .................................................. 25
Table 11. Descriptive statistics for Cottonwood Creek at TA #1801 (01514A), 2015. ..... 26
Table 12. Continuous temperature exceedances for Cottonwood Creek at TA #1801 (01514A) from June, 2015-February, 2016. ................................................................ 29
Table 13. Descriptive statistics for Cottonwood Creek at headwaters near Fairview Road (01517A), 2015. ........................................................................................................... 31
Table 14. Descriptive statistics for Magpie Creek at mouth (04901A), 2015. .................. 39
Table 15. Comparison of summary data from Magpie Creek (04901A), 2011 and 2015. 42
Table 16. Continuous temperature exceedances for Magpie Creek (04901A), March-October, 2015. ............................................................................................................ 45
Table 17. Descriptive statistics for Coyote Creek (01801A), 2015. .................................. 47
Table 18. Comparison of summary data from Coyote Creek monitoring (01801A), 2011 and 2015. .................................................................................................................... 49
Table 19. Continuous temperature exceedances for Coyote Creek (01801A), June-December, 2015. ......................................................................................................... 52
Table 20. Descriptive statistics for Star Mill Creek (07701A), 2015. ................................ 54
Table 21. Descriptive statistics for Pickle Canyon Creek (05903A), 2015......................... 58
Table 22. Comparison of summary data from Pickle Canyon Creek (05903A), 2011 and 2015. ........................................................................................................................... 60
Table 23. Designated beneficial use support status for assessed waterbodies. .............. 63
Table 24. Descriptive statistics for Spring Creek (Nez 931), 2015. ................................... 69
Table 25. Raw data for Cottonwood Creek at Mouth (01501A) ....................................... 73
Table 26. Raw data for Cottonwood Creek at Cottonwood Creek Road (01508A) .......... 74
v
Table 27. Raw data for Cottonwood Creek at TA #1801 (01514A) .................................. 74
Table 28. Raw data for Cottonwood Creek at the headwaters near Fairview Road (01517A) ...................................................................................................................... 75
Table 29. Raw data for Magpie Creek at Mouth (04901A) ............................................... 75
Table 30. Raw data for additional Magpie Creek sample locations ................................. 76
Table 31. Raw data for Coyote Creek at Mouth (01801A) ............................................... 76
Table 32. Raw data for Star Mill Creek at Mouth (07701A) ............................................. 77
Table 33. Raw data for Pickle Canyon Creek (05903A) ..................................................... 77
Table 34. Raw data for Spring Creek upstream of sweathouse (Nez 931) ....................... 78
List of Figures Figure 1. Cottonwood Creek Monitoring Sites, 2015 ......................................................... 7
Figure 2. Instantaneous water temperature data from Cottonwood Creek near the mouth (01501A) ................................................................................................................ 15
Figure 3. Instantaneous NO3+NO2 data from Cottonwood Creek near the mouth (01501A) ............................................................................................................................ 15
Figure 4. Instantaneous total phosphorus data from Cottonwood Creek near the mouth (01501A) ............................................................................................................................ 16
Figure 5. E. coli concentrations from Cottonwood Creek near the mouth (01501A) ...... 16
Figure 6. Continuous actual temperature data from Cottonwood Creek near the mouth (01501A), June – December, 2015 .................................................................................... 17
Figure 7. Continuous minimum, maximum, and average temperature data from Cottonwood Creek near the mouth (01501A), June – December, 2015 .......................... 17
Figure 8. Comparison of instantaneous Cottonwood Creek (01501A) data from 2004 and 2015 .................................................................................................................................. 19
Figure 9. Instantaneous temperature data from Cottonwood Creek at Cottonwood Creek Road (01508A), 2015 ........................................................................................................ 22
Figure 10. Instantaneous NO3+NO2 data from Cottonwood Creek at Cottonwood Creek Road (01508A) .................................................................................................................. 22
Figure 11. Instantaneous total phosphorus data from Cottonwood Creek at Cottonwood Creek Road (01508A) ........................................................................................................ 23
Figure 13. Continuous actual temperature data from Cottonwood Creek at Cottonwood Creek Road (01508A), June – December, 2015 ................................................................ 24
Figure 14. Continuous minimum, maximum, and average temperature data from Cottonwood Creek at Cottonwood Creek Road (01508A), June – December, 2015 ....... 24
Figure 15. Instantaneous temperature data from Cottonwood Creek at TA #1801 (01514A), 2015 .................................................................................................................. 26
Figure 16. Instantaneous NO3+NO2 data from Cottonwood Creek at TA #1801 (01514A)........................................................................................................................................... 27
Figure 17. Instantaneous total phosphorus data from Cottonwood Creek at TA #1801 (01514A) ............................................................................................................................ 27
Figure 18. E. coli concentrations from Cottonwood Creek at TA #1801 (01514A) .......... 28
vi
Figure 19. Continuous actual temperature data from Cottonwood Creek at TA #1801 (01514A), June, 2015-February, 2016 .............................................................................. 28
Figure 20. Continuous minimum, maximum, and average temperature data from Cottonwood Creek at TA #1801 (01514A), June, 2015-February, 2016 ........................... 29
Figure 21. Instantaneous temperature data from Cottonwood Creek near Fairview Road (01517A), 2015 .................................................................................................................. 31
Figure 22. Instantaneous NO3+NO2 data from Cottonwood Creek near Fairview Road (01517A) ............................................................................................................................ 32
Figure 23. Instantaneous total phosphorus data from Cottonwood Creek near Fairview Road (01517A) .................................................................................................................. 32
Figure 24. E. coli concentrations from Cottonwood Creek near Fairview Road (01517A)............................................................................................................................................ 33
Figure 25. Instantaneous temperature data from all monitoring sites on Cottonwood Creek, 2015. ...................................................................................................................... 34
Figure 26. Instantaneous NO3+NO2 data from all monitoring sites on Cottonwood Creek............................................................................................................................................ 35
Figure 27. Instantaneous total phosphorus data from all monitoring sites on Cottonwood Creek. ........................................................................................................... 36
Figure 28. Mean total phosphorus data from all monitoring sites on Cottonwood Creek. ........................................................................................................................................... 36
Figure 29. Ratio of orthophosphorus to total phosphorus from all sites in Cottonwood Creek ................................................................................................................................. 37
Figure 30. Percent exceedance of instantaneous parameters (temperature, nitrate+nitrite, total phosphorus, and E. coli) .................................................................. 38
Figure 31. Instantaneous temperature data from Magpie Creek, 2015. ......................... 40
Figure 32. Instantaneous NO3+NO2 data from Magpie Creek, 2015 ................................ 40
Figure 33. Instantaneous total phosphorus data from Magpie Creek, 2015 ................... 41
Figure 34. E. coli concentrations from Magpie Creek (04901A) ....................................... 42
Figure 35. Comparison of Magpie Creek (04901A) data from 2011 and 2015 ................. 43
Figure 36. Continuous temperature data from Magpie Creek (04901A), March-October, 2015 .................................................................................................................................. 44
Figure 37. Continuous minimum, maximum, and average temperature data from Magpie Creek (04901A), March-October, 2015 ............................................................................ 44
Figure 38. Instantaneous temperature data from Coyote Creek, 2015 ........................... 47
Figure 39. Instantaneous NO3+NO2 data from Coyote Creek, 2015 ................................. 48
Figure 40. Instantaneous total phosphorus data from Coyote Creek, 2015 .................... 48
Figure 41. E. coli concentrations from Coyote Creek ....................................................... 49
Figure 42. Comparison of Coyote Creek (01801A) data from 2011 and 2015 ................. 51
Figure 43. Continuous actual temperature data from Coyote Creek (01801A), June-December, 2015 ................................................................................................................ 52
Figure 44. Continuous minimum, maximum, and average temperature data from Coyote Creek (01801A), June-December, 2015 ............................................................................ 52
Figure 45. Instantaneous temperature data from Star Mill Creek, 2015 ......................... 54
Figure 46. Instantaneous NO3+NO2 data from Star Mill Creek, 2015 ............................... 55
vii
Figure 47. Instantaneous total phosphorus data from Star Mill Creek, 2015 .................. 55
Figure 48. E. coli concentrations from Star Mill Creek ..................................................... 56
Figure 49. Instantaneous temperature data from Pickle Canyon Creek, 2015 ................ 58
Figure 50. Instantaneous NO3+NO2 data from Pickle Canyon Creek, 2015 ...................... 59
Figure 51. Instantaneous total phosphorus data from Pickle Canyon Creek, 2015 ......... 59
Figure 52. E. coli concentrations from Pickle Canyon Creek, 2015 .................................. 60
Figure 53. Comparison of Pickle Canyon Creek (05903A) data from 2011 and 2015 ...... 61
Figure 54. Instantaneous water temperature data from Spring Creek, 2015 .................. 70
Figure 55. NO3+NO2 data from Spring Creek, 2015 .......................................................... 70
Figure 56. Total Phosphorus data from Spring Creek, 2015 ............................................. 71
Figure 57. E. coli concentrations from Spring Creek, 2015 ............................................... 71
viii
Acronyms and AbbreviationsBMP(s) Best Management Practices BOR Bureau of Reclamation C Celsius cfs Cubic Feet per Second cfu Colony Forming Units cm Centimeter(s) CMC Criterion Maximum
Concentration CWA Clean Water Act CWAL Cold Water Aquatic Life IDEQ Idaho Department of
Environmental Quality DO Dissolved Oxygen EPA Environmental Protection
Agency GIS Geographical Information
Systems HUC Hydrologic Unit Code IDAPA Idaho Administrative
Procedure Act mg/L Milligrams per Liter MPN Most Probable Number NH3 Ammonia NO3+NO2 Nitrate-Nitrite NPT Nez Perce Tribe
NRCS Natural Resources Conservation Service
NTU Nephelometric Turbidity
Unit OP Ortho Phosphorus PCR Primary Contact Recreation QAPP Quality Assurance Project
Plan QA/QC Quality Assurance/Quality
Control SCC Soil Conservation
Commission SS Salmonid Spawning SWCD Soil and Water
Conservation District TAS Treatment in a Manner
Similar to a State TDS Total Dissolved Solids TMDL Total Maximum Daily Load TP Total Phosphorus Tribe Nez Perce Tribe TSS Total Suspended Solids USGS US Geological Survey WAG Watershed Advisory Group WRD Water Resources Division
1
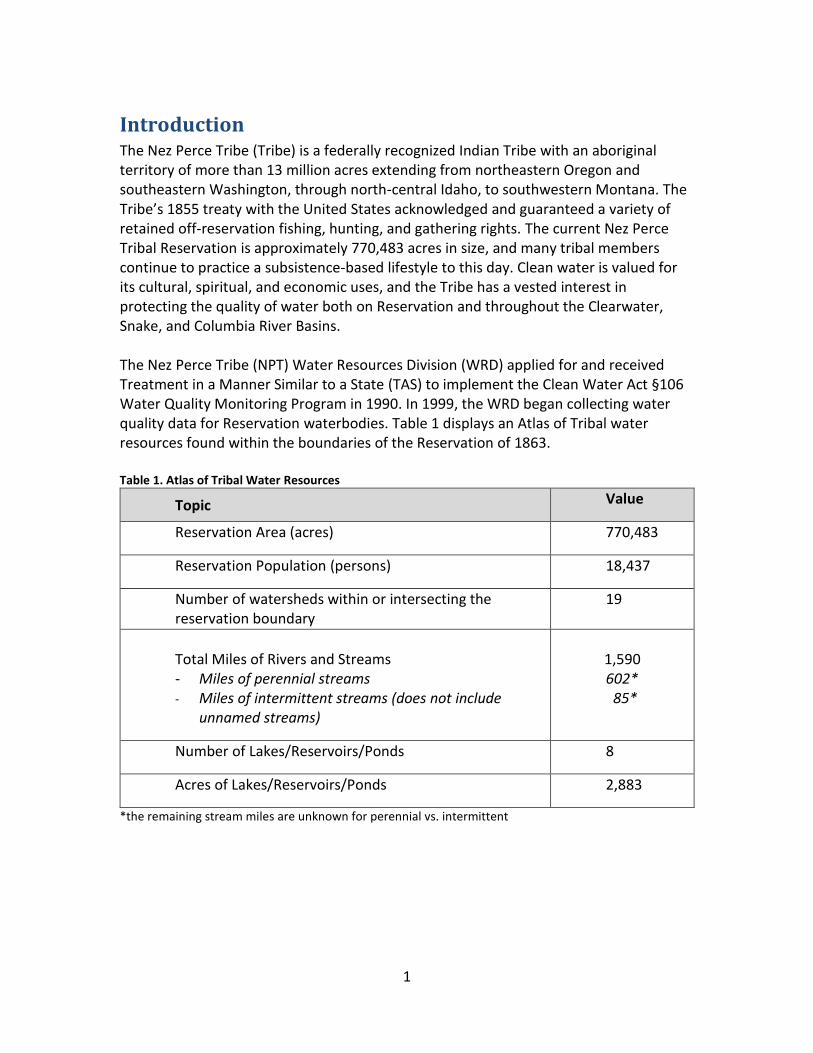
Introduction The Nez Perce Tribe (Tribe) is a federally recognized Indian Tribe with an aboriginal territory of more than 13 million acres extending from northeastern Oregon and southeastern Washington, through north-central Idaho, to southwestern Montana. The Tribe’s 1855 treaty with the United States acknowledged and guaranteed a variety of retained off-reservation fishing, hunting, and gathering rights. The current Nez Perce Tribal Reservation is approximately 770,483 acres in size, and many tribal members continue to practice a subsistence-based lifestyle to this day. Clean water is valued for its cultural, spiritual, and economic uses, and the Tribe has a vested interest in protecting the quality of water both on Reservation and throughout the Clearwater, Snake, and Columbia River Basins. The Nez Perce Tribe (NPT) Water Resources Division (WRD) applied for and received Treatment in a Manner Similar to a State (TAS) to implement the Clean Water Act §106 Water Quality Monitoring Program in 1990. In 1999, the WRD began collecting water quality data for Reservation waterbodies. Table 1 displays an Atlas of Tribal water resources found within the boundaries of the Reservation of 1863. Table 1. Atlas of Tribal Water Resources
Topic Value
Reservation Area (acres) 770,483
Reservation Population (persons) 18,437
Number of watersheds within or intersecting the reservation boundary
19
Total Miles of Rivers and Streams - Miles of perennial streams - Miles of intermittent streams (does not include
unnamed streams)
1,590 602* 85*
Number of Lakes/Reservoirs/Ponds 8
Acres of Lakes/Reservoirs/Ponds 2,883
*the remaining stream miles are unknown for perennial vs. intermittent
2
Water Quality Monitoring Program and Assessment Methodology The purpose of the Nez Perce Tribal water quality monitoring and assessment program is to determine whether water quality criteria are being met and designated uses are being supported in waterbodies across the reservation. Establishing a baseline of water quality condition for all reservation waters and periodically reassessing the water quality to look at trends are important program objectives, as is utilizing water quality data to identify waters in need of pollutant reduction projects.
Water Quality Limited Segments
The Clean Water Act (CWA) requires restoration and maintenance of the chemical, physical, and biological integrity of the nation’s water (Public Law 92-500 Federal Water Pollution Control Act Amendments of 1972). Section §303(d) of the CWA establishes requirements for states and tribes to identify and prioritize waterbodies that are water quality limited (i.e., do not meet water quality standards). Cottonwood Creek was listed on the State of Idaho’s 1998 303(d) list for bacteria, dissolved oxygen (DO), flow alteration, habitat alteration, ammonia, nutrients, organics, and sediment.
Sampling Protocols
WRD staff have a Quality Assurance Project Plan (QAPP) which has been reviewed and approved by the US Environmental Protection Agency (EPA). WRD staff follow methods and protocols found in the US Geological Survey (USGS) National Field Manual for the Collection of Water Quality Data (TWRI Book 9, 1999-2004) when collecting water quality data in Reservation waters. Approximately four liters of stream water were collected at each site, using a DH-48 depth-integrating suspended-sediment sampler. The samples were collected and transferred into a 2.5-gallon polyethylene churn splitter. The polyethylene churn splitter was rinsed with ambient water at each location prior to sample collection. The resultant composite sample was thoroughly homogenized before filling the appropriate sample containers. Water quality samples were then shipped to Boise, ID overnight to be analyzed at the Bureau of Reclamation (BOR) Pacific Northwest Regional Laboratory. Bacteriological samples (E. coli) were collected directly from the thalweg into sterile sample containers. These samples were also shipped to Boise, ID overnight to be analyzed at the BOR Pacific Northwest Regional Laboratory where most probable number (MPN) multiple tube fermentation was used to determine E. coli levels in the water sample. Bacteriological samples were also analyzed at the WRD lab using a Colilert reactive agent and 97 well trays cooked at 35°C for 24 hours.
3
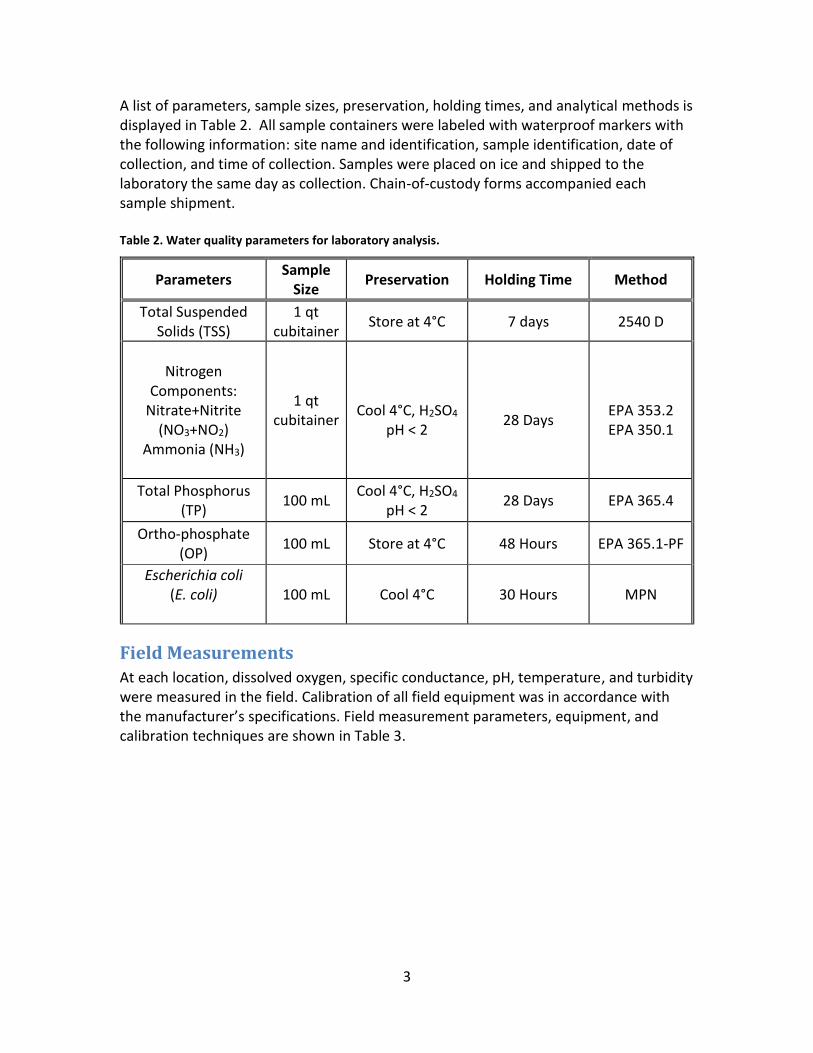
A list of parameters, sample sizes, preservation, holding times, and analytical methods is displayed in Table 2. All sample containers were labeled with waterproof markers with the following information: site name and identification, sample identification, date of collection, and time of collection. Samples were placed on ice and shipped to the laboratory the same day as collection. Chain-of-custody forms accompanied each sample shipment. Table 2. Water quality parameters for laboratory analysis.
Field Measurements
At each location, dissolved oxygen, specific conductance, pH, temperature, and turbidity were measured in the field. Calibration of all field equipment was in accordance with the manufacturer’s specifications. Field measurement parameters, equipment, and calibration techniques are shown in Table 3.
Parameters Sample
Size Preservation Holding Time Method
Total Suspended Solids (TSS)
1 qt cubitainer
Store at 4°C 7 days 2540 D
Nitrogen
Components: Nitrate+Nitrite
(NO3+NO2) Ammonia (NH3)
1 qt cubitainer
Cool 4°C, H2SO4
pH < 2
28 Days
EPA 353.2 EPA 350.1
Total Phosphorus (TP)
100 mL Cool 4°C, H2SO4
pH < 2 28 Days EPA 365.4
Ortho-phosphate (OP)
100 mL Store at 4°C 48 Hours EPA 365.1-PF
Escherichia coli (E. coli)
100 mL Cool 4°C 30 Hours MPN
4
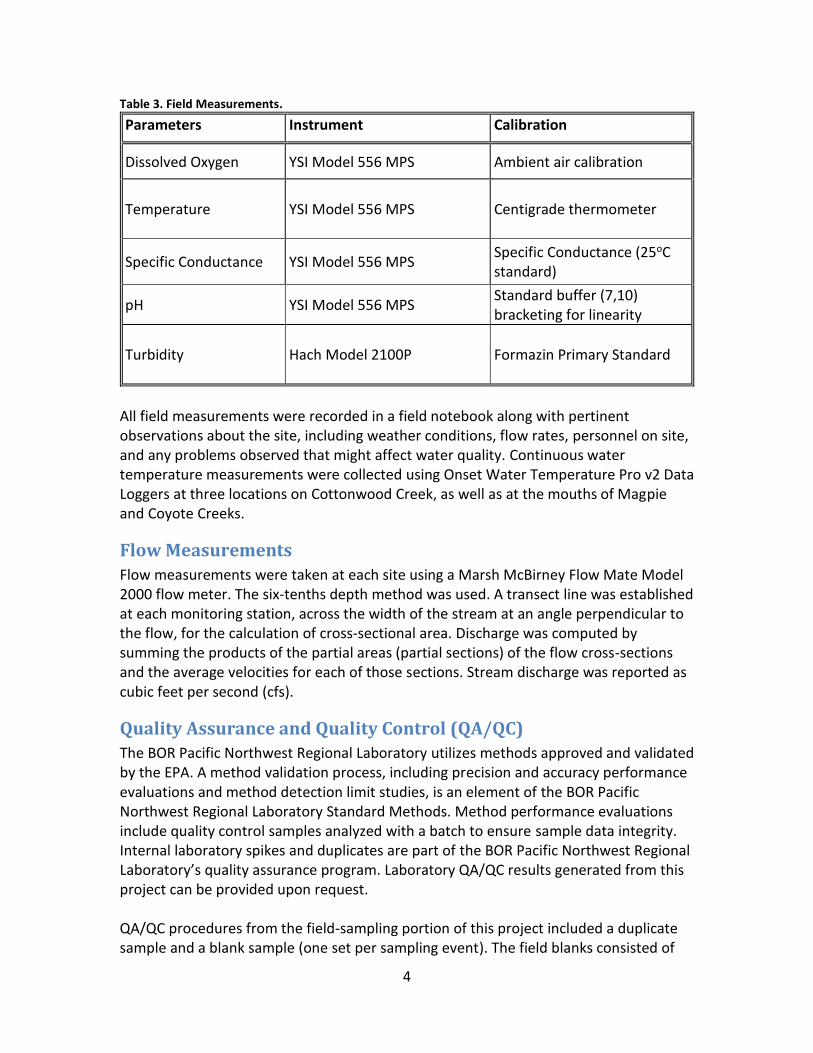
Table 3. Field Measurements.
Parameters Instrument Calibration
Dissolved Oxygen YSI Model 556 MPS Ambient air calibration
Temperature
YSI Model 556 MPS Centigrade thermometer
Specific Conductance YSI Model 556 MPS Specific Conductance (25oC standard)
pH YSI Model 556 MPS Standard buffer (7,10) bracketing for linearity
Turbidity Hach Model 2100P Formazin Primary Standard
All field measurements were recorded in a field notebook along with pertinent observations about the site, including weather conditions, flow rates, personnel on site, and any problems observed that might affect water quality. Continuous water temperature measurements were collected using Onset Water Temperature Pro v2 Data Loggers at three locations on Cottonwood Creek, as well as at the mouths of Magpie and Coyote Creeks.
Flow Measurements
Flow measurements were taken at each site using a Marsh McBirney Flow Mate Model 2000 flow meter. The six-tenths depth method was used. A transect line was established at each monitoring station, across the width of the stream at an angle perpendicular to the flow, for the calculation of cross-sectional area. Discharge was computed by summing the products of the partial areas (partial sections) of the flow cross-sections and the average velocities for each of those sections. Stream discharge was reported as cubic feet per second (cfs).
Quality Assurance and Quality Control (QA/QC) The BOR Pacific Northwest Regional Laboratory utilizes methods approved and validated by the EPA. A method validation process, including precision and accuracy performance evaluations and method detection limit studies, is an element of the BOR Pacific Northwest Regional Laboratory Standard Methods. Method performance evaluations include quality control samples analyzed with a batch to ensure sample data integrity. Internal laboratory spikes and duplicates are part of the BOR Pacific Northwest Regional Laboratory’s quality assurance program. Laboratory QA/QC results generated from this project can be provided upon request. QA/QC procedures from the field-sampling portion of this project included a duplicate sample and a blank sample (one set per sampling event). The field blanks consisted of
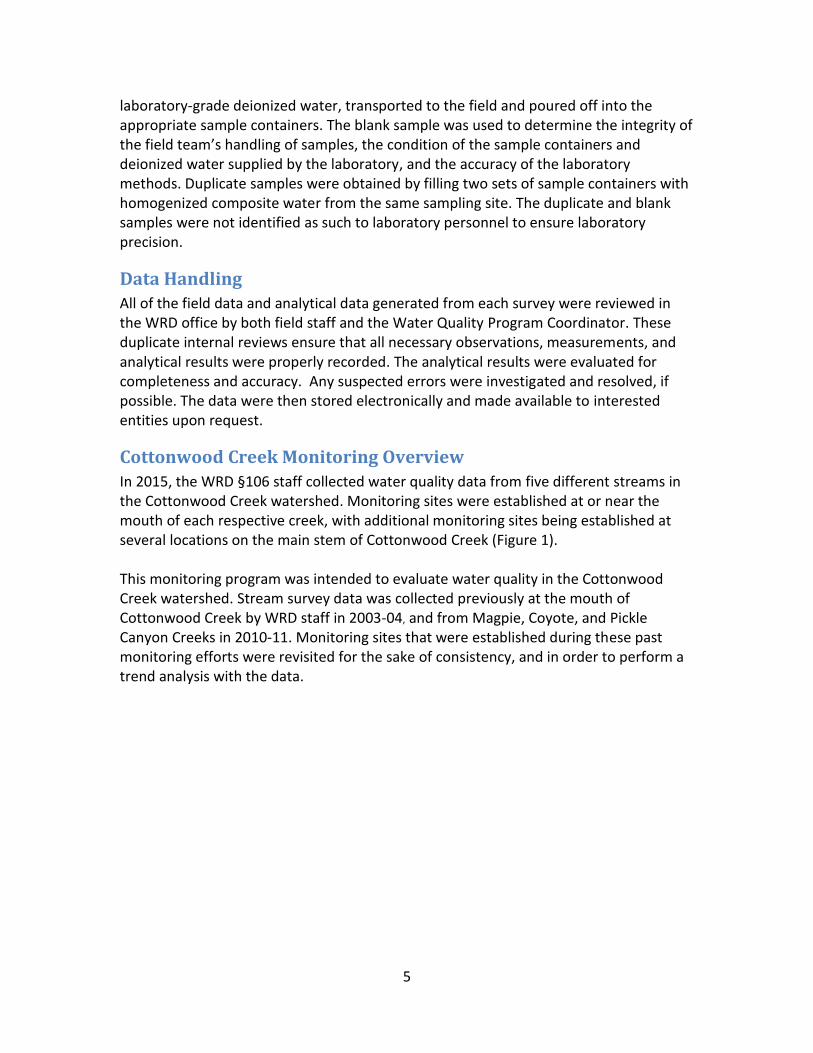
5
laboratory-grade deionized water, transported to the field and poured off into the appropriate sample containers. The blank sample was used to determine the integrity of the field team’s handling of samples, the condition of the sample containers and deionized water supplied by the laboratory, and the accuracy of the laboratory methods. Duplicate samples were obtained by filling two sets of sample containers with homogenized composite water from the same sampling site. The duplicate and blank samples were not identified as such to laboratory personnel to ensure laboratory precision.
Data Handling All of the field data and analytical data generated from each survey were reviewed in the WRD office by both field staff and the Water Quality Program Coordinator. These duplicate internal reviews ensure that all necessary observations, measurements, and analytical results were properly recorded. The analytical results were evaluated for completeness and accuracy. Any suspected errors were investigated and resolved, if possible. The data were then stored electronically and made available to interested entities upon request.
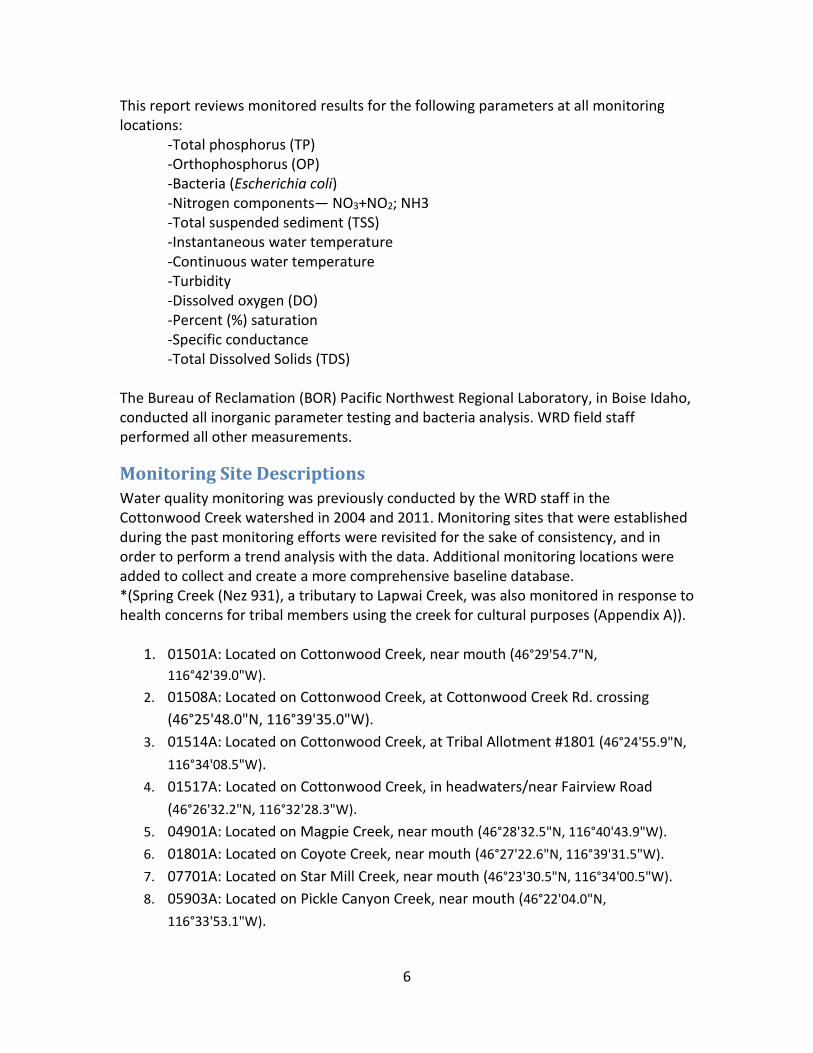
Cottonwood Creek Monitoring Overview
In 2015, the WRD §106 staff collected water quality data from five different streams in the Cottonwood Creek watershed. Monitoring sites were established at or near the mouth of each respective creek, with additional monitoring sites being established at several locations on the main stem of Cottonwood Creek (Figure 1). This monitoring program was intended to evaluate water quality in the Cottonwood Creek watershed. Stream survey data was collected previously at the mouth of Cottonwood Creek by WRD staff in 2003-04, and from Magpie, Coyote, and Pickle Canyon Creeks in 2010-11. Monitoring sites that were established during these past monitoring efforts were revisited for the sake of consistency, and in order to perform a trend analysis with the data.
6
This report reviews monitored results for the following parameters at all monitoring locations: -Total phosphorus (TP) -Orthophosphorus (OP) -Bacteria (Escherichia coli) -Nitrogen components— NO3+NO2; NH3 -Total suspended sediment (TSS) -Instantaneous water temperature -Continuous water temperature -Turbidity -Dissolved oxygen (DO) -Percent (%) saturation -Specific conductance -Total Dissolved Solids (TDS) The Bureau of Reclamation (BOR) Pacific Northwest Regional Laboratory, in Boise Idaho, conducted all inorganic parameter testing and bacteria analysis. WRD field staff performed all other measurements.
Monitoring Site Descriptions
Water quality monitoring was previously conducted by the WRD staff in the Cottonwood Creek watershed in 2004 and 2011. Monitoring sites that were established during the past monitoring efforts were revisited for the sake of consistency, and in order to perform a trend analysis with the data. Additional monitoring locations were added to collect and create a more comprehensive baseline database. *(Spring Creek (Nez 931), a tributary to Lapwai Creek, was also monitored in response to health concerns for tribal members using the creek for cultural purposes (Appendix A)).
1. 01501A: Located on Cottonwood Creek, near mouth (46°29'54.7"N,
116°42'39.0"W).
2. 01508A: Located on Cottonwood Creek, at Cottonwood Creek Rd. crossing
(46°25'48.0"N, 116°39'35.0"W).
3. 01514A: Located on Cottonwood Creek, at Tribal Allotment #1801 (46°24'55.9"N,
116°34'08.5"W).
4. 01517A: Located on Cottonwood Creek, in headwaters/near Fairview Road
(46°26'32.2"N, 116°32'28.3"W).
5. 04901A: Located on Magpie Creek, near mouth (46°28'32.5"N, 116°40'43.9"W).
6. 01801A: Located on Coyote Creek, near mouth (46°27'22.6"N, 116°39'31.5"W).
7. 07701A: Located on Star Mill Creek, near mouth (46°23'30.5"N, 116°34'00.5"W).
8. 05903A: Located on Pickle Canyon Creek, near mouth (46°22'04.0"N,
116°33'53.1"W).
7
Figure 1. Cottonwood Creek Water Quality Monitoring Sites, 2015
8
Cottonwood Creek Watershed Description The Cottonwood Creek watershed (42,700 acres) is located in Nez Perce County and is entirely within the Nez Perce Reservation. The creek originates near Reubens and flows predominantly north for 16 miles before discharging into the Clearwater River near the town of Myrtle. There are four major tributaries to Cottonwood creek: Coyote Creek and Magpie Creek in the lower reaches of the watershed, and Pickle Canyon Creek and Star Mill Creek in the upper reaches. The watershed is composed of upland plateau and steep canyon habitat, with elevations ranging from 853 feet at the confluence with the Clearwater River to 3,642 feet in the uplands. Evidence of frequent high flows and flooding are present from river mile 6 to river mile 9 (Fales et al. 2012). The dominant land use in Cottonwood Creek watershed is agriculture (61% cropland), with areas of meadow/pastureland (16%) and coniferous forest lands (16%) (Fales et al. 2012). Numerous residences are present in the lower 4 km of the stream where very little overhead canopy is present and grazing is generally heavy. Historically, logging has taken place in the drainage and several old logging roads remain (Kucera 1986). The community of Gifford is located in the upper watershed.
Climate
The Cottonwood Creek watershed is characterized by winter rains and rain-on-snow runoff events. The climate is sub-humid, with cool moist winters and warm dry summers. The average annual precipitation for the drainage ranges from 21 near the mouth to 29 inches in the headwaters (Fales et al. 2012).
Fisheries
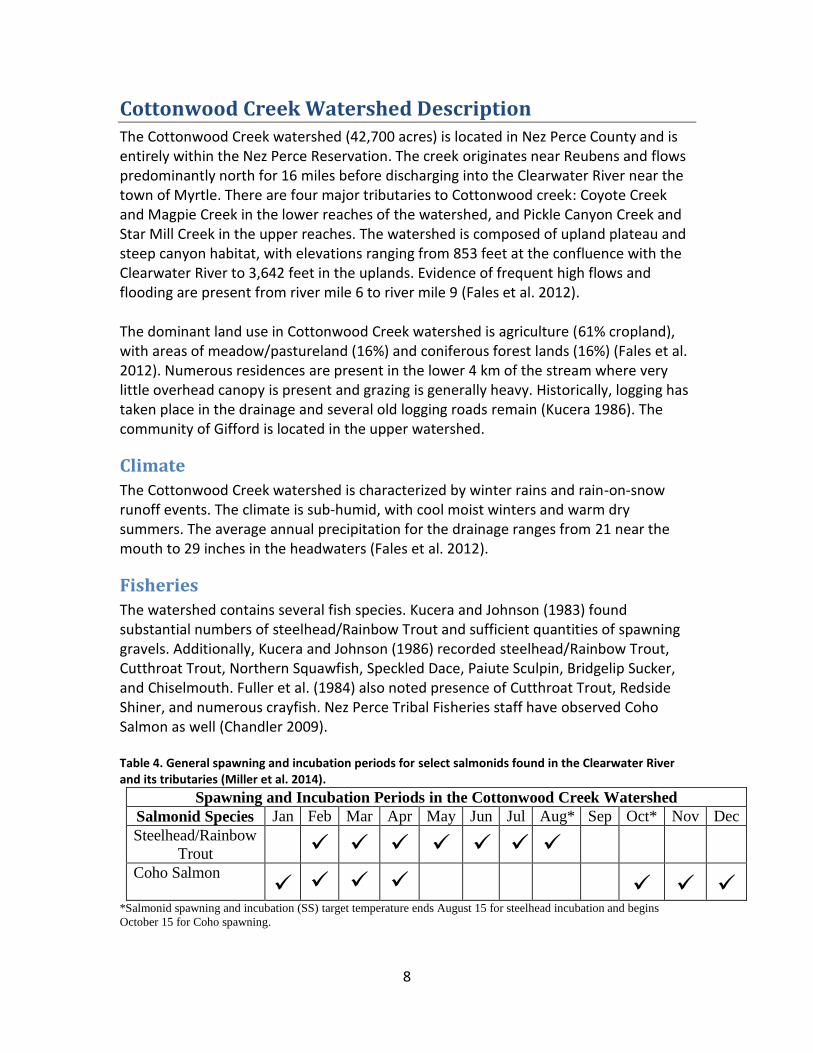
The watershed contains several fish species. Kucera and Johnson (1983) found substantial numbers of steelhead/Rainbow Trout and sufficient quantities of spawning gravels. Additionally, Kucera and Johnson (1986) recorded steelhead/Rainbow Trout, Cutthroat Trout, Northern Squawfish, Speckled Dace, Paiute Sculpin, Bridgelip Sucker, and Chiselmouth. Fuller et al. (1984) also noted presence of Cutthroat Trout, Redside Shiner, and numerous crayfish. Nez Perce Tribal Fisheries staff have observed Coho Salmon as well (Chandler 2009). Table 4. General spawning and incubation periods for select salmonids found in the Clearwater River and its tributaries (Miller et al. 2014).
Spawning and Incubation Periods in the Cottonwood Creek Watershed
Salmonid Species Jan Feb Mar Apr May Jun Jul Aug* Sep Oct* Nov Dec
Steelhead/Rainbow
Trout
Coho Salmon
*Salmonid spawning and incubation (SS) target temperature ends August 15 for steelhead incubation and begins
October 15 for Coho spawning.
9
Land Uses/Ownership
The Cottonwood Creek watershed is entirely within the Nez Perce Reservation; however, more than 86% of the watershed is privately owned. The predominant land use in the catchment is agriculture, with about 25,000 acres in cropland, which constitutes 60% of the watershed. The major crops grown are winter wheat and spring cereal grains. Forested areas currently comprise about 6,400 acres, or 16%, of the land in the watershed. Grazing occurs throughout the watershed with the majority of rangeland grazing occurring in the canyon lands and pastured cattle being found in the meadows located closer to the headwaters (Fales et al. 2012).
Pollutants of Concern and Associated Water Quality Criteria
Dissolved Oxygen
Dissolved oxygen (DO) is found in microscopic bubbles of oxygen that are mixed in the water and occur between water molecules. DO is a very important indicator of a waterbody's ability to support aquatic life. Fish "breathe" by absorbing dissolved oxygen through their gills. Oxygen enters the water by absorption directly from the atmosphere or via photosynthesis by aquatic plants and algae. Oxygen is removed from the water by respiration and decomposition of organic matter. The US Environmental Protection Agency (EPA) standard for DO states that dissolved oxygen must exceed 8.0 mg/L for cold water biota, and in addition must exceed 90% saturation during the salmonid spawning and incubation (SS) designated period.
Water Temperature
Water temperature is a very important indicator of overall water quality. Many of the physical, biological, and chemical characteristics of a waterbody are directly affected by temperature. For example, temperature influences the following:
- amount of oxygen that can be dissolved in water, - photosynthetic rate of algae and larger aquatic plants, - metabolic rates of aquatic organisms, and - sensitivity of organisms to toxic wastes, parasites, and diseases.
Cool water can hold more oxygen than warm water because gases are more easily dissolved in cool water. The reduction of oxygen solubility at high water temperatures can compound the stress on fish caused by marginal dissolved oxygen concentrations. The cold water aquatic life (CWAL) criteria for Idaho streams states that water temperatures must be 22°C or less with a maximum daily average of no greater than 19°C (IDAPA 58.01.02.250.02.b). All of the waterbodies monitored during this project are also listed for salmonid spawning (SS), which means that daily maximum water temperatures must be 13°C or less with a maximum daily average no greater than 9°C during salmonid spawning and incubation periods (IDAPA 58.01.02.250.02.f.ii). For the
10
analytical purposes of this report the salmonid spawning and incubation period will be considered from October 15 through August 14 (Miller et al. 2014) (Table 4).
Specific Conductance
Specific conductance is a measure of the ability of water to conduct an electrical current. Conductivity increases with increasing concentrations and mobility of dissolved ions. These ions, which come from the breakdown of compounds, conduct electricity because they are negatively or positively charged when dissolved in water. Therefore, conductivity is an indirect measure of the presence of dissolved solids such as chloride, nitrate, sulfate, phosphate, sodium, magnesium, calcium, and iron, and can be used as an indicator of water pollution. No surface water standards or criteria exist that set limits on SC.
pH
pH represents the effective concentration (activity) of hydrogen ions (H+) in water. The activity of hydrogen ions can be expressed most conveniently in logarithmic units. pH is defined as the negative logarithm of the activity of H+ ions:
pH = -log [H+], where [H+] is the concentration of H+ ions in moles per liter.
The State of Idaho surface water quality criteria for Aquatic Life Use designations state that Hydrogen Ion Concentration (pH) values must fall within the range of 6.5-9.0 (IDAPA 58.01.02.250.01.a).
Total Suspended Solids and Turbidity
Total suspended solids (TSS) includes both sediment and organic material suspended in water. Suspended sediment can cause problems for fish by clogging gills. In addition, excessive sediment provides a medium for the accumulation and transport of other constituents such as phosphorus and bacteria. Literature suggests that levels below 25 mg/L are ideal for the protection of fisheries and produce no harmful effects on fish or fisheries (DFO 2000). This was the target criterion that was used for data analysis. The State of Idaho water quality standard for Turbidity states that measurements shall not exceed background turbidity by more than 50 nephelometric turbidity units (NTU) instantaneously or more than 25 NTU for more than ten consecutive days (IDAPA 58.01.02.250.02.e). The 25th percentile of turbidity data collected by EPA over the last decade for Ecoregion 10, ecoregion III was 1.45 NTU (US EPA 2000). So, for the sake of this analysis, any reading over 51.45 NTU will be considered an exceedance over background turbidity levels.
11
Nitrate+Nitrite (NO3+NO2) and Ammonia (NH3)
Nitrate (NO3), nitrite (NO2), and ammonia (NH3) are considered inorganic forms of nitrogen. Excessive concentrations of nitrate and/or nitrite can be harmful to humans and wildlife. The EPA Ecoregion guidance criterion for NO3 + NO2 is 0.072 mg/L (US EPA 2000). The target for the analysis of the data in this report is 0.3 mg/L, which is thought to be more representative of conditions on the ground and was the target criterion used in several regional watershed TMDLs. High concentrations of nitrate and/or nitrite can produce "brown blood disease" in fish. Nitrite enters the bloodstream through the gills and turns the blood a chocolate-brown color. As in humans, nitrite reacts with hemoglobin to form methemoglobin. Brown blood cannot carry sufficient amounts of oxygen, and affected fish can suffocate despite adequate oxygen concentration in the water. This accounts for the gasping behavior often observed in fish with brown blood disease, even when oxygen levels are relatively high (Mississippi State University, 1998). Ammonia is the least stable form of nitrogen in water. Ammonia concentrations can affect hatching and growth rates of fish; changes in tissues of gills, liver, and kidneys may occur during structural development. The target criterion for ammonia for this report is not to exceed the calculated criterion maximum concentration (CMC), which is dependent on pH (IDAPA 58.01.02.250.02.d.i).
Phosphorus
In freshwater lakes and rivers, phosphorus is often found to be the growth-limiting nutrient because it occurs in the least amount relative to the needs of plants. If excessive amounts of phosphorus and nitrogen are added to the water, algae and aquatic plants can be produced in large quantities. When these algae die, bacteria decompose them and use up oxygen. As a result, dissolved oxygen concentrations can drop too low for fish to breathe, leading to fish kills. The loss of oxygen in the bottom waters can free phosphorus previously trapped in the sediments, further increasing the available phosphorus. Phosphorus can exist in inorganic and organic forms, as well as in a dissolved or particulate phase. Some important sources of phosphorus include commercial fertilizers and manure, land application of biosolids, wastewater treatment plant effluent, erosion from livestock grazing, non-agricultural fertilization, and septic systems. Dissolved inorganic phosphorus, or Orthophosphorus (OP), is a component of the total phosphorus concentration and can be detected separately. Primary sources of OP in aquatic systems are from agricultural run-off, lawn pesticides, and raw sewage. OP is of particular concern in aquatic systems as it is in the form that algae and plants can take up directly. The ratio of Orthophosphorus/Total phosphorus can help determine potential sources of pollution and to what extent they are occurring.
12
The EPA Ecoregion guidance criterion for phosphorus is 0.03 mg/L (US EPA 2000). The target for the analysis of the data in this report is 0.1 mg/L, which is thought to be more representative of conditions on the ground and was the target criterion used in several regional watershed TMDLs.
Bacteria (E. coli)
The coliform bacteria group consists of several genera of bacteria belonging to the family Enterobacteriaceae. These mostly harmless bacteria live in soil, water, and the digestive system of animals. Escherichia coli (E. coli) is a type of fecal coliform bacteria commonly found in the intestines of animals and humans. The presence of E. coli in water is a strong indication of recent sewage or animal waste contamination. The State of Idaho E. coli standard for primary contact is not to exceed 406 colony forming units (cfu)/100 mL at any time and not to exceed 576 cfu/100 mL at any time for secondary contact (IDAPA 58.01.02.251.02.a); however, a single exceedance over the criterion does not constitute a violation of water quality standards (IDAPA 58.01.02.080.03). Five samples must be taken within a 30-day period to assess against the geometric mean criterion of 126 cfu/100 mL to determine a violation. An assessment of the geometric mean criterion was not conducted during this study due to time considerations and limited resources; however, the instantaneous measurements collected will allow for identification of streams where follow-up monitoring should occur. All streams on the Nez Perce Reservation were evaluated using the primary contact recreation criterion of 406 cfu/100mL. Two samples were taken at each monitoring location during each sampling event; one was analyzed in-house by NPT WRD staff and the other was shipped to the BOR lab for analysis.
Applicable Criterion/Standards and Analysis Techniques
Early studies indicate that water quality in Cottonwood Creek is limited by extreme annual stream flow variation, low summer flow, high in-stream temperatures, and lack of in-stream cover (Kucera et al. 1983). Cottonwood Creek was listed on the State of Idaho’s 1998 303(d) list for bacteria, dissolved oxygen (DO), flow alteration, habitat alteration, ammonia, nutrients, organics, and sediment. The data were analyzed, and descriptive statistics such as maximum, minimum, median, and mean values for each parameter measured were determined. The number of exceedances was calculated based on the number of sampling events whose respective values exceeded water quality targets or criteria. Parameters exceeding target criteria 10% or more of the time will be classified as “not supporting” its associated designated use.
13
The Nez Perce Tribe does not have approved water quality standards, so target criteria for this water quality assessment are based upon a combination of EPA guidelines, literature review, and State of Idaho water quality standards. All of the waterbodies in this assessment had the designated beneficial uses of:
- Salmonid Spawning (SS), - Cold Water Aquatic Life (CWAL), - Primary Contact Recreation (PCR), - Agricultural and industrial water supply, and - Wildlife habitat.
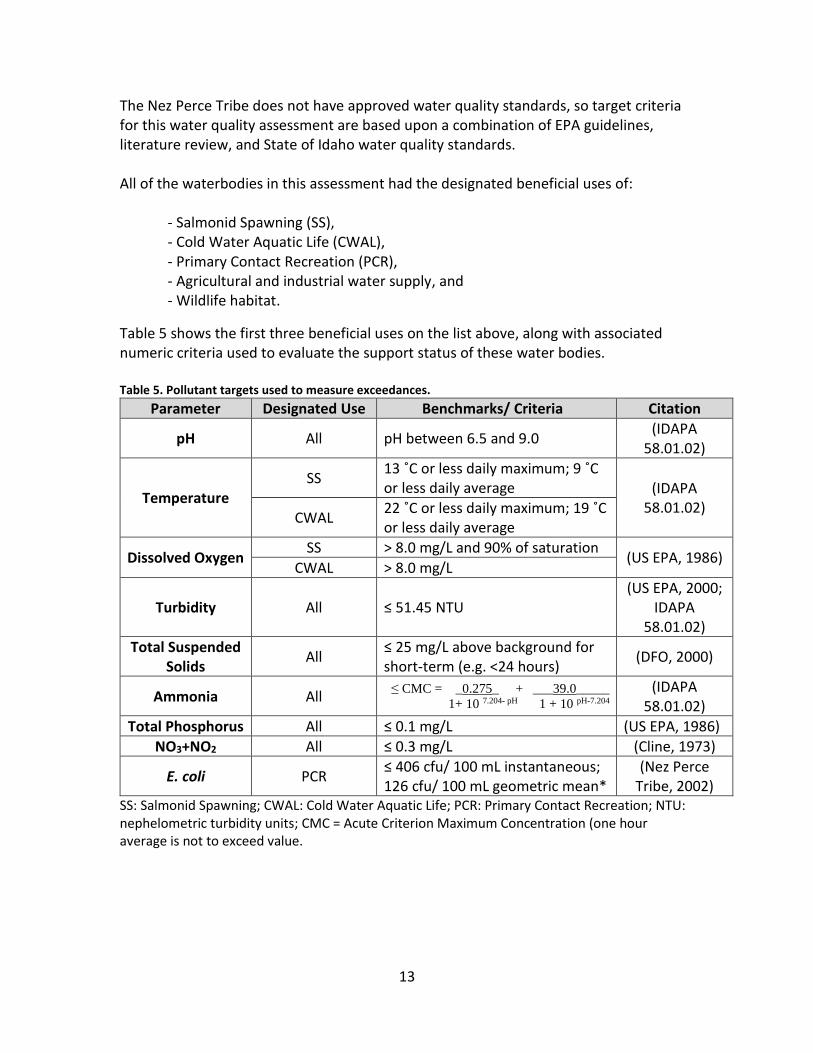
Table 5 shows the first three beneficial uses on the list above, along with associated numeric criteria used to evaluate the support status of these water bodies. Table 5. Pollutant targets used to measure exceedances.
Parameter Designated Use Benchmarks/ Criteria Citation
pH All pH between 6.5 and 9.0 (IDAPA
58.01.02)
Temperature SS
13 ˚C or less daily maximum; 9 ˚C or less daily average (IDAPA
58.01.02) CWAL
22 ˚C or less daily maximum; 19 ˚C or less daily average
Dissolved Oxygen SS > 8.0 mg/L and 90% of saturation
(US EPA, 1986) CWAL > 8.0 mg/L
Turbidity All ≤ 51.45 NTU (US EPA, 2000;
IDAPA 58.01.02)
Total Suspended Solids
All ≤ 25 mg/L above background for short-term (e.g. <24 hours)
(DFO, 2000)
Ammonia All ≤ CMC = _0.275_ + ___39.0_____
1+ 10 7.204- pH 1 + 10 pH-7.204
(IDAPA 58.01.02)
Total Phosphorus All ≤ 0.1 mg/L (US EPA, 1986)
NO3+NO2 All ≤ 0.3 mg/L (Cline, 1973)
E. coli PCR ≤ 406 cfu/ 100 mL instantaneous; 126 cfu/ 100 mL geometric mean*
(Nez Perce Tribe, 2002)
SS: Salmonid Spawning; CWAL: Cold Water Aquatic Life; PCR: Primary Contact Recreation; NTU: nephelometric turbidity units; CMC = Acute Criterion Maximum Concentration (one hour average is not to exceed value.
* Ammonia did not exceed the calculated CMC target criterion in any monitoring locations and is not included in the results.
* Raw data for all monitoring locations is located in Appendix B.
Data Analysis Results *
Cottonwood Creek – Source to Mouth (01501A, 01508A, 01514A, 01517A).
01501A: Cottonwood Creek at Mouth
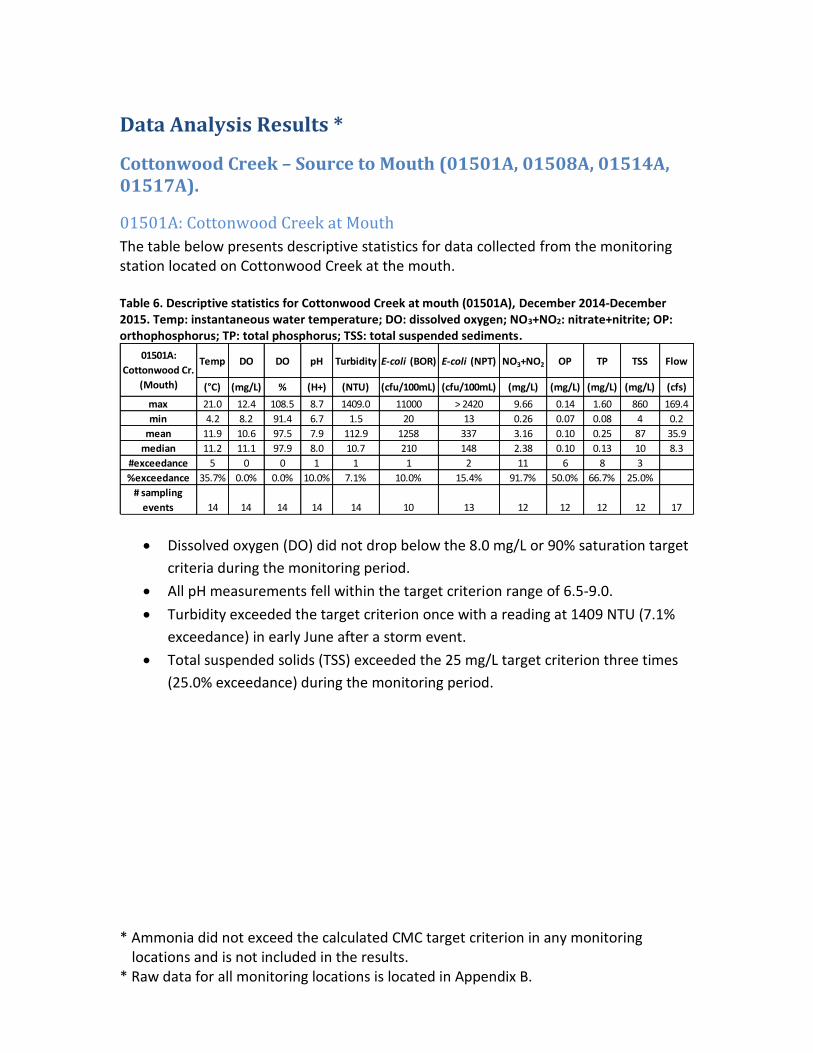
The table below presents descriptive statistics for data collected from the monitoring station located on Cottonwood Creek at the mouth. Table 6. Descriptive statistics for Cottonwood Creek at mouth (01501A), December 2014-December 2015. Temp: instantaneous water temperature; DO: dissolved oxygen; NO3+NO2: nitrate+nitrite; OP: orthophosphorus; TP: total phosphorus; TSS: total suspended sediments.
Dissolved oxygen (DO) did not drop below the 8.0 mg/L or 90% saturation target
criteria during the monitoring period.
All pH measurements fell within the target criterion range of 6.5-9.0.
Turbidity exceeded the target criterion once with a reading at 1409 NTU (7.1%
exceedance) in early June after a storm event.
Total suspended solids (TSS) exceeded the 25 mg/L target criterion three times
(25.0% exceedance) during the monitoring period.
Temp DO DO pH Turbidity E-coli (BOR) E-coli (NPT) NO3+NO2 OP TP TSS Flow
(°C) (mg/L) % (H+) (NTU) (cfu/100mL) (cfu/100mL) (mg/L) (mg/L) (mg/L) (mg/L) (cfs)
max 21.0 12.4 108.5 8.7 1409.0 11000 > 2420 9.66 0.14 1.60 860 169.4
min 4.2 8.2 91.4 6.7 1.5 20 13 0.26 0.07 0.08 4 0.2
mean 11.9 10.6 97.5 7.9 112.9 1258 337 3.16 0.10 0.25 87 35.9
median 11.2 11.1 97.9 8.0 10.7 210 148 2.38 0.10 0.13 10 8.3
#exceedance 5 0 0 1 1 1 2 11 6 8 3
%exceedance 35.7% 0.0% 0.0% 10.0% 7.1% 10.0% 15.4% 91.7% 50.0% 66.7% 25.0%
# sampling
events 14 14 14 14 14 10 13 12 12 12 12 17
01501A:
Cottonwood Cr.
(Mouth)
15
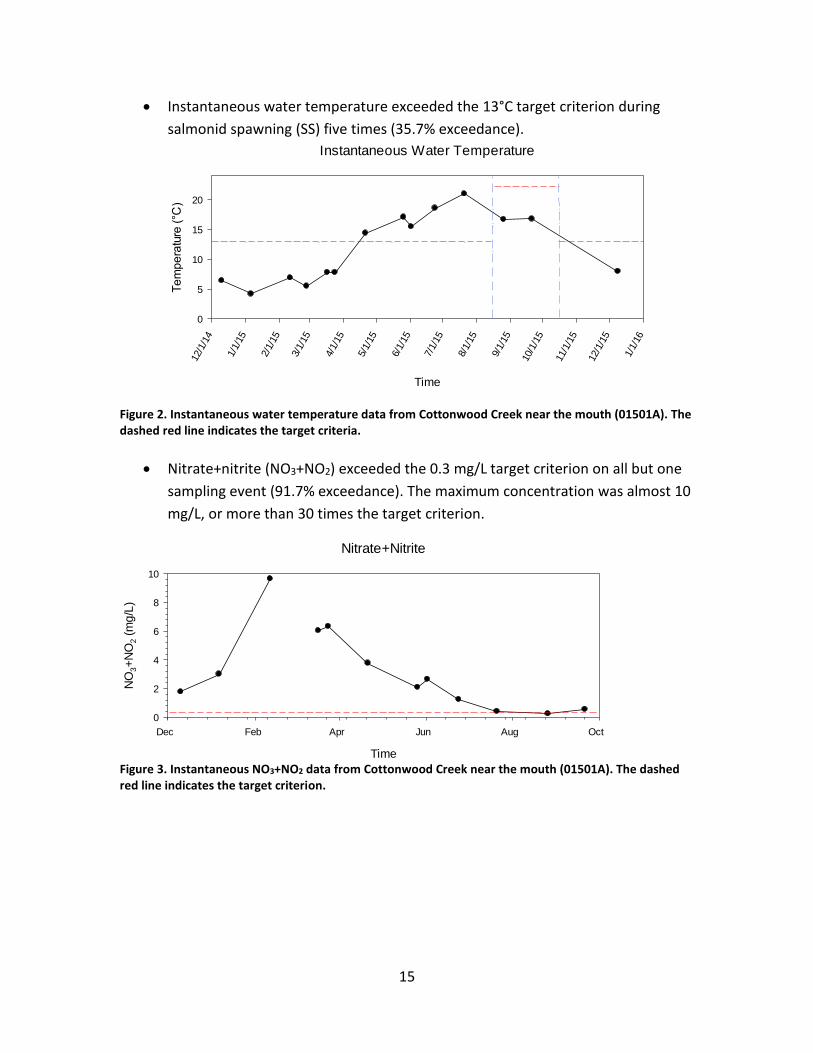
Instantaneous water temperature exceeded the 13°C target criterion during
salmonid spawning (SS) five times (35.7% exceedance).
Instantaneous Water Temperature
Time
12/1
/14
1/1/
15
2/1/
15
3/1/
15
4/1/
15
5/1/
15
6/1/
15
7/1/
15
8/1/
15
9/1/
15
10/1
/15
11/1
/15
12/1
/15
1/1/
16
Te
mp
era
ture
(°C
)
0
5
10
15
20
Figure 2. Instantaneous water temperature data from Cottonwood Creek near the mouth (01501A). The dashed red line indicates the target criteria.
Nitrate+nitrite (NO3+NO2) exceeded the 0.3 mg/L target criterion on all but one
sampling event (91.7% exceedance). The maximum concentration was almost 10
mg/L, or more than 30 times the target criterion.
Nitrate+Nitrite
Time
Dec Feb Apr Jun Aug Oct
NO
3+
NO
2 (
mg
/L)
0
2
4
6
8
10
Figure 3. Instantaneous NO3+NO2 data from Cottonwood Creek near the mouth (01501A). The dashed red line indicates the target criterion.
16
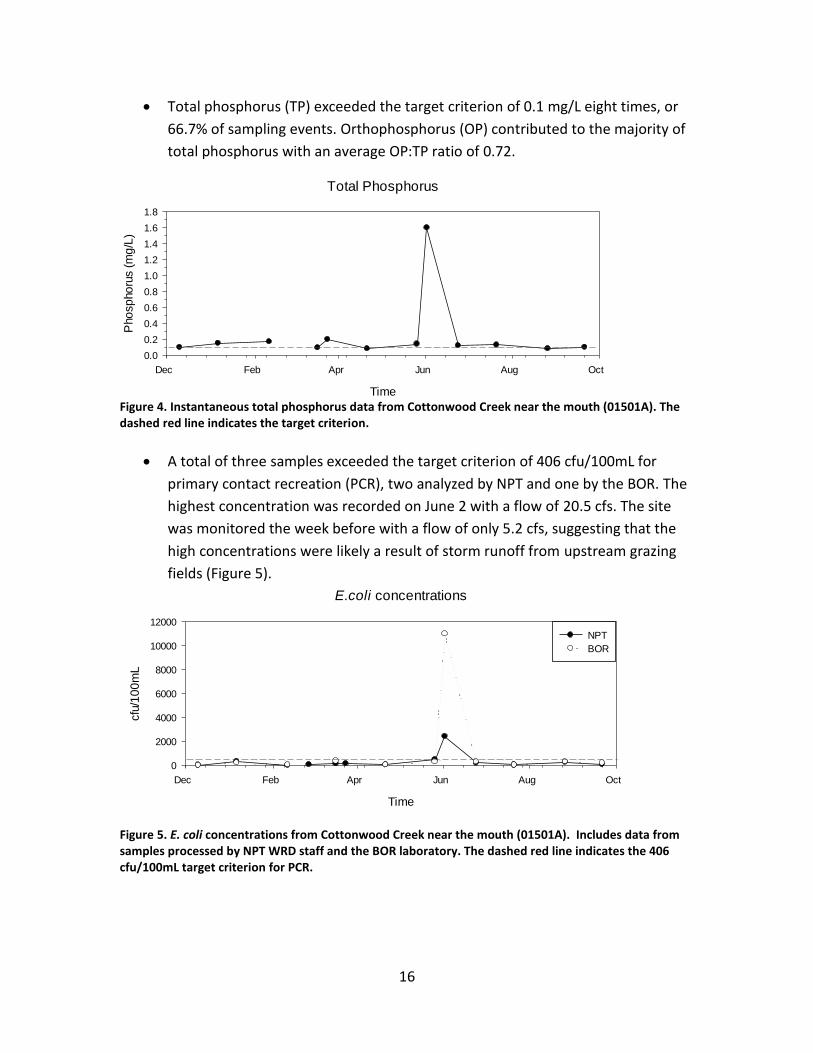
Total phosphorus (TP) exceeded the target criterion of 0.1 mg/L eight times, or
66.7% of sampling events. Orthophosphorus (OP) contributed to the majority of
total phosphorus with an average OP:TP ratio of 0.72.
Total Phosphorus
Time
Dec Feb Apr Jun Aug Oct
Pho
spho
rus (
mg
/L)
0.0
0.2
0.4
0.6
0.8
1.0
1.2
1.4
1.6
1.8
Figure 4. Instantaneous total phosphorus data from Cottonwood Creek near the mouth (01501A). The dashed red line indicates the target criterion.
A total of three samples exceeded the target criterion of 406 cfu/100mL for
primary contact recreation (PCR), two analyzed by NPT and one by the BOR. The
highest concentration was recorded on June 2 with a flow of 20.5 cfs. The site
was monitored the week before with a flow of only 5.2 cfs, suggesting that the
high concentrations were likely a result of storm runoff from upstream grazing
fields (Figure 5).
E.coli concentrations
Time
Dec Feb Apr Jun Aug Oct
cfu
/10
0m
L
0
2000
4000
6000
8000
10000
12000
NPT
BOR
Figure 5. E. coli concentrations from Cottonwood Creek near the mouth (01501A). Includes data from samples processed by NPT WRD staff and the BOR laboratory. The dashed red line indicates the 406 cfu/100mL target criterion for PCR.
17
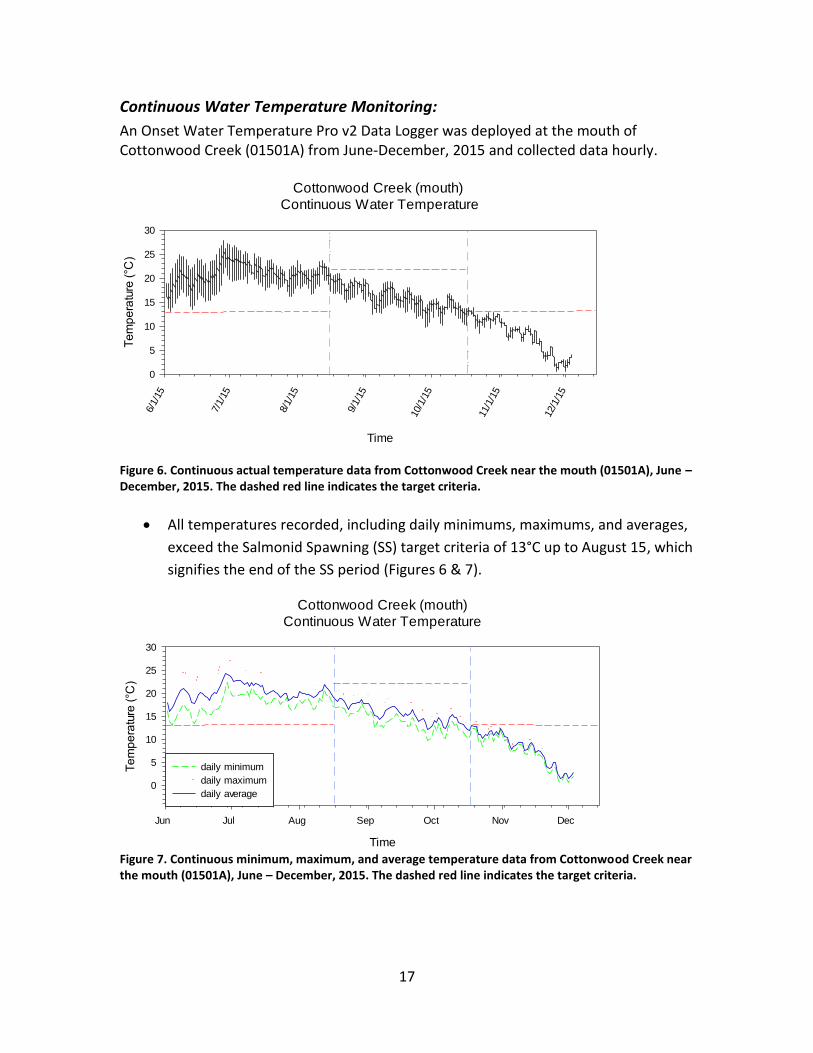
Continuous Water Temperature Monitoring:
An Onset Water Temperature Pro v2 Data Logger was deployed at the mouth of Cottonwood Creek (01501A) from June-December, 2015 and collected data hourly.
Cottonwood Creek (mouth)
Continuous Water Temperature
Time
6/1/
15
7/1/
15
8/1/
15
9/1/
15
10/1
/15
11/1
/15
12/1
/15
Te
mp
era
ture
(°C
)
0
5
10
15
20
25
30
Figure 6. Continuous actual temperature data from Cottonwood Creek near the mouth (01501A), June – December, 2015. The dashed red line indicates the target criteria.
All temperatures recorded, including daily minimums, maximums, and averages,
exceed the Salmonid Spawning (SS) target criteria of 13°C up to August 15, which
signifies the end of the SS period (Figures 6 & 7).
Cottonwood Creek (mouth)
Continuous Water Temperature
Time
Jun Jul Aug Sep Oct Nov Dec
Te
mp
era
ture
(°C
)
0
5
10
15
20
25
30
daily minimum
daily maximum
daily average
Figure 7. Continuous minimum, maximum, and average temperature data from Cottonwood Creek near the mouth (01501A), June – December, 2015. The dashed red line indicates the target criteria.
18
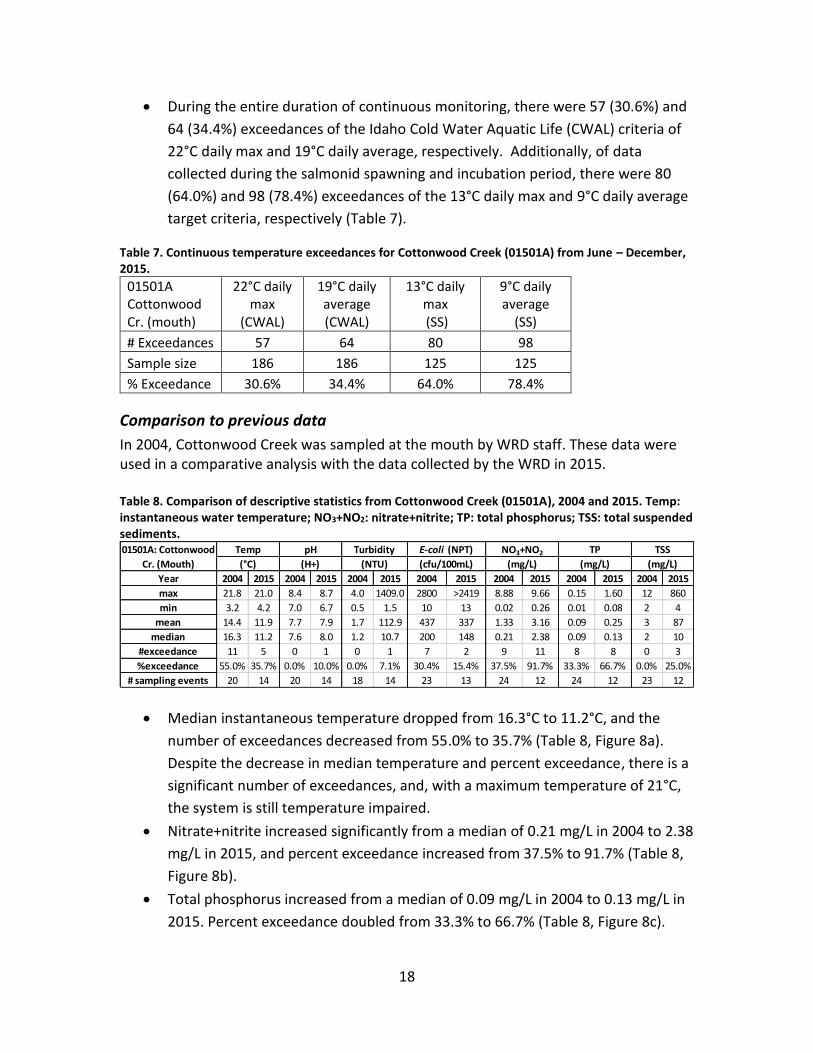
During the entire duration of continuous monitoring, there were 57 (30.6%) and
64 (34.4%) exceedances of the Idaho Cold Water Aquatic Life (CWAL) criteria of
22°C daily max and 19°C daily average, respectively. Additionally, of data
collected during the salmonid spawning and incubation period, there were 80
(64.0%) and 98 (78.4%) exceedances of the 13°C daily max and 9°C daily average
target criteria, respectively (Table 7).
Table 7. Continuous temperature exceedances for Cottonwood Creek (01501A) from June – December, 2015.
01501A Cottonwood Cr. (mouth)
22°C daily max
(CWAL)
19°C daily average (CWAL)
13°C daily max (SS)
9°C daily average
(SS)
# Exceedances 57 64 80 98
Sample size 186 186 125 125
% Exceedance 30.6% 34.4% 64.0% 78.4%
Comparison to previous data
In 2004, Cottonwood Creek was sampled at the mouth by WRD staff. These data were used in a comparative analysis with the data collected by the WRD in 2015. Table 8. Comparison of descriptive statistics from Cottonwood Creek (01501A), 2004 and 2015. Temp: instantaneous water temperature; NO3+NO2: nitrate+nitrite; TP: total phosphorus; TSS: total suspended sediments.
Median instantaneous temperature dropped from 16.3°C to 11.2°C, and the
number of exceedances decreased from 55.0% to 35.7% (Table 8, Figure 8a).
Despite the decrease in median temperature and percent exceedance, there is a
significant number of exceedances, and, with a maximum temperature of 21°C,
the system is still temperature impaired.
Nitrate+nitrite increased significantly from a median of 0.21 mg/L in 2004 to 2.38
mg/L in 2015, and percent exceedance increased from 37.5% to 91.7% (Table 8,
Figure 8b).
Total phosphorus increased from a median of 0.09 mg/L in 2004 to 0.13 mg/L in
2015. Percent exceedance doubled from 33.3% to 66.7% (Table 8, Figure 8c).
Year 2004 2015 2004 2015 2004 2015 2004 2015 2004 2015 2004 2015 2004 2015
max 21.8 21.0 8.4 8.7 4.0 1409.0 2800 >2419 8.88 9.66 0.15 1.60 12 860
min 3.2 4.2 7.0 6.7 0.5 1.5 10 13 0.02 0.26 0.01 0.08 2 4
mean 14.4 11.9 7.7 7.9 1.7 112.9 437 337 1.33 3.16 0.09 0.25 3 87
median 16.3 11.2 7.6 8.0 1.2 10.7 200 148 0.21 2.38 0.09 0.13 2 10
#exceedance 11 5 0 1 0 1 7 2 9 11 8 8 0 3
%exceedance 55.0% 35.7% 0.0% 10.0% 0.0% 7.1% 30.4% 15.4% 37.5% 91.7% 33.3% 66.7% 0.0% 25.0%
# sampling events 20 14 20 14 18 14 23 13 24 12 24 12 23 12
01501A: Cottonwood
Cr. (Mouth)
TSS
(°C) (H+) (NTU) (cfu/100mL) (mg/L) (mg/L) (mg/L)
Temp pH Turbidity E-coli (NPT) NO3+NO2 TP
19
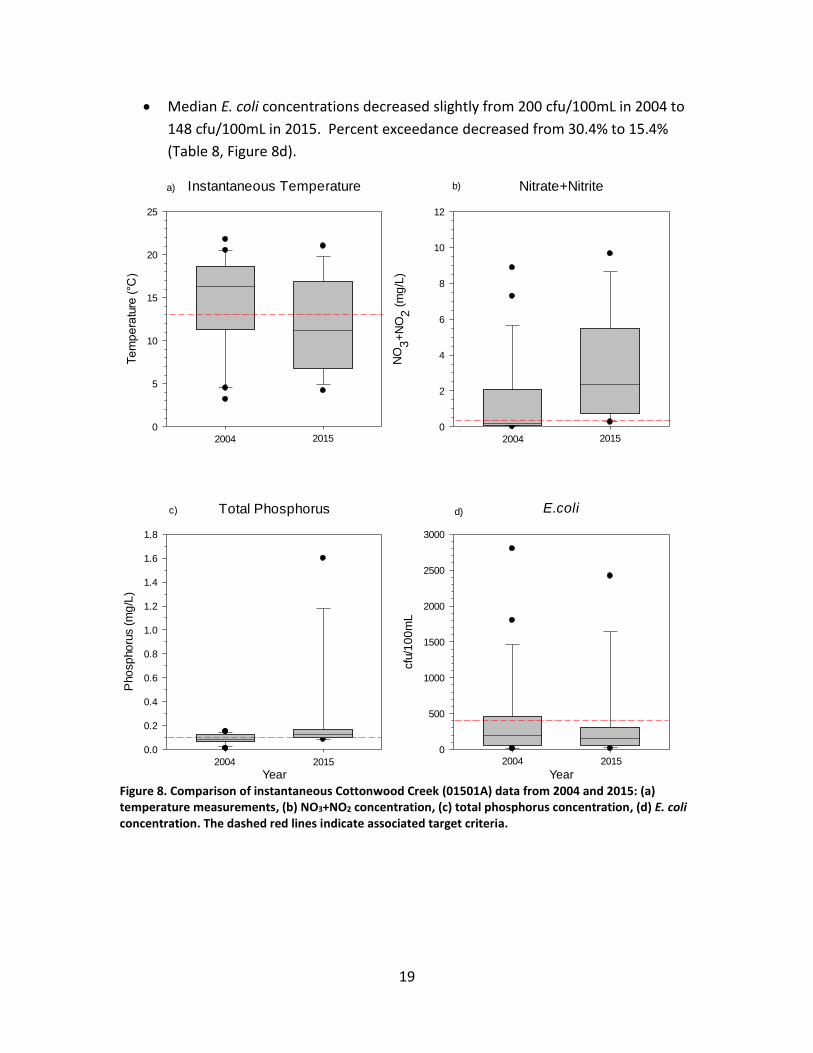
Median E. coli concentrations decreased slightly from 200 cfu/100mL in 2004 to
148 cfu/100mL in 2015. Percent exceedance decreased from 30.4% to 15.4%
(Table 8, Figure 8d).
2004 2015 2004 2015
a) b)
c) d)
Instantaneous Temperature
Te
mp
era
ture
(°C
)
0
5
10
15
20
25
E.coli
Year
cfu
/10
0m
L
0
500
1000
1500
2000
2500
3000
Total Phosphorus
Year
Pho
sp
ho
rus (
mg
/L)
0.0
0.2
0.4
0.6
0.8
1.0
1.2
1.4
1.6
1.8
2004 2015 2004 2015
Nitrate+Nitrite
NO
3+
NO
2 (
mg
/L)
0
2
4
6
8
10
12
Figure 8. Comparison of instantaneous Cottonwood Creek (01501A) data from 2004 and 2015: (a) temperature measurements, (b) NO3+NO2 concentration, (c) total phosphorus concentration, (d) E. coli concentration. The dashed red lines indicate associated target criteria.
20
Summary of data, 2015 Cottonwood Creek (mouth) 01501A
DO, pH, and turbidity met the associated target criteria or exceeded the target
criteria on less than 10% of the sampling events (Table 6).
TSS exceeded the target criterion of 25.0 mg/L three times (25.0% exceedance)
(Table 6), suggesting that this monitoring site is not fully supporting designated
beneficial uses (Table 5).
Instantaneous temperature exceeded the 13°C SS target criterion five times
(35.7% exceedance) (Table 6, Figure 2) and continuous temperature monitoring
exceeded the 13°C and 9°C SS criteria 80 (64.0%) and 98 (78.4%), respectively, of
the 125 days monitored during the salmonid spawning and incubation period.
Continuous temperature data also exceeded 22°C CWAL criteria for nearly 1/3 of
the days monitored (Table 7, Figures 6 & 7). This monitoring location remains
severely temperature impaired and thus is not fully supporting either SS or
CWAL designated beneficial uses.
Nitrogen and phosphorus exceeded target criteria for the majority of sampling
events in 2015 (Table 6, Figures 3 & 4), and significantly increased since 2004
(Table 8). This monitoring site is not fully supporting associated designated
beneficial uses.
E. coli concentrations did not meet target criteria on a few sampling events;
however, not enough data was collected to make a designated beneficial use
support determination.
21
01508A: Cottonwood Creek at Cottonwood Creek Road
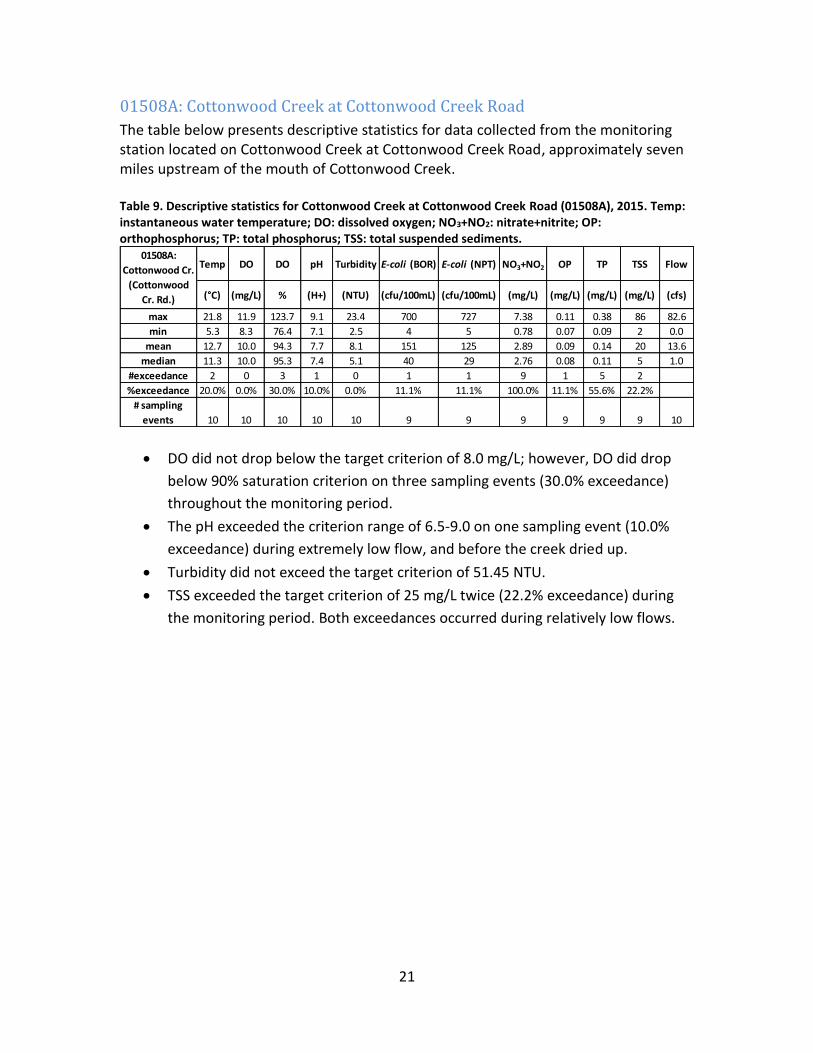
The table below presents descriptive statistics for data collected from the monitoring station located on Cottonwood Creek at Cottonwood Creek Road, approximately seven miles upstream of the mouth of Cottonwood Creek. Table 9. Descriptive statistics for Cottonwood Creek at Cottonwood Creek Road (01508A), 2015. Temp: instantaneous water temperature; DO: dissolved oxygen; NO3+NO2: nitrate+nitrite; OP: orthophosphorus; TP: total phosphorus; TSS: total suspended sediments.
DO did not drop below the target criterion of 8.0 mg/L; however, DO did drop
below 90% saturation criterion on three sampling events (30.0% exceedance)
throughout the monitoring period.
The pH exceeded the criterion range of 6.5-9.0 on one sampling event (10.0%
exceedance) during extremely low flow, and before the creek dried up.
Turbidity did not exceed the target criterion of 51.45 NTU.
TSS exceeded the target criterion of 25 mg/L twice (22.2% exceedance) during
the monitoring period. Both exceedances occurred during relatively low flows.
Temp DO DO pH Turbidity E-coli (BOR) E-coli (NPT) NO3+NO2 OP TP TSS Flow
(°C) (mg/L) % (H+) (NTU) (cfu/100mL) (cfu/100mL) (mg/L) (mg/L) (mg/L) (mg/L) (cfs)
max 21.8 11.9 123.7 9.1 23.4 700 727 7.38 0.11 0.38 86 82.6
min 5.3 8.3 76.4 7.1 2.5 4 5 0.78 0.07 0.09 2 0.0
mean 12.7 10.0 94.3 7.7 8.1 151 125 2.89 0.09 0.14 20 13.6
median 11.3 10.0 95.3 7.4 5.1 40 29 2.76 0.08 0.11 5 1.0
#exceedance 2 0 3 1 0 1 1 9 1 5 2
%exceedance 20.0% 0.0% 30.0% 10.0% 0.0% 11.1% 11.1% 100.0% 11.1% 55.6% 22.2%
# sampling
events 10 10 10 10 10 9 9 9 9 9 9 10
01508A:
Cottonwood Cr.
(Cottonwood
Cr. Rd.)
22
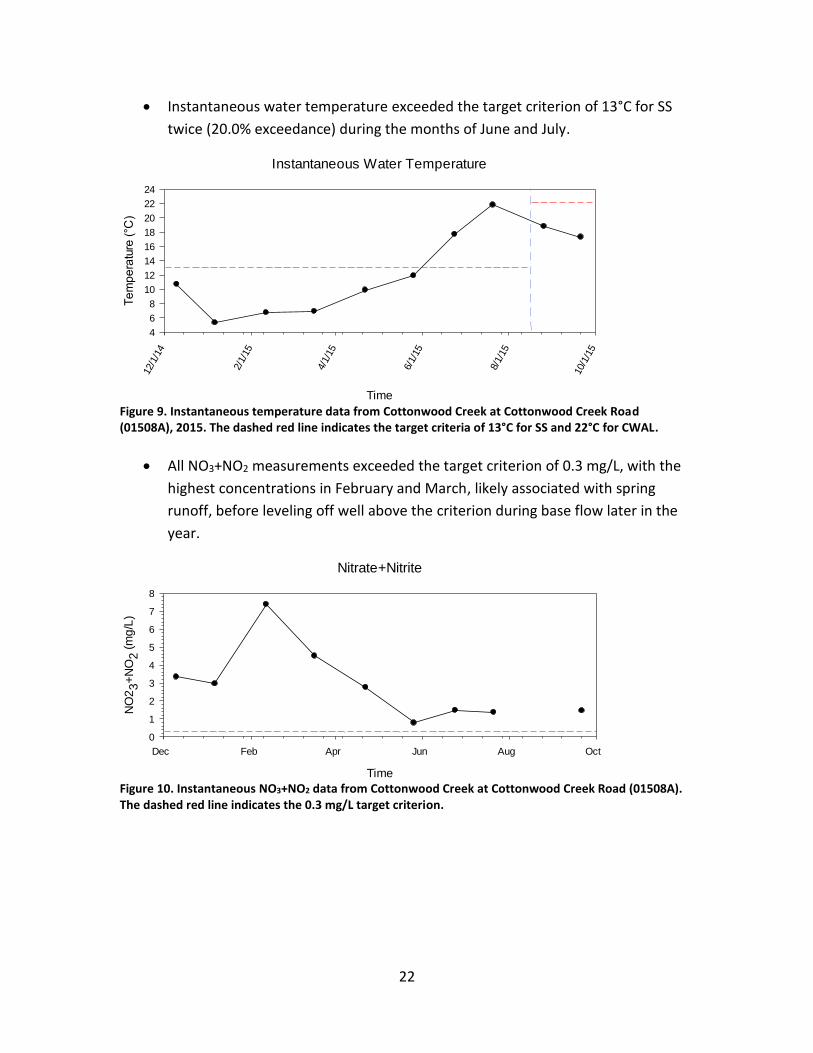
Instantaneous water temperature exceeded the target criterion of 13°C for SS
twice (20.0% exceedance) during the months of June and July.
Instantaneous Water Temperature
Time
12/1
/14
2/1/
15
4/1/
15
6/1/
15
8/1/
15
10/1
/15
Te
mp
era
ture
(°C
)
4
6
8
10
12
14
16
18
20
22
24
Figure 9. Instantaneous temperature data from Cottonwood Creek at Cottonwood Creek Road (01508A), 2015. The dashed red line indicates the target criteria of 13°C for SS and 22°C for CWAL.
All NO3+NO2 measurements exceeded the target criterion of 0.3 mg/L, with the
highest concentrations in February and March, likely associated with spring
runoff, before leveling off well above the criterion during base flow later in the
year.
Nitrate+Nitrite
Time
Dec Feb Apr Jun Aug Oct
NO
23
+N
O2
(m
g/L
)
0
1
2
3
4
5
6
7
8
Figure 10. Instantaneous NO3+NO2 data from Cottonwood Creek at Cottonwood Creek Road (01508A). The dashed red line indicates the 0.3 mg/L target criterion.
23
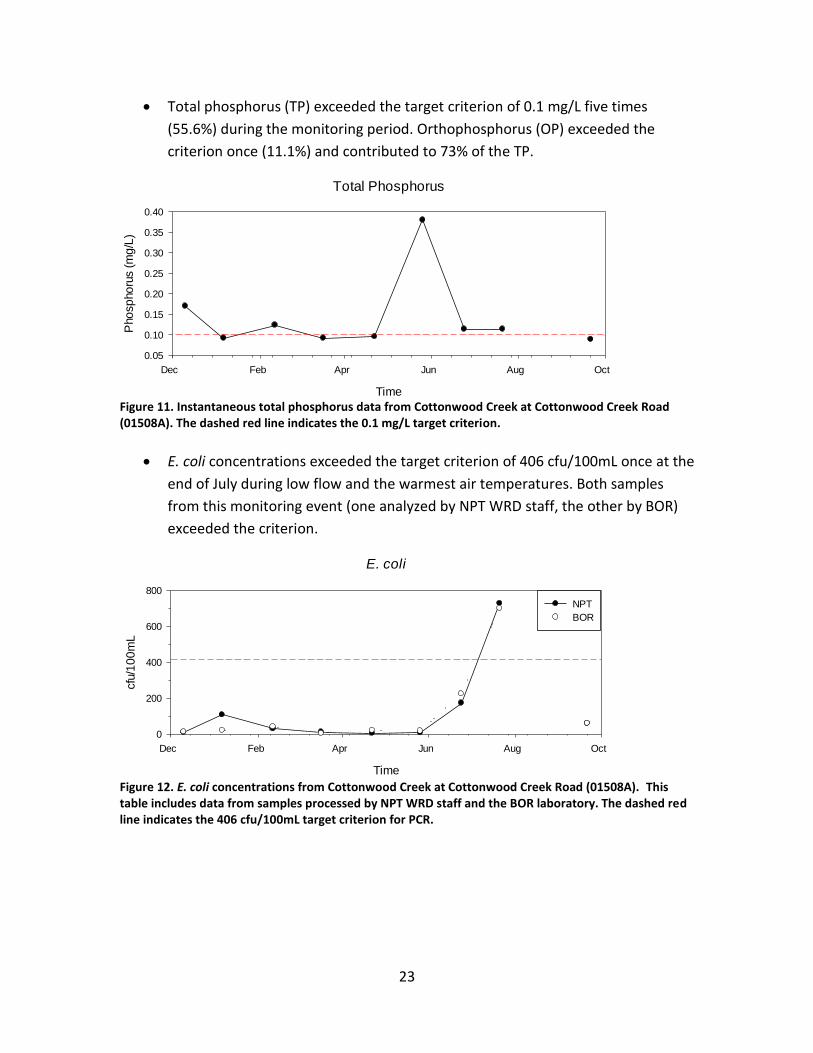
Total phosphorus (TP) exceeded the target criterion of 0.1 mg/L five times
(55.6%) during the monitoring period. Orthophosphorus (OP) exceeded the
criterion once (11.1%) and contributed to 73% of the TP.
Total Phosphorus
Time
Dec Feb Apr Jun Aug Oct
Pho
sp
ho
rus (
mg
/L)
0.05
0.10
0.15
0.20
0.25
0.30
0.35
0.40
Figure 11. Instantaneous total phosphorus data from Cottonwood Creek at Cottonwood Creek Road (01508A). The dashed red line indicates the 0.1 mg/L target criterion.
E. coli concentrations exceeded the target criterion of 406 cfu/100mL once at the
end of July during low flow and the warmest air temperatures. Both samples
from this monitoring event (one analyzed by NPT WRD staff, the other by BOR)
exceeded the criterion.
E. coli
Time
Dec Feb Apr Jun Aug Oct
cfu
/10
0m
L
0
200
400
600
800
NPT
BOR
Figure 12. E. coli concentrations from Cottonwood Creek at Cottonwood Creek Road (01508A). This table includes data from samples processed by NPT WRD staff and the BOR laboratory. The dashed red line indicates the 406 cfu/100mL target criterion for PCR.
24
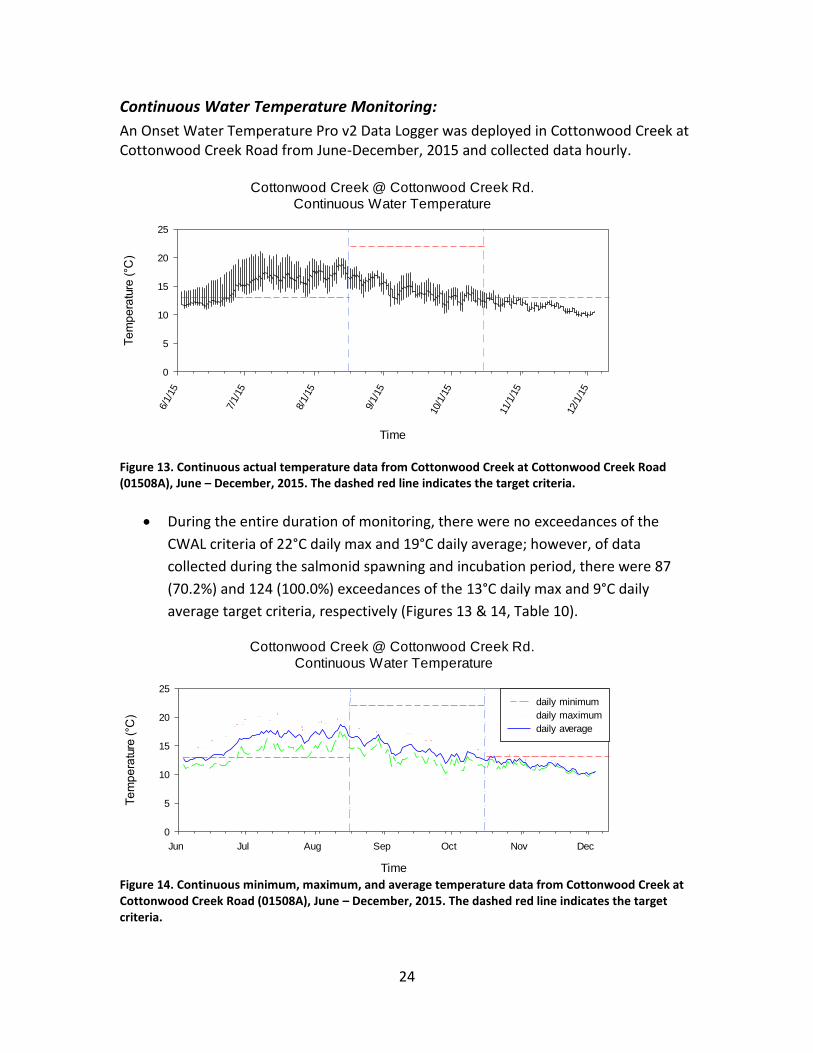
Continuous Water Temperature Monitoring:
An Onset Water Temperature Pro v2 Data Logger was deployed in Cottonwood Creek at Cottonwood Creek Road from June-December, 2015 and collected data hourly.
Cottonwood Creek @ Cottonwood Creek Rd.
Continuous Water Temperature
Time
6/1/
15
7/1/
15
8/1/
15
9/1/
15
10/1
/15
11/1
/15
12/1
/15
Te
mp
era
ture
(°C
)
0
5
10
15
20
25
Figure 13. Continuous actual temperature data from Cottonwood Creek at Cottonwood Creek Road (01508A), June – December, 2015. The dashed red line indicates the target criteria.
During the entire duration of monitoring, there were no exceedances of the
CWAL criteria of 22°C daily max and 19°C daily average; however, of data
collected during the salmonid spawning and incubation period, there were 87
(70.2%) and 124 (100.0%) exceedances of the 13°C daily max and 9°C daily
average target criteria, respectively (Figures 13 & 14, Table 10).
Cottonwood Creek @ Cottonwood Creek Rd.
Continuous Water Temperature
Time
Jun Jul Aug Sep Oct Nov Dec
Te
mp
era
ture
(°C
)
0
5
10
15
20
25
daily minimum
daily maximum
daily average
Figure 14. Continuous minimum, maximum, and average temperature data from Cottonwood Creek at Cottonwood Creek Road (01508A), June – December, 2015. The dashed red line indicates the target criteria.
25
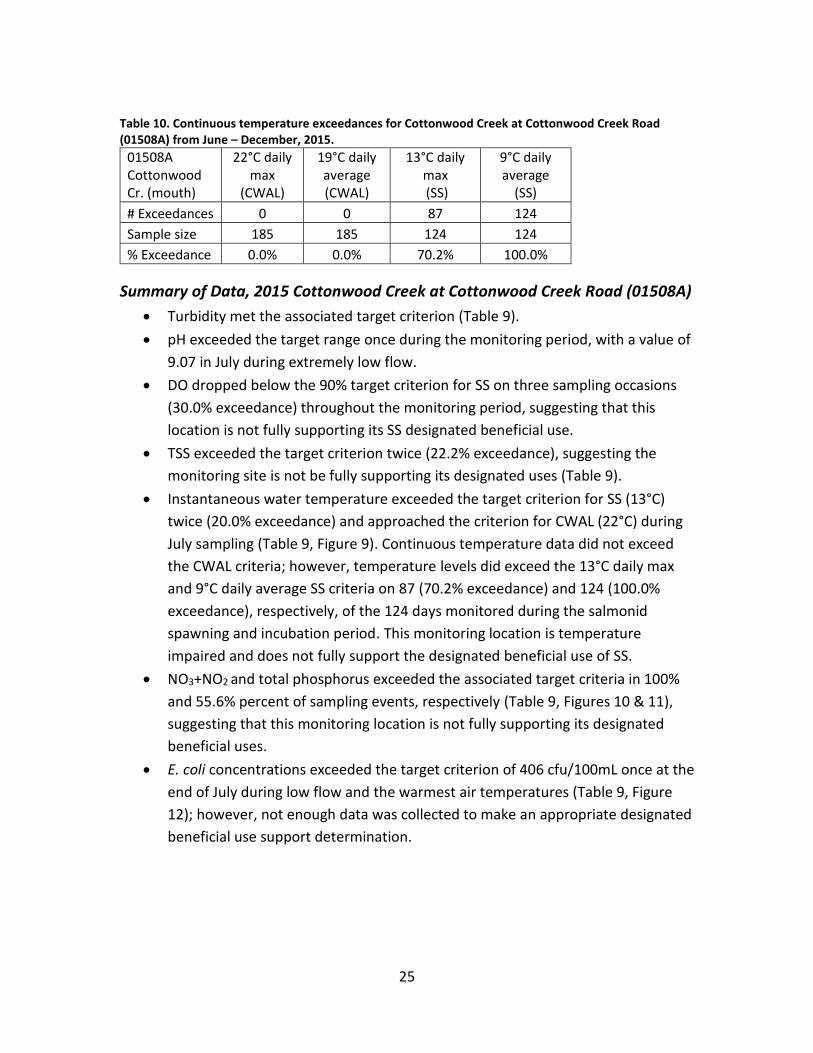
Table 10. Continuous temperature exceedances for Cottonwood Creek at Cottonwood Creek Road (01508A) from June – December, 2015.
01508A Cottonwood Cr. (mouth)
22°C daily max
(CWAL)
19°C daily average (CWAL)
13°C daily max (SS)
9°C daily average
(SS)
# Exceedances 0 0 87 124
Sample size 185 185 124 124
% Exceedance 0.0% 0.0% 70.2% 100.0%
Summary of Data, 2015 Cottonwood Creek at Cottonwood Creek Road (01508A)
Turbidity met the associated target criterion (Table 9).
pH exceeded the target range once during the monitoring period, with a value of
9.07 in July during extremely low flow.
DO dropped below the 90% target criterion for SS on three sampling occasions
(30.0% exceedance) throughout the monitoring period, suggesting that this
location is not fully supporting its SS designated beneficial use.
TSS exceeded the target criterion twice (22.2% exceedance), suggesting the
monitoring site is not be fully supporting its designated uses (Table 9).
Instantaneous water temperature exceeded the target criterion for SS (13°C)
twice (20.0% exceedance) and approached the criterion for CWAL (22°C) during
July sampling (Table 9, Figure 9). Continuous temperature data did not exceed
the CWAL criteria; however, temperature levels did exceed the 13°C daily max
and 9°C daily average SS criteria on 87 (70.2% exceedance) and 124 (100.0%
exceedance), respectively, of the 124 days monitored during the salmonid
spawning and incubation period. This monitoring location is temperature
impaired and does not fully support the designated beneficial use of SS.
NO3+NO2 and total phosphorus exceeded the associated target criteria in 100%
and 55.6% percent of sampling events, respectively (Table 9, Figures 10 & 11),
suggesting that this monitoring location is not fully supporting its designated
beneficial uses.
E. coli concentrations exceeded the target criterion of 406 cfu/100mL once at the
end of July during low flow and the warmest air temperatures (Table 9, Figure
12); however, not enough data was collected to make an appropriate designated
beneficial use support determination.
26
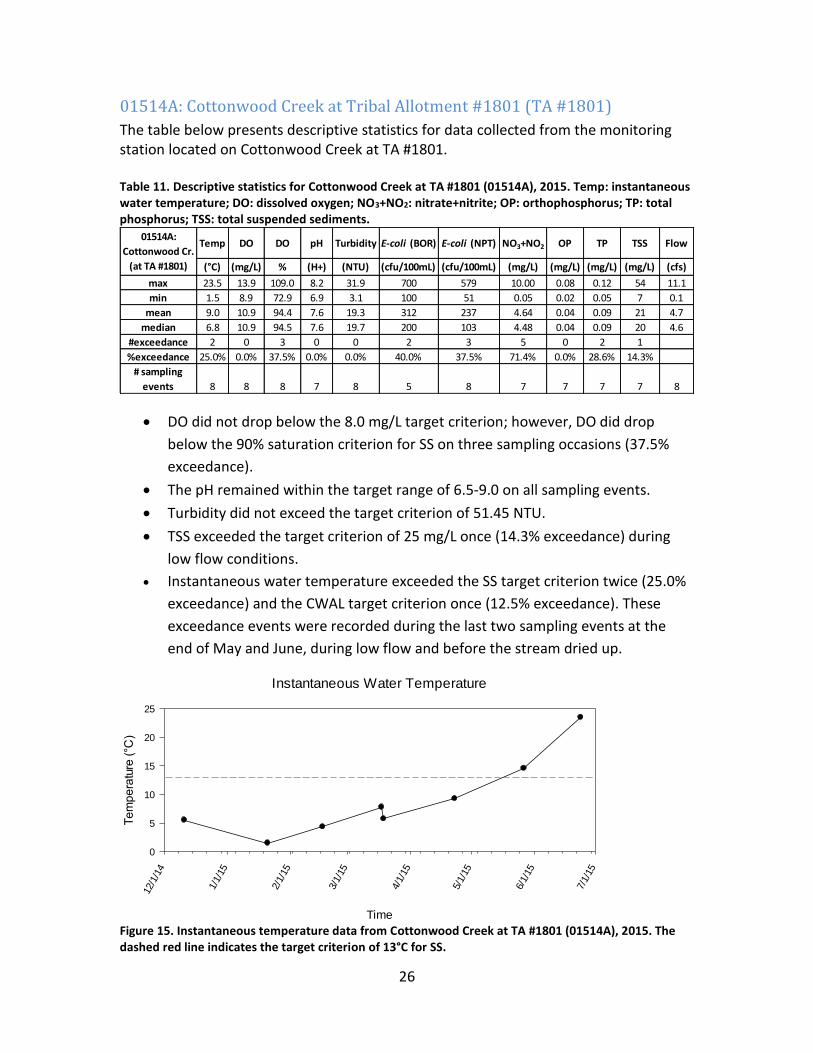
01514A: Cottonwood Creek at Tribal Allotment #1801 (TA #1801)
The table below presents descriptive statistics for data collected from the monitoring station located on Cottonwood Creek at TA #1801. Table 11. Descriptive statistics for Cottonwood Creek at TA #1801 (01514A), 2015. Temp: instantaneous water temperature; DO: dissolved oxygen; NO3+NO2: nitrate+nitrite; OP: orthophosphorus; TP: total phosphorus; TSS: total suspended sediments.
DO did not drop below the 8.0 mg/L target criterion; however, DO did drop
below the 90% saturation criterion for SS on three sampling occasions (37.5%
exceedance).
The pH remained within the target range of 6.5-9.0 on all sampling events.
Turbidity did not exceed the target criterion of 51.45 NTU.
TSS exceeded the target criterion of 25 mg/L once (14.3% exceedance) during
low flow conditions.
Instantaneous water temperature exceeded the SS target criterion twice (25.0%
exceedance) and the CWAL target criterion once (12.5% exceedance). These
exceedance events were recorded during the last two sampling events at the
end of May and June, during low flow and before the stream dried up.
Instantaneous Water Temperature
Time
12/1
/14
1/1/
15
2/1/
15
3/1/
15
4/1/
15
5/1/
15
6/1/
15
7/1/
15
Te
mp
era
ture
(°C
)
0
5
10
15
20
25
Figure 15. Instantaneous temperature data from Cottonwood Creek at TA #1801 (01514A), 2015. The dashed red line indicates the target criterion of 13°C for SS.
Temp DO DO pH Turbidity E-coli (BOR) E-coli (NPT) NO3+NO2 OP TP TSS Flow
(°C) (mg/L) % (H+) (NTU) (cfu/100mL) (cfu/100mL) (mg/L) (mg/L) (mg/L) (mg/L) (cfs)
max 23.5 13.9 109.0 8.2 31.9 700 579 10.00 0.08 0.12 54 11.1
min 1.5 8.9 72.9 6.9 3.1 100 51 0.05 0.02 0.05 7 0.1
mean 9.0 10.9 94.4 7.6 19.3 312 237 4.64 0.04 0.09 21 4.7
median 6.8 10.9 94.5 7.6 19.7 200 103 4.48 0.04 0.09 20 4.6
#exceedance 2 0 3 0 0 2 3 5 0 2 1
%exceedance 25.0% 0.0% 37.5% 0.0% 0.0% 40.0% 37.5% 71.4% 0.0% 28.6% 14.3%
# sampling
events 8 8 8 7 8 5 8 7 7 7 7 8
01514A:
Cottonwood Cr.
(at TA #1801)
27
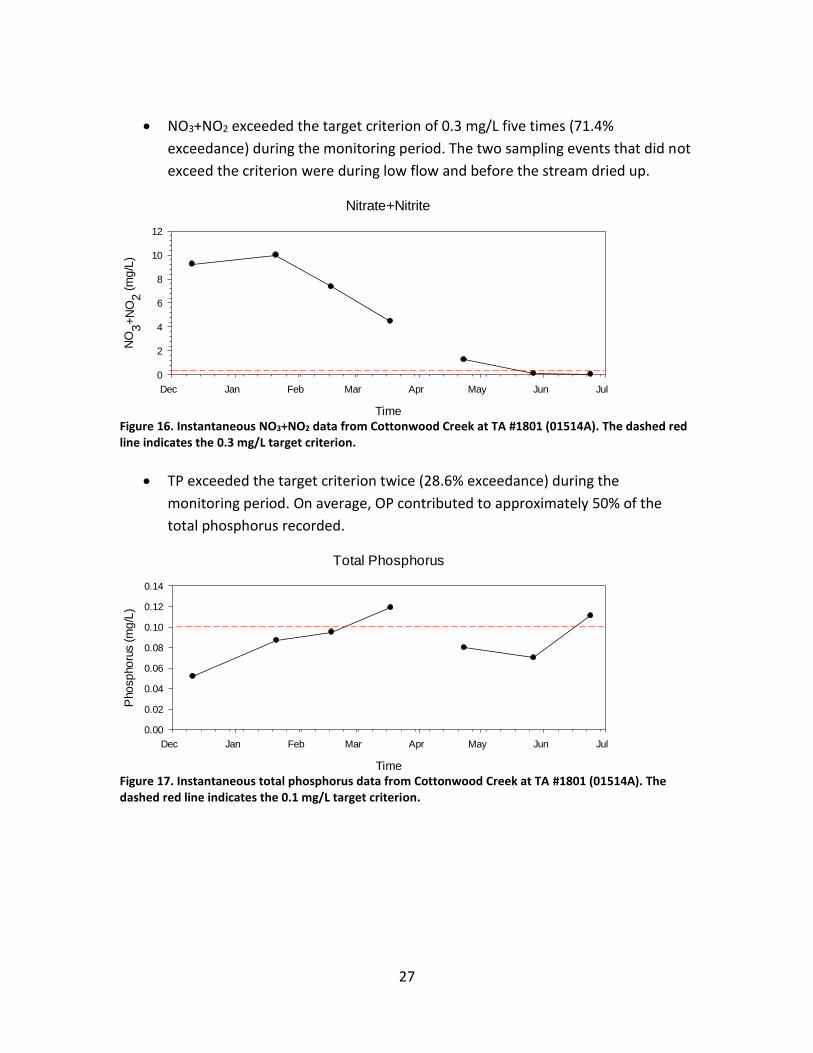
NO3+NO2 exceeded the target criterion of 0.3 mg/L five times (71.4%
exceedance) during the monitoring period. The two sampling events that did not
exceed the criterion were during low flow and before the stream dried up.
Nitrate+Nitrite
Time
Dec Jan Feb Mar Apr May Jun Jul
NO
3+
NO
2 (m
g/L
)
0
2
4
6
8
10
12
Figure 16. Instantaneous NO3+NO2 data from Cottonwood Creek at TA #1801 (01514A). The dashed red line indicates the 0.3 mg/L target criterion.
TP exceeded the target criterion twice (28.6% exceedance) during the
monitoring period. On average, OP contributed to approximately 50% of the
total phosphorus recorded.
Total Phosphorus
Time
Dec Jan Feb Mar Apr May Jun Jul
Pho
sp
ho
rus (
mg
/L)
0.00
0.02
0.04
0.06
0.08
0.10
0.12
0.14
Figure 17. Instantaneous total phosphorus data from Cottonwood Creek at TA #1801 (01514A). The dashed red line indicates the 0.1 mg/L target criterion.
28
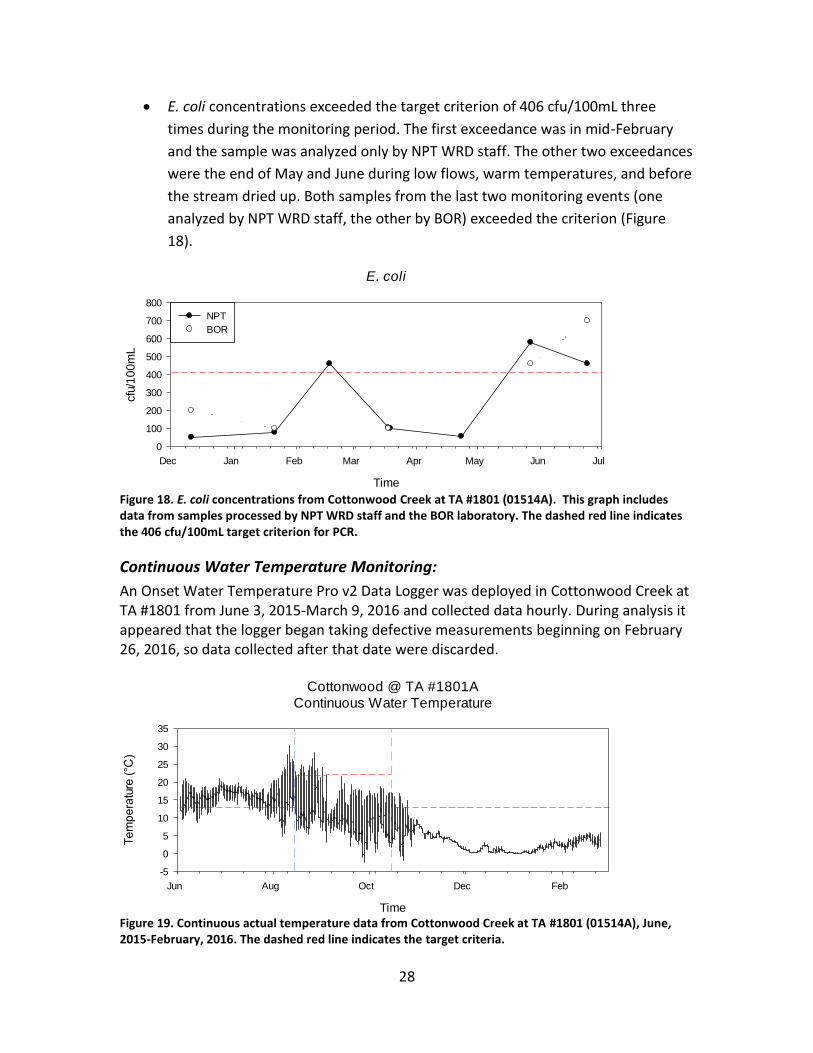
E. coli concentrations exceeded the target criterion of 406 cfu/100mL three
times during the monitoring period. The first exceedance was in mid-February
and the sample was analyzed only by NPT WRD staff. The other two exceedances
were the end of May and June during low flows, warm temperatures, and before
the stream dried up. Both samples from the last two monitoring events (one
analyzed by NPT WRD staff, the other by BOR) exceeded the criterion (Figure
18).
E. coli
Time
Dec Jan Feb Mar Apr May Jun Jul
cfu
/10
0m
L
0
100
200
300
400
500
600
700
800
NPT
BOR
Figure 18. E. coli concentrations from Cottonwood Creek at TA #1801 (01514A). This graph includes data from samples processed by NPT WRD staff and the BOR laboratory. The dashed red line indicates the 406 cfu/100mL target criterion for PCR.
Continuous Water Temperature Monitoring:
An Onset Water Temperature Pro v2 Data Logger was deployed in Cottonwood Creek at TA #1801 from June 3, 2015-March 9, 2016 and collected data hourly. During analysis it appeared that the logger began taking defective measurements beginning on February 26, 2016, so data collected after that date were discarded.
Cottonwood @ TA #1801A
Continuous Water Temperature
Time
Jun Aug Oct Dec Feb
Te
mp
era
ture
(°C
)
-5
0
5
10
15
20
25
30
35
Figure 19. Continuous actual temperature data from Cottonwood Creek at TA #1801 (01514A), June, 2015-February, 2016. The dashed red line indicates the target criteria.
29
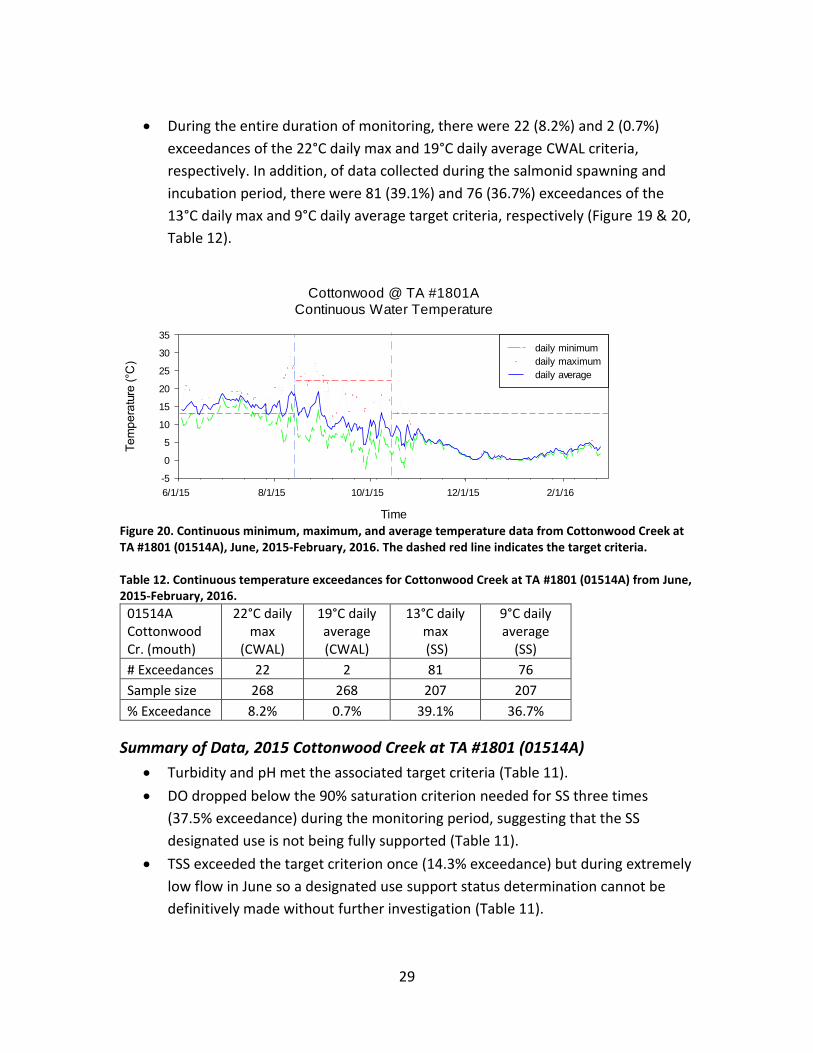
During the entire duration of monitoring, there were 22 (8.2%) and 2 (0.7%)
exceedances of the 22°C daily max and 19°C daily average CWAL criteria,
respectively. In addition, of data collected during the salmonid spawning and
incubation period, there were 81 (39.1%) and 76 (36.7%) exceedances of the
13°C daily max and 9°C daily average target criteria, respectively (Figure 19 & 20,
Table 12).
Cottonwood @ TA #1801A
Continuous Water Temperature
Time
6/1/15 8/1/15 10/1/15 12/1/15 2/1/16
Te
mp
era
ture
(°C
)
-5
0
5
10
15
20
25
30
35
daily minimum
daily maximum
daily average
Figure 20. Continuous minimum, maximum, and average temperature data from Cottonwood Creek at TA #1801 (01514A), June, 2015-February, 2016. The dashed red line indicates the target criteria. Table 12. Continuous temperature exceedances for Cottonwood Creek at TA #1801 (01514A) from June, 2015-February, 2016.
01514A Cottonwood Cr. (mouth)
22°C daily max
(CWAL)
19°C daily average (CWAL)
13°C daily max (SS)
9°C daily average
(SS)
# Exceedances 22 2 81 76
Sample size 268 268 207 207
% Exceedance 8.2% 0.7% 39.1% 36.7%
Summary of Data, 2015 Cottonwood Creek at TA #1801 (01514A)
Turbidity and pH met the associated target criteria (Table 11).
DO dropped below the 90% saturation criterion needed for SS three times
(37.5% exceedance) during the monitoring period, suggesting that the SS
designated use is not being fully supported (Table 11).
TSS exceeded the target criterion once (14.3% exceedance) but during extremely
low flow in June so a designated use support status determination cannot be
definitively made without further investigation (Table 11).
30
Instantaneous water temperature exceeded the target criteria for SS (13°C)
twice (25.0%) and CWAL (22°C) once (12.5%) during June sampling (Table 11,
Figure 15). The exceedances were documented during low flow, high ambient air
temperatures, and just before the stream dried up. In addition, continuous
temperature data showed exceedances of the 13°C daily max and 9°C daily
average on 81 (39.1% exceedance) and 76 (36.7%), respectively, of the 207 days
monitored during the salmonid spawning and incubation period. This monitoring
location is temperature impaired and does not fully support the designated use
of SS. Continuous data also showed several occasions in which the temperature
exceeded the CWAL target criteria but percent exceedance did not exceed the
10% threshold (Figures 19 & 20, Table 12).
NO3+NO2 and total phosphorus exceeded the associated target criteria in 71.4%
and 28.6% percent of sampling events, respectively, suggesting this monitoring
site is not fully supporting the designated uses (Table 11).
E. coli concentrations exceeded the target criterion of 406 cfu/100mL three
times during the monitoring period; however, not enough data was collected to
make an appropriate designated beneficial use support determination (Table
11).
31
01517A: Cottonwood Creek in the headwaters near Fairview Road
The table below presents descriptive statistics for data collected from the monitoring station located on Cottonwood Creek near Fairview Road. Table 13. Descriptive statistics for Cottonwood Creek in the headwaters near Fairview Road (01517A), 2015. Temp: instantaneous water temperature; DO: dissolved oxygen; NO3+NO2: nitrate+nitrite; OP: orthophosphorus; TP: total phosphorus; TSS: total suspended sediments.
DO did not drop below the 8.0 mg/L target criteria during the sampling period;
however, % saturation did drop below the 90% target criterion for SS on three of
the four sampling events.
The pH fell below the criterion range of 6.5-9.0 on one sampling event (25.0%
exceedance). The pH was measured at 5.59 in February, which is well below the
6.5 minimum target criterion. Field notes from this sampling event document
active erosion from a nearby field delivering sediment to the creek.
Turbidity did not exceed the target criterion of 51.45 NTU.
TSS exceeded the target criterion of 25 mg/L once (25.0%) during the monitoring
period, which occurred during the February sampling event with documented
active erosion occurring.
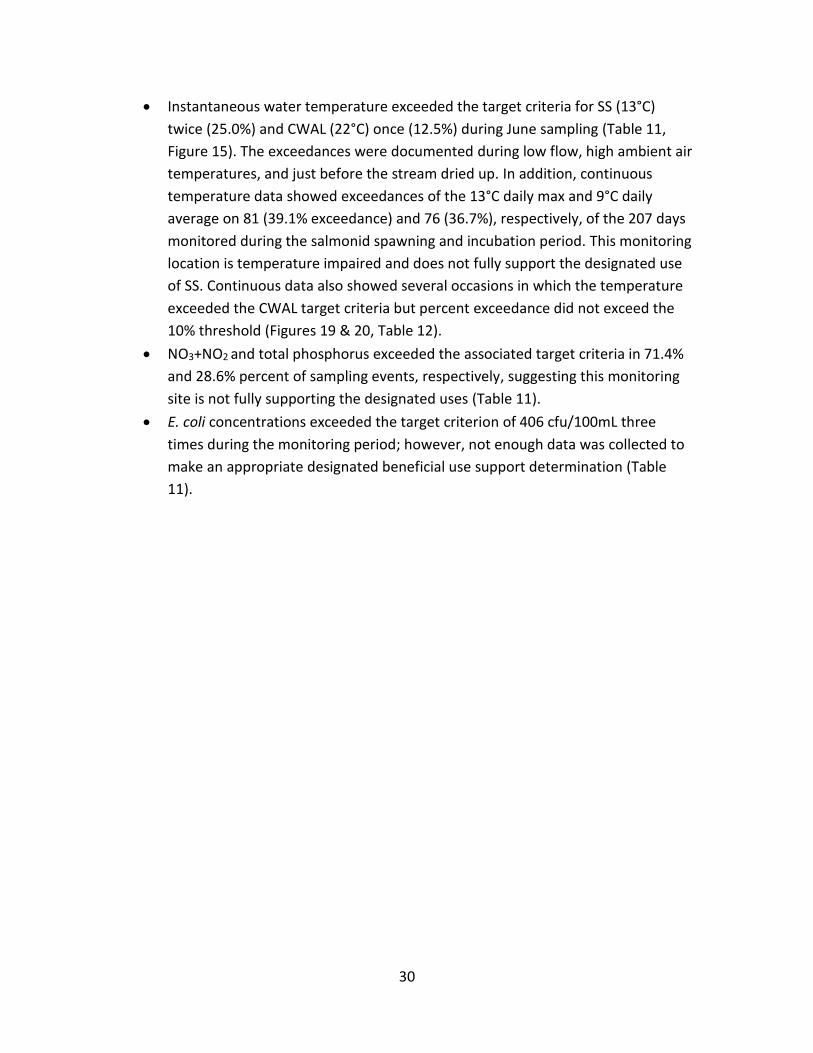
Instantaneous water temperature did not exceed the 13°C target criterion for SS.
The last sample was taken at the end of April, just before the stream dried up.
Instantaneous Water Temperature
Time
1/1/
15
2/1/
15
3/1/
15
4/1/
15
5/1/
15
Te
mp
era
ture
(°C
)
0
2
4
6
8
10
12
14
16
18
Figure 21. Instantaneous temperature data from Cottonwood Creek near Fairview Road (01517A), 2015. The dashed red line indicates the target criterion of 13°C for SS.
32
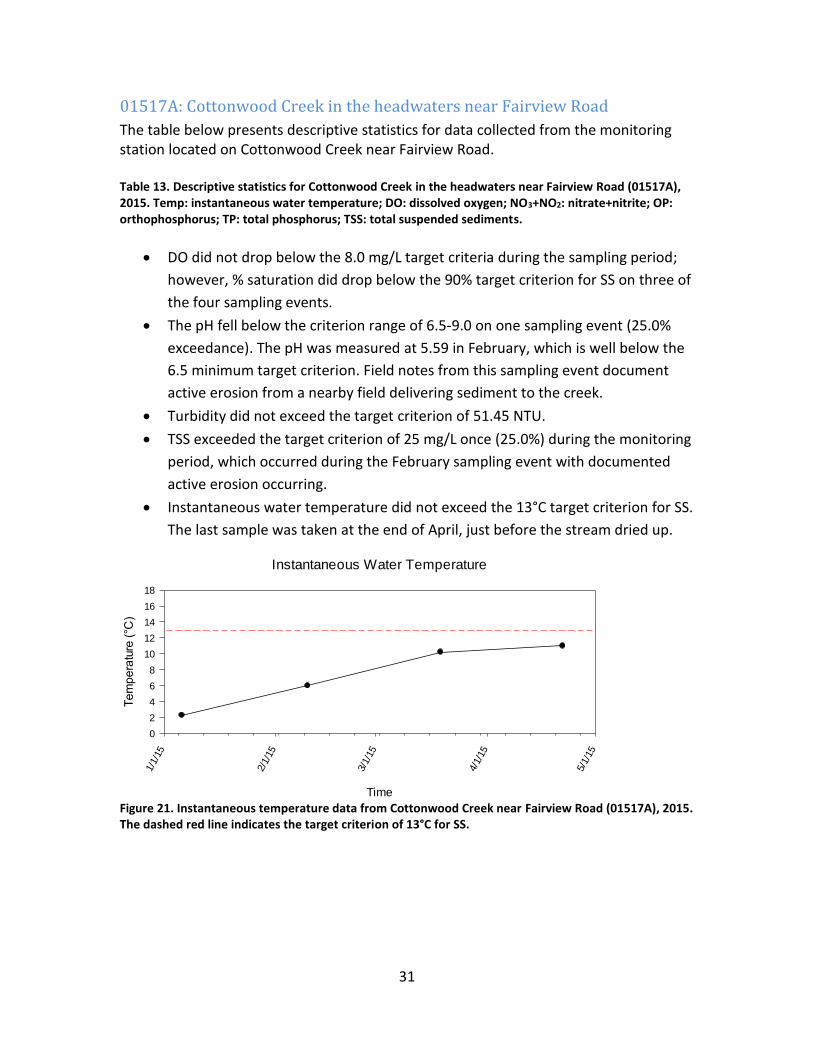
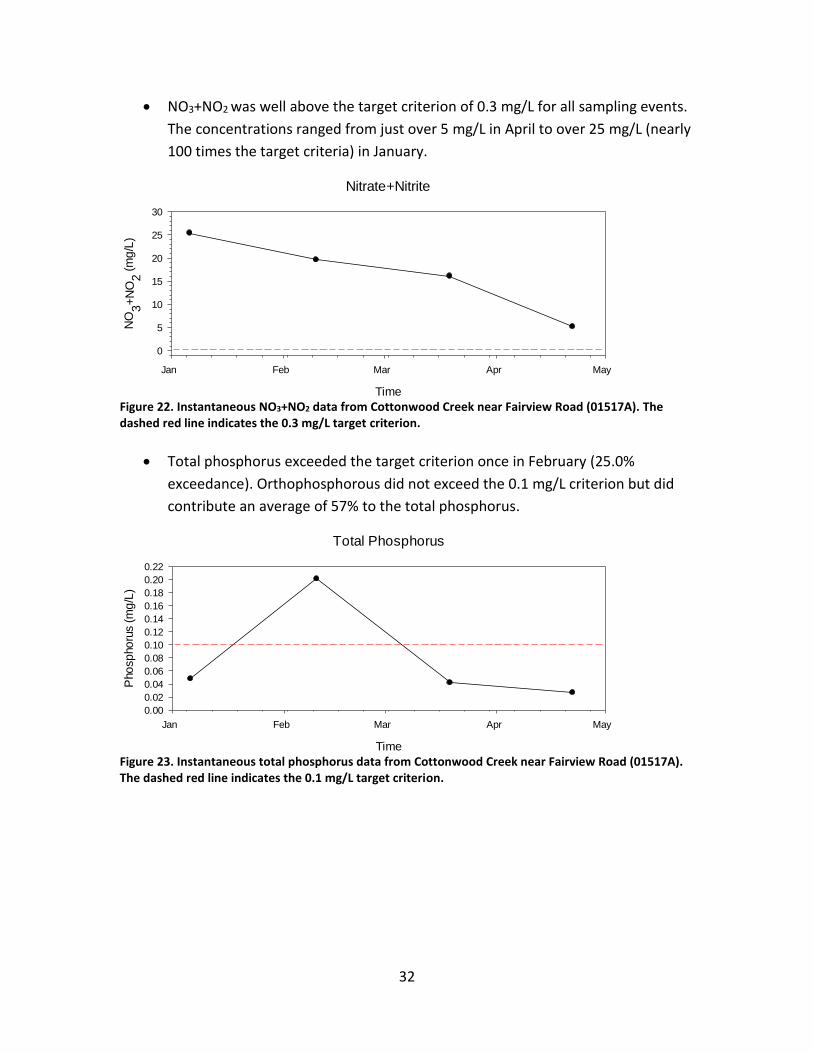
NO3+NO2 was well above the target criterion of 0.3 mg/L for all sampling events.
The concentrations ranged from just over 5 mg/L in April to over 25 mg/L (nearly
100 times the target criteria) in January.
Nitrate+Nitrite
Time
Jan Feb Mar Apr May
NO
3+
NO
2 (m
g/L
)
0
5
10
15
20
25
30
Figure 22. Instantaneous NO3+NO2 data from Cottonwood Creek near Fairview Road (01517A). The dashed red line indicates the 0.3 mg/L target criterion.
Total phosphorus exceeded the target criterion once in February (25.0%
exceedance). Orthophosphorous did not exceed the 0.1 mg/L criterion but did
contribute an average of 57% to the total phosphorus.
Total Phosphorus
Time
Jan Feb Mar Apr May
Pho
sp
ho
rus (
mg
/L)
0.00
0.02
0.04
0.06
0.08
0.10
0.12
0.14
0.16
0.18
0.20
0.22
Figure 23. Instantaneous total phosphorus data from Cottonwood Creek near Fairview Road (01517A). The dashed red line indicates the 0.1 mg/L target criterion.
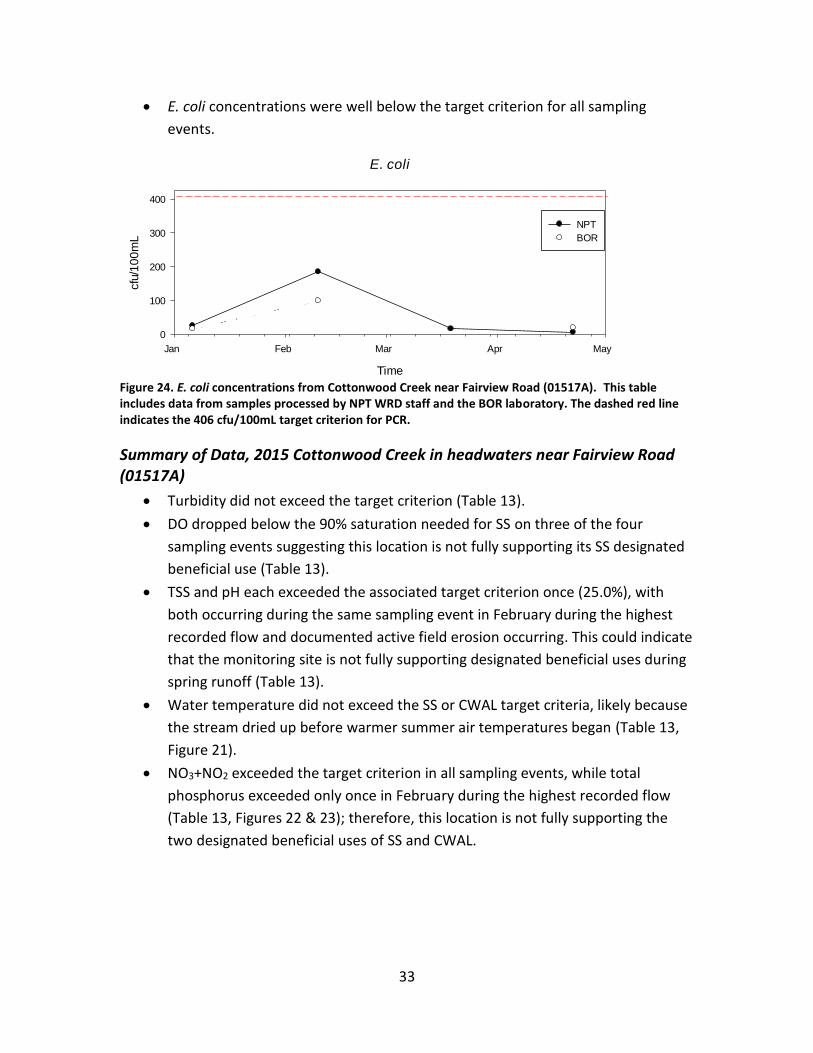
33
E. coli concentrations were well below the target criterion for all sampling
events.
E. coli
Time
Jan Feb Mar Apr May
cfu
/10
0m
L
0
100
200
300
400
NPT
BOR
Figure 24. E. coli concentrations from Cottonwood Creek near Fairview Road (01517A). This table includes data from samples processed by NPT WRD staff and the BOR laboratory. The dashed red line indicates the 406 cfu/100mL target criterion for PCR.
Summary of Data, 2015 Cottonwood Creek in headwaters near Fairview Road (01517A)
Turbidity did not exceed the target criterion (Table 13).
DO dropped below the 90% saturation needed for SS on three of the four
sampling events suggesting this location is not fully supporting its SS designated
beneficial use (Table 13).
TSS and pH each exceeded the associated target criterion once (25.0%), with
both occurring during the same sampling event in February during the highest
recorded flow and documented active field erosion occurring. This could indicate
that the monitoring site is not fully supporting designated beneficial uses during
spring runoff (Table 13).
Water temperature did not exceed the SS or CWAL target criteria, likely because
the stream dried up before warmer summer air temperatures began (Table 13,
Figure 21).
NO3+NO2 exceeded the target criterion in all sampling events, while total
phosphorus exceeded only once in February during the highest recorded flow
(Table 13, Figures 22 & 23); therefore, this location is not fully supporting the
two designated beneficial uses of SS and CWAL.
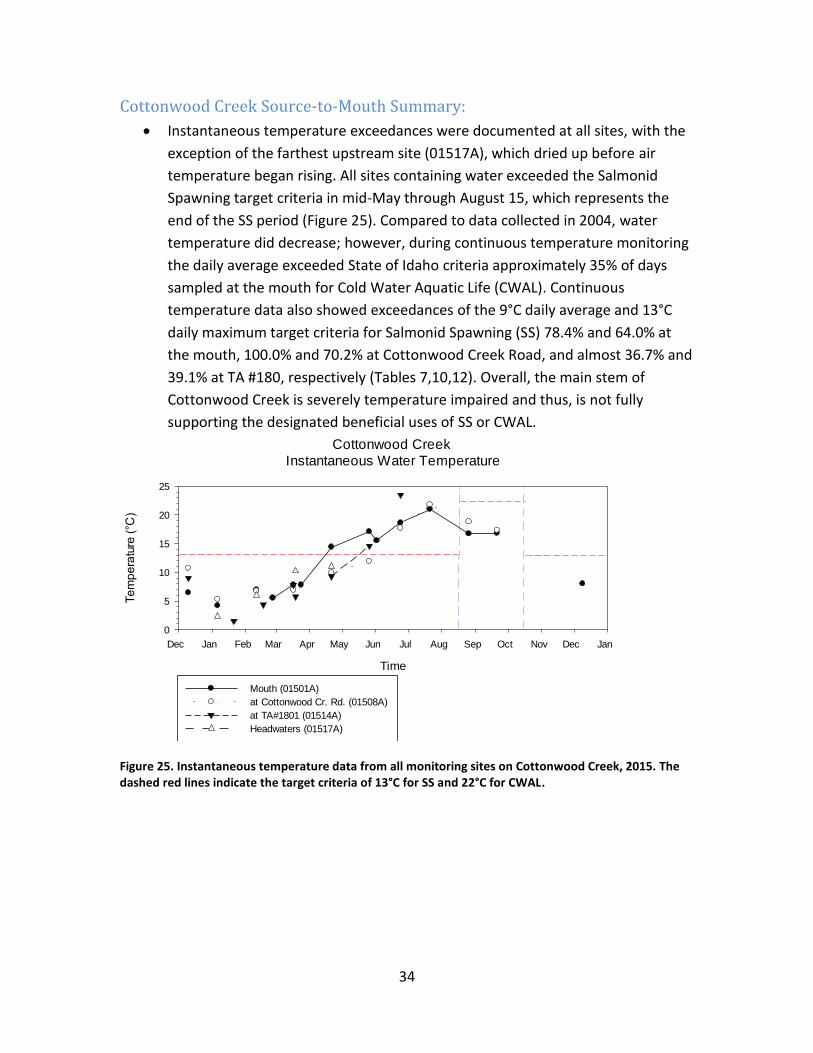
34
Cottonwood Creek Source-to-Mouth Summary:
Instantaneous temperature exceedances were documented at all sites, with the
exception of the farthest upstream site (01517A), which dried up before air
temperature began rising. All sites containing water exceeded the Salmonid
Spawning target criteria in mid-May through August 15, which represents the
end of the SS period (Figure 25). Compared to data collected in 2004, water
temperature did decrease; however, during continuous temperature monitoring
the daily average exceeded State of Idaho criteria approximately 35% of days
sampled at the mouth for Cold Water Aquatic Life (CWAL). Continuous
temperature data also showed exceedances of the 9°C daily average and 13°C
daily maximum target criteria for Salmonid Spawning (SS) 78.4% and 64.0% at
the mouth, 100.0% and 70.2% at Cottonwood Creek Road, and almost 36.7% and
39.1% at TA #180, respectively (Tables 7,10,12). Overall, the main stem of
Cottonwood Creek is severely temperature impaired and thus, is not fully
supporting the designated beneficial uses of SS or CWAL.
Cottonwood Creek
Instantaneous Water Temperature
Time
Dec Jan Feb Mar Apr May Jun Jul Aug Sep Oct Nov Dec Jan
Te
mp
era
ture
(°C
)
0
5
10
15
20
25
Mouth (01501A)
at Cottonwood Cr. Rd. (01508A)
at TA#1801 (01514A)
Headwaters (01517A)
Figure 25. Instantaneous temperature data from all monitoring sites on Cottonwood Creek, 2015. The dashed red lines indicate the target criteria of 13°C for SS and 22°C for CWAL.
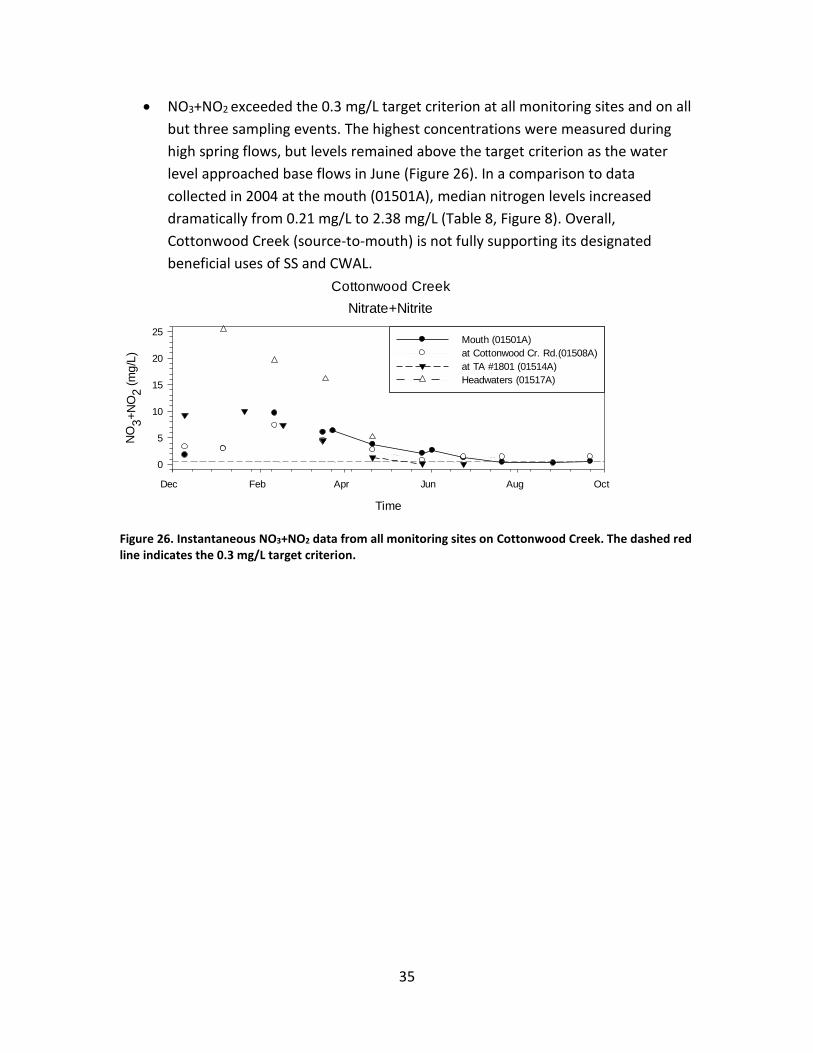
35
NO3+NO2 exceeded the 0.3 mg/L target criterion at all monitoring sites and on all
but three sampling events. The highest concentrations were measured during
high spring flows, but levels remained above the target criterion as the water
level approached base flows in June (Figure 26). In a comparison to data
collected in 2004 at the mouth (01501A), median nitrogen levels increased
dramatically from 0.21 mg/L to 2.38 mg/L (Table 8, Figure 8). Overall,
Cottonwood Creek (source-to-mouth) is not fully supporting its designated
beneficial uses of SS and CWAL.
Cottonwood Creek
Nitrate+Nitrite
Time
Dec Feb Apr Jun Aug Oct
NO
3+
NO
2 (m
g/L
)
0
5
10
15
20
25Mouth (01501A)
at Cottonwood Cr. Rd.(01508A)
at TA #1801 (01514A)
Headwaters (01517A)
Figure 26. Instantaneous NO3+NO2 data from all monitoring sites on Cottonwood Creek. The dashed red line indicates the 0.3 mg/L target criterion.
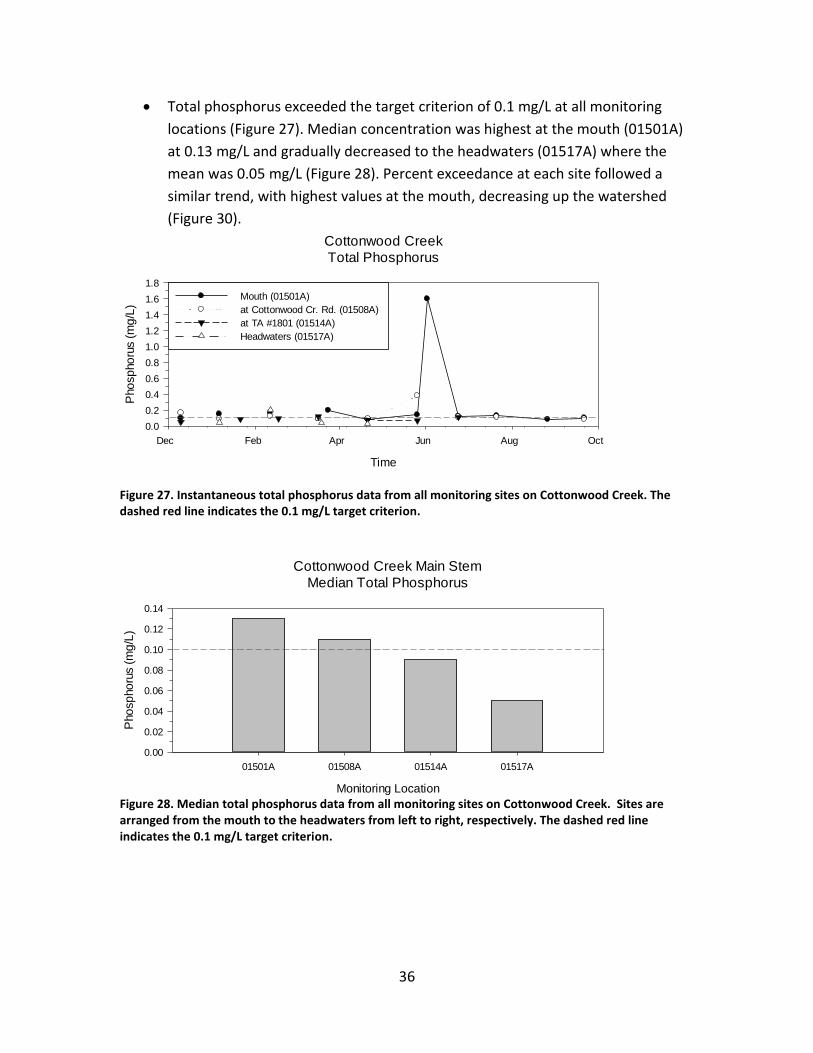
36
Total phosphorus exceeded the target criterion of 0.1 mg/L at all monitoring
locations (Figure 27). Median concentration was highest at the mouth (01501A)
at 0.13 mg/L and gradually decreased to the headwaters (01517A) where the
mean was 0.05 mg/L (Figure 28). Percent exceedance at each site followed a
similar trend, with highest values at the mouth, decreasing up the watershed
(Figure 30).
Cottonwood Creek
Total Phosphorus
Time
Dec Feb Apr Jun Aug Oct
Pho
sp
ho
rus (
mg
/L)
0.0
0.2
0.4
0.6
0.8
1.0
1.2
1.4
1.6
1.8
Mouth (01501A)
at Cottonwood Cr. Rd. (01508A)
at TA #1801 (01514A)
Headwaters (01517A)
Figure 27. Instantaneous total phosphorus data from all monitoring sites on Cottonwood Creek. The dashed red line indicates the 0.1 mg/L target criterion.
Cottonwood Creek Main Stem
Median Total Phosphorus
Monitoring Location
01501A 01508A 01514A 01517A
Pho
sp
ho
rus (
mg
/L)
0.00
0.02
0.04
0.06
0.08
0.10
0.12
0.14
Figure 28. Median total phosphorus data from all monitoring sites on Cottonwood Creek. Sites are arranged from the mouth to the headwaters from left to right, respectively. The dashed red line indicates the 0.1 mg/L target criterion.
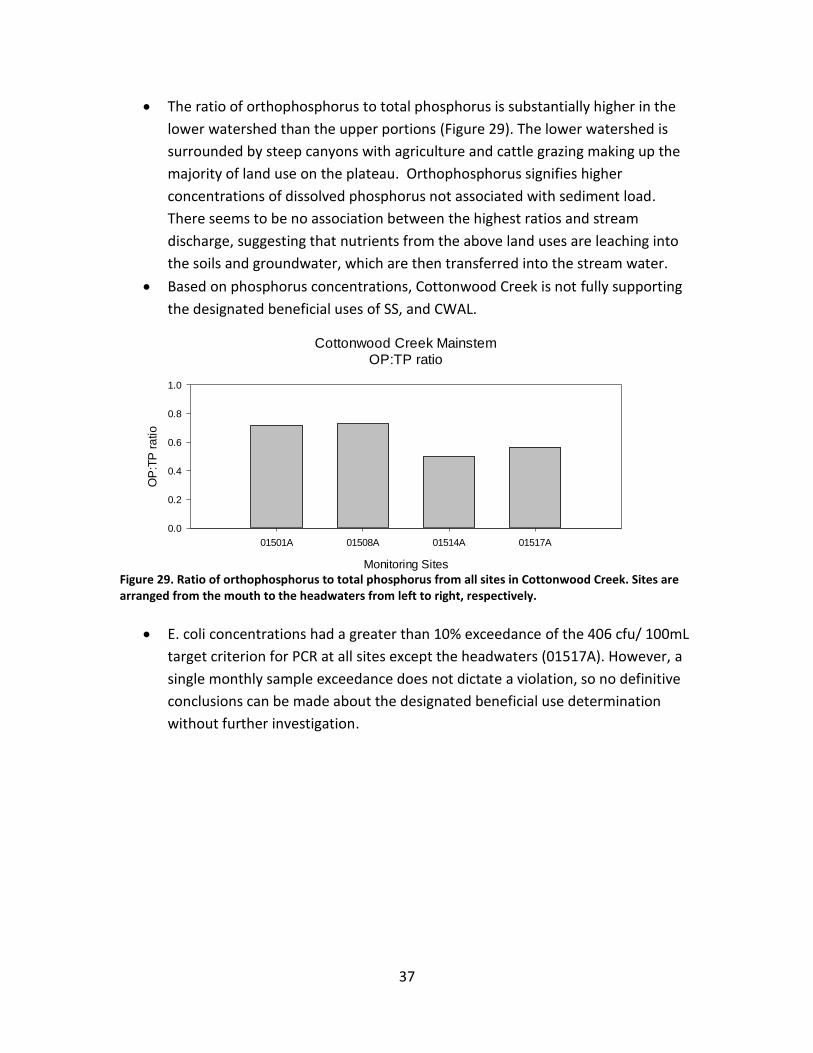
37
The ratio of orthophosphorus to total phosphorus is substantially higher in the
lower watershed than the upper portions (Figure 29). The lower watershed is
surrounded by steep canyons with agriculture and cattle grazing making up the
majority of land use on the plateau. Orthophosphorus signifies higher
concentrations of dissolved phosphorus not associated with sediment load.
There seems to be no association between the highest ratios and stream
discharge, suggesting that nutrients from the above land uses are leaching into
the soils and groundwater, which are then transferred into the stream water.
Based on phosphorus concentrations, Cottonwood Creek is not fully supporting
the designated beneficial uses of SS, and CWAL.
Cottonwood Creek Mainstem
OP:TP ratio
Monitoring Sites
01501A 01508A 01514A 01517A
OP
:TP
ra
tio
0.0
0.2
0.4
0.6
0.8
1.0
Figure 29. Ratio of orthophosphorus to total phosphorus from all sites in Cottonwood Creek. Sites are arranged from the mouth to the headwaters from left to right, respectively.
E. coli concentrations had a greater than 10% exceedance of the 406 cfu/ 100mL
target criterion for PCR at all sites except the headwaters (01517A). However, a
single monthly sample exceedance does not dictate a violation, so no definitive
conclusions can be made about the designated beneficial use determination
without further investigation.
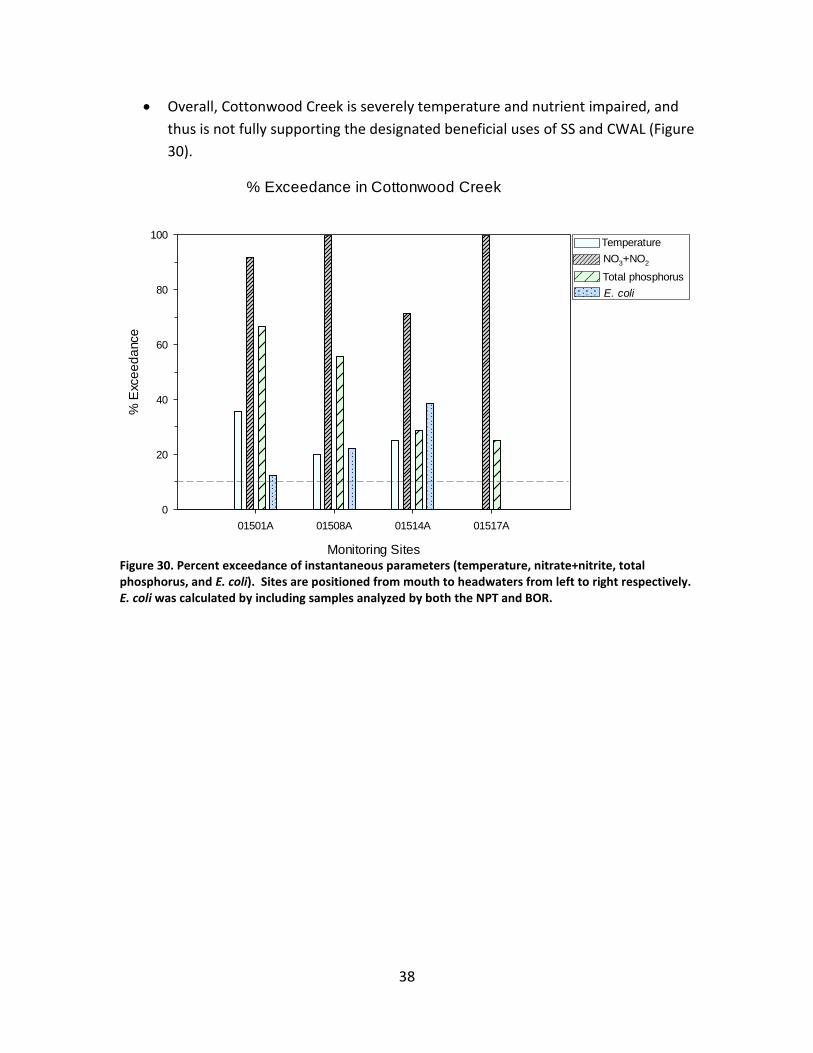
38
Overall, Cottonwood Creek is severely temperature and nutrient impaired, and
thus is not fully supporting the designated beneficial uses of SS and CWAL (Figure
30).
% Exceedance in Cottonwood Creek
Monitoring Sites
01501A 01508A 01514A 01517A
% E
xce
ed
ance
0
20
40
60
80
100
Total phosphorus
Temperature
NO3+NO2
E. coli
Figure 30. Percent exceedance of instantaneous parameters (temperature, nitrate+nitrite, total phosphorus, and E. coli). Sites are positioned from mouth to headwaters from left to right respectively. E. coli was calculated by including samples analyzed by both the NPT and BOR.
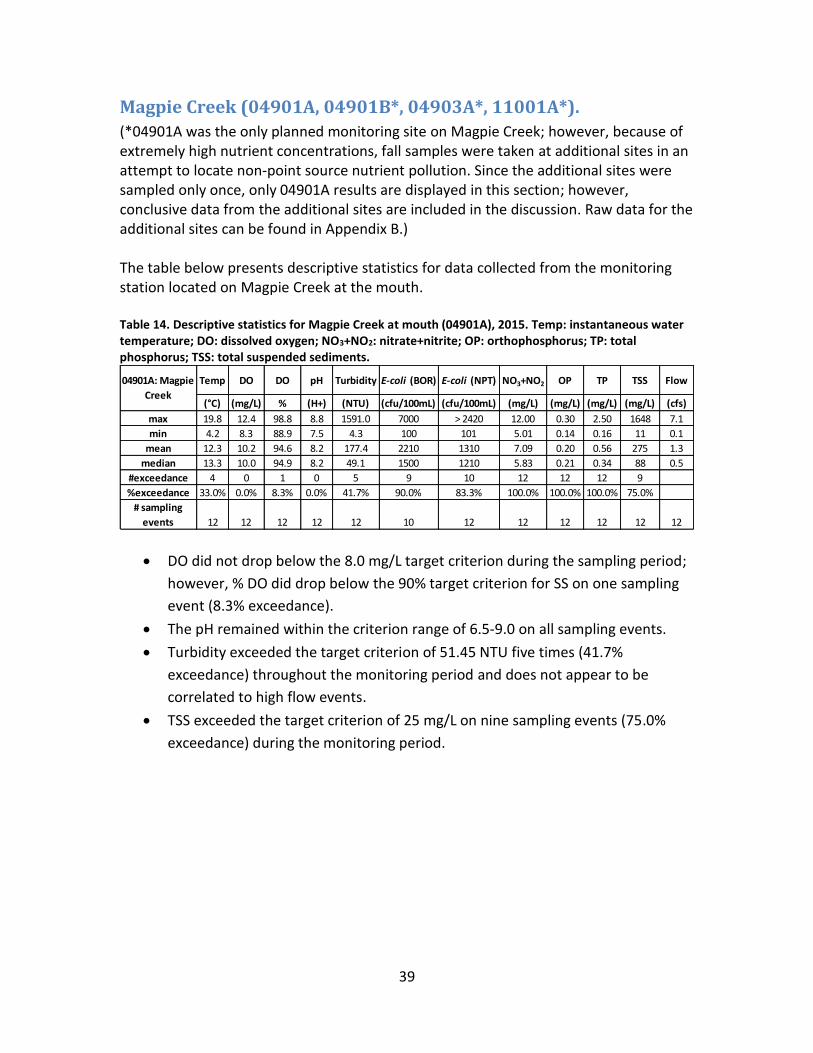
39
Magpie Creek (04901A, 04901B*, 04903A*, 11001A*).
(*04901A was the only planned monitoring site on Magpie Creek; however, because of extremely high nutrient concentrations, fall samples were taken at additional sites in an attempt to locate non-point source nutrient pollution. Since the additional sites were sampled only once, only 04901A results are displayed in this section; however, conclusive data from the additional sites are included in the discussion. Raw data for the additional sites can be found in Appendix B.) The table below presents descriptive statistics for data collected from the monitoring station located on Magpie Creek at the mouth. Table 14. Descriptive statistics for Magpie Creek at mouth (04901A), 2015. Temp: instantaneous water temperature; DO: dissolved oxygen; NO3+NO2: nitrate+nitrite; OP: orthophosphorus; TP: total phosphorus; TSS: total suspended sediments.
DO did not drop below the 8.0 mg/L target criterion during the sampling period;
however, % DO did drop below the 90% target criterion for SS on one sampling
event (8.3% exceedance).
The pH remained within the criterion range of 6.5-9.0 on all sampling events.
Turbidity exceeded the target criterion of 51.45 NTU five times (41.7%
exceedance) throughout the monitoring period and does not appear to be
correlated to high flow events.
TSS exceeded the target criterion of 25 mg/L on nine sampling events (75.0%
exceedance) during the monitoring period.
Temp DO DO pH Turbidity E-coli (BOR) E-coli (NPT) NO3+NO2 OP TP TSS Flow
(°C) (mg/L) % (H+) (NTU) (cfu/100mL) (cfu/100mL) (mg/L) (mg/L) (mg/L) (mg/L) (cfs)
max 19.8 12.4 98.8 8.8 1591.0 7000 > 2420 12.00 0.30 2.50 1648 7.1
min 4.2 8.3 88.9 7.5 4.3 100 101 5.01 0.14 0.16 11 0.1
mean 12.3 10.2 94.6 8.2 177.4 2210 1310 7.09 0.20 0.56 275 1.3
median 13.3 10.0 94.9 8.2 49.1 1500 1210 5.83 0.21 0.34 88 0.5
#exceedance 4 0 1 0 5 9 10 12 12 12 9
%exceedance 33.0% 0.0% 8.3% 0.0% 41.7% 90.0% 83.3% 100.0% 100.0% 100.0% 75.0%
# sampling
events 12 12 12 12 12 10 12 12 12 12 12 12
04901A: Magpie
Creek
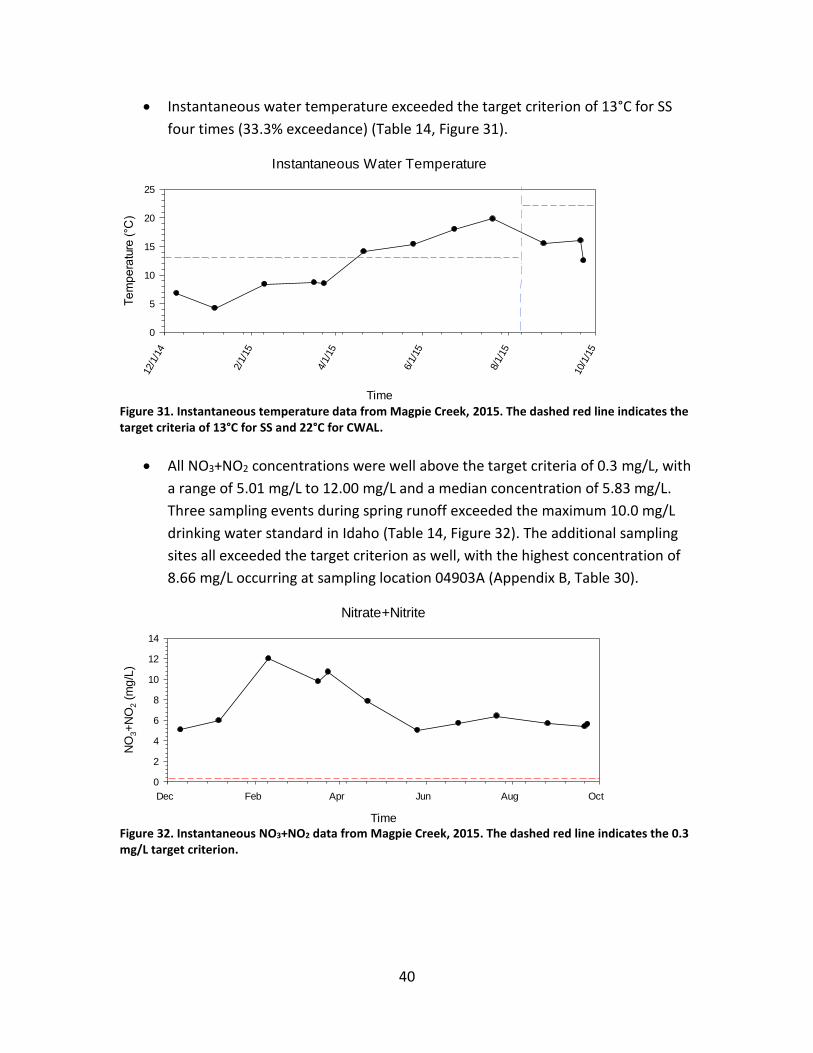
40
Instantaneous water temperature exceeded the target criterion of 13°C for SS
four times (33.3% exceedance) (Table 14, Figure 31).
Instantaneous Water Temperature
Time
12/1
/14
2/1/
15
4/1/
15
6/1/
15
8/1/
15
10/1
/15
Te
mp
era
ture
(°C
)
0
5
10
15
20
25
Figure 31. Instantaneous temperature data from Magpie Creek, 2015. The dashed red line indicates the target criteria of 13°C for SS and 22°C for CWAL.
All NO3+NO2 concentrations were well above the target criteria of 0.3 mg/L, with
a range of 5.01 mg/L to 12.00 mg/L and a median concentration of 5.83 mg/L.
Three sampling events during spring runoff exceeded the maximum 10.0 mg/L
drinking water standard in Idaho (Table 14, Figure 32). The additional sampling
sites all exceeded the target criterion as well, with the highest concentration of
8.66 mg/L occurring at sampling location 04903A (Appendix B, Table 30).
Nitrate+Nitrite
Time
Dec Feb Apr Jun Aug Oct
NO
3+
NO
2 (
mg
/L)
0
2
4
6
8
10
12
14
Figure 32. Instantaneous NO3+NO2 data from Magpie Creek, 2015. The dashed red line indicates the 0.3 mg/L target criterion.
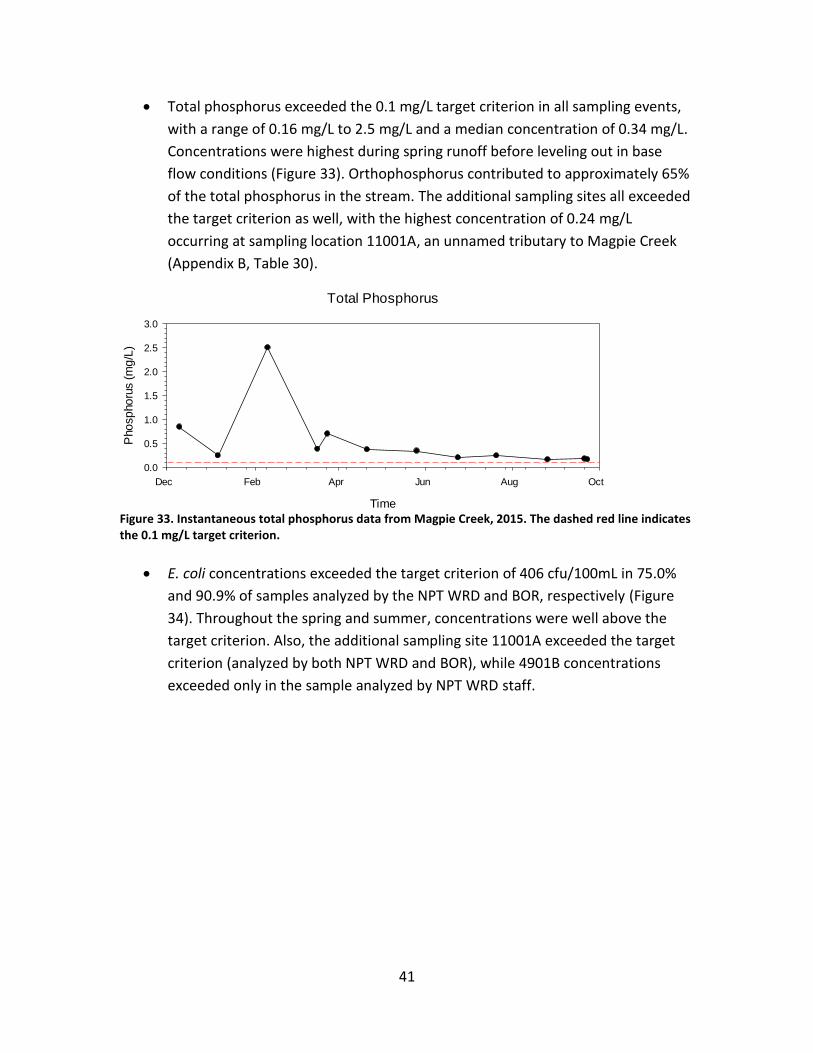
41
Total phosphorus exceeded the 0.1 mg/L target criterion in all sampling events,
with a range of 0.16 mg/L to 2.5 mg/L and a median concentration of 0.34 mg/L.
Concentrations were highest during spring runoff before leveling out in base
flow conditions (Figure 33). Orthophosphorus contributed to approximately 65%
of the total phosphorus in the stream. The additional sampling sites all exceeded
the target criterion as well, with the highest concentration of 0.24 mg/L
occurring at sampling location 11001A, an unnamed tributary to Magpie Creek
(Appendix B, Table 30).
Total Phosphorus
Time
Dec Feb Apr Jun Aug Oct
Pho
sp
ho
rus (
mg
/L)
0.0
0.5
1.0
1.5
2.0
2.5
3.0
Figure 33. Instantaneous total phosphorus data from Magpie Creek, 2015. The dashed red line indicates the 0.1 mg/L target criterion.
E. coli concentrations exceeded the target criterion of 406 cfu/100mL in 75.0%
and 90.9% of samples analyzed by the NPT WRD and BOR, respectively (Figure
34). Throughout the spring and summer, concentrations were well above the
target criterion. Also, the additional sampling site 11001A exceeded the target
criterion (analyzed by both NPT WRD and BOR), while 4901B concentrations
exceeded only in the sample analyzed by NPT WRD staff.
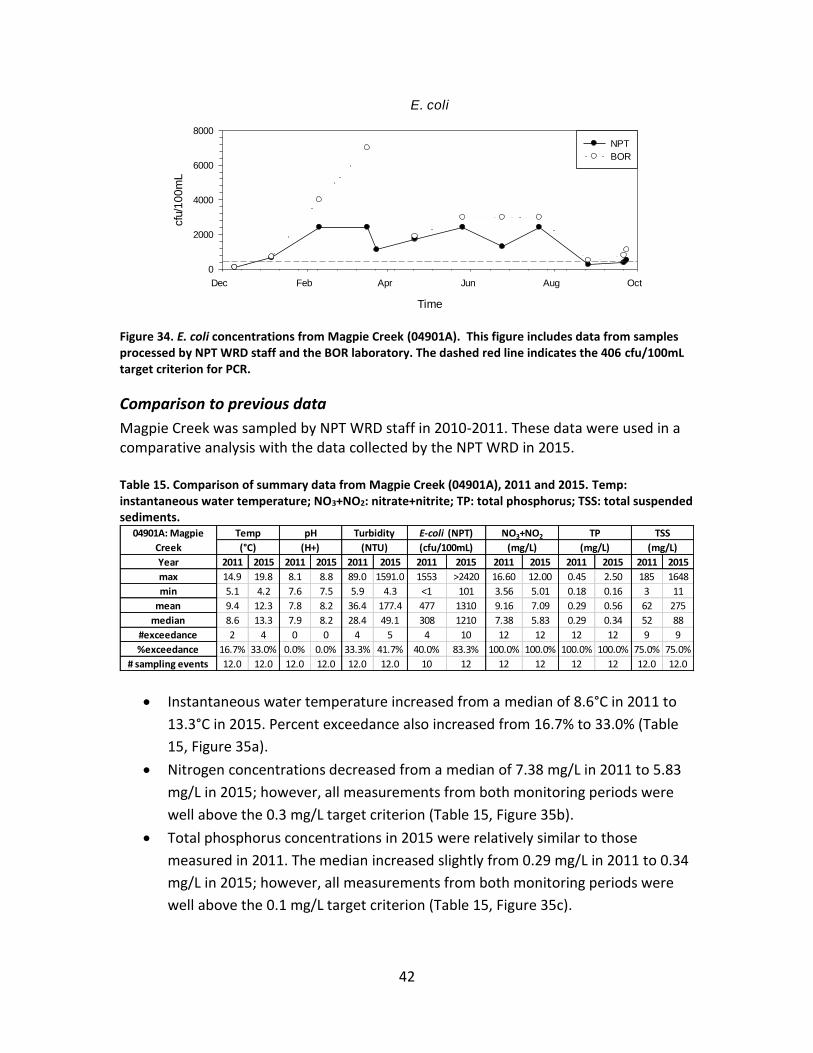
42
E. coli
Time
Dec Feb Apr Jun Aug Oct
cfu
/10
0m
L
0
2000
4000
6000
8000
NPT
BOR
Figure 34. E. coli concentrations from Magpie Creek (04901A). This figure includes data from samples processed by NPT WRD staff and the BOR laboratory. The dashed red line indicates the 406 cfu/100mL target criterion for PCR.
Comparison to previous data
Magpie Creek was sampled by NPT WRD staff in 2010-2011. These data were used in a comparative analysis with the data collected by the NPT WRD in 2015. Table 15. Comparison of summary data from Magpie Creek (04901A), 2011 and 2015. Temp: instantaneous water temperature; NO3+NO2: nitrate+nitrite; TP: total phosphorus; TSS: total suspended sediments.
Instantaneous water temperature increased from a median of 8.6°C in 2011 to
13.3°C in 2015. Percent exceedance also increased from 16.7% to 33.0% (Table
15, Figure 35a).
Nitrogen concentrations decreased from a median of 7.38 mg/L in 2011 to 5.83
mg/L in 2015; however, all measurements from both monitoring periods were
well above the 0.3 mg/L target criterion (Table 15, Figure 35b).
Total phosphorus concentrations in 2015 were relatively similar to those
measured in 2011. The median increased slightly from 0.29 mg/L in 2011 to 0.34
mg/L in 2015; however, all measurements from both monitoring periods were
well above the 0.1 mg/L target criterion (Table 15, Figure 35c).
Year 2011 2015 2011 2015 2011 2015 2011 2015 2011 2015 2011 2015 2011 2015
max 14.9 19.8 8.1 8.8 89.0 1591.0 1553 >2420 16.60 12.00 0.45 2.50 185 1648
min 5.1 4.2 7.6 7.5 5.9 4.3 <1 101 3.56 5.01 0.18 0.16 3 11
mean 9.4 12.3 7.8 8.2 36.4 177.4 477 1310 9.16 7.09 0.29 0.56 62 275
median 8.6 13.3 7.9 8.2 28.4 49.1 308 1210 7.38 5.83 0.29 0.34 52 88
#exceedance 2 4 0 0 4 5 4 10 12 12 12 12 9 9
%exceedance 16.7% 33.0% 0.0% 0.0% 33.3% 41.7% 40.0% 83.3% 100.0% 100.0% 100.0% 100.0% 75.0% 75.0%
# sampling events 12.0 12.0 12.0 12.0 12.0 12.0 10 12 12 12 12 12 12.0 12.0
TP TSS
(°C) (H+) (NTU) (cfu/100mL) (mg/L) (mg/L) (mg/L)
NO3+NO204901A: Magpie
Creek
Temp pH Turbidity E-coli (NPT)
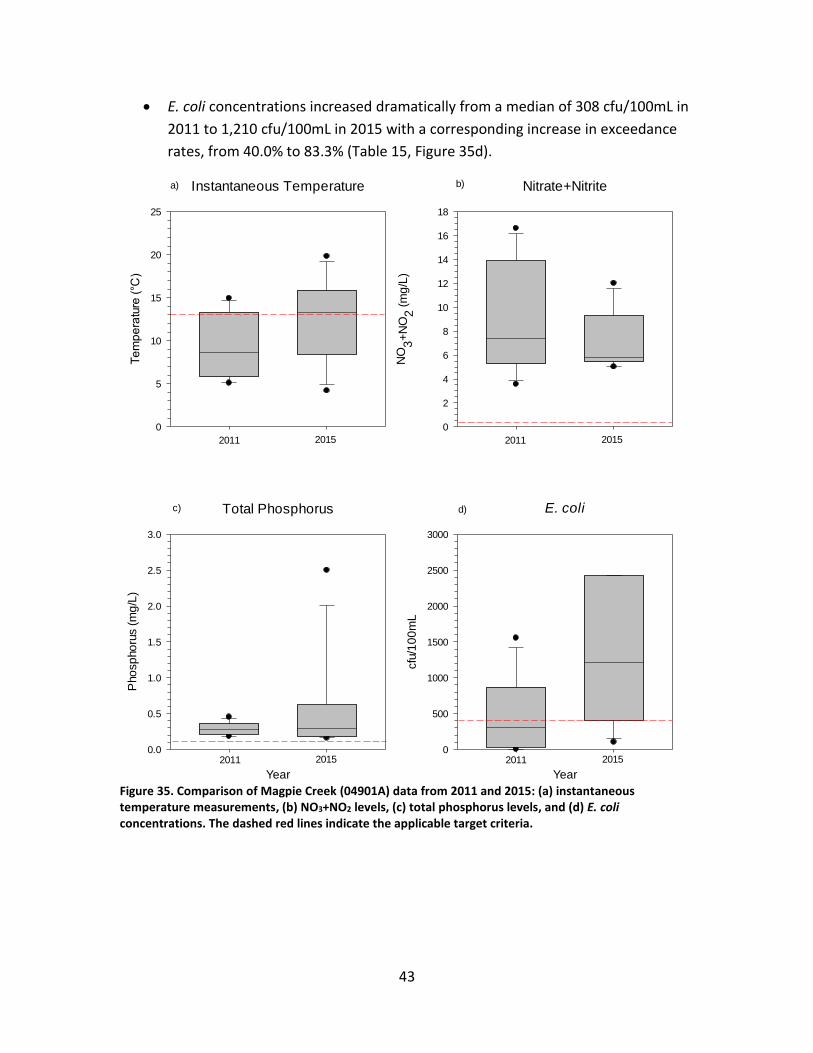
43
E. coli concentrations increased dramatically from a median of 308 cfu/100mL in
2011 to 1,210 cfu/100mL in 2015 with a corresponding increase in exceedance
rates, from 40.0% to 83.3% (Table 15, Figure 35d).
a) b)
c) d)
Instantaneous Temperature
Te
mp
era
ture
(°C
)
0
5
10
15
20
25
Nitrate+Nitrite
NO
3+
NO
2 (
mg
/L)
0
2
4
6
8
10
12
14
16
18
E. coli
Year
cfu
/10
0m
L
0
500
1000
1500
2000
2500
3000
Total Phosphorus
Year
Pho
sp
ho
rus (
mg
/L)
0.0
0.5
1.0
1.5
2.0
2.5
3.0
2011 2015 2011 2015
2011 2015 2011 2015
Figure 35. Comparison of Magpie Creek (04901A) data from 2011 and 2015: (a) instantaneous temperature measurements, (b) NO3+NO2 levels, (c) total phosphorus levels, and (d) E. coli concentrations. The dashed red lines indicate the applicable target criteria.
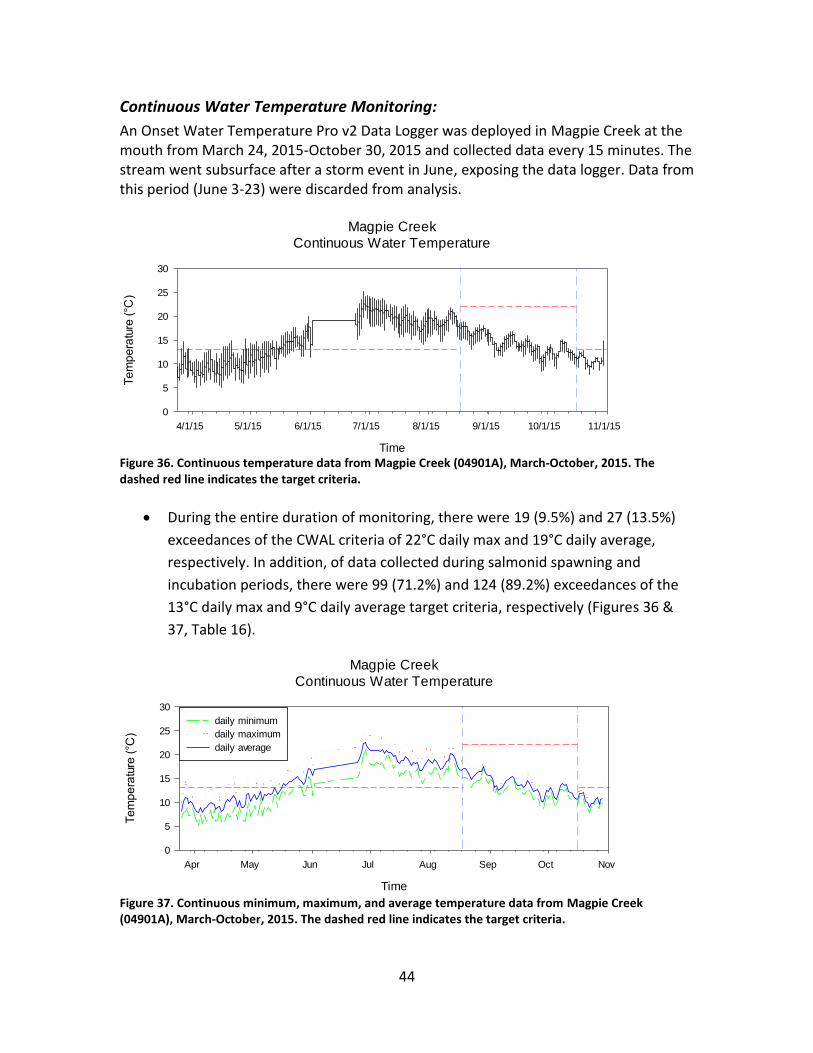
44
Continuous Water Temperature Monitoring:
An Onset Water Temperature Pro v2 Data Logger was deployed in Magpie Creek at the mouth from March 24, 2015-October 30, 2015 and collected data every 15 minutes. The stream went subsurface after a storm event in June, exposing the data logger. Data from this period (June 3-23) were discarded from analysis.
Magpie Creek
Continuous Water Temperature
Time
4/1/15 5/1/15 6/1/15 7/1/15 8/1/15 9/1/15 10/1/15 11/1/15
Te
mp
era
ture
(°C
)
0
5
10
15
20
25
30
Figure 36. Continuous temperature data from Magpie Creek (04901A), March-October, 2015. The dashed red line indicates the target criteria.
During the entire duration of monitoring, there were 19 (9.5%) and 27 (13.5%)
exceedances of the CWAL criteria of 22°C daily max and 19°C daily average,
respectively. In addition, of data collected during salmonid spawning and
incubation periods, there were 99 (71.2%) and 124 (89.2%) exceedances of the
13°C daily max and 9°C daily average target criteria, respectively (Figures 36 &
37, Table 16).
Magpie Creek
Continuous Water Temperature
Time
Apr May Jun Jul Aug Sep Oct Nov
Te
mp
era
ture
(°C
)
0
5
10
15
20
25
30
daily minimum
daily maximum
daily average
Figure 37. Continuous minimum, maximum, and average temperature data from Magpie Creek (04901A), March-October, 2015. The dashed red line indicates the target criteria.
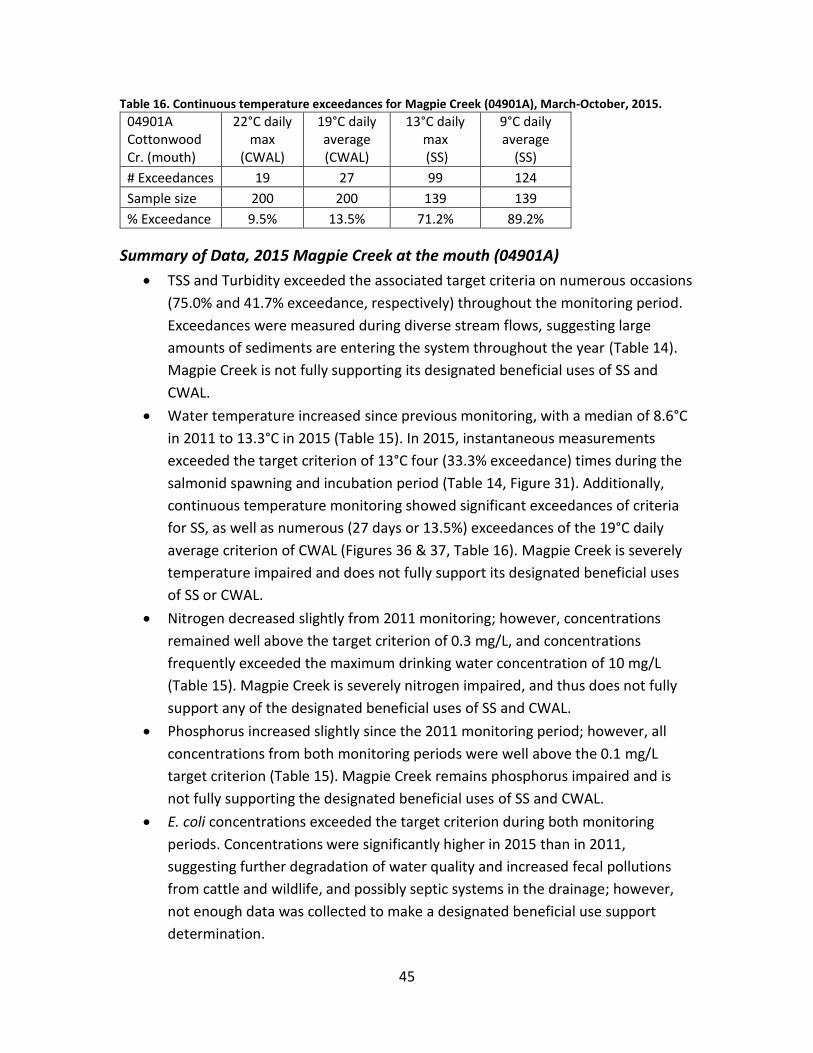
45
Table 16. Continuous temperature exceedances for Magpie Creek (04901A), March-October, 2015.
04901A Cottonwood Cr. (mouth)
22°C daily max
(CWAL)
19°C daily average (CWAL)
13°C daily max (SS)
9°C daily average
(SS)
# Exceedances 19 27 99 124
Sample size 200 200 139 139
% Exceedance 9.5% 13.5% 71.2% 89.2%
Summary of Data, 2015 Magpie Creek at the mouth (04901A)
TSS and Turbidity exceeded the associated target criteria on numerous occasions
(75.0% and 41.7% exceedance, respectively) throughout the monitoring period.
Exceedances were measured during diverse stream flows, suggesting large
amounts of sediments are entering the system throughout the year (Table 14).
Magpie Creek is not fully supporting its designated beneficial uses of SS and
CWAL.
Water temperature increased since previous monitoring, with a median of 8.6°C
in 2011 to 13.3°C in 2015 (Table 15). In 2015, instantaneous measurements
exceeded the target criterion of 13°C four (33.3% exceedance) times during the
salmonid spawning and incubation period (Table 14, Figure 31). Additionally,
continuous temperature monitoring showed significant exceedances of criteria
for SS, as well as numerous (27 days or 13.5%) exceedances of the 19°C daily
average criterion of CWAL (Figures 36 & 37, Table 16). Magpie Creek is severely
temperature impaired and does not fully support its designated beneficial uses
of SS or CWAL.
Nitrogen decreased slightly from 2011 monitoring; however, concentrations
remained well above the target criterion of 0.3 mg/L, and concentrations
frequently exceeded the maximum drinking water concentration of 10 mg/L
(Table 15). Magpie Creek is severely nitrogen impaired, and thus does not fully
support any of the designated beneficial uses of SS and CWAL.
Phosphorus increased slightly since the 2011 monitoring period; however, all
concentrations from both monitoring periods were well above the 0.1 mg/L
target criterion (Table 15). Magpie Creek remains phosphorus impaired and is
not fully supporting the designated beneficial uses of SS and CWAL.
E. coli concentrations exceeded the target criterion during both monitoring
periods. Concentrations were significantly higher in 2015 than in 2011,
suggesting further degradation of water quality and increased fecal pollutions
from cattle and wildlife, and possibly septic systems in the drainage; however,
not enough data was collected to make a designated beneficial use support
determination.

46
Overall, Magpie Creek is severely temperature and nutrient impaired and is not
fully supporting the designated beneficial uses of SS and CWAL. Additional
sampling was not conclusive in helping to locate the sources of excess nutrient
sources in this watershed, as all sample sites showed extremely elevated
nutrients concentrations; therefore, additional monitoring is recommended.
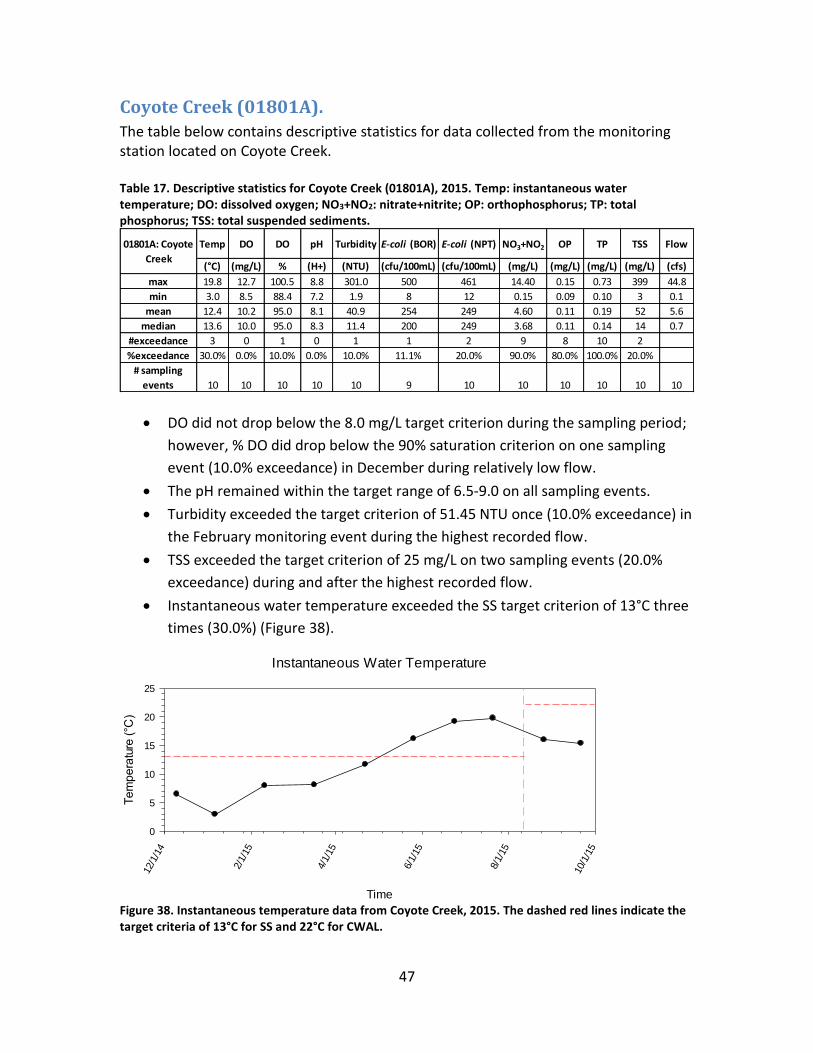
47
Coyote Creek (01801A).
The table below contains descriptive statistics for data collected from the monitoring station located on Coyote Creek. Table 17. Descriptive statistics for Coyote Creek (01801A), 2015. Temp: instantaneous water temperature; DO: dissolved oxygen; NO3+NO2: nitrate+nitrite; OP: orthophosphorus; TP: total phosphorus; TSS: total suspended sediments.
DO did not drop below the 8.0 mg/L target criterion during the sampling period;
however, % DO did drop below the 90% saturation criterion on one sampling
event (10.0% exceedance) in December during relatively low flow.
The pH remained within the target range of 6.5-9.0 on all sampling events.
Turbidity exceeded the target criterion of 51.45 NTU once (10.0% exceedance) in
the February monitoring event during the highest recorded flow.
TSS exceeded the target criterion of 25 mg/L on two sampling events (20.0%
exceedance) during and after the highest recorded flow.
Instantaneous water temperature exceeded the SS target criterion of 13°C three
times (30.0%) (Figure 38).
Instantaneous Water Temperature
Time
12/1
/14
2/1/
15
4/1/
15
6/1/
15
8/1/
15
10/1
/15
Te
mp
era
ture
(°C
)
0
5
10
15
20
25
Figure 38. Instantaneous temperature data from Coyote Creek, 2015. The dashed red lines indicate the target criteria of 13°C for SS and 22°C for CWAL.
Temp DO DO pH Turbidity E-coli (BOR) E-coli (NPT) NO3+NO2 OP TP TSS Flow
(°C) (mg/L) % (H+) (NTU) (cfu/100mL) (cfu/100mL) (mg/L) (mg/L) (mg/L) (mg/L) (cfs)
max 19.8 12.7 100.5 8.8 301.0 500 461 14.40 0.15 0.73 399 44.8
min 3.0 8.5 88.4 7.2 1.9 8 12 0.15 0.09 0.10 3 0.1
mean 12.4 10.2 95.0 8.1 40.9 254 249 4.60 0.11 0.19 52 5.6
median 13.6 10.0 95.0 8.3 11.4 200 249 3.68 0.11 0.14 14 0.7
#exceedance 3 0 1 0 1 1 2 9 8 10 2
%exceedance 30.0% 0.0% 10.0% 0.0% 10.0% 11.1% 20.0% 90.0% 80.0% 100.0% 20.0%
# sampling
events 10 10 10 10 10 9 10 10 10 10 10 10
01801A: Coyote
Creek
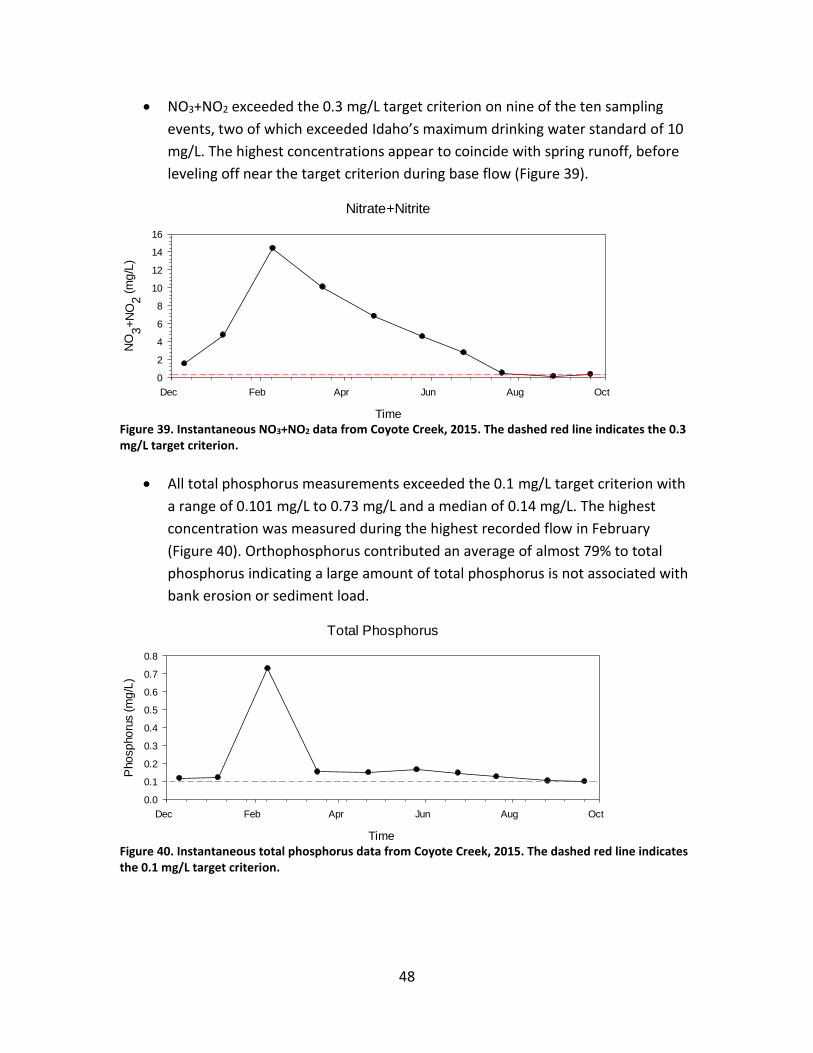
48
NO3+NO2 exceeded the 0.3 mg/L target criterion on nine of the ten sampling
events, two of which exceeded Idaho’s maximum drinking water standard of 10
mg/L. The highest concentrations appear to coincide with spring runoff, before
leveling off near the target criterion during base flow (Figure 39).
Nitrate+Nitrite
Time
Dec Feb Apr Jun Aug Oct
NO
3+
NO
2 (
mg
/L)
0
2
4
6
8
10
12
14
16
Figure 39. Instantaneous NO3+NO2 data from Coyote Creek, 2015. The dashed red line indicates the 0.3 mg/L target criterion.
All total phosphorus measurements exceeded the 0.1 mg/L target criterion with
a range of 0.101 mg/L to 0.73 mg/L and a median of 0.14 mg/L. The highest
concentration was measured during the highest recorded flow in February
(Figure 40). Orthophosphorus contributed an average of almost 79% to total
phosphorus indicating a large amount of total phosphorus is not associated with
bank erosion or sediment load.
Total Phosphorus
Time
Dec Feb Apr Jun Aug Oct
Pho
spho
rus (
mg
/L)
0.0
0.1
0.2
0.3
0.4
0.5
0.6
0.7
0.8
Figure 40. Instantaneous total phosphorus data from Coyote Creek, 2015. The dashed red line indicates the 0.1 mg/L target criterion.
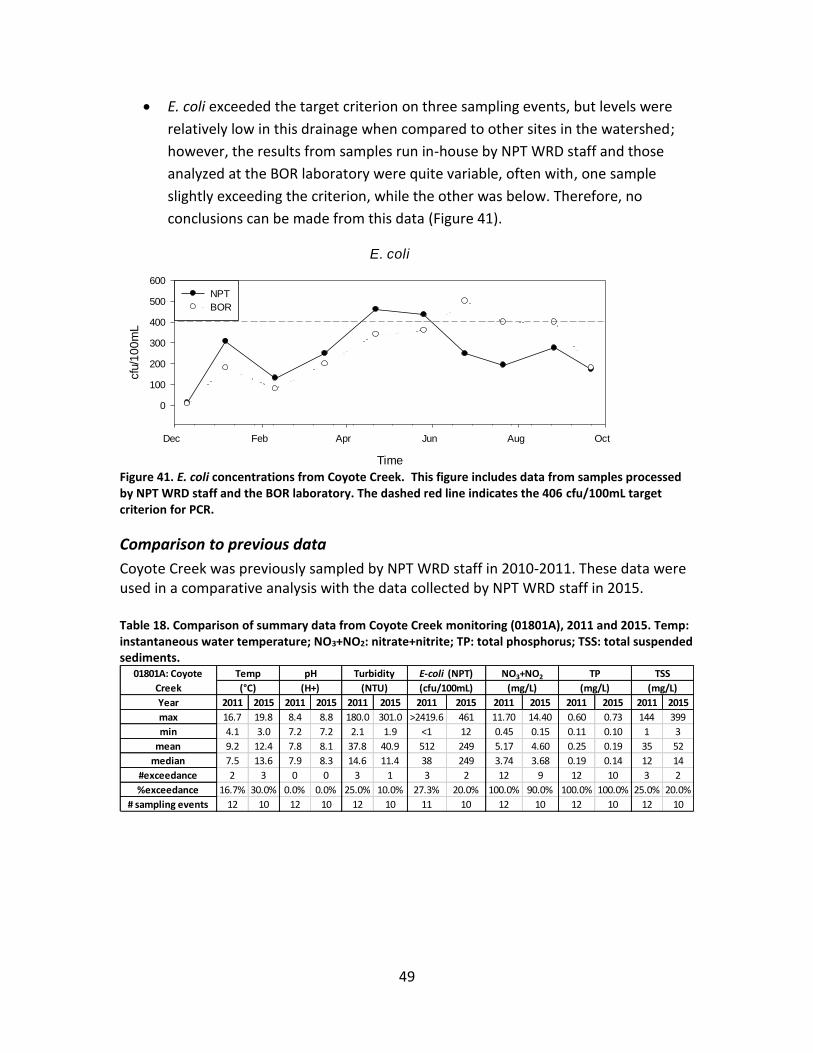
49
E. coli exceeded the target criterion on three sampling events, but levels were
relatively low in this drainage when compared to other sites in the watershed;
however, the results from samples run in-house by NPT WRD staff and those
analyzed at the BOR laboratory were quite variable, often with, one sample
slightly exceeding the criterion, while the other was below. Therefore, no
conclusions can be made from this data (Figure 41).
E. coli
Time
Dec Feb Apr Jun Aug Oct
cfu
/10
0m
L
0
100
200
300
400
500
600
NPT
BOR
Figure 41. E. coli concentrations from Coyote Creek. This figure includes data from samples processed by NPT WRD staff and the BOR laboratory. The dashed red line indicates the 406 cfu/100mL target criterion for PCR.
Comparison to previous data
Coyote Creek was previously sampled by NPT WRD staff in 2010-2011. These data were used in a comparative analysis with the data collected by NPT WRD staff in 2015. Table 18. Comparison of summary data from Coyote Creek monitoring (01801A), 2011 and 2015. Temp: instantaneous water temperature; NO3+NO2: nitrate+nitrite; TP: total phosphorus; TSS: total suspended sediments.
Year 2011 2015 2011 2015 2011 2015 2011 2015 2011 2015 2011 2015 2011 2015
max 16.7 19.8 8.4 8.8 180.0 301.0 >2419.6 461 11.70 14.40 0.60 0.73 144 399
min 4.1 3.0 7.2 7.2 2.1 1.9 <1 12 0.45 0.15 0.11 0.10 1 3
mean 9.2 12.4 7.8 8.1 37.8 40.9 512 249 5.17 4.60 0.25 0.19 35 52
median 7.5 13.6 7.9 8.3 14.6 11.4 38 249 3.74 3.68 0.19 0.14 12 14
#exceedance 2 3 0 0 3 1 3 2 12 9 12 10 3 2
%exceedance 16.7% 30.0% 0.0% 0.0% 25.0% 10.0% 27.3% 20.0% 100.0% 90.0% 100.0% 100.0% 25.0% 20.0%
# sampling events 12 10 12 10 12 10 11 10 12 10 12 10 12 10
TP TSS
(°C) (H+) (NTU) (cfu/100mL) (mg/L) (mg/L) (mg/L)
NO3+NO201801A: Coyote
Creek
Temp pH Turbidity E-coli (NPT)
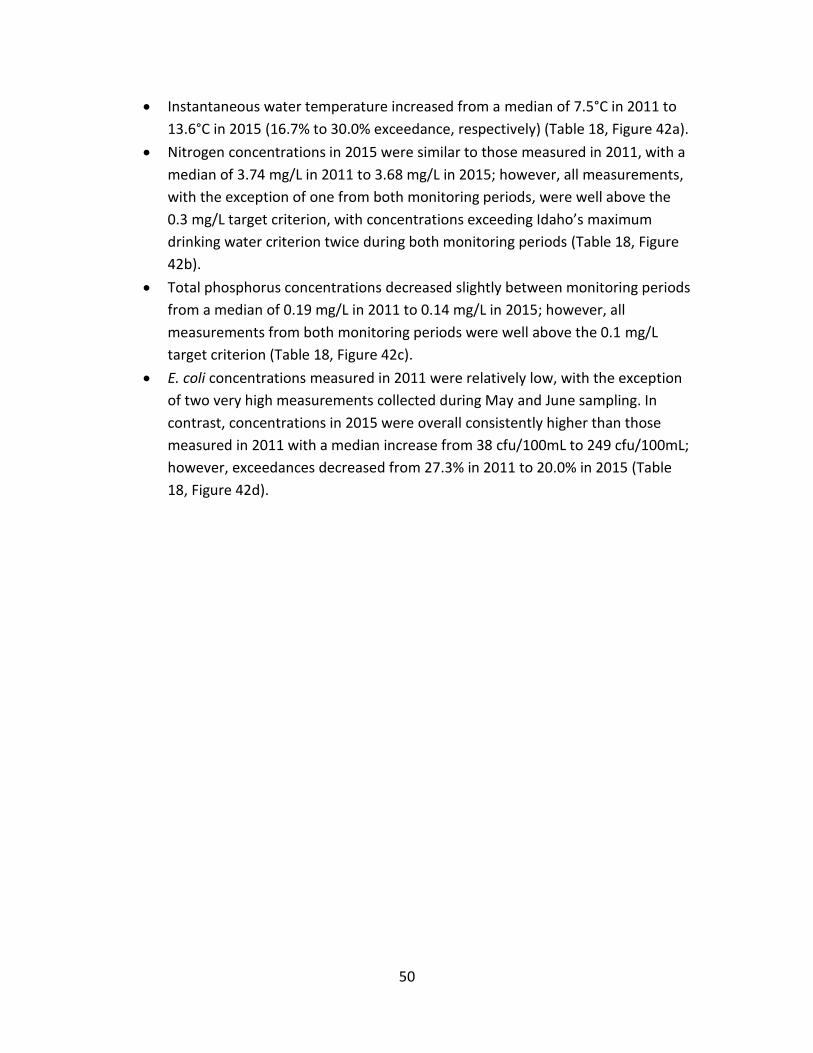
50
Instantaneous water temperature increased from a median of 7.5°C in 2011 to
13.6°C in 2015 (16.7% to 30.0% exceedance, respectively) (Table 18, Figure 42a).
Nitrogen concentrations in 2015 were similar to those measured in 2011, with a
median of 3.74 mg/L in 2011 to 3.68 mg/L in 2015; however, all measurements,
with the exception of one from both monitoring periods, were well above the
0.3 mg/L target criterion, with concentrations exceeding Idaho’s maximum
drinking water criterion twice during both monitoring periods (Table 18, Figure
42b).
Total phosphorus concentrations decreased slightly between monitoring periods
from a median of 0.19 mg/L in 2011 to 0.14 mg/L in 2015; however, all
measurements from both monitoring periods were well above the 0.1 mg/L
target criterion (Table 18, Figure 42c).
E. coli concentrations measured in 2011 were relatively low, with the exception
of two very high measurements collected during May and June sampling. In
contrast, concentrations in 2015 were overall consistently higher than those
measured in 2011 with a median increase from 38 cfu/100mL to 249 cfu/100mL;
however, exceedances decreased from 27.3% in 2011 to 20.0% in 2015 (Table
18, Figure 42d).
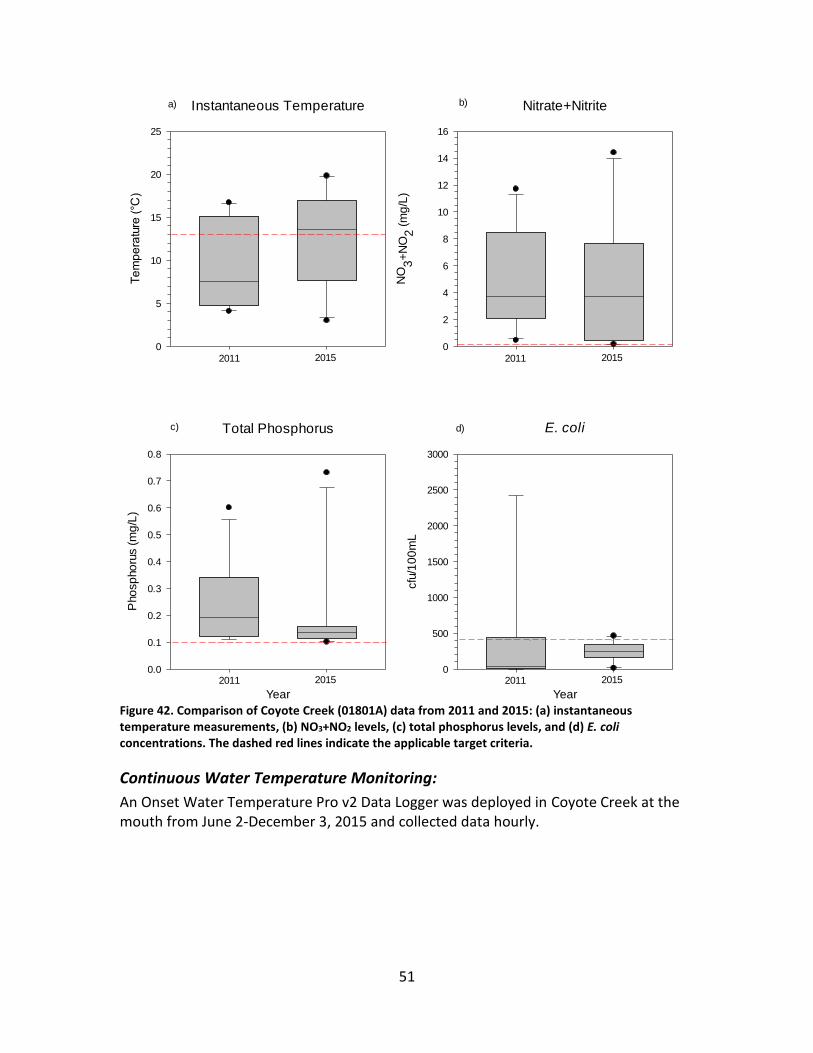
51
Instantaneous Temperature
Te
mp
era
ture
(°C
)
0
5
10
15
20
25
Nitrate+Nitrite
NO
3+
NO
2 (
mg
/L)
0
2
4
6
8
10
12
14
16
E. coli
Year
cfu
/10
0m
L
0
500
1000
1500
2000
2500
3000
Total Phosphorus
Year
Pho
sp
ho
rus (
mg
/L)
0.0
0.1
0.2
0.3
0.4
0.5
0.6
0.7
0.8
2011 2015 2011 2015
2011 2015 2011 2015
a) b)
c) d)
Figure 42. Comparison of Coyote Creek (01801A) data from 2011 and 2015: (a) instantaneous temperature measurements, (b) NO3+NO2 levels, (c) total phosphorus levels, and (d) E. coli concentrations. The dashed red lines indicate the applicable target criteria.
Continuous Water Temperature Monitoring:
An Onset Water Temperature Pro v2 Data Logger was deployed in Coyote Creek at the mouth from June 2-December 3, 2015 and collected data hourly.
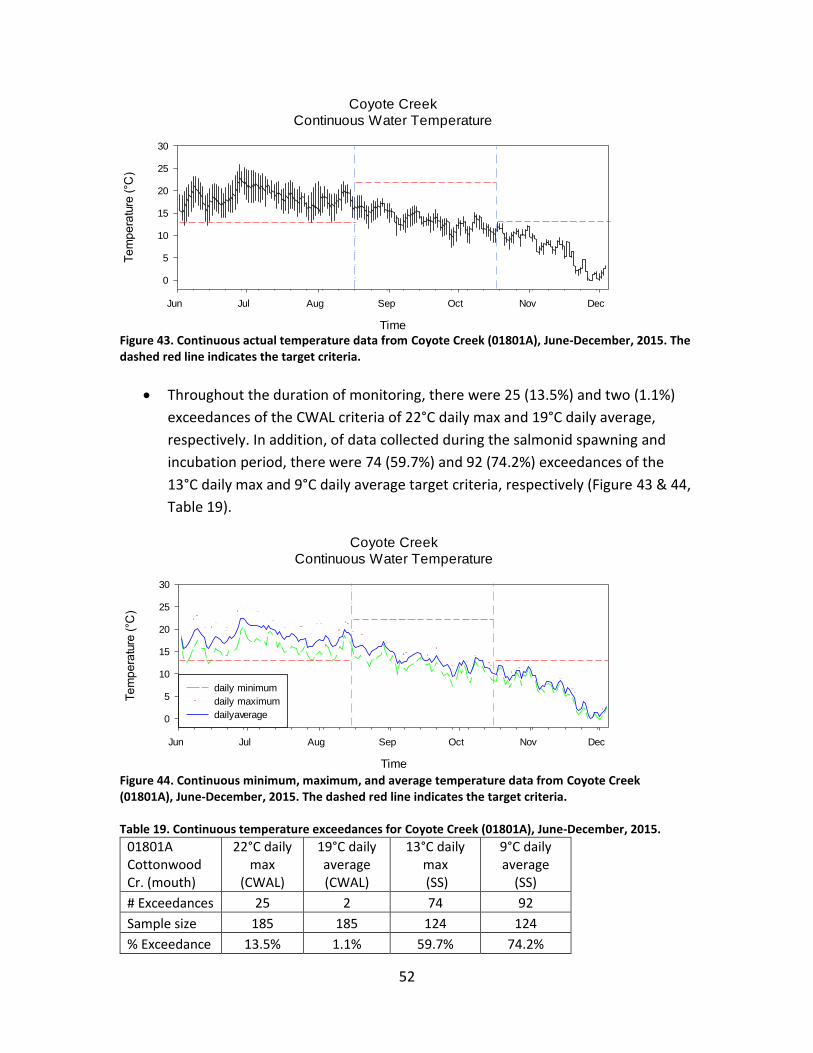
52
Coyote Creek
Continuous Water Temperature
Time
Jun Jul Aug Sep Oct Nov Dec
Te
mp
era
ture
(°C
)
0
5
10
15
20
25
30
Figure 43. Continuous actual temperature data from Coyote Creek (01801A), June-December, 2015. The dashed red line indicates the target criteria.
Throughout the duration of monitoring, there were 25 (13.5%) and two (1.1%)
exceedances of the CWAL criteria of 22°C daily max and 19°C daily average,
respectively. In addition, of data collected during the salmonid spawning and
incubation period, there were 74 (59.7%) and 92 (74.2%) exceedances of the
13°C daily max and 9°C daily average target criteria, respectively (Figure 43 & 44,
Table 19).
Coyote Creek
Continuous Water Temperature
Time
Jun Jul Aug Sep Oct Nov Dec
Te
mp
era
ture
(°C
)
0
5
10
15
20
25
30
daily minimum
daily maximum
dailyaverage
Figure 44. Continuous minimum, maximum, and average temperature data from Coyote Creek (01801A), June-December, 2015. The dashed red line indicates the target criteria. Table 19. Continuous temperature exceedances for Coyote Creek (01801A), June-December, 2015.
01801A Cottonwood Cr. (mouth)
22°C daily max
(CWAL)
19°C daily average (CWAL)
13°C daily max (SS)
9°C daily average
(SS)
# Exceedances 25 2 74 92
Sample size 185 185 124 124
% Exceedance 13.5% 1.1% 59.7% 74.2%
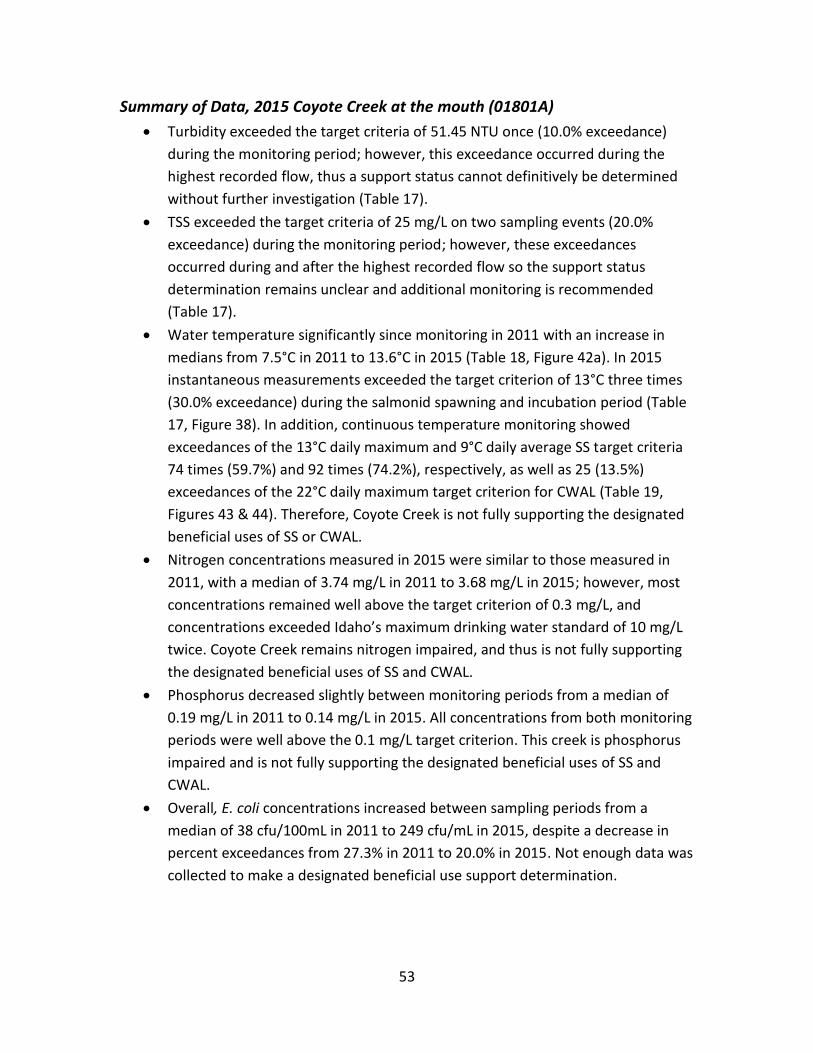
53
Summary of Data, 2015 Coyote Creek at the mouth (01801A)
Turbidity exceeded the target criteria of 51.45 NTU once (10.0% exceedance)
during the monitoring period; however, this exceedance occurred during the
highest recorded flow, thus a support status cannot definitively be determined
without further investigation (Table 17).
TSS exceeded the target criteria of 25 mg/L on two sampling events (20.0%
exceedance) during the monitoring period; however, these exceedances
occurred during and after the highest recorded flow so the support status
determination remains unclear and additional monitoring is recommended
(Table 17).
Water temperature significantly since monitoring in 2011 with an increase in
medians from 7.5°C in 2011 to 13.6°C in 2015 (Table 18, Figure 42a). In 2015
instantaneous measurements exceeded the target criterion of 13°C three times
(30.0% exceedance) during the salmonid spawning and incubation period (Table
17, Figure 38). In addition, continuous temperature monitoring showed
exceedances of the 13°C daily maximum and 9°C daily average SS target criteria
74 times (59.7%) and 92 times (74.2%), respectively, as well as 25 (13.5%)
exceedances of the 22°C daily maximum target criterion for CWAL (Table 19,
Figures 43 & 44). Therefore, Coyote Creek is not fully supporting the designated
beneficial uses of SS or CWAL.
Nitrogen concentrations measured in 2015 were similar to those measured in
2011, with a median of 3.74 mg/L in 2011 to 3.68 mg/L in 2015; however, most
concentrations remained well above the target criterion of 0.3 mg/L, and
concentrations exceeded Idaho’s maximum drinking water standard of 10 mg/L
twice. Coyote Creek remains nitrogen impaired, and thus is not fully supporting
the designated beneficial uses of SS and CWAL.
Phosphorus decreased slightly between monitoring periods from a median of
0.19 mg/L in 2011 to 0.14 mg/L in 2015. All concentrations from both monitoring
periods were well above the 0.1 mg/L target criterion. This creek is phosphorus
impaired and is not fully supporting the designated beneficial uses of SS and
CWAL.
Overall, E. coli concentrations increased between sampling periods from a
median of 38 cfu/100mL in 2011 to 249 cfu/mL in 2015, despite a decrease in
percent exceedances from 27.3% in 2011 to 20.0% in 2015. Not enough data was
collected to make a designated beneficial use support determination.
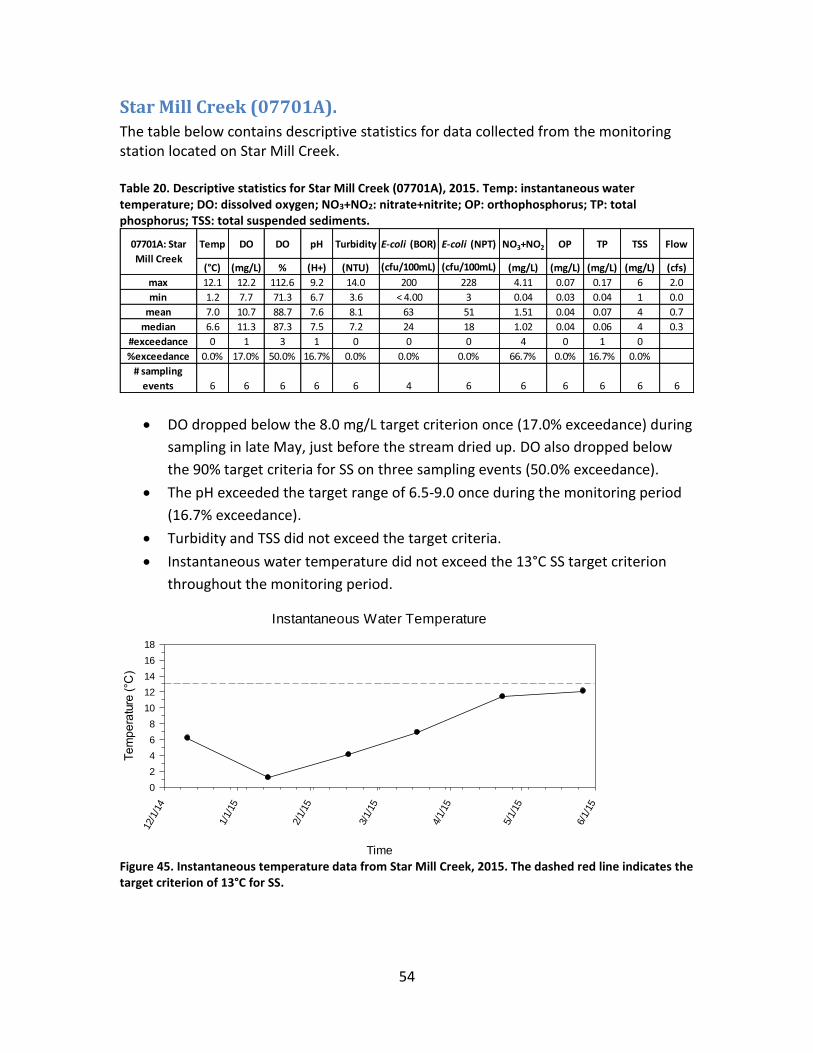
54
Star Mill Creek (07701A).
The table below contains descriptive statistics for data collected from the monitoring station located on Star Mill Creek. Table 20. Descriptive statistics for Star Mill Creek (07701A), 2015. Temp: instantaneous water temperature; DO: dissolved oxygen; NO3+NO2: nitrate+nitrite; OP: orthophosphorus; TP: total phosphorus; TSS: total suspended sediments.
DO dropped below the 8.0 mg/L target criterion once (17.0% exceedance) during
sampling in late May, just before the stream dried up. DO also dropped below
the 90% target criteria for SS on three sampling events (50.0% exceedance).
The pH exceeded the target range of 6.5-9.0 once during the monitoring period
(16.7% exceedance).
Turbidity and TSS did not exceed the target criteria.
Instantaneous water temperature did not exceed the 13°C SS target criterion
throughout the monitoring period.
Instantaneous Water Temperature
Time
12/1
/14
1/1/
15
2/1/
15
3/1/
15
4/1/
15
5/1/
15
6/1/
15
Te
mp
era
ture
(°C
)
0
2
4
6
8
10
12
14
16
18
Figure 45. Instantaneous temperature data from Star Mill Creek, 2015. The dashed red line indicates the target criterion of 13°C for SS.
Temp DO DO pH Turbidity E-coli (BOR) E-coli (NPT) NO3+NO2 OP TP TSS Flow
(°C) (mg/L) % (H+) (NTU) (cfu/100mL) (cfu/100mL) (mg/L) (mg/L) (mg/L) (mg/L) (cfs)
max 12.1 12.2 112.6 9.2 14.0 200 228 4.11 0.07 0.17 6 2.0
min 1.2 7.7 71.3 6.7 3.6 < 4.00 3 0.04 0.03 0.04 1 0.0
mean 7.0 10.7 88.7 7.6 8.1 63 51 1.51 0.04 0.07 4 0.7
median 6.6 11.3 87.3 7.5 7.2 24 18 1.02 0.04 0.06 4 0.3
#exceedance 0 1 3 1 0 0 0 4 0 1 0
%exceedance 0.0% 17.0% 50.0% 16.7% 0.0% 0.0% 0.0% 66.7% 0.0% 16.7% 0.0%
# sampling
events 6 6 6 6 6 4 6 6 6 6 6 6
07701A: Star
Mill Creek
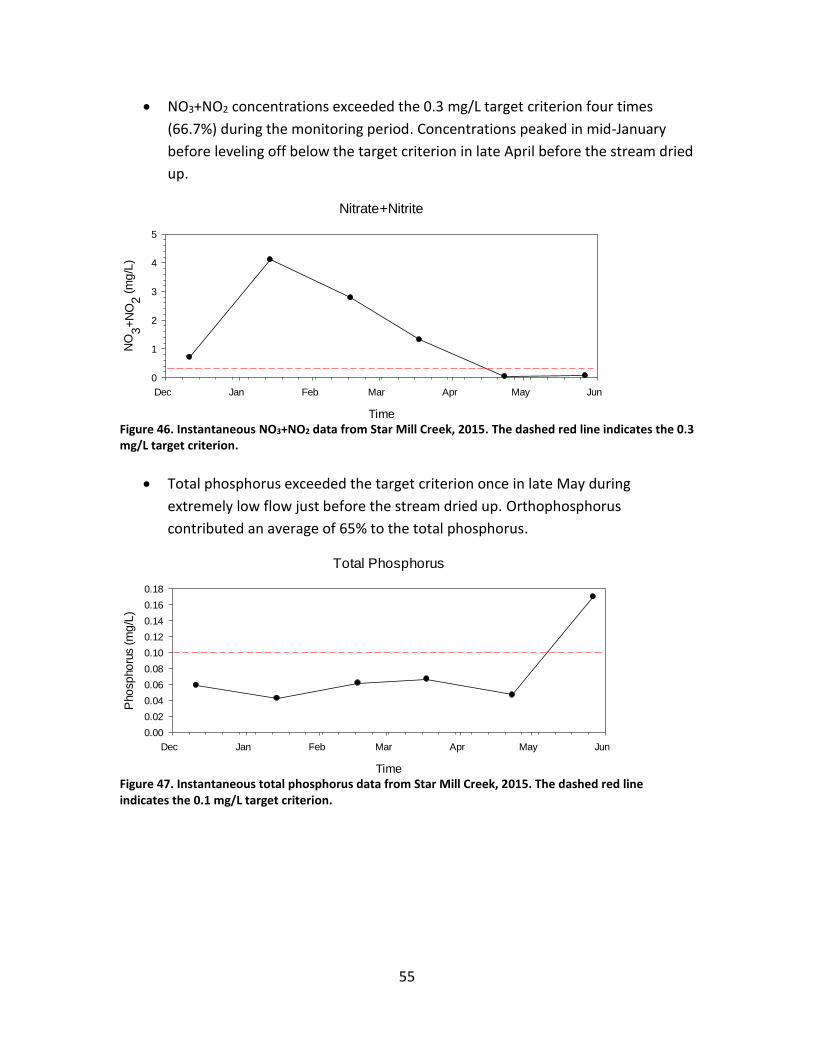
55
NO3+NO2 concentrations exceeded the 0.3 mg/L target criterion four times
(66.7%) during the monitoring period. Concentrations peaked in mid-January
before leveling off below the target criterion in late April before the stream dried
up.
Nitrate+Nitrite
Time
Dec Jan Feb Mar Apr May Jun
NO
3+
NO
2 (
mg
/L)
0
1
2
3
4
5
Figure 46. Instantaneous NO3+NO2 data from Star Mill Creek, 2015. The dashed red line indicates the 0.3 mg/L target criterion.
Total phosphorus exceeded the target criterion once in late May during
extremely low flow just before the stream dried up. Orthophosphorus
contributed an average of 65% to the total phosphorus.
Total Phosphorus
Time
Dec Jan Feb Mar Apr May Jun
Pho
sp
ho
rus (
mg
/L)
0.00
0.02
0.04
0.06
0.08
0.10
0.12
0.14
0.16
0.18
Figure 47. Instantaneous total phosphorus data from Star Mill Creek, 2015. The dashed red line indicates the 0.1 mg/L target criterion.

56
E. coli samples analyzed by both the NPT and BOR were well below the target
criterion throughout the monitoring period.
E. coli
Time
Dec Jan Feb Mar Apr May Jun
cfu
/10
0m
L
0
100
200
300
400 NPT
BOR
Figure 48. E. coli concentrations from Star Mill Creek. The figure includes data from samples processed by NPT WRD staff and the BOR laboratory. The dashed red line indicates the 406 cfu/100mL target criterion for PCR.
Summary of Data, 2015 Star Mill Creek at the mouth (07701A)
Turbidity and TSS met the associated target criteria throughout the monitoring
period.
pH exceeded the target range on one sampling event with a value of 9.2 in April.
DO was below the 8.0 mg/L target criterion once in late May. This concentration
was measured during the last sampling event during extremely low flows and
just before the stream dried up for the summer months. Additionally, DO
dropped below the 90% criterion needed for SS three times throughout the
study. Two of these events occurred during extremely low flow so a support
status determination cannot be made without further investigation.
Instantaneous water temperature did not exceed the target criterion throughout
the monitoring period. However, as water levels decreased and air temperature
began to increase in late April-May, water temperatures began to approach the
target criterion.
NO3+NO2 concentrations exceeded target criterion four times (66.7%
exceedance) during the monitoring period. The highest concentration was over 4
mg/L in mid-January, decreasing to below the target criterion in the April and
May sampling events. Overall, NO3+NO2 concentrations were very high for the
majority of the monitoring period. Thus, this monitoring location is nitrogen
impaired and does not fully support the designated beneficial uses of SS and
CWAL.
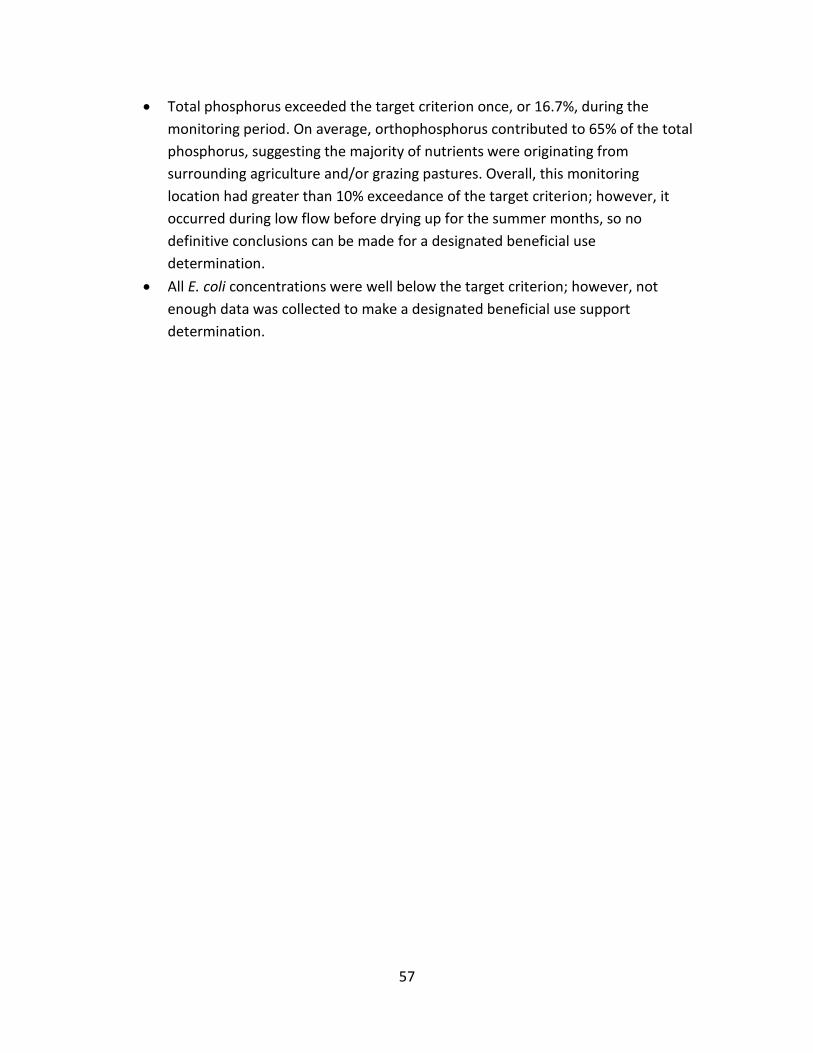
57
Total phosphorus exceeded the target criterion once, or 16.7%, during the
monitoring period. On average, orthophosphorus contributed to 65% of the total
phosphorus, suggesting the majority of nutrients were originating from
surrounding agriculture and/or grazing pastures. Overall, this monitoring
location had greater than 10% exceedance of the target criterion; however, it
occurred during low flow before drying up for the summer months, so no
definitive conclusions can be made for a designated beneficial use
determination.
All E. coli concentrations were well below the target criterion; however, not
enough data was collected to make a designated beneficial use support
determination.
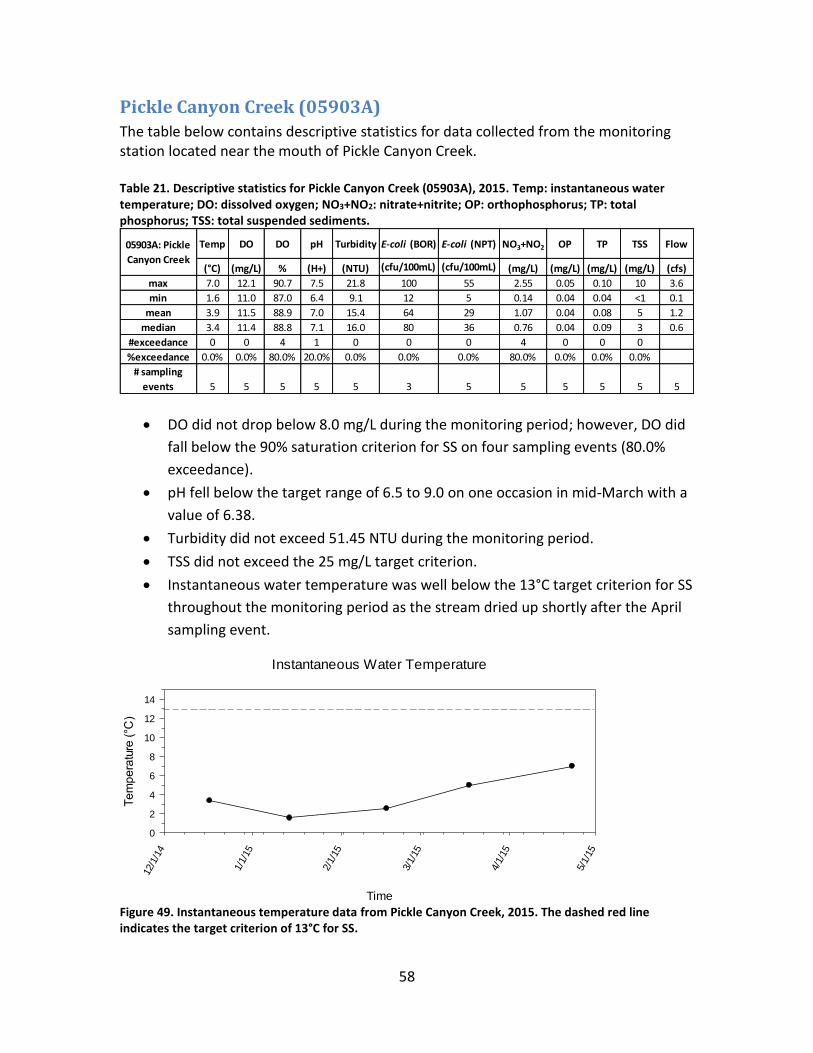
58
Pickle Canyon Creek (05903A)
The table below contains descriptive statistics for data collected from the monitoring station located near the mouth of Pickle Canyon Creek. Table 21. Descriptive statistics for Pickle Canyon Creek (05903A), 2015. Temp: instantaneous water temperature; DO: dissolved oxygen; NO3+NO2: nitrate+nitrite; OP: orthophosphorus; TP: total phosphorus; TSS: total suspended sediments.
DO did not drop below 8.0 mg/L during the monitoring period; however, DO did
fall below the 90% saturation criterion for SS on four sampling events (80.0%
exceedance).
pH fell below the target range of 6.5 to 9.0 on one occasion in mid-March with a
value of 6.38.
Turbidity did not exceed 51.45 NTU during the monitoring period.
TSS did not exceed the 25 mg/L target criterion.
Instantaneous water temperature was well below the 13°C target criterion for SS
throughout the monitoring period as the stream dried up shortly after the April
sampling event.
Instantaneous Water Temperature
Time
12/1
/14
1/1/
15
2/1/
15
3/1/
15
4/1/
15
5/1/
15
Te
mp
era
ture
(°C
)
0
2
4
6
8
10
12
14
Figure 49. Instantaneous temperature data from Pickle Canyon Creek, 2015. The dashed red line indicates the target criterion of 13°C for SS.
Temp DO DO pH Turbidity E-coli (BOR) E-coli (NPT) NO3+NO2 OP TP TSS Flow
(°C) (mg/L) % (H+) (NTU) (cfu/100mL) (cfu/100mL) (mg/L) (mg/L) (mg/L) (mg/L) (cfs)
max 7.0 12.1 90.7 7.5 21.8 100 55 2.55 0.05 0.10 10 3.6
min 1.6 11.0 87.0 6.4 9.1 12 5 0.14 0.04 0.04 <1 0.1
mean 3.9 11.5 88.9 7.0 15.4 64 29 1.07 0.04 0.08 5 1.2
median 3.4 11.4 88.8 7.1 16.0 80 36 0.76 0.04 0.09 3 0.6
#exceedance 0 0 4 1 0 0 0 4 0 0 0
%exceedance 0.0% 0.0% 80.0% 20.0% 0.0% 0.0% 0.0% 80.0% 0.0% 0.0% 0.0%
# sampling
events 5 5 5 5 5 3 5 5 5 5 5 5
05903A: Pickle
Canyon Creek
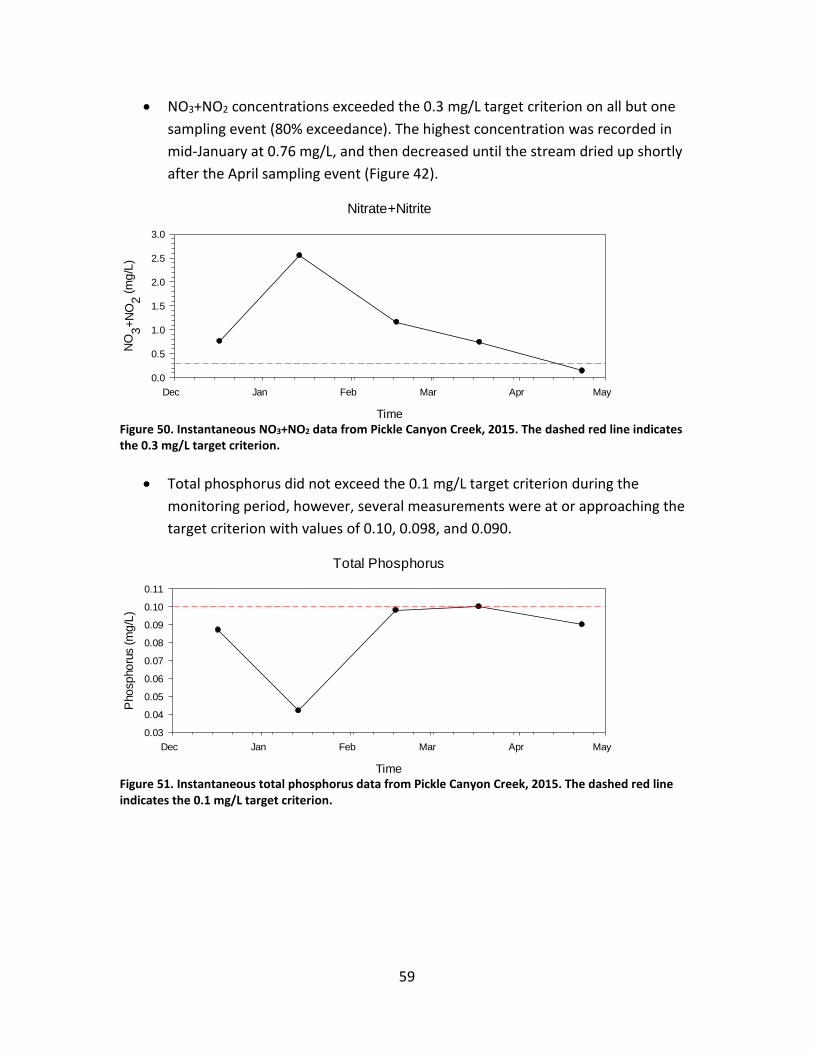
59
NO3+NO2 concentrations exceeded the 0.3 mg/L target criterion on all but one
sampling event (80% exceedance). The highest concentration was recorded in
mid-January at 0.76 mg/L, and then decreased until the stream dried up shortly
after the April sampling event (Figure 42).
Nitrate+Nitrite
Time
Dec Jan Feb Mar Apr May
NO
3+
NO
2 (
mg
/L)
0.0
0.5
1.0
1.5
2.0
2.5
3.0
Figure 50. Instantaneous NO3+NO2 data from Pickle Canyon Creek, 2015. The dashed red line indicates the 0.3 mg/L target criterion.
Total phosphorus did not exceed the 0.1 mg/L target criterion during the
monitoring period, however, several measurements were at or approaching the
target criterion with values of 0.10, 0.098, and 0.090.
Total Phosphorus
Time
Dec Jan Feb Mar Apr May
Pho
sp
ho
rus (
mg
/L)
0.03
0.04
0.05
0.06
0.07
0.08
0.09
0.10
0.11
Figure 51. Instantaneous total phosphorus data from Pickle Canyon Creek, 2015. The dashed red line indicates the 0.1 mg/L target criterion.
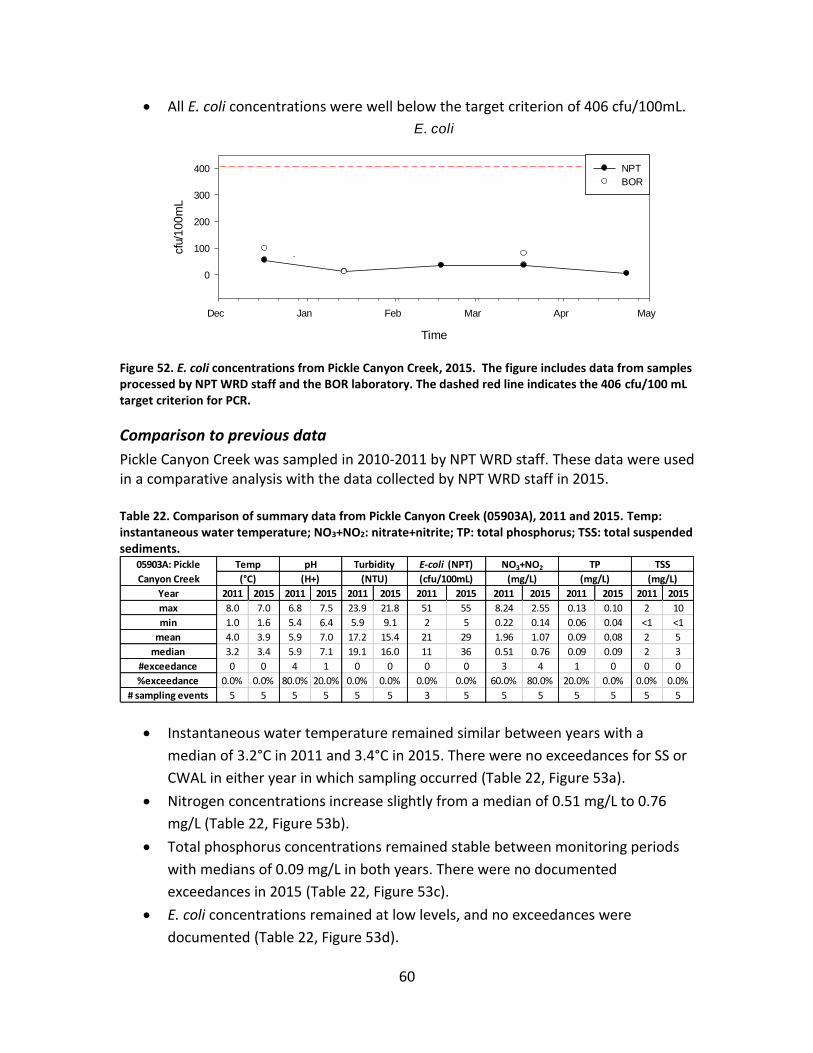
60
All E. coli concentrations were well below the target criterion of 406 cfu/100mL.
E. coli
Time
Dec Jan Feb Mar Apr May
cfu
/10
0m
L
0
100
200
300
400 NPT
BOR
Figure 52. E. coli concentrations from Pickle Canyon Creek, 2015. The figure includes data from samples processed by NPT WRD staff and the BOR laboratory. The dashed red line indicates the 406 cfu/100 mL target criterion for PCR.
Comparison to previous data
Pickle Canyon Creek was sampled in 2010-2011 by NPT WRD staff. These data were used in a comparative analysis with the data collected by NPT WRD staff in 2015. Table 22. Comparison of summary data from Pickle Canyon Creek (05903A), 2011 and 2015. Temp: instantaneous water temperature; NO3+NO2: nitrate+nitrite; TP: total phosphorus; TSS: total suspended sediments.
Instantaneous water temperature remained similar between years with a
median of 3.2°C in 2011 and 3.4°C in 2015. There were no exceedances for SS or
CWAL in either year in which sampling occurred (Table 22, Figure 53a).
Nitrogen concentrations increase slightly from a median of 0.51 mg/L to 0.76
mg/L (Table 22, Figure 53b).
Total phosphorus concentrations remained stable between monitoring periods
with medians of 0.09 mg/L in both years. There were no documented
exceedances in 2015 (Table 22, Figure 53c).
E. coli concentrations remained at low levels, and no exceedances were
documented (Table 22, Figure 53d).
Year 2011 2015 2011 2015 2011 2015 2011 2015 2011 2015 2011 2015 2011 2015
max 8.0 7.0 6.8 7.5 23.9 21.8 51 55 8.24 2.55 0.13 0.10 2 10
min 1.0 1.6 5.4 6.4 5.9 9.1 2 5 0.22 0.14 0.06 0.04 <1 <1
mean 4.0 3.9 5.9 7.0 17.2 15.4 21 29 1.96 1.07 0.09 0.08 2 5
median 3.2 3.4 5.9 7.1 19.1 16.0 11 36 0.51 0.76 0.09 0.09 2 3
#exceedance 0 0 4 1 0 0 0 0 3 4 1 0 0 0
%exceedance 0.0% 0.0% 80.0% 20.0% 0.0% 0.0% 0.0% 0.0% 60.0% 80.0% 20.0% 0.0% 0.0% 0.0%
# sampling events 5 5 5 5 5 5 3 5 5 5 5 5 5 5
TP TSS
(°C) (H+) (NTU) (cfu/100mL) (mg/L) (mg/L) (mg/L)
NO3+NO205903A: Pickle
Canyon Creek
Temp pH Turbidity E-coli (NPT)
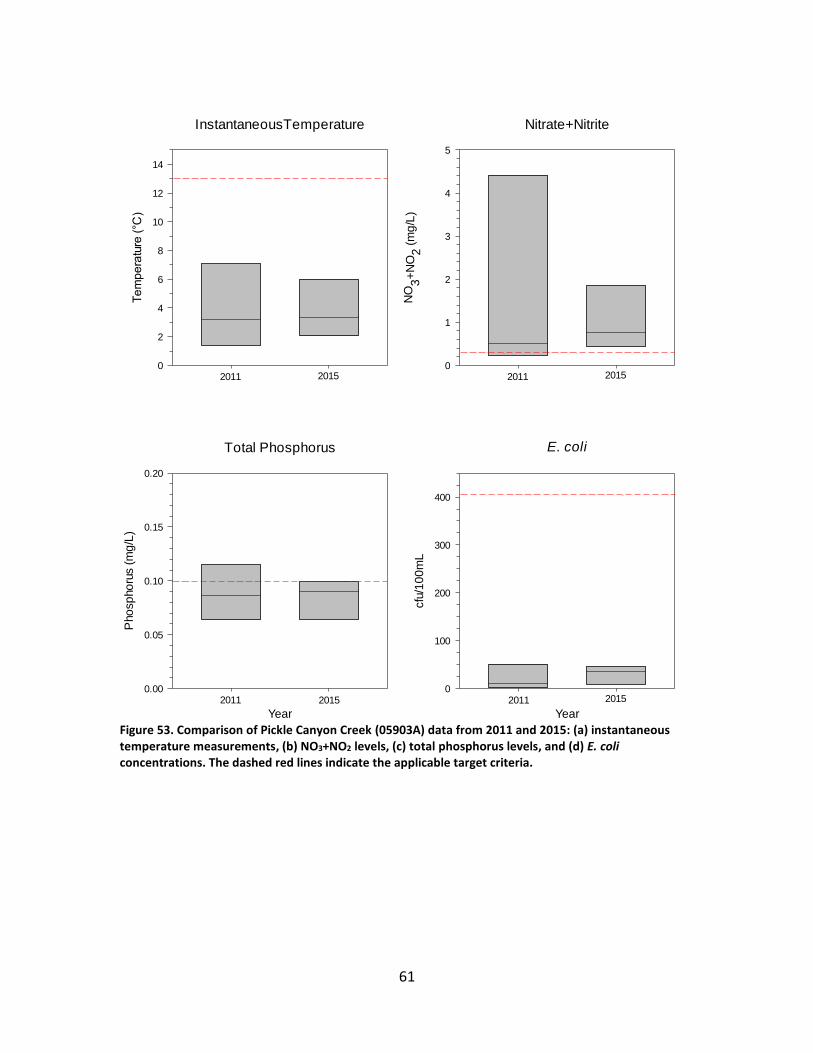
61
InstantaneousTemperature
Te
mp
era
ture
(°C
)
0
2
4
6
8
10
12
14
2011 2015
Nitrate+Nitrite
NO
3+
NO
2 (
mg
/L)
0
1
2
3
4
5
2011 2015
E. coli
Year
cfu
/10
0m
L
0
100
200
300
400
Total Phosphorus
Year
Pho
sp
ho
rus (
mg
/L)
0.00
0.05
0.10
0.15
0.20
2011 2015 2011 2015
Figure 53. Comparison of Pickle Canyon Creek (05903A) data from 2011 and 2015: (a) instantaneous temperature measurements, (b) NO3+NO2 levels, (c) total phosphorus levels, and (d) E. coli concentrations. The dashed red lines indicate the applicable target criteria.
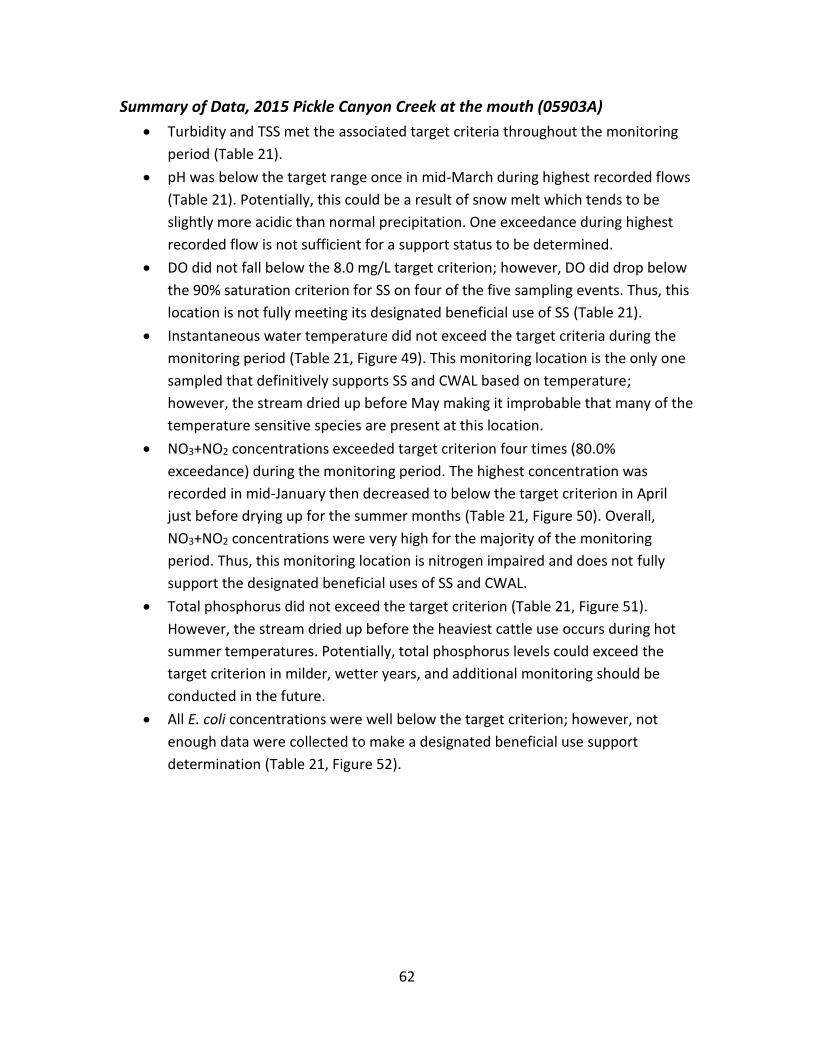
62
Summary of Data, 2015 Pickle Canyon Creek at the mouth (05903A)
Turbidity and TSS met the associated target criteria throughout the monitoring
period (Table 21).
pH was below the target range once in mid-March during highest recorded flows
(Table 21). Potentially, this could be a result of snow melt which tends to be
slightly more acidic than normal precipitation. One exceedance during highest
recorded flow is not sufficient for a support status to be determined.
DO did not fall below the 8.0 mg/L target criterion; however, DO did drop below
the 90% saturation criterion for SS on four of the five sampling events. Thus, this
location is not fully meeting its designated beneficial use of SS (Table 21).
Instantaneous water temperature did not exceed the target criteria during the
monitoring period (Table 21, Figure 49). This monitoring location is the only one
sampled that definitively supports SS and CWAL based on temperature;
however, the stream dried up before May making it improbable that many of the
temperature sensitive species are present at this location.
NO3+NO2 concentrations exceeded target criterion four times (80.0%
exceedance) during the monitoring period. The highest concentration was
recorded in mid-January then decreased to below the target criterion in April
just before drying up for the summer months (Table 21, Figure 50). Overall,
NO3+NO2 concentrations were very high for the majority of the monitoring
period. Thus, this monitoring location is nitrogen impaired and does not fully
support the designated beneficial uses of SS and CWAL.
Total phosphorus did not exceed the target criterion (Table 21, Figure 51).
However, the stream dried up before the heaviest cattle use occurs during hot
summer temperatures. Potentially, total phosphorus levels could exceed the
target criterion in milder, wetter years, and additional monitoring should be
conducted in the future.
All E. coli concentrations were well below the target criterion; however, not
enough data were collected to make a designated beneficial use support
determination (Table 21, Figure 52).
63
Designated Beneficial Use Support Status Designated beneficial use support status determinations for Cottonwood Creek and its tributaries have been developed based on the water quality data collected during this study. Table 23 lists the waterbodies and their designated beneficial use status. For PCR, five samples taken within 30 days must exceed the target criterion. In this study, bacteria samples were taken only once per month; therefore, support determination could not be assigned for PCR designated use. Table 23. Designated beneficial use support status for assessed waterbodies.
Waterbody Name Total Stream
Miles Designated Uses
Use Support Decision
Parameter/
Indicator
Cottonwood Creek (source to mouth)
16.65
Primary Contact Recreation
n/a
n/a
Cold Water Aquatic Life
Not Fully Supporting
Temperature, NO3+NO2,
TP, TSS
Salmonid Spawning
Not Fully Supporting
Temperature, NO3+NO2,
TP, DO, TSS
Coyote Creek 5.31
Primary Contact Recreation
n/a
n/a
Cold Water Aquatic Life
Not Fully Supporting
NO3+NO2, TP
Salmonid Spawning
Not Fully Supporting
Temperature, NO3+NO2,
TP
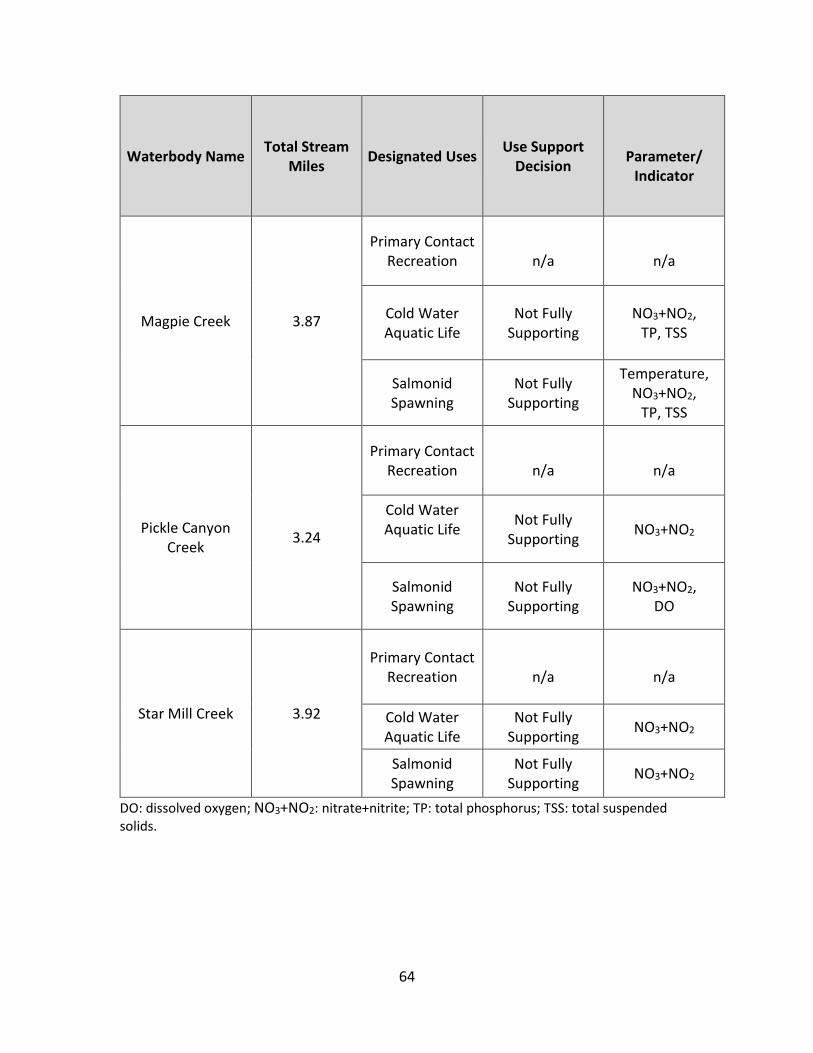
64
Waterbody Name Total Stream
Miles Designated Uses
Use Support Decision
Parameter/
Indicator
Magpie Creek 3.87
Primary Contact Recreation
n/a
n/a
Cold Water Aquatic Life
Not Fully Supporting
NO3+NO2, TP, TSS
Salmonid Spawning
Not Fully Supporting
Temperature, NO3+NO2,
TP, TSS
Pickle Canyon
Creek
3.24
Primary Contact Recreation
n/a
n/a
Cold Water Aquatic Life
Not Fully Supporting
NO3+NO2
Salmonid Spawning
Not Fully Supporting
NO3+NO2, DO
Star Mill Creek 3.92
Primary Contact Recreation
n/a
n/a
Cold Water Aquatic Life
Not Fully Supporting
NO3+NO2
Salmonid Spawning
Not Fully Supporting
NO3+NO2
DO: dissolved oxygen; NO3+NO2: nitrate+nitrite; TP: total phosphorus; TSS: total suspended solids.
65
Conclusions The monitoring program for the main stem and tributaries of Cottonwood Creek was successfully carried out as planned. Protocols were followed, QA/QC standards were met, and specific information per parameter for each subwatershed was collected. Nutrients, sediments, and excessive stream temperatures were the primary pollutants documented within the Cottonwood Creek watershed during this study. Aquatic organisms from microbes to fish are dependent on certain temperature ranges for their optimal health. Aquatic insects are sensitive to temperature and will move in a stream in order to find their optimal temperature. Temperature is also critical for fish spawning and embryo development. If stream temperatures are outside of optimal levels for prolonged periods of time, organisms become stressed and may die or be unable to reproduce. Salmonid spawning is a designated beneficial use for Cottonwood Creek and its tributaries, and there is a relatively stringent temperature requirement associated with that designated use. Almost every site exceeded the salmonid spawning and incubation temperature criteria to some degree during the course of this study. High phosphorus concentration is a persistent issue throughout the watershed. The only site that did not exceed the 0.1 mg/L target criterion during the monitoring period was Pickle Canyon Creek (05903A), which is a tributary of Cottonwood Creek located in the headwater region, though it is important to note that the phosphorus levels were at or just below the target criterion and the creek dried up early in the year. Orthophosphorus, or dissolved phosphorus, was a major contributor to total phosphorus loads in all sites, with a minimum contribution of 50% in Cottonwood Creek at Tribal Allotment #1801 (01514A) to nearly 80% in Coyote Creek. This suggests that the majority of total phosphorus is coming from nearby agriculture fields and grazing allotments, rather than a result of erosion and sediment input. The high level of total phosphorus is potentially contributing to excessive growth of algae and other aquatic plants that cause the depletion of dissolved oxygen when they decompose, which can result in the disappearance of intolerant aquatic insect species and fish. NO3+NO2 levels were also high in the entire Cottonwood Creek catchment area. Concentrations exceeded the 0.3 mg/L target criterion in nearly all sampling events at each monitoring location and ranging from 67% exceedance in Star Mill Creek to 100% in three of the seven other locations. In addition, concentrations at three sites exceeded the Idaho safe drinking water standard of 10 mg/L, and two more sites were at or near the standard. The Cottonwood Creek watershed is severely nutrient impaired and needs to be addressed immediately with the implementation of best management practices (BMPs).
66
Even with the relatively high levels of nutrients seen in this study, there was only one documented instance where DO levels dropped below the 8.0 mg/L target criterion; however, every monitoring site except Cottonwood Creek at the mouth (01501A) had at least one sampling event in which the percent saturation of dissolved oxygen dropped below the 90% saturation required for salmonid spawning. This drop in percent saturation of dissolved oxygen, coupled with excessive nutrient loading, is a concern for future water quality as temperatures continue to rise as a result of climate change. Escherichia coli (E. coli) is a type of fecal coliform bacteria commonly found in the intestines of animals and humans. The presence of E. coli in water is a strong indication of recent sewage or animal waste contamination. Bacteria levels were relatively low in the headwaters of Cottonwood Creek; however, concentrations exceeded the target criterion at all monitoring locations in the lower portions of the watershed. Magpie Creek was by far the worst with over 80% exceedance, and should be a focal location for BMP implementation to address excessive bacteria concentrations. Total suspended solids (TSS) include both sediment and organic material suspended in water. TSS can cause problems for fish by clogging gills and for aquatic plants by limiting growth because of reduced light penetration. In addition, TSS provides a medium for the accumulation and transport of other constituents such as nitrogen, phosphorus, and bacteria. Sediment was generally high throughout the watershed with more than 10% exceedance at all monitoring locations except Star Mill Creek and Pickle Canyon Creek. Magpie Creek was the most impaired monitoring location with a 75% exceedance and maximum value of nearly 1,650 mg/L. Focus should be put on Magpie Creek for implementation of erosion-control BMPs.
67
Recommendations Significant erosion is currently evident along a number of streams within the Cottonwood Creek watershed and treatment should be applied to those undergoing the most severe erosion. Nutrients are a major problem in this watershed and controlling erosion would certainly help to decrease TP levels. Every stream, including the main stem of Cottonwood Creek, is water quality limited and will benefit from strategic implementation of BMPs to reduce sediment, nutrients, bacteria, and thermal loading. Magpie Creek in particular appears to be the tributary that is contributing the highest sediment, nutrient, and bacteria loads to the main stem of Cottonwood Creek and should be prioritized for implementation of BMP measures. Additional sampling was done in an attempt to locate focal points of nutrient loading in Magpie Creek (Appendix B); however, the data show impairment of all additional sample sites, with extremely high concentrations of nitrogen and phosphorus. Recommended BMPs include: fencing the riparian area to keep cattle away from the creek, adding stream stabilization structures, and revegetating the streambank and riparian area to help reduce sediment loading. In addition, several homes are spread throughout the watershed and likely use private septic systems. Testing the creek for human-related water quality parameters (caffeine, hormones, pharmaceuticals, etc.) above and below each residence is recommended to determine if any septic systems are a source of nutrient and bacteria pollution. Coyote Creek also contributes a great deal of sediment, nutrients, and bacteria to Cottonwood Creek. Recommended BMPs are the same as for Magpie Creek: fencing the riparian area to keep cattle away from the creek, adding stream stabilization structures, and revegetating the streambank and riparian area to help reduce sediment transport. Excessive stream temperatures will be a difficult issue to overcome. Perhaps the most effective strategy would be to work toward the establishment of natural full potential canopy shade. Reducing sediment loads within critical reaches will assist in reducing stream temperatures as well, since suspended particles absorb more heat. Continued implementation of targeted stream restoration efforts to reduce sediment loads, and lower nutrients, bacteria levels, and temperatures will be important. Based on stream inventory and prioritization efforts, stakeholders (NPT, Natural Resources Conservation Service (NRCS), Soil Conservation Commission (SCC), Idaho Department of Environmental Quality (IDEQ), Soil and Water Conservation Districts (SWCDs), and private land owners) should fund, devise, and construct high quality stream improvements designed to promote water quality enhancement.
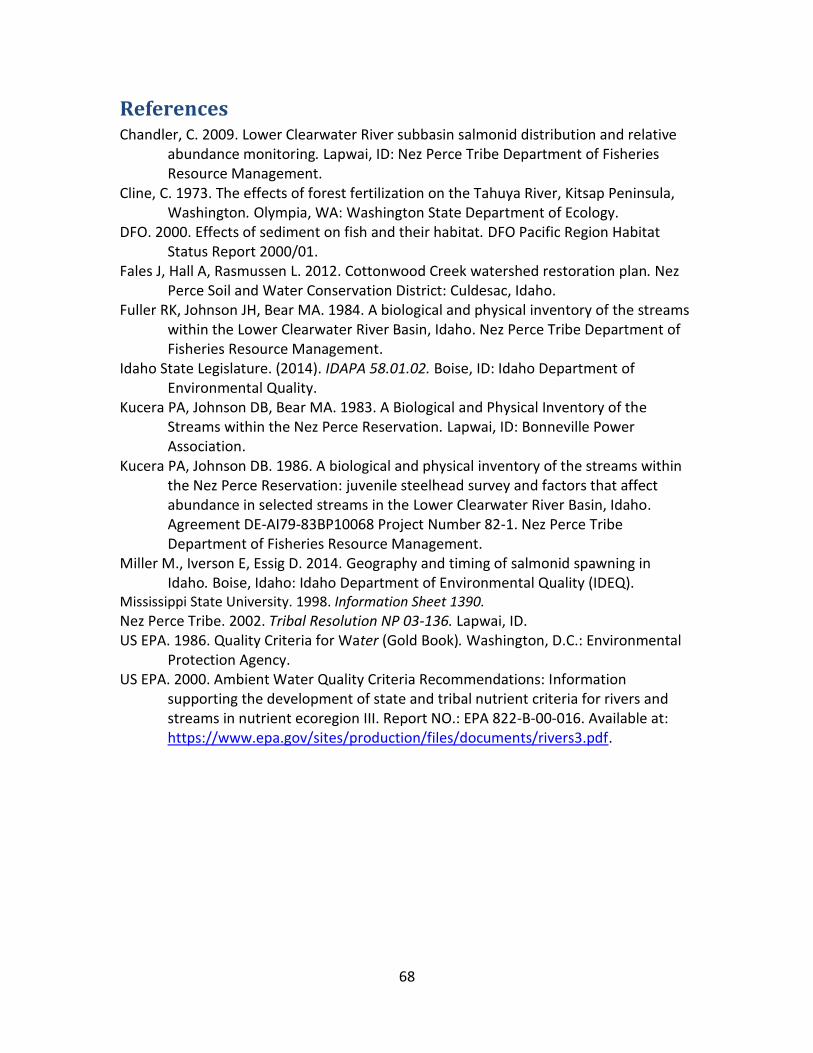
68
References Chandler, C. 2009. Lower Clearwater River subbasin salmonid distribution and relative
abundance monitoring. Lapwai, ID: Nez Perce Tribe Department of Fisheries Resource Management.
Cline, C. 1973. The effects of forest fertilization on the Tahuya River, Kitsap Peninsula, Washington. Olympia, WA: Washington State Department of Ecology.
DFO. 2000. Effects of sediment on fish and their habitat. DFO Pacific Region Habitat Status Report 2000/01.
Fales J, Hall A, Rasmussen L. 2012. Cottonwood Creek watershed restoration plan. Nez Perce Soil and Water Conservation District: Culdesac, Idaho.
Fuller RK, Johnson JH, Bear MA. 1984. A biological and physical inventory of the streams within the Lower Clearwater River Basin, Idaho. Nez Perce Tribe Department of Fisheries Resource Management.
Idaho State Legislature. (2014). IDAPA 58.01.02. Boise, ID: Idaho Department of Environmental Quality.
Kucera PA, Johnson DB, Bear MA. 1983. A Biological and Physical Inventory of the Streams within the Nez Perce Reservation. Lapwai, ID: Bonneville Power Association.
Kucera PA, Johnson DB. 1986. A biological and physical inventory of the streams within the Nez Perce Reservation: juvenile steelhead survey and factors that affect abundance in selected streams in the Lower Clearwater River Basin, Idaho. Agreement DE-AI79-83BP10068 Project Number 82-1. Nez Perce Tribe Department of Fisheries Resource Management.
Miller M., Iverson E, Essig D. 2014. Geography and timing of salmonid spawning in Idaho. Boise, Idaho: Idaho Department of Environmental Quality (IDEQ).
Mississippi State University. 1998. Information Sheet 1390.
Nez Perce Tribe. 2002. Tribal Resolution NP 03-136. Lapwai, ID. US EPA. 1986. Quality Criteria for Water (Gold Book). Washington, D.C.: Environmental
Protection Agency. US EPA. 2000. Ambient Water Quality Criteria Recommendations: Information
supporting the development of state and tribal nutrient criteria for rivers and streams in nutrient ecoregion III. Report NO.: EPA 822-B-00-016. Available at: https://www.epa.gov/sites/production/files/documents/rivers3.pdf.
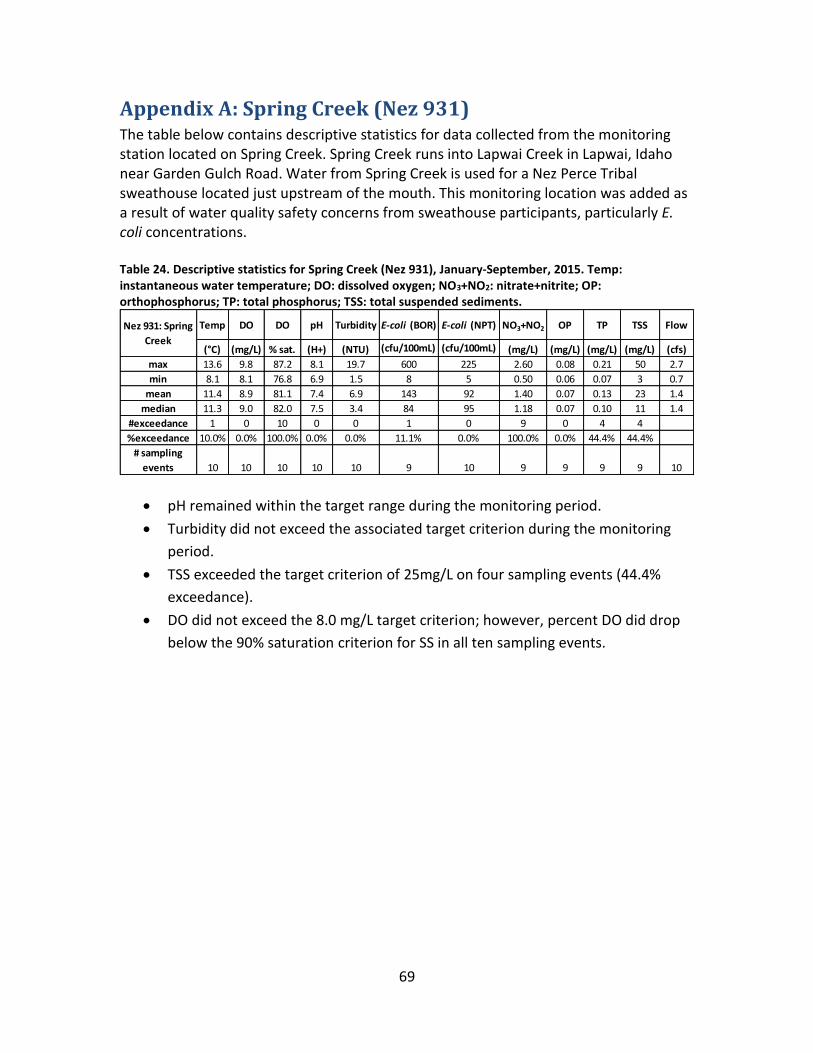
69
Appendix A: Spring Creek (Nez 931) The table below contains descriptive statistics for data collected from the monitoring station located on Spring Creek. Spring Creek runs into Lapwai Creek in Lapwai, Idaho near Garden Gulch Road. Water from Spring Creek is used for a Nez Perce Tribal sweathouse located just upstream of the mouth. This monitoring location was added as a result of water quality safety concerns from sweathouse participants, particularly E. coli concentrations.
Table 24. Descriptive statistics for Spring Creek (Nez 931), January-September, 2015. Temp: instantaneous water temperature; DO: dissolved oxygen; NO3+NO2: nitrate+nitrite; OP: orthophosphorus; TP: total phosphorus; TSS: total suspended sediments.
pH remained within the target range during the monitoring period.
Turbidity did not exceed the associated target criterion during the monitoring
period.
TSS exceeded the target criterion of 25mg/L on four sampling events (44.4%
exceedance).
DO did not exceed the 8.0 mg/L target criterion; however, percent DO did drop
below the 90% saturation criterion for SS in all ten sampling events.
Temp DO DO pH Turbidity E-coli (BOR) E-coli (NPT) NO3+NO2 OP TP TSS Flow
(°C) (mg/L) % sat. (H+) (NTU) (cfu/100mL) (cfu/100mL) (mg/L) (mg/L) (mg/L) (mg/L) (cfs)
max 13.6 9.8 87.2 8.1 19.7 600 225 2.60 0.08 0.21 50 2.7
min 8.1 8.1 76.8 6.9 1.5 8 5 0.50 0.06 0.07 3 0.7
mean 11.4 8.9 81.1 7.4 6.9 143 92 1.40 0.07 0.13 23 1.4
median 11.3 9.0 82.0 7.5 3.4 84 95 1.18 0.07 0.10 11 1.4
#exceedance 1 0 10 0 0 1 0 9 0 4 4
%exceedance 10.0% 0.0% 100.0% 0.0% 0.0% 11.1% 0.0% 100.0% 0.0% 44.4% 44.4%
# sampling
events 10 10 10 10 10 9 10 9 9 9 9 10
Nez 931: Spring
Creek
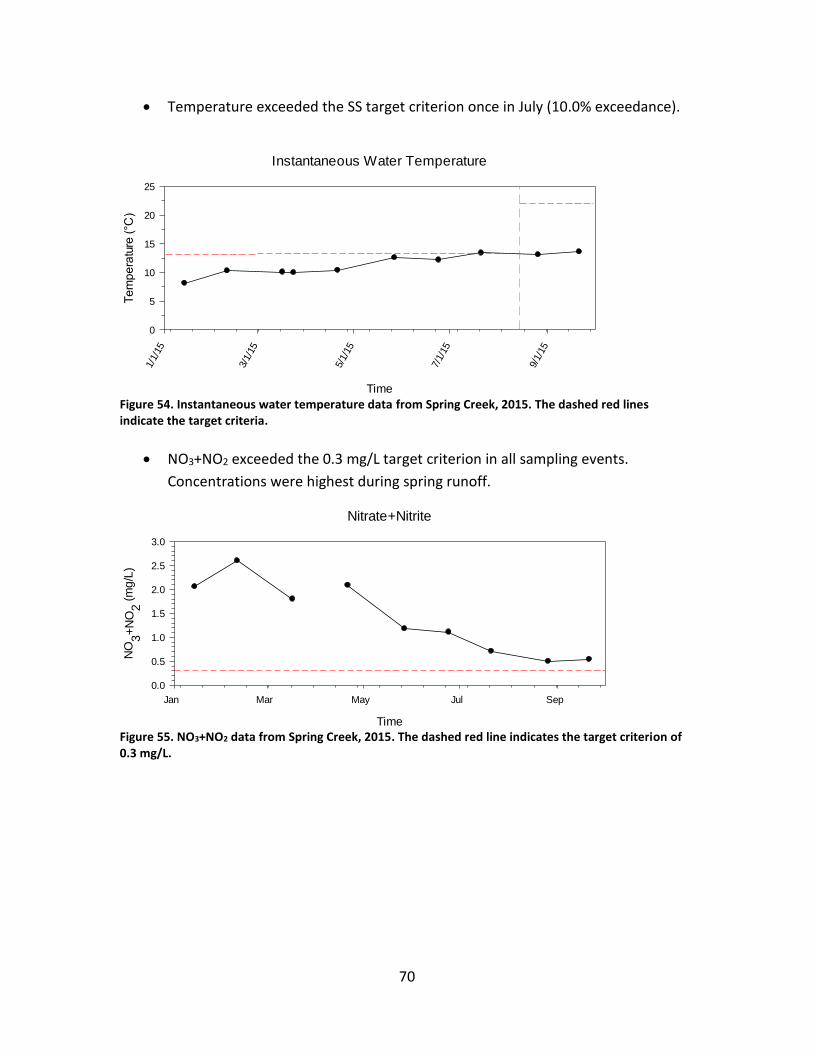
70
Temperature exceeded the SS target criterion once in July (10.0% exceedance).
Instantaneous Water Temperature
Time
1/1/
15
3/1/
15
5/1/
15
7/1/
15
9/1/
15
Te
mp
era
ture
(°C
)
0
5
10
15
20
25
Figure 54. Instantaneous water temperature data from Spring Creek, 2015. The dashed red lines indicate the target criteria.
NO3+NO2 exceeded the 0.3 mg/L target criterion in all sampling events.
Concentrations were highest during spring runoff.
Nitrate+Nitrite
Time
Jan Mar May Jul Sep
NO
3+
NO
2 (
mg
/L)
0.0
0.5
1.0
1.5
2.0
2.5
3.0
Figure 55. NO3+NO2 data from Spring Creek, 2015. The dashed red line indicates the target criterion of 0.3 mg/L.
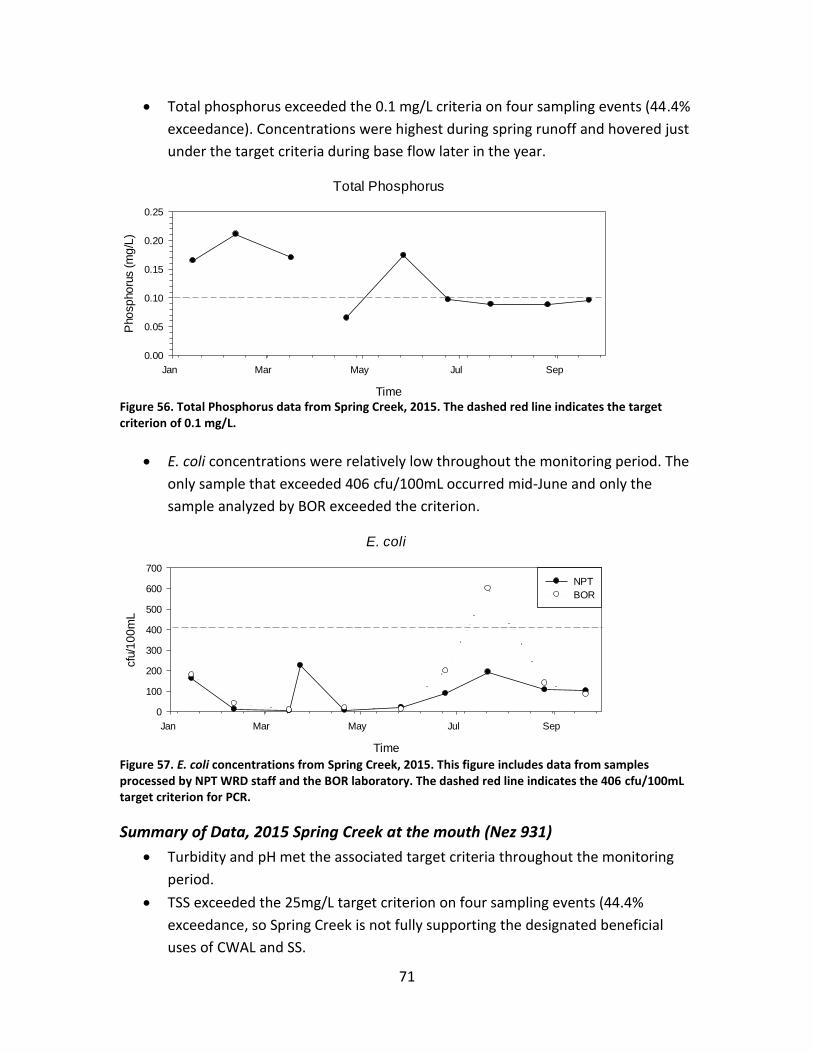
71
Total phosphorus exceeded the 0.1 mg/L criteria on four sampling events (44.4%
exceedance). Concentrations were highest during spring runoff and hovered just
under the target criteria during base flow later in the year.
Total Phosphorus
Time
Jan Mar May Jul Sep
Pho
sp
ho
rus (
mg
/L)
0.00
0.05
0.10
0.15
0.20
0.25
Figure 56. Total Phosphorus data from Spring Creek, 2015. The dashed red line indicates the target criterion of 0.1 mg/L.
E. coli concentrations were relatively low throughout the monitoring period. The
only sample that exceeded 406 cfu/100mL occurred mid-June and only the
sample analyzed by BOR exceeded the criterion.
E. coli
Time
Jan Mar May Jul Sep
cfu
/10
0m
L
0
100
200
300
400
500
600
700
NPT
BOR
Figure 57. E. coli concentrations from Spring Creek, 2015. This figure includes data from samples processed by NPT WRD staff and the BOR laboratory. The dashed red line indicates the 406 cfu/100mL target criterion for PCR.
Summary of Data, 2015 Spring Creek at the mouth (Nez 931)
Turbidity and pH met the associated target criteria throughout the monitoring
period.
TSS exceeded the 25mg/L target criterion on four sampling events (44.4%
exceedance, so Spring Creek is not fully supporting the designated beneficial
uses of CWAL and SS.
72
DO did not exceed the 8.0 mg/L target criterion; however, DO did drop below
the 90% saturation needed for SS on all sampling events. Thus, this location is
not fully supporting its designated beneficial use of SS.
Instantaneous water temperature exceeded the target criteria once (10%
exceedance) during the monitoring period. This occurred on the warmest day of
sampling in mid-July.
NO3+NO2 and total phosphorus concentrations exceeded target criteria on
100.0% and 44.4% of sampling events, respectively. This location is severely
nutrient impaired and does not fully support the designated beneficial uses of SS
and CWAL.
Most E. coli concentrations were well below the target criteria. Not enough data
was collected to make a designated beneficial use support determination;
however, this location was sampled due to health concerns for tribal members
from high E. coli concentrations. Results indicate there is no immediate threat to
tribal health.
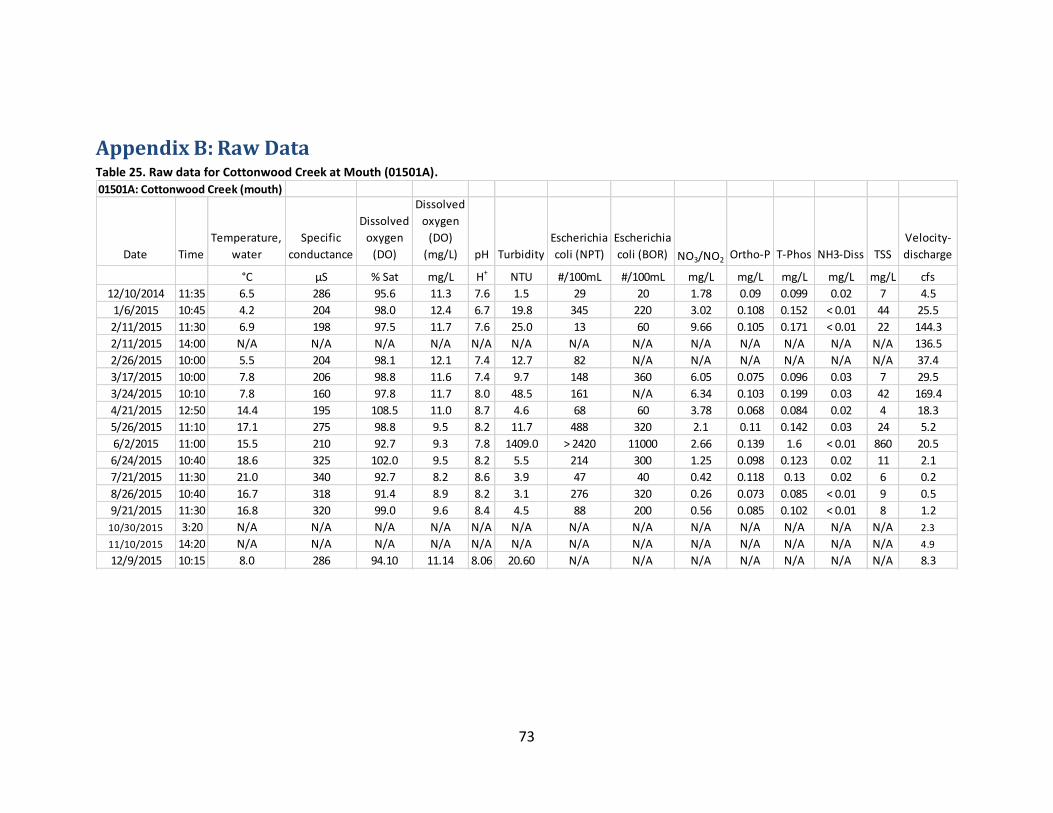
73
Appendix B: Raw Data Table 25. Raw data for Cottonwood Creek at Mouth (01501A).
01501A: Cottonwood Creek (mouth)
Date Time
Temperature,
water
Specific
conductance
Dissolved
oxygen
(DO)
Dissolved
oxygen
(DO)
(mg/L) pH Turbidity
Escherichia
coli (NPT)
Escherichia
coli (BOR) NO3/NO2 Ortho-P T-Phos NH3-Diss TSS
Velocity-
discharge
°C µS % Sat mg/L H+ NTU #/100mL #/100mL mg/L mg/L mg/L mg/L mg/L cfs
12/10/2014 11:35 6.5 286 95.6 11.3 7.6 1.5 29 20 1.78 0.09 0.099 0.02 7 4.5
1/6/2015 10:45 4.2 204 98.0 12.4 6.7 19.8 345 220 3.02 0.108 0.152 < 0.01 44 25.5
2/11/2015 11:30 6.9 198 97.5 11.7 7.6 25.0 13 60 9.66 0.105 0.171 < 0.01 22 144.3
2/11/2015 14:00 N/A N/A N/A N/A N/A N/A N/A N/A N/A N/A N/A N/A N/A 136.5
2/26/2015 10:00 5.5 204 98.1 12.1 7.4 12.7 82 N/A N/A N/A N/A N/A N/A 37.4
3/17/2015 10:00 7.8 206 98.8 11.6 7.4 9.7 148 360 6.05 0.075 0.096 0.03 7 29.5
3/24/2015 10:10 7.8 160 97.8 11.7 8.0 48.5 161 N/A 6.34 0.103 0.199 0.03 42 169.4
4/21/2015 12:50 14.4 195 108.5 11.0 8.7 4.6 68 60 3.78 0.068 0.084 0.02 4 18.3
5/26/2015 11:10 17.1 275 98.8 9.5 8.2 11.7 488 320 2.1 0.11 0.142 0.03 24 5.2
6/2/2015 11:00 15.5 210 92.7 9.3 7.8 1409.0 > 2420 11000 2.66 0.139 1.6 < 0.01 860 20.5
6/24/2015 10:40 18.6 325 102.0 9.5 8.2 5.5 214 300 1.25 0.098 0.123 0.02 11 2.1
7/21/2015 11:30 21.0 340 92.7 8.2 8.6 3.9 47 40 0.42 0.118 0.13 0.02 6 0.2
8/26/2015 10:40 16.7 318 91.4 8.9 8.2 3.1 276 320 0.26 0.073 0.085 < 0.01 9 0.5
9/21/2015 11:30 16.8 320 99.0 9.6 8.4 4.5 88 200 0.56 0.085 0.102 < 0.01 8 1.2
10/30/2015 3:20 N/A N/A N/A N/A N/A N/A N/A N/A N/A N/A N/A N/A N/A 2.3
11/10/2015 14:20 N/A N/A N/A N/A N/A N/A N/A N/A N/A N/A N/A N/A N/A 4.9
12/9/2015 10:15 8.0 286 94.10 11.14 8.06 20.60 N/A N/A N/A N/A N/A N/A N/A 8.3
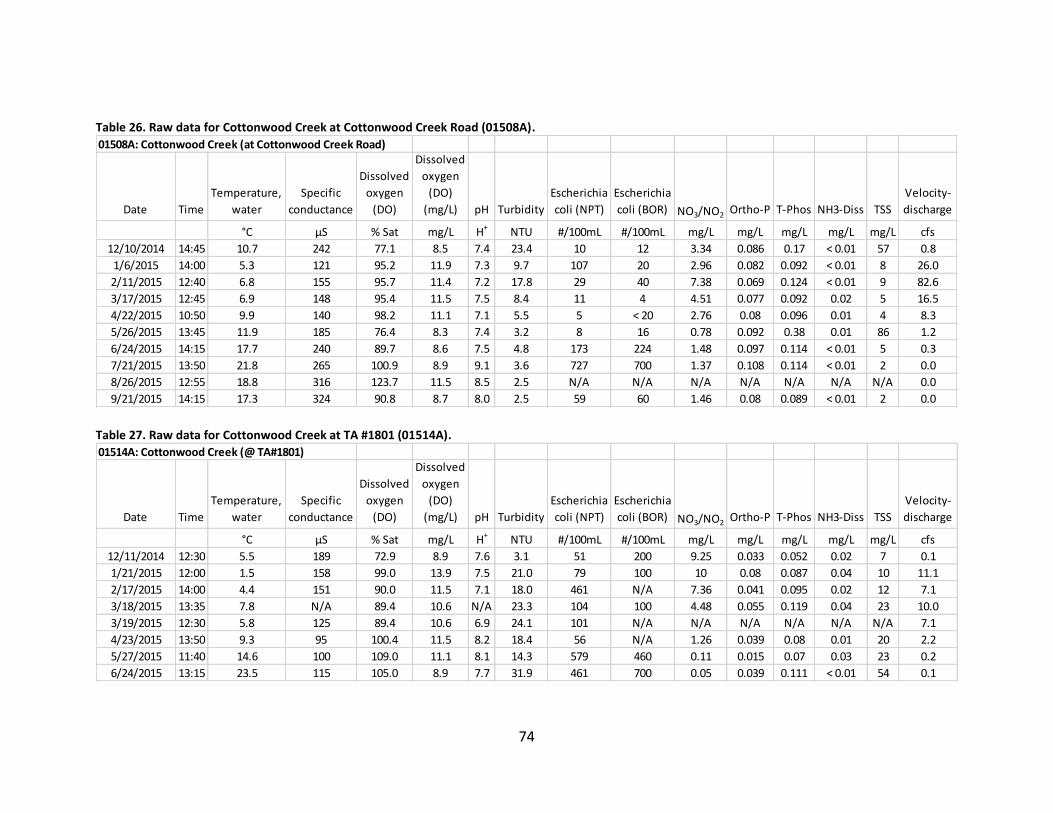
74
Table 26. Raw data for Cottonwood Creek at Cottonwood Creek Road (01508A).
Table 27. Raw data for Cottonwood Creek at TA #1801 (01514A).
Date Time
Temperature,
water
Specific
conductance
Dissolved
oxygen
(DO)
Dissolved
oxygen
(DO)
(mg/L) pH Turbidity
Escherichia
coli (NPT)
Escherichia
coli (BOR) NO3/NO2 Ortho-P T-Phos NH3-Diss TSS
Velocity-
discharge
°C µS % Sat mg/L H+ NTU #/100mL #/100mL mg/L mg/L mg/L mg/L mg/L cfs
12/10/2014 14:45 10.7 242 77.1 8.5 7.4 23.4 10 12 3.34 0.086 0.17 < 0.01 57 0.8
1/6/2015 14:00 5.3 121 95.2 11.9 7.3 9.7 107 20 2.96 0.082 0.092 < 0.01 8 26.0
2/11/2015 12:40 6.8 155 95.7 11.4 7.2 17.8 29 40 7.38 0.069 0.124 < 0.01 9 82.6
3/17/2015 12:45 6.9 148 95.4 11.5 7.5 8.4 11 4 4.51 0.077 0.092 0.02 5 16.5
4/22/2015 10:50 9.9 140 98.2 11.1 7.1 5.5 5 < 20 2.76 0.08 0.096 0.01 4 8.3
5/26/2015 13:45 11.9 185 76.4 8.3 7.4 3.2 8 16 0.78 0.092 0.38 0.01 86 1.2
6/24/2015 14:15 17.7 240 89.7 8.6 7.5 4.8 173 224 1.48 0.097 0.114 < 0.01 5 0.3
7/21/2015 13:50 21.8 265 100.9 8.9 9.1 3.6 727 700 1.37 0.108 0.114 < 0.01 2 0.0
8/26/2015 12:55 18.8 316 123.7 11.5 8.5 2.5 N/A N/A N/A N/A N/A N/A N/A 0.0
9/21/2015 14:15 17.3 324 90.8 8.7 8.0 2.5 59 60 1.46 0.08 0.089 < 0.01 2 0.0
01508A: Cottonwood Creek (at Cottonwood Creek Road)
01514A: Cottonwood Creek (@ TA#1801)
Date Time
Temperature,
water
Specific
conductance
Dissolved
oxygen
(DO)
Dissolved
oxygen
(DO)
(mg/L) pH Turbidity
Escherichia
coli (NPT)
Escherichia
coli (BOR) NO3/NO2 Ortho-P T-Phos NH3-Diss TSS
Velocity-
discharge
°C µS % Sat mg/L H+ NTU #/100mL #/100mL mg/L mg/L mg/L mg/L mg/L cfs
12/11/2014 12:30 5.5 189 72.9 8.9 7.6 3.1 51 200 9.25 0.033 0.052 0.02 7 0.1
1/21/2015 12:00 1.5 158 99.0 13.9 7.5 21.0 79 100 10 0.08 0.087 0.04 10 11.1
2/17/2015 14:00 4.4 151 90.0 11.5 7.1 18.0 461 N/A 7.36 0.041 0.095 0.02 12 7.1
3/18/2015 13:35 7.8 N/A 89.4 10.6 N/A 23.3 104 100 4.48 0.055 0.119 0.04 23 10.0
3/19/2015 12:30 5.8 125 89.4 10.6 6.9 24.1 101 N/A N/A N/A N/A N/A N/A 7.1
4/23/2015 13:50 9.3 95 100.4 11.5 8.2 18.4 56 N/A 1.26 0.039 0.08 0.01 20 2.2
5/27/2015 11:40 14.6 100 109.0 11.1 8.1 14.3 579 460 0.11 0.015 0.07 0.03 23 0.2
6/24/2015 13:15 23.5 115 105.0 8.9 7.7 31.9 461 700 0.05 0.039 0.111 < 0.01 54 0.1
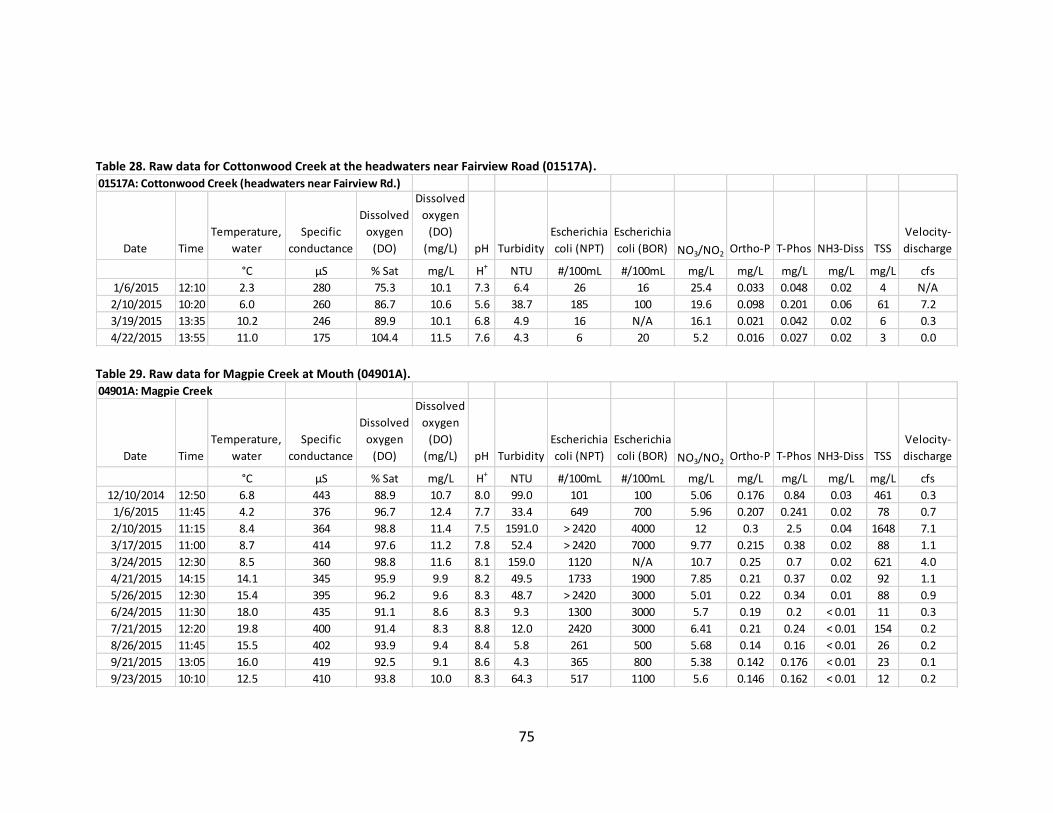
75
Table 28. Raw data for Cottonwood Creek at the headwaters near Fairview Road (01517A).
Table 29. Raw data for Magpie Creek at Mouth (04901A).
01517A: Cottonwood Creek (headwaters near Fairview Rd.)
Date Time
Temperature,
water
Specific
conductance
Dissolved
oxygen
(DO)
Dissolved
oxygen
(DO)
(mg/L) pH Turbidity
Escherichia
coli (NPT)
Escherichia
coli (BOR) NO3/NO2 Ortho-P T-Phos NH3-Diss TSS
Velocity-
discharge
°C µS % Sat mg/L H+ NTU #/100mL #/100mL mg/L mg/L mg/L mg/L mg/L cfs
1/6/2015 12:10 2.3 280 75.3 10.1 7.3 6.4 26 16 25.4 0.033 0.048 0.02 4 N/A
2/10/2015 10:20 6.0 260 86.7 10.6 5.6 38.7 185 100 19.6 0.098 0.201 0.06 61 7.2
3/19/2015 13:35 10.2 246 89.9 10.1 6.8 4.9 16 N/A 16.1 0.021 0.042 0.02 6 0.3
4/22/2015 13:55 11.0 175 104.4 11.5 7.6 4.3 6 20 5.2 0.016 0.027 0.02 3 0.0
04901A: Magpie Creek
Date Time
Temperature,
water
Specific
conductance
Dissolved
oxygen
(DO)
Dissolved
oxygen
(DO)
(mg/L) pH Turbidity
Escherichia
coli (NPT)
Escherichia
coli (BOR) NO3/NO2 Ortho-P T-Phos NH3-Diss TSS
Velocity-
discharge
°C µS % Sat mg/L H+ NTU #/100mL #/100mL mg/L mg/L mg/L mg/L mg/L cfs
12/10/2014 12:50 6.8 443 88.9 10.7 8.0 99.0 101 100 5.06 0.176 0.84 0.03 461 0.3
1/6/2015 11:45 4.2 376 96.7 12.4 7.7 33.4 649 700 5.96 0.207 0.241 0.02 78 0.7
2/10/2015 11:15 8.4 364 98.8 11.4 7.5 1591.0 > 2420 4000 12 0.3 2.5 0.04 1648 7.1
3/17/2015 11:00 8.7 414 97.6 11.2 7.8 52.4 > 2420 7000 9.77 0.215 0.38 0.02 88 1.1
3/24/2015 12:30 8.5 360 98.8 11.6 8.1 159.0 1120 N/A 10.7 0.25 0.7 0.02 621 4.0
4/21/2015 14:15 14.1 345 95.9 9.9 8.2 49.5 1733 1900 7.85 0.21 0.37 0.02 92 1.1
5/26/2015 12:30 15.4 395 96.2 9.6 8.3 48.7 > 2420 3000 5.01 0.22 0.34 0.01 88 0.9
6/24/2015 11:30 18.0 435 91.1 8.6 8.3 9.3 1300 3000 5.7 0.19 0.2 < 0.01 11 0.3
7/21/2015 12:20 19.8 400 91.4 8.3 8.8 12.0 2420 3000 6.41 0.21 0.24 < 0.01 154 0.2
8/26/2015 11:45 15.5 402 93.9 9.4 8.4 5.8 261 500 5.68 0.14 0.16 < 0.01 26 0.2
9/21/2015 13:05 16.0 419 92.5 9.1 8.6 4.3 365 800 5.38 0.142 0.176 < 0.01 23 0.1
9/23/2015 10:10 12.5 410 93.8 10.0 8.3 64.3 517 1100 5.6 0.146 0.162 < 0.01 12 0.2
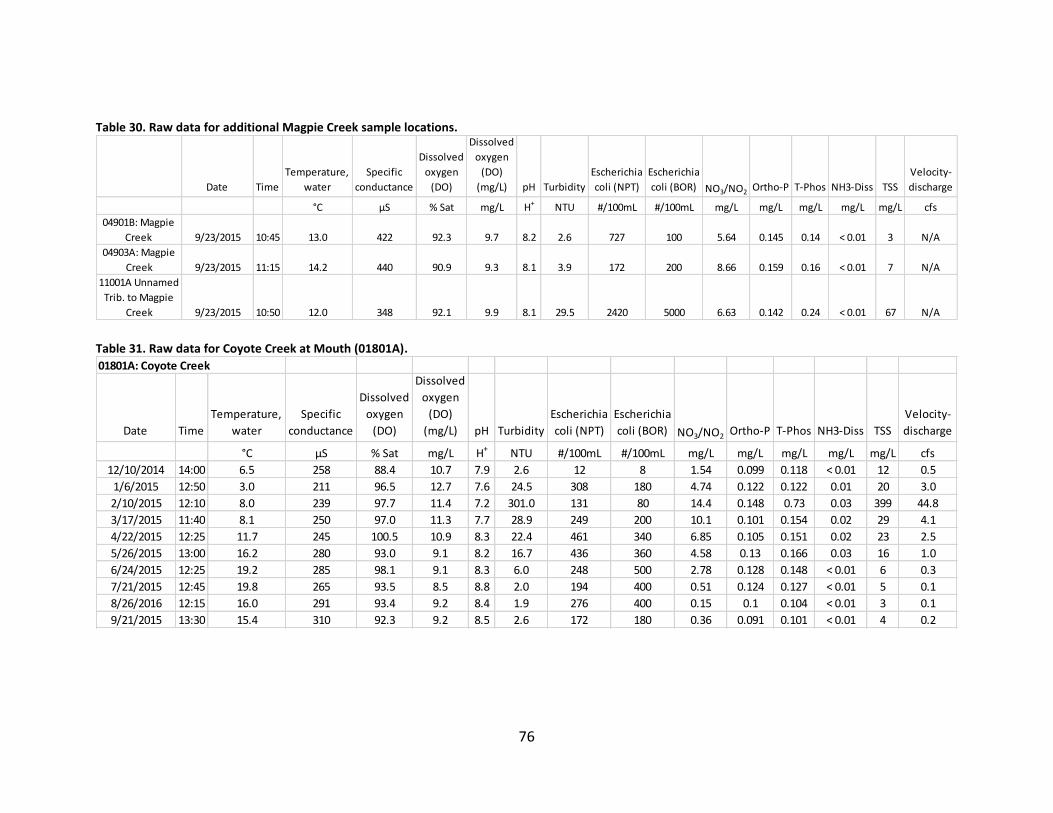
76
Table 30. Raw data for additional Magpie Creek sample locations.
Table 31. Raw data for Coyote Creek at Mouth (01801A).
Date Time
Temperature,
water
Specific
conductance
Dissolved
oxygen
(DO)
Dissolved
oxygen
(DO)
(mg/L) pH Turbidity
Escherichia
coli (NPT)
Escherichia
coli (BOR) NO3/NO2 Ortho-P T-Phos NH3-Diss TSS
Velocity-
discharge
°C µS % Sat mg/L H+ NTU #/100mL #/100mL mg/L mg/L mg/L mg/L mg/L cfs
04901B: Magpie
Creek 9/23/2015 10:45 13.0 422 92.3 9.7 8.2 2.6 727 100 5.64 0.145 0.14 < 0.01 3 N/A
04903A: Magpie
Creek 9/23/2015 11:15 14.2 440 90.9 9.3 8.1 3.9 172 200 8.66 0.159 0.16 < 0.01 7 N/A
11001A Unnamed
Trib. to Magpie
Creek 9/23/2015 10:50 12.0 348 92.1 9.9 8.1 29.5 2420 5000 6.63 0.142 0.24 < 0.01 67 N/A
01801A: Coyote Creek
Date Time
Temperature,
water
Specific
conductance
Dissolved
oxygen
(DO)
Dissolved
oxygen
(DO)
(mg/L) pH Turbidity
Escherichia
coli (NPT)
Escherichia
coli (BOR) NO3/NO2 Ortho-P T-Phos NH3-Diss TSS
Velocity-
discharge
°C µS % Sat mg/L H+ NTU #/100mL #/100mL mg/L mg/L mg/L mg/L mg/L cfs
12/10/2014 14:00 6.5 258 88.4 10.7 7.9 2.6 12 8 1.54 0.099 0.118 < 0.01 12 0.5
1/6/2015 12:50 3.0 211 96.5 12.7 7.6 24.5 308 180 4.74 0.122 0.122 0.01 20 3.0
2/10/2015 12:10 8.0 239 97.7 11.4 7.2 301.0 131 80 14.4 0.148 0.73 0.03 399 44.8
3/17/2015 11:40 8.1 250 97.0 11.3 7.7 28.9 249 200 10.1 0.101 0.154 0.02 29 4.1
4/22/2015 12:25 11.7 245 100.5 10.9 8.3 22.4 461 340 6.85 0.105 0.151 0.02 23 2.5
5/26/2015 13:00 16.2 280 93.0 9.1 8.2 16.7 436 360 4.58 0.13 0.166 0.03 16 1.0
6/24/2015 12:25 19.2 285 98.1 9.1 8.3 6.0 248 500 2.78 0.128 0.148 < 0.01 6 0.3
7/21/2015 12:45 19.8 265 93.5 8.5 8.8 2.0 194 400 0.51 0.124 0.127 < 0.01 5 0.1
8/26/2016 12:15 16.0 291 93.4 9.2 8.4 1.9 276 400 0.15 0.1 0.104 < 0.01 3 0.1
9/21/2015 13:30 15.4 310 92.3 9.2 8.5 2.6 172 180 0.36 0.091 0.101 < 0.01 4 0.2
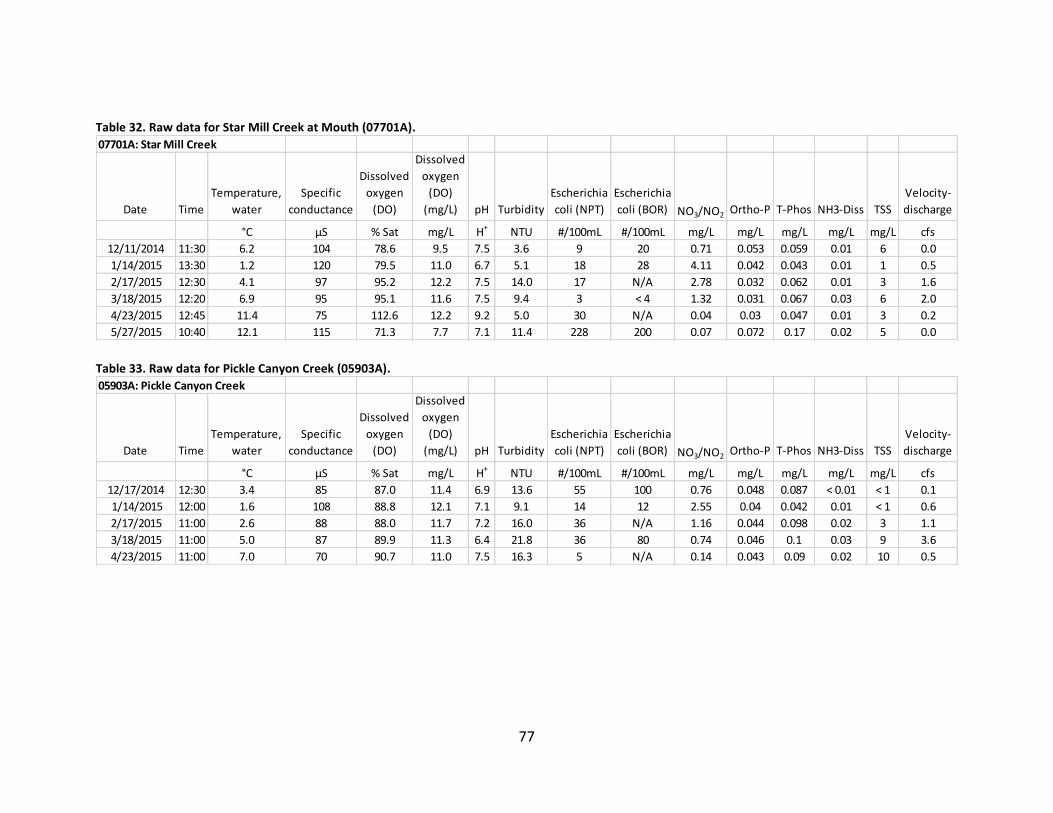
77
Table 32. Raw data for Star Mill Creek at Mouth (07701A).
Table 33. Raw data for Pickle Canyon Creek (05903A).
07701A: Star Mill Creek
Date Time
Temperature,
water
Specific
conductance
Dissolved
oxygen
(DO)
Dissolved
oxygen
(DO)
(mg/L) pH Turbidity
Escherichia
coli (NPT)
Escherichia
coli (BOR) NO3/NO2 Ortho-P T-Phos NH3-Diss TSS
Velocity-
discharge
°C µS % Sat mg/L H+ NTU #/100mL #/100mL mg/L mg/L mg/L mg/L mg/L cfs
12/11/2014 11:30 6.2 104 78.6 9.5 7.5 3.6 9 20 0.71 0.053 0.059 0.01 6 0.0
1/14/2015 13:30 1.2 120 79.5 11.0 6.7 5.1 18 28 4.11 0.042 0.043 0.01 1 0.5
2/17/2015 12:30 4.1 97 95.2 12.2 7.5 14.0 17 N/A 2.78 0.032 0.062 0.01 3 1.6
3/18/2015 12:20 6.9 95 95.1 11.6 7.5 9.4 3 < 4 1.32 0.031 0.067 0.03 6 2.0
4/23/2015 12:45 11.4 75 112.6 12.2 9.2 5.0 30 N/A 0.04 0.03 0.047 0.01 3 0.2
5/27/2015 10:40 12.1 115 71.3 7.7 7.1 11.4 228 200 0.07 0.072 0.17 0.02 5 0.0
05903A: Pickle Canyon Creek
Date Time
Temperature,
water
Specific
conductance
Dissolved
oxygen
(DO)
Dissolved
oxygen
(DO)
(mg/L) pH Turbidity
Escherichia
coli (NPT)
Escherichia
coli (BOR) NO3/NO2 Ortho-P T-Phos NH3-Diss TSS
Velocity-
discharge
°C µS % Sat mg/L H+ NTU #/100mL #/100mL mg/L mg/L mg/L mg/L mg/L cfs
12/17/2014 12:30 3.4 85 87.0 11.4 6.9 13.6 55 100 0.76 0.048 0.087 < 0.01 < 1 0.1
1/14/2015 12:00 1.6 108 88.8 12.1 7.1 9.1 14 12 2.55 0.04 0.042 0.01 < 1 0.6
2/17/2015 11:00 2.6 88 88.0 11.7 7.2 16.0 36 N/A 1.16 0.044 0.098 0.02 3 1.1
3/18/2015 11:00 5.0 87 89.9 11.3 6.4 21.8 36 80 0.74 0.046 0.1 0.03 9 3.6
4/23/2015 11:00 7.0 70 90.7 11.0 7.5 16.3 5 N/A 0.14 0.043 0.09 0.02 10 0.5
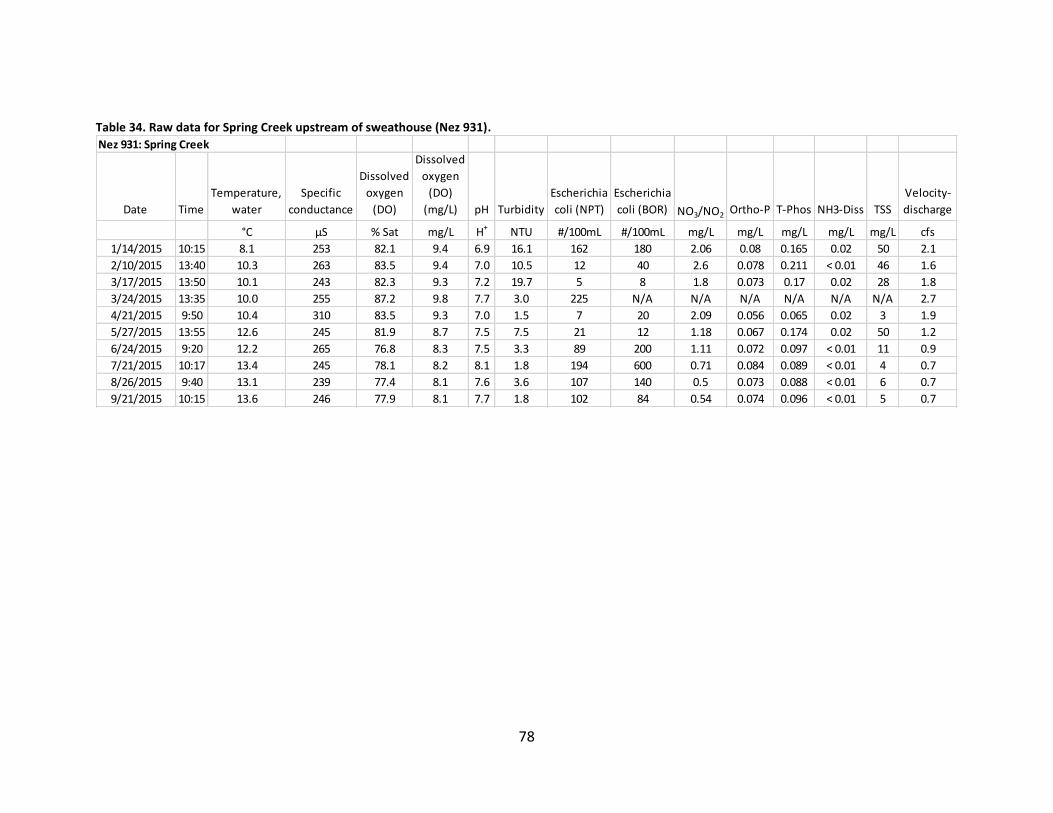
78
Table 34. Raw data for Spring Creek upstream of sweathouse (Nez 931).
Nez 931: Spring Creek
Date Time
Temperature,
water
Specific
conductance
Dissolved
oxygen
(DO)
Dissolved
oxygen
(DO)
(mg/L) pH Turbidity
Escherichia
coli (NPT)
Escherichia
coli (BOR) NO3/NO2 Ortho-P T-Phos NH3-Diss TSS
Velocity-
discharge
°C µS % Sat mg/L H+ NTU #/100mL #/100mL mg/L mg/L mg/L mg/L mg/L cfs
1/14/2015 10:15 8.1 253 82.1 9.4 6.9 16.1 162 180 2.06 0.08 0.165 0.02 50 2.1
2/10/2015 13:40 10.3 263 83.5 9.4 7.0 10.5 12 40 2.6 0.078 0.211 < 0.01 46 1.6
3/17/2015 13:50 10.1 243 82.3 9.3 7.2 19.7 5 8 1.8 0.073 0.17 0.02 28 1.8
3/24/2015 13:35 10.0 255 87.2 9.8 7.7 3.0 225 N/A N/A N/A N/A N/A N/A 2.7
4/21/2015 9:50 10.4 310 83.5 9.3 7.0 1.5 7 20 2.09 0.056 0.065 0.02 3 1.9
5/27/2015 13:55 12.6 245 81.9 8.7 7.5 7.5 21 12 1.18 0.067 0.174 0.02 50 1.2
6/24/2015 9:20 12.2 265 76.8 8.3 7.5 3.3 89 200 1.11 0.072 0.097 < 0.01 11 0.9
7/21/2015 10:17 13.4 245 78.1 8.2 8.1 1.8 194 600 0.71 0.084 0.089 < 0.01 4 0.7
8/26/2015 9:40 13.1 239 77.4 8.1 7.6 3.6 107 140 0.5 0.073 0.088 < 0.01 6 0.7
9/21/2015 10:15 13.6 246 77.9 8.1 7.7 1.8 102 84 0.54 0.074 0.096 < 0.01 5 0.7