costs and benefits of investing in ecoystem restoration...
TRANSCRIPT

Costs and Benefits of Investing in Ecoystem Restoration and Conservation: Green Growth Opportunities in Katingan Peatlands Technical Report
Component 1B: Green Growth Assessment of Capital Projects
Government of Indonesia - GGGI Green Growth Program
January 2015

2
Table of Contents
EXECUTIVE SUMMARY .................................................................................................................................. 6 1 INTRODUCTION .............................................................................................................................. 19 2 OPTIONS FOR LAND USE AT KATINGAN ......................................................................................... 27 3 METHODOLOGY ............................................................................................................................. 31 4 SCOPE OF ANALYSIS ....................................................................................................................... 36 5 RESULTS ......................................................................................................................................... 42 6 POLICY IMPLICATIONS ................................................................................................................... 62 APPENDIX A LITERATURE REVIEW ....................................................................................................... 77 APPENDIX B MODEL ARCHITECTURE .................................................................................................. 82 APPENDIX C ECOSYSTEM VALUATIONS .............................................................................................. 83

3
List of Figures
Figure 1: The five desired outcomes of green growth developed with key stakeholders in Indonesia . 6 Figure 2: Overview of Katingan Restoration and Conservation Project Area ......................................... 8 Figure 3: Illustration of findings ............................................................................................................ 10 Figure 4: Illustration of Net Present Value results ................................................................................ 12 Figure 5: The five desired outcomes of green growth developed with key stakeholders in Indonesia .............................................................................................................................................................. 20 Figure 6: Stages in conducting project-level eCBA ............................................................................... 22 Figure 7: Planned Project Activities against 5 outcomes of green growth ........................................... 24 Figure 8: Stylized overview of a ‘greened’ planning and project appraisal process in Indonesia ........ 26 Figure 9: Activities against 5 outcomes of green growth ..................................................................... 29 Figure 10: Hypothesis tested by this report ......................................................................................... 30 Figure 11: An impact pathway .............................................................................................................. 36 Figure 12: Illustration of Net Present Value results .............................................................................. 43 Figure 13: Financial analysis; comparison of the Green Growth and BAU scenario (undiscounted net benefits) ................................................................................................................................................ 45 Figure 14: Assumed Palm Oil Yield Curve (years since planting) .......................................................... 46 Figure 15: Palm Oil Financial Costs and Benefits .................................................................................. 47 Figure 16: Logging/Timber Plantation Financial Costs and Benefits..................................................... 48 Figure 17: Land cover map of the Katingan Conservation Area and surrounding region .................... 50 Figure 18: Map of forest biomass carbon stocks in the Katingan Conservation Area .......................... 50 Figure 19: Estimated actual - and assumed marketable - emissions reductions over 25 years ........... 50 Figure 20: PT RMU Ecosystem Restoration Concession Financial Costs and Benefits .......................... 51 Figure 21: eCBA analysis; comparison of the Green Growth and BAU scenario (undiscounted net benefits) ................................................................................................................................................ 52 Figure 22: eCBA Costs and Benefits for Palm Oil Plantations ............................................................... 54 Figure 23: eCBA Costs and Benefits for HTI Timber Plantations ........................................................... 54 Figure 24: eCBA Costs and Benefits for PT RMU project ...................................................................... 56 Figure 25: Variation in results (financial) .............................................................................................. 59 Figure 26: Variation in results (eCBA) ................................................................................................... 59 Figure 27: Palm Oil and Timber international price trends 2009-2014 ................................................ 60 Figure 28: Ecosystem service valuations............................................................................................... 61 Figure 29: Payment Mechanism under a Regional Incentive Fund ...................................................... 72

4
List of Tables Table 1: Summary of results (USD million) ........................................................................................... 11 Table 2: Matrix on Policy Barriers and Enablers of Green Growth Interventions ................................ 14 Table 3: Forest land-use zones in Indonesia ......................................................................................... 22 Table 4: Assumed land use in BAU scenario ......................................................................................... 27 Table 5: Key aspect of BAU Scenario, and identification of expected green growth impacts .............. 28 Table 6: Summary of the Green Growth scenario implementation, and identification of expected green growth impacts ........................................................................................................................... 29 Table 7: Key assumptions applied across the analysis .......................................................................... 33 Table 8: Impact Pathways for RMU ...................................................................................................... 38 Table 9: Summary of results (USD million) ........................................................................................... 43 Table 10: Summary of costs and benefits in each scenario .................................................................. 44 Table 11: Subsidence characteristics of peat land in Kalimantan and Sumatera ................................. 53 Table 12: Estimates for the Global Social Cost of Carbon ..................................................................... 56 Table 13: Variation of input variables in sensitivity analysis (financial) ............................................... 57 Table 14: Variation of input variables in sensitivity analysis (eCBA) .................................................... 58 Table 15: Seven ERC Licenses in Indonesia ........................................................................................... 63 Table 16: Summary of key policy suggestions ...................................................................................... 75

5
GoI-GGGI Green Growth Program
Our joint Government of Indonesia (GoI) and Global Green Growth Institute (GGGI) goal “To promote green growth in Indonesia that recognizes the value of natural capital, improves resilience, builds local economies and is inclusive and equitable”. To achieve this, GGGI provides technical support, research and capacity building that is in line with GoI’s vision and direction Our objectives The specific objectives of the GoI-GGGI Green Growth Program are:
1. To ensure the green growth vision matches or exceeds existing development targets;
2. To track the achievement of green growth priorities of Indonesia by providing relevant targets and indicators;
3. To evaluate the implications of the country’s current development path against green growth targets and indicators and assessing projects and potential policy and investment interventions against this baseline;
4. To identify the key sectors and high potential green growth projects and investment interventions that will help deliver green growth development;
5. To harness private sector engagement and investment in support of delivering green growth opportunities in Indonesia;
6. To undertake economic modeling to analyze each project showing their financial returns and identifying any gaps in the incremental spend required to secure green projects.
How GoI and GGGI will meet these objectives
1
2
“To mainstream green growth within Indonesia’s economic and development planning processes”
“To increase the use of green technology and increase capital investment in green industry” (GIMS)
“To support the development of a funding mechanism that disburses REDD+ finance to catalyze green growth”
“To support key provincial governments in prioritizing and implementing green growth”
Greening the planning process
REDD+ for green growth
Regional engagement
3
The combined work of these components will help to achieve the objectives and the overarching goal of GoI and GGGI.

6
Executive Summary Introduction
The Government of Indonesia (GoI)-Global Green Growth Institute (GGGI) Green Growth Program for Indonesia aims to promote green growth in Indonesia that recognizes the value of natural capital, improves resilience, builds local economies and is inclusive and equitable. A fundamental part of this will be mainstreaming green growth within Indonesia’s economic and development planning processes. To this end, GGGI with GoI are developing a framework and suite of tools that can be used by GoI to help embed green growth concepts into existing planning and investment appraisal instruments. Full details of the framework can be found in an accompanying report1, but the essence of the framework is to make green growth measurable along the desired five outcomes outlined in Figure 1 below. These outcomes are interrelated and a positive contribution to one can often simultaneously provide benefits to others. Only by making progress along all of these outcomes can Indonesia plan for inclusive and equitable growth that is sustainable over the course of generations. Figure 1: The five desired outcomes of green growth developed with key stakeholders in Indonesia
Similarly, full details of the range of tools needed to embed green growth within planning processes can be found in accompanying reports2, but at the heart of the suite of tools lies a comprehensive and integrated assessment of the monetary Costs and Benefits of capital projects in Indonesia. This includes, but is not limited to, those projects contained in the Master Plan for the Acceleration of Economic Development (MP3EI). This green growth assessment must not only look at financial costs and benefits but economic, social and environmental costs and benefits as well: Extended Cost Benefit Analysis (eCBA). An eCBA can be used by decision makers in government and the private sector to answer key questions such as:
1 GGGI (2015) Scoping green growth in Indonesia. Working Paper GGGI Indonesia Program 2 GGGI (2015) The Role of Extended Cost Benefit Analysis in Public Policy and Planning in Indonesia. Working Paper GGGI Indonesia Program

7
What is the green growth performance of the project compared to a Business As Usual scenario?
What is the value to the economy, society and the environment of this performance?
How can one re-design a project to improve its green growth performance?
What are the synergies and trade-offs among the different outcomes of green growth in doing this?
How much capital investment is required to achieve this improved performance?
What policy instruments are needed to drive investment and behavioural change?
Thus, a project-level eCBA can be viewed as an analytical tool that governments can use to identify the monetary values of public goods, environmental externalities and social returns associated with many projects. In this sense, results of an eCBA can be used as a base of evidence to determine the size of public and private investment flows needed to maximize these values over time.
This report is the third in a series performing project-level eCBAs on selected investments across Indonesia. For this analysis, we3 have selected the Katingan Restoration and Conservation Project (the ‘RMU’ project named after the project developers, PT Rimba Makmur Utama), at the request of the Central Kalimantan planning agency (Bappeda). The project is also representative of peat land issues and one on which we can pilot our eCBA methodologies in practice.
The project is located in the Katingan and Kotawaringin Timur Districts of Central Kalimantan, and covers 203,570 ha of peatland forest area including 150,650 ha of high-density swamp forest, home to large populations of endangered species such as the Bornean orangutan and proboscis monkeys.
The entire project area is classified as convertible and non-convertible Production Forest (HP).
Given the previous land-use classifications (HP, HPK4) and licenses issued (HTI, HPH), it is assumed that land would otherwise be logged, used for pulpwood plantations and/or converted to Palm Oil plantations. These uses of the land therefore constitute our ‘Business As Usual’ (BAU) scenario.
PT Rimba Makmur Utama (PT RMU) has obtained a License for the Commercial Use of Forest Products – Ecosystem Restoration - IUPHHK-RE (Ecosystem Restoration Concession, or ‘ERC’)
from the Ministry of Forestry of the Government of Indonesia5. ERCs are granted to private corporations seeking to conserve and restore Production Forests in Indonesia. In law, the ERC prevents the use of the project area for activities such as Palm Oil plantations, Industrial Timber plantations, selective logging etc. and obliges the developer to restore ecosystems through measures such as canal blocking, peat rewetting, reforestation and species reintroduction. Carbon storage and sequestration credits will be generated under the international Verified Carbon Standard (VCS) offset scheme, with Climate Carbon Biodiversity Alliance (CCBA) certification to reflect the wider social, environmental and biodiversity benefits of the project. The RMU project constitutes our ‘green growth’ scenario.
We note that the RMU project has been re-designed during its inception phase. The facts and figures used in this report relate to the original project design covering an area of 203,570 hectares, as set out in the CCBA Project Design Document, and consistent with the Financial Model provided to us by PT RMU. However, the exact nature of the new license/project design
3 Throughout this document “we”, “our” and “us” refers to the GGGI project team 4 HP: Production Forest, HTI: Industrial Timber Plantations, HPH: Logging Concessions and HPK: Convertible Production Forest (other uses including Palm Oil) 5 Source: Project Design Document

8
(expected to be between 108,000 and 157,000 ha) is not clear, and it is not possible to assess the exact impact of the revised plan on the eCBA results. It is likely though that the revised design will entail less benefit and greater cost per hectare since protecting a smaller area is less environmentally valuable than a larger area in the watershed, and management costs are largely fixed. Despite this change in project design, this report still contributes to the body of knowledge, and provides robust new understanding of the valuation of ERC projects in Indonesia. We are very grateful to PT RMU for sharing their data, insight and time, without which the analysis would not be possible. Figure 2: Overview of Katingan Restoration and Conservation Project Area
Source: Project Design Document
Findings
These two scenarios correspond to two different investment outcomes. Looking solely at the cashflows expected from a typical Palm Oil and HTI Plantation over 60 years, the findings of our financial analysis were that Business As Usual generates $43m higher return (Net Present Value discounted at 10%) even with the assumed carbon/biodiversity incentive of $2-8/tCO2 for the RMU
Proposed area in the watershed between
Mentaya and Katingan Rivers

9
project. And, given the current state of the global carbon markets, and opex escalation since the project design, the realized financial return is likely to be significantly lower. These findings correspond to the left hand side of the graphic in Figure 3. Conducting an Extended Cost Benefit Analysis tells a different story though. Accounting for the hidden costs of Business As Usual avoided under Green Growth, and valuing properly the full range of benefits occurring under an Ecosystem Restoration Concession, we estimate that the net societal benefit from the activities taking place at the Katingan site are $9.5bn higher than the Business As Usual scenario (in Net Present Value terms discounted at 5%). These findings correspond to the right hand side of the graphic in Figure 3. The benefits of the Green Growth scenario above can be broken down as follows:
Economic Growth benefits of $35m; value of 224 MtCO2 of avoided emissions credit sales at an average of $6.9/tCO2, $49m of sustainable (low impact, native species) logging revenues once PT RMU has restored the peat swamp forest, and $24m of agriculturally productive land bequeathed to the next generation. Minus capital and operational costs.
Social benefits of $4m; Socio-cultural value of the standing forest to local communities.
Ecosystem benefits of $232m; the value of standing forest to local communities including fuelwood, agricultural use, fisheries, and local and global biodiversity value (which in turn could drive eco-tourism).
GHG emission benefits of $9,702m; avoided climate change damages of rising sea levels, agricultural productivity loss, more frequent extreme weather events etc. (at $80/tCO2, minus credit monetized value above). This is the largest benefit category, although depends heavily on assumptions around carbon volumes and value.
The key break-even point for the CO2 valuation is $2.48/tCO2; if the social value of carbon exceeds this, then the Green Growth scenario outperforms the Business As Usual scenario (see Figure 4). However, this is at the very lowest end of the range in the literature, suggesting that the real value will be shown to be higher than this (see discussion on page 57). In addition there are hidden costs included in the net value of the BAU scenario, including:
Peat soil drainage issues causing flooding and significant yield deteriorations over time (a net present cost of around $297m)
Negative knock-on impacts to surrounding agricultural landscapes within the same watershed (a net present cost of around $295m)

Figure 3: Illustration of findings

We note that our methodology for valuing ecosystem services is conservative and follows a local Ministry of Environment study focused on marketable goods and services. Some studies would have the total ecosystem benefits up to ten-times higher6. Furthermore, the RMU project sits in a relatively small watershed in a coastal location. In a more upstream location the soil/hydrology impacts would likely be significantly higher. Also, we have not quantitatively included stranded assets such as the palm oil mills that would likely be left idle as local concessions flood and become unproductive. If these were included, the BAU scenario would decline in value. At the same time, we have been generous to the Business As Usual scenario, where most benefits come from commodity revenues. These are volatile and unpredictable, and the price of Crude Palm Oil alone has fallen 18% since year-end 20137. In short, a full analysis reveals that Business As Usual generates only uncertain, short-term cash and a number of hidden costs for investors and the wider economy. Green growth, conversely, generates sustainable, stable benefits. Table 1 and Figure 4 below summarize these findings. Table 1: Summary of results (USD million)
Note: Resilience is not valued since it is a cross-cutting theme, impacted by the other 4 outcomes of green growth; for example communities are less vulnerable to commodity price shocks or flooding from climate change, which are ‘economic’ and ‘ecosystem’ impacts in their own right.
6 Van Baukering et al (2008). See page 56 for details. 7 Source: World Bank Global Economic Monitor This is not reflected in our final results as we take a long-term assumption for the value of Fresh Fruit Bunches ($150/tonne).
Business As Usual Green Growth Difference
Financial Net Present Value $182m $139m -$43m
Extended Net Present Value $485m $9,974m +$9,489m
of which
- Economic Growth $485m $35m -$450m
- Social Development $0m $4m +$4m
- Ecosystems $0m $232m +$232m
- GHG emissions $0m $9,702m +$9,702m

12
Figure 4: Illustration of Net Present Value results
Policy
The quantitative analysis that took place for this study has two major conclusions:
1. From a societal perspective, ERC is an optimal use of land at this (and similar) site(s)
2. Under current market conditions, the cash incentive to invest in ERC is limited Given these two points, there is a clear rationale for public policy intervention. Based on our quantitative analysis, a literature review, stakeholder consultation and interviews with PT RMU, we have identified a number of supporting policy interventions that would be helpful to support ERC projects and drive investment across suitable degraded land sites across Indonesia. Individually, these are not new recommendations, but do need to be addressed in a novel and systematic way if ERC projects are to get off the ground:
Addressing regulatory issues; streamlining the licensing cost and process.
Reducing business and financial risks; ensuring a stable CO2 price with the help of Indonesian and international funds.
Improving financial performance; ensuring a reasonable CO2 price supported by multi-commodity strategies including Non-Timber Forest Products and Biodiversity monetization, as well as opening access to low-cost debt finance.
Improving land use governance; in the long-run, appropriately zoning potential ERC areas to avoid competition with commodity extraction activities and ensuring enforcement of the law.
Incentivizing local government to support ERC; compensating local government for land swap costs, and ensuring sufficient fiscal incentives exist to support ERC projects. This policy objective needs to be a priority.
The policy matrix in Table 2 below explains in more detail the identified barriers to the success of ERC projects and the potential policy remedies. These have been categorized according to whether they are for the benefit of (or incentivize) primarily investors, government or communities.
$139 $182
$9,974
$485
$9,974
-
2,000
4,000
6,000
8,000
10,000
12,000
Ecosystem Restoration Palm Oil / HTI Ecosystem Restoration Palm Oil / HTI
Financial analysis eCBA
US
D m
illi
on
Assumed Social Cost of Carbon
= $80/tCO2
'Tipping point' Social Cost of
Carbon = $2.48/tCO2

13
This is a complex list of policies, but the overarching story around ERCs and how to promote them in the short-term is simple. Tangible sources of finance, such as carbon finance, are needed to bridge the gap for investors while broader policy reforms and economic development takes place. The analogy the project developers, PT RMU, use is one of a patient with a broken leg: “The forests are broken. Carbon revenue is the 'crutch' needed to get them walking again after a period of rest and recovery. The more crutches investors can access, the faster the forest will recover. And as the forests recover eventually investment in wider sustainable economic activities such as non-timber forest products, eco-tourism will be viable and self-sustaining. But only then can the forests walk again on their own two feet and no longer need the crutch” Rezal Kusumaatmadja PT RMU COO

14
Table 2: Matrix on policy barriers and enablers of green growth interventions
Key Issue Proposed Policy Intervention Expected Outcome
Po
licy
fo
r In
vest
ors
Addressing Regulatory Issues
Uncertainty regarding licensing (time and cost)
Streamlining and increasing the transparency of the ERC licensing process Greater government participation in the project: local government acquires the land and/or licenses
Decreased legal uncertainty and implementation delays Reallocation of regulatory risks to local government and de-risking of the investment
Addressing Business/Financial Risks
Absence of proven business model
Additional one-off support for early stage projects such as tax holidays
Awareness raising of long-run impacts of peat drainage in the business community
Increased investor confidence that ERC projects are practical
Increased investor understanding of the hidden costs of BAU
Financial risks (uncertainty regarding CER/VCS prices / volumes)
National Carbon Market and stabilization fund (minimum price at which GoI would buy a guaranteed volume of credits)
Other bilateral and multilateral guarantees
Decreased financial risks
Improving financial performance
Low returns on investment relative to commodities
Land swap (land suitable for palm oil expansion vs. HCV land)
Application of Polluter Pays Principle through carbon pricing
Decreased (legal) opportunity cost of investing in ERC in degraded peat swap forest
Low absolute returns on investment
Mandate a government agency to monitor leakage or absorb risk of spiraling monitoring costs
Decreased operation costs and improved financial performance
Allow concession fee to be paid in installments
Lower capital costs and higher financial performance

15
Provide preferential long-term funding to ERC developers through REDD+ Fund
Reduced cost of capital and improved financial performance
Po
licy
fo
r G
ove
rnm
ent
Incentivizing Government
Perceived attractiveness of commodity revenues and fiscal opportunity cost of ERC (national/provincial)
Clear spatial plan, including zoning of HCV areas (validation of ‘one map’)
Increase in palm oil output without further deforestation
Fiscal opportunity cost of land swaps (especially at district level)
Redirect revenue flows from project developers from national to local government
Intergovernmental fiscal transfers
Compensate eventual losses in fiscal revenues for local governments
Costs and benefits (including future fiscal liabilities) not included in decision making
Include green growth tools and methodologies in project and planning appraisal
Internalization of ecosystem service values into planning and investment decisions
Po
licy
fo
r C
om
mu
nit
ies
Addressing Social Risks
Absence of socio-economic opportunity means land clearance activities continue (or are simply displaced elsewhere; leakage)
Clarify benefit sharing mechanisms and establishing guidelines for participatory processes
Benefits funneled into long-term trust funds used to support livelihood development
Establish guidelines to assist developers include livelihood development in project design
Viable alternative to land clearance activities and sustainable long-term livelihoods
Greater buy-in for project and reduced monitoring and enforcement costs

16
Final remarks
We believe that these results provide a valuable contribution to the evidence base for green growth policymaking in Indonesia, both at national and sub-national levels. However, there are some caveats. While the principles of the methodology are well-established, the application is experimental and only the third, pilot, analysis in a series of analyses to be refined with stakeholders. Despite the best efforts of the team to validate all assumptions and findings with stakeholders, inevitably the results are subject to a degree of uncertainty, especially the counterfactual Business As Usual scenario. Therefore, some data gaps had to be filled with national and international proxies.
The specific results of this analysis are not, by themselves, suitable for investment decision making. While effort has been made to use local information wherever possible, data has not been universally available, and international proxies have been used in the analysis. Business implications are drawn without detailed feasibility studies, and the analysis has been designed to inform the policy debate rather than capital allocation decisions. In addition, we have not assured the data provided to us by PT RMU. The Global Green Growth Institute, its partners and contractors, do not verify, validate or endorse the social, economic or environmental performance of individual investments or projects.
Nonetheless, we hope that the analysis provides a tangible example of how to quantify and monetize a broad range of impacts at the project-level, and provides inspiration for the practical embedding of green growth theory into everyday planning processes. All feedback and comments are gratefully received by the project team.

17
Glossary Acronym Explanation
AMDAL Environment Impact Assessment
BAU Business As Usual
BCR Benefit-Cost ratio
BMP Best Management Practices
c.i.f Cost insured freight
CCBA Climate, Community and Biodiversity Alliance
CER Certified Emission Reduction
CO2 Carbon Dioxide
CPI Consumer Price Index
CPO Crude Palm Oil
eCBA Extended Cost Benefit Analysis
ERC Ecosystem Restoration Concession
f.o.b Free on board
FFB Fresh Fruit Bunch
FREDDI Fund for REDD+ Indonesia
GDP Gross Domestic Product
GIMS Green Industry Mapping Strategy
GGA Green Growth Assessment
GGAP Green Growth Assessment Process
GGF Green Growth Framework
GGGI Global Green Growth Institute
GHG Green House Gas
GoI Government of Indonesia
ha Hectare
HCV High Conservation Value
HP Hutan Produksi Production Forest Concession
HPK Hutan Produksi Conversi Production Forest Concession: Convertible
HTI Hutan Tanaman Industri Production Forest Concession: Industrial Timber
HPH Hak Pengusahaan Hutan Production Forest Concession: Selective Logging
IPB Bogor Agricultural University
IPCC Intergovernmental Panel on Climate Change
IUP-PAN-KARBON Business License for Carbon Sequestration and/or carbon storage
IUPHHK-RE Ecosystem Restoration Concession
Kalteng Central Kalimantan
KEK Special Economic Zone
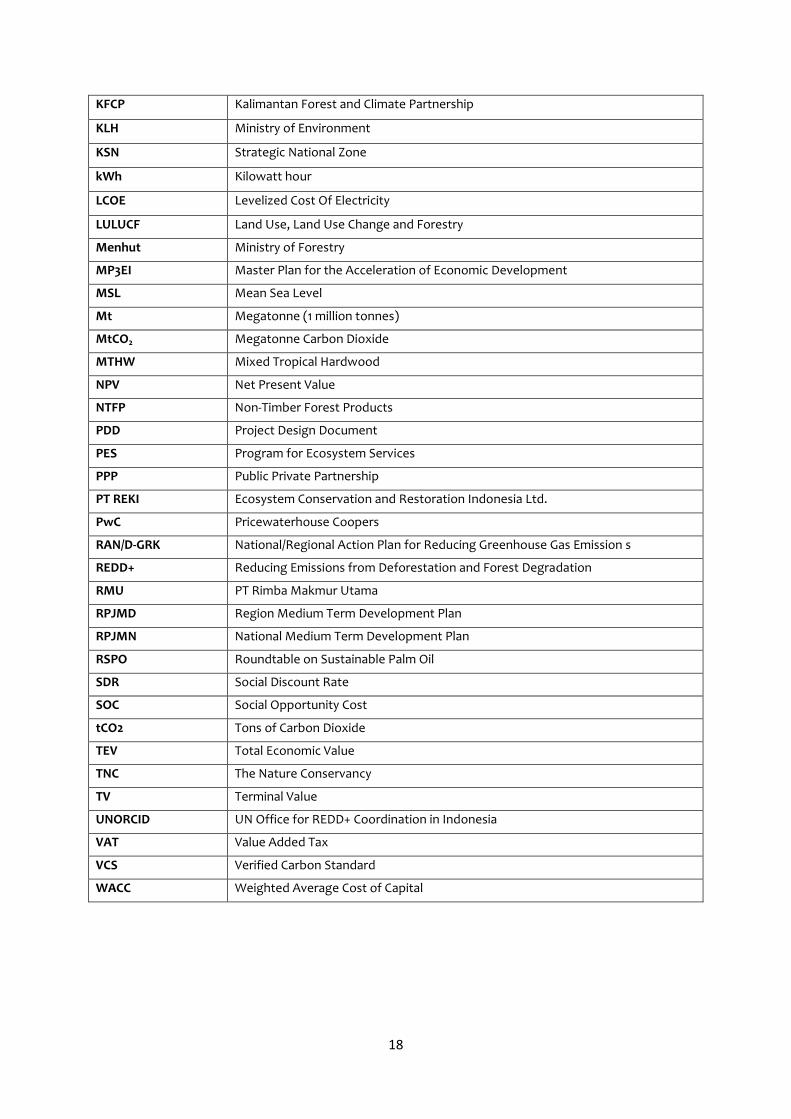
18
KFCP Kalimantan Forest and Climate Partnership
KLH Ministry of Environment
KSN Strategic National Zone
kWh Kilowatt hour
LCOE Levelized Cost Of Electricity
LULUCF Land Use, Land Use Change and Forestry
Menhut Ministry of Forestry
MP3EI Master Plan for the Acceleration of Economic Development
MSL Mean Sea Level
Mt Megatonne (1 million tonnes)
MtCO2 Megatonne Carbon Dioxide
MTHW Mixed Tropical Hardwood
NPV Net Present Value
NTFP Non-Timber Forest Products
PDD Project Design Document
PES Program for Ecosystem Services
PPP Public Private Partnership
PT REKI Ecosystem Conservation and Restoration Indonesia Ltd.
PwC Pricewaterhouse Coopers
RAN/D-GRK National/Regional Action Plan for Reducing Greenhouse Gas Emission s
REDD+ Reducing Emissions from Deforestation and Forest Degradation
RMU PT Rimba Makmur Utama
RPJMD Region Medium Term Development Plan
RPJMN National Medium Term Development Plan
RSPO Roundtable on Sustainable Palm Oil
SDR Social Discount Rate
SOC Social Opportunity Cost
tCO2 Tons of Carbon Dioxide
TEV Total Economic Value
TNC The Nature Conservancy
TV Terminal Value
UNORCID UN Office for REDD+ Coordination in Indonesia
VAT Value Added Tax
VCS Verified Carbon Standard
WACC Weighted Average Cost of Capital

19
1 Introduction
Indonesia Green Growth Program
The Government of Indonesia (GoI) and Global Green Growth Institute (GGGI) have developed a program of activity that is aligned and wholly supportive of achieving Indonesia’s existing vision for economic development planning. The aim is to show, using real examples of Indonesia’s development and investment plans at national, provincial and district levels, how economic growth can be maintained while reducing poverty and social inequality, maximizing the value of ecosystem services, reducing GHG emissions, and making communities, economies, and the enviroment more resilient to economic and climate shocks.
The overarching goal of the Government of Indonesia-Global Green Growth Institute Green Growth Program for Indonesia is to promote green growth in Indonesia that recognizes the value of natural capital, improves resilience, builds local economies and is inclusive and equitable.
The program has a number of specific objectives (see page 5), and three complementary components:
1. Greening the Planning process. Aim: ‘To mainstream green growth within Indonesia’s economic and development planning processes’ and ‘To increase the use of green technology and increase capital investment in green industry’
2. REDD+ for green growth. Aim: ‘To support the development of a funding mechanism that disburses REDD+ finance to catalyze green growth’
3. Regional engagement. Aim: ‘To support key provincial governments in prioritizing and implementing green growth’
This report supports Component 1 in mainstreaming green growth in planning processes. As part of this component, the GoI and GGGI are developing a framework and suite of tools that can be used by GoI to help embed green growth principles into existing planning and investment appraisal instruments and processes.
Mainstreaming green growth in planning processes
Currently there is no single, internationally accepted analytical framework or set of indicators to monitor green growth performance8. As a starting point, GoI and GGGI have initiated a discussion with key stakeholders on what represents an appropriate framework to define what green growth means to stakeholders in Indonesia. Green growth planning needs to be undertaken in an integrated manner and on a comprehensive basis. It is important to understand the interdependencies between the country’s economic competitiveness drivers and their implications for social development and environmental performance.
A Green Growth Framework (GGF) is being developed which brings together a set of social, economic and environmental indicators across 5 outcomes of green growth. These are all quantifiable and measurable, and provide a relevant framework for Indonesia to think about what green growth means to the country and the desired outcomes to be achieved through green growth.
8 Green Growth Knowledge Platform, 2013

20
Figure 5: The five desired outcomes of green growth developed with key stakeholders in Indonesia
This Green Growth Framework can support decision making and prioritization of economic planning instruments, across national and sub-national government. A key part of decision making in this context is the selection and improvement of capital projects, such as those found in the Master Plan for the Acceleration of Economic Development (MP3EI).
The GoI together with the GGGI is developing a tool to help operationalize the GGF within government and measure the green growth performance of investments. This tool is called the Green Growth Assessment Process (GGAP). GGAP is a 9-step process using indicators specific to projects, sectors, districts, provinces and Indonesia as a nation, as well as a range of other tools, and can be used by government:
To allocate resources to the projects with the highest green growth potential;
To re-design and optimize publicly-funded projects; and,
To build a business case for projects with green growth benefits in order to attract private investment.
A full overview of the GGF and GGAP is available in an accompanying report9, but in brief the GGAP is fed with proposed capital projects from different government economic development strategies and sectoral development plans, and applies indicators under the GGF to prioritize those that contribute most to green growth. Different design options for this shortlist of prioritized investments undergo a Green Growth Assessment. For the purpose of capital project assessments we apply a project-level Extended Cost Benefit Analysis (eCBA) methodology. The project-level eCBA is intended to provide a holistic and comprehensive understanding of the impacts of investments through a focus on the measurement and valuation of their green growth implications in rigorous, economic terms. It is often used in the application of Multi Criteria Analysis (see page 26), providing the social, economic and environmental valuations needed to make decisions.
Based on the results of the project-level eCBA, and ongoing monitoring of green growth performance, aspects of these investments can potentially be re-designed. The identification of potential project re-designs can help inform policy developments and other enablers.
9 GGGI (2015) Scoping green growth in Indonesia. Working Paper GGGI Indonesia Program

21
This paper is the third in a series of papers conducting project-level eCBAs on a range of individual investments.
Box 1: Green Growth Indicators
The Green Growth Framework ultimately rests on the indicators used to define and measure green growth in practice. There are three broad functions/types of these indicators:
1. Diagnostic indicators: designed to assess the overall sustainability of Indonesia and to identify key issues that should be considered in the mainstreaming of the green growth Planning process;
2. Planning indicators: designed in accordance with the Pressure-State-Response approach and so useful for assessing the cause-effect linkages between sustainability issues highlighted by diagnostic indicators and their pressures and impacts;
3. Monitoring and Evaluation (M&E) indicators: designed to help track green growth progress and performance of Indonesia.
Indicators can be applied at different levels, including at the national, regional, sectoral and micro (project) levels (see Figure 5). All indicators within this report fall under the category of ‘project-level’ indicators.
The methodology applied at project level naturally supports functions 1 and 3 above: Diagnosis and M&E. eCBA provides a set of indicators that can be used for diagnosis of the project baseline across each of the five outcomes of green growth, and also sets out rigorous indicators that can be used for future project Monitoring and Evaluation. When aggregated across a number of projects, or particularly large projects, they may also support planning functions (Function 2).
For further details on indicators and their role in the planning framework, the reader is referred to the references footnoted on the previous page10.
Green Growth Assessment
Within the Green Growth Assessment of Capital Projects, eCBA is the key methodology used to value social, economic and environmental costs and benefits. Cost Benefit Analysis (CBA) is a toolkit used by economists and other decision makers to evaluate the desirability of a policy or project by systematically comparing costs and benefits. These costs and benefits are measured in terms of ‘social welfare’.
Social welfare is a technical term used by economists to measure the ‘utility’ of a population, as opposed to ‘private welfare’ which is just the utility of the individual. Social welfare includes all economic (material goods), social (community cohesion), and environmental (ecosystem services) benefits that an economy, society and nature provide.
In practice, calculating social welfare entails focusing on measurable economic costs and benefits, and including social and environmental factors not accounted for in market prices. We use the term Extended CBA (eCBA) to emphasize that our methodology assesses these non-market, social and environmental externalities as much as is practical and takes account of redesign options for the project to improve its green growth performance (this latter point differentiates eCBA from Social Cost Benefit Analysis (SCBA).
A project-level eCBA provides evidence for decision makers to inform decisions on whether a project should go ahead. If the total benefits exceed the total costs, then the project can be considered to be justified in net social welfare terms although the decision to proceed will inevitably be subject to a wider range of considerations (such as affordability). But, investors will usually only take forward projects where the private benefits exceed the private costs. Due to

22
the presence of market imperfections and ‘missing’ markets (e.g. ‘public goods’ such as clean air), private incentives are not always aligned with achieving optimal social outcomes. Therefore, a key objective of the project-level eCBA is to cast light on the difference between these and suggest policies to help align them.
The practical process of conducting a project-level eCBA requires 6 stages as outlined in the Figure 6 below.
Figure 6: Stages in conducting project-level eCBA
Identify and consult project stakeholders
Review project documentation
Establish project rationale and need
Consult project stakeholders
Consult experts
Literature review
Identify outputs, outcomes and impacts
Identify potential scope for eCBA
Assess materiality: Identify actual scope for eCBA
Collect data from project documentation
Collect local market data
Collect international technology data
Value costs and benefits of green growth interventions
Consider implications of results for policy
Consider implications for project re-design and investment
Validate findings with stakeholders
The Katingan Restoration and Conservation Project (the RMU project)
The RMU project is located in the Katingan and Kotawaringin Timur Districts of Central Kalimantan, and covers a total area of 203,570ha of peatland forest area – including 154,892 ha of peat swamp forest, home to large populations of endangered species including the Bornean orangutan and proboscis monkeys. The entire project area is located in convertible and non-convertible Production Forest split between two functions: commercial logging; and palm oil production.
Around 12% of the project area (24,428 hectares) is classified as HPK and legally eligible for conversion to an oil palm plantation. The remaining 88% of the project area (179,142 hectares) is legally eligible for selective logging, and, for those areas containing peat soil less than 3 meters deep, to become HTI plantations.
Numerous HTI and HPH licenses have been issued in the project reference region, suggesting that the project areas classified under HP would be highly likely to be commercially developed. Recalling that 33 large palm oil plantations have already been developed in the vicinity of the project area, covering around 278,000 ha in areas with similar biophysical characteristics to the project area, it is reasonable to assume that the project areas classified as HPK would undergo conversion into palm oil plantations.
Table 3: Forest land-uses in Indonesia
Acronym Bahasa Indonesia English
Stage 1 Stage 2 Stage 3 Stage 4 Stage 5 Stage 6
Identify project baseline
Identify Green Growth options
Map Impact Pathways
Collect data
Cost Benefit Analysis
Validate Findings

23
HP Hutan Produksi Production Forest Concession
HPK Hutan Produksi Conversi Production Forest Concession: Convertible
HTI Hutan Tanaman Industri Production Forest Concession: Industrial Timber
HPH Hak Pengusahaan Hutan Production Forest Concession: Selective Logging
Conversion to an oil palm plantation would entail the drainage of the peat areas and clearance of the above-ground biomass to enable the planting of oil palms. Peat drainage involves the digging of canals, allowing water to gradually drain away from the wet soil. Drainage results in the oxidation of carbonic matter, which releases large amounts of GHG into the atmosphere. Moreover, ‘peatland drainage leads to subsidence, which in turn leads to reduced drainability [increased flooding], declining productivity and in lowland areas often eventually results in abandonment of land for agricultural production’10.
It is already well-known internationally that the conversion of peatland to agricultural and other plantation uses can have serious adverse consequences for peat soil drainage and subsidence11. For example, the Sacramento-San Joaquin Delta in California was drained “over a century ago for agriculture and human settlement and has since experience subsidence rates that are among the highest in the world”12. Evidence on the topic is less available in South East Asia due to less published research, but the mechanisms are the same and according to some literature, subsidence on drained peatland may exceed two meters within a few decades, supporting the case that areas with peat over 2 metres in thickness are unsuitable for conversion to agriculture13.
In other words, palm oil development and drainage on peatland may permanently impair the agricultural potential of the land. In the short term, it will increase risks of flash floods during the rainy season, and water scarcity during the dry season, affecting plantation yields and production costs.
The creation of industrial timber plantation (HTI) for pulpwood would entail very similar activities with the same results14.
Selective logging (the harvesting of select tress for sale as timber) would also require canals for wood transport, as is already evident at the site15. However, these are generally smaller than the canals used to deliberately drain land for planting and so are less hydrologically disruptive. In this area it is also likely that selective logging would happen on a ‘less commercial’ scale (i.e., less intense are more driven by local communities rather than large corporates), since the area has already been significantly logged over.
PT Rimba Makmur Utama (PT RMU) has obtained a License for the Commercial Use of Forest Products – Ecosystem Restoration – IUPHHK-RE (Ecosystem Restoration Concession, or ‘ERC’) from the Ministry of Forestry of the Government of Indonesia16. ERCs are granted to private corporations seeking to conserve and restore Production Forests in Indonesia. In law, the ERC prevents the conversion of the project area to non-forest use for 35 years.
10 Deltares, 2012, Subsidence in drained coastal peatlands in SE Asia: implications for sustainability 11 Stephens et al (1984), Rojstaczer & Deverel (1993), Hirano et al (2012) 12 Knox et al (20140) Agricultural peatland restoration: effects of land-use change on greenhouse gas fluxes in the Sacramento-San Joaquin Delta. 13 Deltares, 2012, Subsidence in drained coastal peatlands in SE Asia: implications for sustainability 14 Source: Project Design Document. See also IPCC (2013) Supplement to the 2006 IPCC Guidelines for National GHG Inventories: Wetlands for further details on the GHG emissions process, as well as FAO (2014) Towards Climate-responsible Peatlands Management 15 Source: Project Design Document 16 Source: Project Design Document

24
Figure 7 below summarizes the key Katingan Restoration and Conservation project activities. Figure 7: Planned Project Activities against 5 outcomes of green growth
Source: Project Design Document, Team Analysis
Understanding the Results
In this report we calculate the costs and benefits of the Katingan Restoration and Conservation Project compared to BAU scenario. Our headline finding is that implementing eighteen project activities that make up the Katingan Restoration and Conservation Project would result in significant net societal benefits. The full quantitative results are presented in Section 6. The details of scope and methodology are presented in Sections 4 and 5, but it is important to provide context for interpretation of the headline results.
Cost Benefit Analysis is part of a broader project appraisal process and can fit into existing process as explained in Figure 8 on the following page. This allows for key decisions to be made before implementation:
Does it offer net positive benefits and should it proceed?
Are there opportunities to re-design this project to enhance green growth performance?
Are there policies that might drive better outcomes for this and other projects (see next chapter)?
We note that Social Cost Benefit Analysis (sCBA) is already mandatory for Public Private Partnership (PPP) projects in Indonesia, but not necessarily for other investments. Moreover, sCBA is often limited in scope and transparency (see page 64 for more discussion of PPPs).

25
The aim of the project-level eCBA in this report is to test the tool in development on a real project design17 and to contribute to the evidence base for green growth policy in Indonesia, highlighting potential options for improving green growth performance but more importantly demonstrating that valuing the wider implications of decision making, and internalizing them into the project appraisal process, can lead to improved policy outcomes. The project-level eCBA does not substitute for a full feasibility analysis and/or financial appraisal - rather it complements them.
For maximum impact, the project-level eCBA should be combined alongside other green growth tools such as Green Project Prioritization tools, Strategic Environmental Assessment and impact assessment techniques.
The specific results of this analysis are not, by themselves, suitable for investment decision making. While effort has been made to use local information wherever possible, data has not been universally available, and international proxies have been used in the analysis. Business implications are drawn without detailed feasibility studies, and the analysis has been designed to inform the policy debate rather than capital allocation decisions. In addition, we have not assured the data provided to us by PT RMU. The Global Green Growth Institute, its partners and contractors, do not verify, validate or endorse the social, economic or environmental performance of individual investments or projects.
Structure of this report
The rest of this report is structured as follows:
- Section 2 provides different options for delivery and introduces the Green Growth scenarios
- Section 3 provides detailed methodology and reporting framework used in this report
- Section 4 provides a detailed scope of analysis
- Section 5 presents the quantitative results of the Cost Benefit Analysis
- Section 6 outlines some policy implications of the results
- Appendix A provides an overview of literature review
- Appendix B outlines the architecture of the eCBA model
- Appendix C provides key ecosystem valuation coefficients
17 Notwithstanding the project re-design discussed on page 8
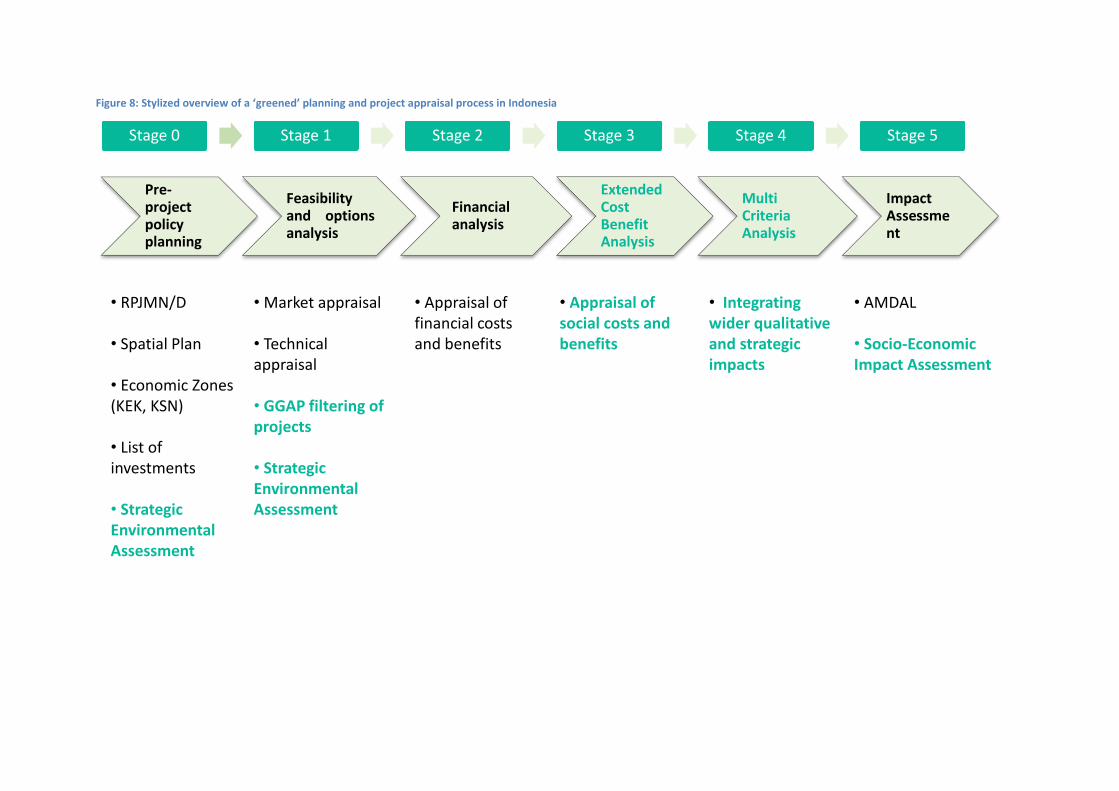
Figure 8: Stylized overview of a ‘greened’ planning and project appraisal process in Indonesia
Pre-projectpolicyplanning
Feasibilityand optionsanalysis
Financialanalysis
ExtendedCostBenefitAnalysis
MultiCriteriaAnalysis
ImpactAssessment
Stage 0 Stage 1 Stage 2 Stage 3 Stage 4 Stage 5
• Market appraisal
• Technical appraisal
• GGAP filtering of projects
• Strategic Environmental Assessment
• Appraisal of financial costs and benefits
• Appraisal of social costs and benefits
• Integrating wider qualitative and strategic impacts
• AMDAL
• Socio-Economic Impact Assessment
• RPJMN/D
• Spatial Plan
• Economic Zones (KEK, KSN)
• List of investments
• Strategic Environmental Assessment
2 Options for Land Use at Katingan
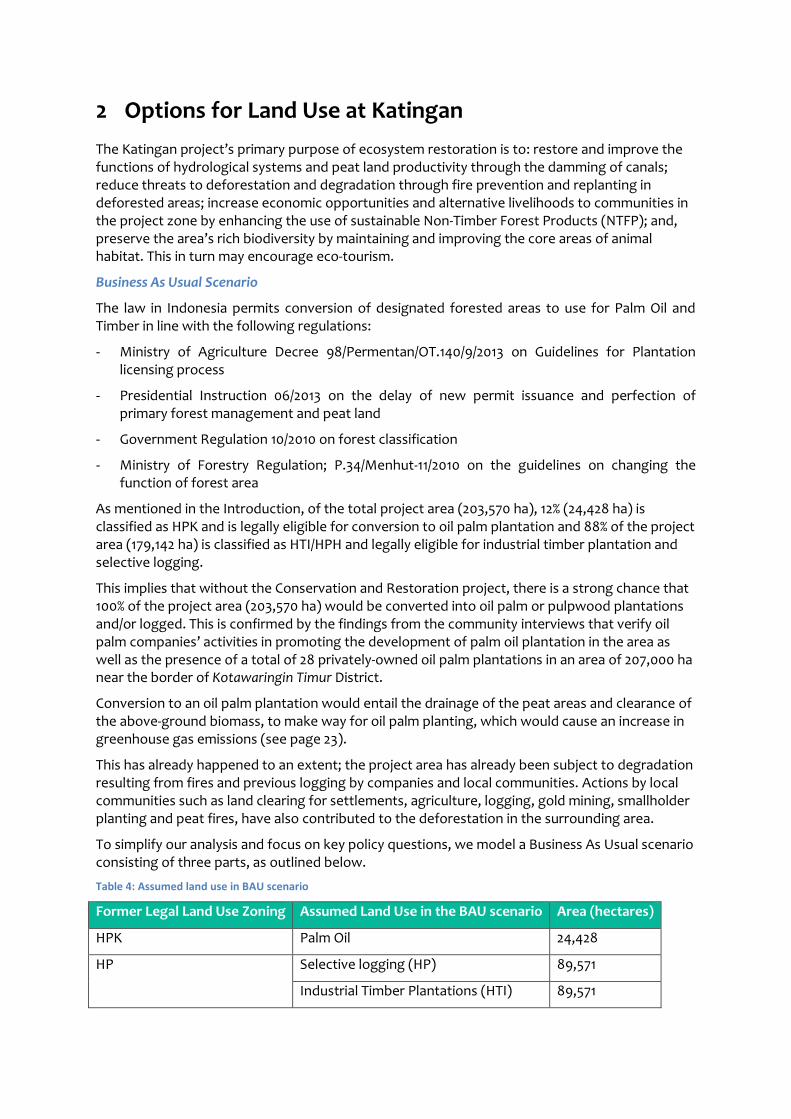
The Katingan project’s primary purpose of ecosystem restoration is to: restore and improve the functions of hydrological systems and peat land productivity through the damming of canals; reduce threats to deforestation and degradation through fire prevention and replanting in deforested areas; increase economic opportunities and alternative livelihoods to communities in the project zone by enhancing the use of sustainable Non-Timber Forest Products (NTFP); and, preserve the area’s rich biodiversity by maintaining and improving the core areas of animal habitat. This in turn may encourage eco-tourism.
Business As Usual Scenario
The law in Indonesia permits conversion of designated forested areas to use for Palm Oil and Timber in line with the following regulations:
- Ministry of Agriculture Decree 98/Permentan/OT.140/9/2013 on Guidelines for Plantation licensing process
- Presidential Instruction 06/2013 on the delay of new permit issuance and perfection of primary forest management and peat land
- Government Regulation 10/2010 on forest classification
- Ministry of Forestry Regulation; P.34/Menhut-11/2010 on the guidelines on changing the function of forest area
As mentioned in the Introduction, of the total project area (203,570 ha), 12% (24,428 ha) is classified as HPK and is legally eligible for conversion to oil palm plantation and 88% of the project area (179,142 ha) is classified as HTI/HPH and legally eligible for industrial timber plantation and selective logging.
This implies that without the Conservation and Restoration project, there is a strong chance that 100% of the project area (203,570 ha) would be converted into oil palm or pulpwood plantations and/or logged. This is confirmed by the findings from the community interviews that verify oil palm companies’ activities in promoting the development of palm oil plantation in the area as well as the presence of a total of 28 privately-owned oil palm plantations in an area of 207,000 ha near the border of Kotawaringin Timur District.
Conversion to an oil palm plantation would entail the drainage of the peat areas and clearance of the above-ground biomass, to make way for oil palm planting, which would cause an increase in greenhouse gas emissions (see page 23).
This has already happened to an extent; the project area has already been subject to degradation resulting from fires and previous logging by companies and local communities. Actions by local communities such as land clearing for settlements, agriculture, logging, gold mining, smallholder planting and peat fires, have also contributed to the deforestation in the surrounding area.
To simplify our analysis and focus on key policy questions, we model a Business As Usual scenario consisting of three parts, as outlined below.
Table 4: Assumed land use in BAU scenario
Former Legal Land Use Zoning Assumed Land Use in the BAU scenario Area (hectares)
HPK Palm Oil 24,428
HP Selective logging (HP) 89,571
Industrial Timber Plantations (HTI) 89,571

28
Table 5 below outlines what the hypothesized impacts of such a scenario might be, based on qualitative team expectations without reference to the quantitative analysis later in this report.
Table 5: Key aspect of BAU Scenario, and identification of expected green growth impacts
Activities under the BAU scenario
Description of expected impact on project area
Expected Green Growth Impact
Conversion to palm oil plantations
Total clearing of forest cover and drainage of the peat. Loss of biodiversity.
Green House Gas Emissions: Forest clearance and peat drainage would release significant quantities of GHG in the atmosphere, increasing climate change risks such as extreme weather events.
Sustained Economic Growth: Significant revenues generated by palm oil, logging and pulpwood plantation activities, although it is unclear for how long these can be sustained given likely flooding from peat soil drainage.
Healthy and productive ecosystems: HPH will contribute to partial loss of forest cover and significant loss of biodiversity. HTI/Palm Oil will cause greater losses of natural forest cover and even greater loss of biodiversity. Drainage of peat generally leads to on-site and downstream flooding.
Inclusive and equitable growth: the development of palm oil and timber activities would generate economic opportunities for local communities but deprive them of ecosystem services upon which their livelihoods were historically built.
Social, economic and environmental resilience: Local communities will be affected by the loss of biodiversity and ecosystem services. They had been relying on such services to provide livelihoods and subsistence opportunities, as well as resilience to climate and socio-economic shocks. However, this may be significantly offset if substantial CSR programs are run by plantation owners.
Conversion to timber plantations
Total clearing of forest cover and drainage of the peat. Loss of biodiversity.
Logging (HPH)
Partial loss of forest cover and (likely) drainage of the peat. Loss of biodiversity.
Key:
Red = Negative impact expected
Orange = Unknown or mild positive / negative impact expected
Green = Positive impact expected
Green Growth Scenario
The Green Growth scenario considered in this analysis refers to the implementation of the Katingan Restoration and Conservation Project. The Project will be managed and implemented within the 203,570 hectare project area, under the Ecosystem Restoration Concession (ERC) business model. ERC license holders are expected to invest in returning degraded or damaged production forests to their biological equilibrium, and preventing deforestation and degradation within their concession area18. Figure 9 below shows which Katingan Restoration and Conservation activities may impact each of the five outcomes of green growth.
In addition to these 18 activities undertaken by PT RMU, we assume in our Green Growth scenario that the land will be suitable for selective logging at the end of the Ecosystem Restoration Concession period. This would entail making use of the hydrologically restored peat swamp forest to nurture native species and use low impact silvicultural methods to harvest.
18 ERCs are regulated by Ministerial Decree 159/Menhut-II/2004 and Ministerial Regulation No 61/2008

29
Figure 9: Activities against 5 outcomes of green growth
Source: Project Design Document, Team Analysis
Grouping these activities into 5 themes, Table 6 below outlines what the hypothesized impacts of the Green Growth scenario might be. Again, this is based on qualitative team expectations without reference to the quantitative analysis later in this report.
Table 6: Summary of the Green Growth scenario implementation, and identification of expected green growth impacts
Activities under Green Growth Scenario
Description of expected impact on project area
Expected Green Growth Impact
Ecosystem Restoration
Maintenance of hydrological regulation functions, reforestation and enrichment in degraded areas
Green House Gas Emissions: The project implementation will support climate change mitigation as it avoids further forest clearance and peat drainage, and associated GHG emissions discussed in the BAU scenario. Better forest management will also increase biomass and carbon storage.
Sustained Economic Growth: In the short-term the Green Growth scenario may not contribute significantly to GDP. However, the project is expected to generate revenues from the sale of carbon credits and create income from other social and environmental activities. Prevention of drainage provides soil suitable for long-run selective logging.
Healthy and productive ecosystems: Maintenance of forest cover and soil integrity will enable hydrological balance in the project and surrounding area; it will also preserve local species’ habitat.
Inclusive and equitable growth: Local communities will be playing a central role in the Green Growth scenario, and
Forest Resource Conservation
Avoidance of biodiversity and ecosystem services losses
Research and Development
Enhancing knowledge and capacity on ecosystem restoration

30
Livelihood Development
Access to economic opportunities
benefit from a wide range of economic empowerment initiatives.
Social, economic and environmental resilience: Local communities will enjoy decreased vulnerability to climate shocks, potentially better access to public services, less volatile incomes, and more resilient ecosystem services providing products for local communities.
Community resilience
Decreased vulnerability to climate and socio-economic shocks
Key:
Red = Negative impact expected
Orange = Unknown or mild positive / negative impact expected
Green = Positive impact expected
Pulling the expected or hypothetical impacts of the two scenarios together, we are therefore testing the hypothesis in this report that green growth will provide a broader range of positive social, economic and environmental outcomes, whereas Business As Usual will generate only short-run financial gain. This hypothesis is illustrated below in Figure 10.
Figure 10: Hypothesis tested by this report
RMU scenarios
Initial conditions
$
Baseline : including negative social and environmental costs
Baseline : excluding negative social and environmental costs
Green Growth Scenario: Ecosystem Restoration Concession
Time

31
3 Methodology
This section summarises the methodological approach used to evaluate the societal costs and benefits likely to be generated by the green growth activities at Katingan.
Introduction to Green Growth Assessment
Within the Green Growth Assessment of Capital Projects, eCBA is the key methodology used to value social, economic and environmental costs and benefits, and underpins the results in this report. These costs and benefits are not always taken into account in decision making as individuals maximize their own private welfare, not necessarily social welfare. Private costs and benefits and social costs and benefits diverge due to the presence of market imperfections. For example, an investor does not always pay for the health damage that industrial effluent from their factory generates to communities downstream so the factory over-produces relative to what would be ‘best for society’, or does not pay for pollution-control technology even though this is cheaper than paying for the health damages inflicted. Principles of Cost Benefit Analysis
It is necessary to consider a much wider range of prices than pure market prices to arrive at the social costs and benefits of a decision (the social opportunity cost (SOC)). We note that these principles are crucial in differentiating eCBA (similar to ‘social cost benefit analysis’) from ‘financial appraisal’ or ‘financial cost-benefit analysis’, which only considers market costs and benefits from the perspective of a private investor.
Social discounting: Discounting is used to compare costs and benefits that occur in different time periods. Society generally prefers one dollar now to one dollar next year. The rate at which costs
and benefits are compared across time (‘discounted’) is called the Social Discount Rate (SDR19). We use a (real) SDR of 5% in our analysis, which is slightly below the standard range for
developing countries (8-15%)20
. This reflects the dominance of climate change and long-term environmental impacts in the analysis, and clearly differentiates the eCBA analysis from a financial appraisal Weighted Average Cost of Capital (WACC). The financial appraisal, on the other hand, uses a WACC of 10%, which is a weighted average of some assumed cost of debt and equity, and depends on corporate/project risk, access to finance, investor characteristics etc. PT RMU uses 12% in its financial appraisal and it is likely that Palm Oil or Timber companies would use a different WACC to reflect their own opportunity cost of capital. In order to facilitate direct comparisons between scenarios, we use 10%, which in real terms is a reasonably standard corporate discount rate in Indonesia. Taxes and subsidies: If there are significant taxes or subsidies present, then market prices will not represent the SOC of a resource (since taxes/subsidies are simply a transfer payment to/from government). In practice, it is not necessary to remove taxes and subsidies from all market prices in the analysis, but only where it makes a material difference to decision making. This is generally where markets are highly distorted. In the context of the RMU project, the main taxes are
19 Or: Social Rate of Time Preference. In the Ramsey (1928) model, SDR is defined as the sum of: the Pure Rate of Time Preference; and the Marginal Elasticity of Utility with respect to Income, multiplied by expected Income Growth. 20 Zhuang et al (2007) ‘Theory and Practice in the Choice of Social Discount Rate for Cost Benefit Analysis’

32
corporate income tax, and local licenses/concession fees, which are removed in the calculation of shadow prices.
Externalities: Where the social cost of the extraction or consumption of a resource differs from the private cost (or equivalently, the benefits), there is said to be an ‘externality’. In extremis, where everyone is affected by the externality, there is said to be a ‘public good’ (clean air) or ‘public bad’ (climate change). Again the market price, determined solely by private costs and benefits, will not reflect the true SOC of the resource or activity. Environmental externalities are pervasive in Kalimantan, with natural capital depletion taking place without account for the effects of:
Carbon release driving global climate change;
Disruption to hydrological cycle;
Destruction of biodiverse habitats;
Degradation of soil; and, other impacts.
Market power: Similarly, if a market is distorted due to oligopolistic or monopolistic market structures, then the market prices will fail to reflect the true opportunity cost of a resource. The most likely relevant distortion is in the palm oil sector where Fresh Fruit Bunch (FFB) prices are not set by market forces, but by provincial government commissions including representations from large palm oil estates and mills21. Yusuf et al (2004) estimated that this distortion to the FFB price is around 23% of the private price22. We have therefore uprated the market price of FFB by 23% for the shadow price calculation.
Tradable goods and Exchange Rates: Tradable goods must be valued as if there are no impediments to trade (i.e., no quantitative restrictions, no import/export tariffs or subsidies). In Indonesia, although timber and CPO are both subject to export VAT and export duty
respectively23,24, we note that pulpwood and FFB are either ineligible or impractical to export and therefore can be treated as non-tradable goods.
We assume that the official exchange rate represents the true opportunity cost of foreign exchange. All dollar values will be uplifted as needed to a 2014 base year using the United States GDP Deflator.
Costs relating to finance: The payment of interest and repayment of principal is often a key part of financial analyses. But, debt service is not relevant for economic and financial analysis in this context because “in both cases what matters is assessing the quality of the project independently of its financing mode”25. Debt service also represents a transfer rather than a use of resources.
Key data and assumptions for this project
The project-level eCBA relies on a wide range of physical and monetary data. It is not always clear cut as to which value to use in a particular calculation due to the constant evolution of markets, uncertainty about the future, missing or inaccessible data, unknown project operational details and so on.
21 Forest Peoples Programme (2006) Ghosts on our Own Land: Indonesian Oil Palm Smallholders and the Roundtable on Sustainable Palm Oil 22 Yusuf et al (2004) Pricing of Palm Oil Fresh Fruit Bunches for Smallholders in South Sumatera 23 PwC Indonesia (2014) “Indonesian Pocket Tax Book 2014” 24 Bloomberg (2013) “Indonesia cuts Palm Oil Export-Tax to Boost Sales as Prices Drop” 25 World Bank Handbook on Economic Analysis of Investment Operations

33
As a general rule, and all other considerations being equal (e.g. data quality), preference was given to data in the following order:
1) Project-specific data (e.g. from PT RMU financial model and Project Design Document)
2) Province-specific data (e.g. FFB prices from Kalteng, ecosystem products from Kalteng)
3) Indonesia-specific data (e.g. timber plantation operating costs from Sumatera)
4) South East Asia-specific data
5) Other comparable international technology or market data
In addition to these quantitative assumptions below, there were two qualitative assumptions made across all areas of analysis.
The first of these was that demand curves are inelastic. That is to say, in no scenario are market prices expected to shift; all prices were held constant in the BAU and Green Growth scenario. At the same time productivity and technology outside of the direct scope of analysis have been held constant.
The second is that the relevant geographical scope of analysis is Central Kalimantan – direct costs and benefits to other provinces are excluded (although for example it is possible that East Kalimantan or Java would benefit from activity later in the same supply-chain or transport of the produced commodities). The only exception to this was in relation to climate change. As this is considered a global problem, the valuations were made on the basis of the global damages attributable to one tonne of carbon emitted in Indonesia, not just the Indonesia-specific damages.
We note that a draft version of this report was presented to stakeholders for data and assumption validation.
Table 7: Key assumptions applied across the analysis26
Parameter Value Source
Weighted Average Cost of Capital (‘WACC’)
10%
Corporate Income Tax 25%
Social discount rate 5% Team Assumption
Social cost of carbon $80/tCO2 Tol (2009) assuming 0% Pure Rate of Time Preference
Forest Area 203,570 ha
Based on discussions with RMU project team
Percentage of forest area used for palm oil (HPK)
12%
Percentage of forest area used for HTI plantations
44%
Percentage of forest area used for selective logging
44%
HT
I D
eve
lop
me
nt
foll
ow
ing
cle
arin
g
Phase 1: Logging/clearing (clear cutting)
Number of years 10 years Team assumption based on SME input
Average logging yield 31.7 m3/ ha International Tropical Timber Council (2004)
Average price of logged $1o4/m3 Based on: Klassen (2010) Domestic Demand: the black hole in
26 Note: In this table and the following table, units are generally quoted in their source year currency units. In the actual CBA calculations, all values were automatically adjusted for inflation using the US GDP deflator as published by the World Bank World Development Indicators.

34
timber Indonesia’s forest policy
Log production cost $51/m3 Klassen (2010) Domestic Demand: the black hole in Indonesia’s forest policy, net of formal and informal taxes
Phase 2: HTI Development
Land preparation/planting 2 years International Finance Corporation. Note: Not on peatland.
Years to harvest after planting
5 years International Finance Corporation. Note: Not on peatland.
Average pulpwood yield 100 m3/ha International Finance Corporation. Note: Not on peatland.
Net revenue $25/m3 Using Climate Change Revenues to Grow More Wood and Reduce Net Carbon Emissions: Dual-Purpose Forest Plantations
International Finance Corporation. Note: Not on peatland.
Land preparation/planting cost
$1200/ha
Sel
ecti
ve
Log
gin
g
Selective Logging: As above (Phase 1 only)
Pa
lm O
il A
rea
Cycle 25 years
Average price of FFB $150/tonne http://www.bappebti.go.id/en/topdf/create/2040.html
Average production yield 25 tonne/ha
Reducing agricultural expansion into forests in Central Kalimantan Indonesia: Analysis of implementation and financing gap. Note: includes adjustment for costs of planting on peat. Rizaldi Boer, Dodik Ridho Nurrochmat, M. Ardiansyah, Hariyadi, Handian Purwawangsa, and Gito Ginting
Capital expenditure $9,006/ha/25
years
Operating expense (years 1 – 3)
$315/ha/yr
Operating expense (years 4 - 25)
$1,565/ha/yr
Hydrology Impacts starting year
Year 1
Wider watershed area – Area between Katingan and Mentaya river, bounded by Northern concession limit
200,000 ha Approximation based on Google Map distance tool
Wider watershed area –NPV of agricultural land
$3,424/ha
TNC Project
Note: Not on peatland.
Wider watershed area – NPV of sustainable forest management
$398/ha
TNC Project
Note: Not on peatland.
PT
R
MU
Pro
je
ct
Are
a Estimated Emissions Reductions
224 MtCO2/25
years Calculated using IPCC (2013) emissions factors below

35
Net emissions reduction factor for Timber Plantation (HTI)
73 tCO2/ha/yr Source: IPCC (2013) Note 95% Confidence Interval of 59 – 98 tCO2/ha/yr
Net emissions reduction factor for Oil Palm Plantation
40 tCO2/ha/yr
Source: IPCC (2013) Note 95% Confidence Interval of 21 – 62 tCO2/ha/yr
Net emissions reduction factor for Selective Logging
19 tCO2/ha/yr Source: IPCC (2013) Note 95% Confidence Interval of 14 – 25 tCO2/ha/yr
Marketable Emissions Reductions
134 MtCO2/25
years PT RMU Financial Model
Carbon credit price $2 - $8/tCO2
Economic value for forestry $5.6/ha/year
Peraturan Menteri Negara Lingkungan Hidup Republik Indonesia Nomor 14 Tahun 2012 tentang Panduan Valuasi Ekonomi Ekosistem Gambut (Ministerial Regulation)
Economic value for agriculture
$7.0/ha/year
Economic value for freshwater fish
$17.6/ha/year
Economic value for hydrology
$1.1/ha/year
Economic value for social cultural
$1.1/ha/year
Biodiversity and tourism $27/ha/year WWF Heart of Borneo: Investing in Nature for a Green Economy

36
Inputs
What resources have been committed?
Activities
How are the resources used?
Outputs
What are the direct results of
those activities?
Outcomes
How are stakeholders affected as a result of the outputs?
Impacts
The net change to stakeholders as a result of outputs
4 Scope of Analysis
This section explains the impact pathway approach that we use to structure our valuation. Impact pathways provide a rigorous ways of categorizing activities, outcomes and stakeholders and deciding which items to include in the quantitative scope of analysis.
Impact pathways and Indicators
In order to determine the net benefit that each of our ‘green growth interventions’ will generate, we must first establish how each intervention is likely to affect the environment, the economy and society as a whole. We use ‘impact pathways’ to describe the linkages between interventions (activities), the expected outputs from those activities, and the positive and negative outcomes that are generated in both the short and longer term.
The structure of an impact pathway is outlined in Figure 11 below. Beneath Figure 11 there is an example for the Katingan Restoration and Conservation project actually used in the Extended Cost Benefit Analysis. By explicitly outlining this ‘theory of change’, we make sure that each outcome is clearly defined and that they are derived from tangible activities and outputs. Outcomes must be expressed in monetary terms to ensure that they are compatible with a monetary Cost Benefit Analysis.
Figure 11: An impact pathway
Illustrative example for RMU:
Investment in restoration activities and ongoing monitoring
Forest resource conservation
Avoided deforestation
Increased timber and NTFP yield for local communities
Water supply and disturbance regulation for downstream communities and businesses
Better erosion control, soil formation and nutrient cycling for downstream Better waste treatment for downstream communities and businesses
Increased carbon storage/sequestration benefit to global stakeholders and businesses
Biodiversity and intangible value to global stakeholders
Deduct BAU outcome from project outcomes to get net impact

37
Table 8 below sets out the impact pathways constructed for the Green Growth scenario. These impact pathways define the scope of our cost-benefit analysis and identify the key indicators and outcomes that we will seek to quantify in our approach, as well as to whom these accrue. It is worth noting that this is not an exhaustive list of impacts, but rather a selection of high-impact interventions as identified in the Project Design Document as well as those explicitly suggested by project stakeholders.
Those impacts that are included in the eCBA (marked with a ‘‘) are defined very strictly with respect to impacts and stakeholders; these have to be absolutely clear for the valuation to be robust. Those impacts not included in the eCBA are defined more flexibly (and marked with a ‘’)
The costs and benefits associated with each impact have been ‘allocated’ to one of the five outcomes for reporting purposes. This does not affect the valuation methodology but it determines under which outcome in, for example Table 9, each cost or benefit is categorized.
This process is subject to uncertainty since many of the costs and benefits are cross-cutting; i.e., they contribute to more than one outcome of green growth. In particular, resilience is a cross-cutting outcome and outcomes here are likely to affect at least one of the other 4 outcomes as well. GHG emissions reductions through carbon storage and sequestration is also considered an outcome in its right, although ‘nested’ within broader ecosystem benefits. It is explicitly separated due to the global prominence of climate change as an environmental issue and the key
role Indonesia will play in mitigation. This is discussed further in accompanying GGGI reports27.
Open communication and stakeholder participation is the best way to achieve consistency in the allocation of costs and benefits to the different outcomes of green growth.
27 GGGI (2015) Scoping green growth in Indonesia. Working Paper GGGI Indonesia Program

38
Table 8: Impact Pathways for RMU
GREEN GROWTH SCENARIO
GG INTERVENTION OUTPUT Included in
scope of model?
IMPACTED STAKEHOLDERS
NEGATIVE OUTCOME / COST
POSITIVE OUTCOME / BENEFIT
ECOSYSTEM RESTORATION,
FOREST CONSERVATION, RESEARCH AND DEVELOPMENT,
LIVELIHOOD DEVELOPMENT,
COMMUNITY RESILIENCE.
Water system management
Biodiversity and species preservation
Local and Global stakeholders
Implementation costs of PT RMU Project
Intrinsic value of biodiversity
Monitoring and measurement of sampling plots
Avoided oxidation of carbonic matter and avoided release of tCO2
Global Impact Implementation costs of PT RMU Project
Mitigated Climate Change
Reforestation in non-forest areas
Avoided release of carbon from above-ground trees
Global Impact Implementation costs of PT RMU Project
Mitigated Climate Change
Enrichment planting in disturbed areas
Avoided/reduced drainage and flooding in the watershed
Communities outside project zone, but within watershed
Implementation costs of PT RMU Project
Avoided reduction in agricultural productivity
Protection and Enforcement
Businesses within watershed
Implementation costs of PT RMU Project
Avoided yield loss and revenue loss
Forest access maintained Local Communities Socio-cultural value to local stakeholder
Water purification function preserved
Local Communities Avoided cost of purchasing market water/ avoided disease

39
GREEN GROWTH SCENARIO
GG INTERVENTION OUTPUT Included in
scope of model?
IMPACTED STAKEHOLDERS
NEGATIVE OUTCOME / COST
POSITIVE OUTCOME / BENEFIT
Forest fire prevention and control
Carbon trading Government Implementation costs of PT RMU Project
Taxes and fees paid
Carbon Sales PT RMU Implementation costs of PT RMU Project
Carbon revenues
Habitat conservation and management
Opportunity cost of timber, pulpwood and palm oil revenues
Local investors Revenues forfeited Mitigated Climate Change
Knowledge management
Government Taxes and fees forfeited
Non-Timber forest products
Tonnes of NTFP produced Local Communities Implementation costs of PT RMU Project
Market Value of NFTP
Agroforestry Tonnes of agro-forestry products
Local Communities Implementation costs of PT RMU Project
Market value of agro-forestry products
Ecotourism Tourist visits to project management area
Local Communities Implementation costs of PT RMU Project
Tourist spending and multiplier effect on local economy

40
GREEN GROWTH SCENARIO
GG INTERVENTION OUTPUT Included in
scope of model?
IMPACTED STAKEHOLDERS
NEGATIVE OUTCOME / COST
POSITIVE OUTCOME / BENEFIT
Salvaged wood production
Tonnes of salvaged wood Local Communities Implementation costs of PT RMU Project
Market value of salvaged wood
Aquaculture and sustainable fisheries
Tonnes of additional fish produced
Local communities Implementation costs of PT RMU Project
Market value of fish
Micro Finance institutions and enterprises
Increased access to finance Local Communities Implementation costs of PT RMU Project
Higher community income from enabled entrepreneurship
Efficient energy use and production
Increased access to electricity Local Communities Implementation costs of PT RMU Project
Impact of kWh on livelihoods (health, education, business productivity and income)
Mother and child health care
Reduction in morbidity / Deaths prevented
Local Communities Implementation costs of PT RMU Project
Human capital value of lives saved / healthcare costs of treating disease avoided
Clean water and sanitation
Increased access to clean water
Local Communities Implementation costs of PT RMU Project
Avoided costs of purchasing bottled water / boiling groundwater
Number of additional people with improved sanitation
Local Communities Implementation costs of PT RMU Project
Human capital value of lives saved, voided healthcare costs

41
GREEN GROWTH SCENARIO
GG INTERVENTION OUTPUT Included in
scope of model?
IMPACTED STAKEHOLDERS
NEGATIVE OUTCOME / COST
POSITIVE OUTCOME / BENEFIT
Basic education
support Increased access to education Local Communities
Implementation costs of PT RMU Project
Value of educational services
Sustainable Logging Number of trees Local Communities Implementation costs of PT RMU Project
Market Value of wood
Note: It is broadly assumed in the BAU scenario that plantation owners do not significantly invest in Corporate Social Responsibility activities such as mother/child care, clean water, electrification etc. In practice, such activities are sponsored by some plantation companies. This would offset the positive impacts of the ERC concession scenario to an extent. However, since these are not in the quantitative scope of modelling, they do not affect the quantitative results in the following chapter.

42
5 Results
This section outlines the results of the Financial Analysis and Extended Cost Benefit Analysis of the Katingan Restoration and Conservation Project. The policy recommendations in the next section outline how to support the realization of external benefits through investment and the right enabling environment.
Summary of results: Key messages
Our analysis concludes that the conversion of the project area of 203,570 hectares into Palm Oil plantations, logging concessions and Industrial Timber Plantations (HTI), would bring financial gains at the expense of broader socio-economic success and natural capital preservation. This conclusion is based on the modelling of relevant historic data, as well as current market conditions, but is robust to reasonable changes in the assumptions.
Based on purely financial criteria and a narrow or short-sighted view of peatland hydrology28
, an Ecosystem Restoration Concession (ERC) on the project zone is less profitable than a Business As Usual scenario of land conversion to Palm Oil and Timber, by USD 43 million (at 10% cost of capital). And, without existing climate change policy in the form of monetized CO2 credits, would be fundamentally unprofitable. Natural Resource exploitation makes more sense for the typical investor.
However, extending the analysis to consider the wider economic costs and externalities generated during land conversion suggests that an ERC scenario generates value $9.5 billion higher than the BAU scenario (at 5% social discount rate and $80/tCO2). The benefits of the Green Growth scenario above can be broken down as follows:
Economic Growth benefits of $35m; value of 224 MtCO2 of avoided emissions credit sales at around $6.9/tCO2, $49m of sustainable timber revenues once PT RMU has finished the ecosystem restoration, and $24m of agriculturally productive land bequeathed to the next generation. Minus capital and operational costs.
Social benefits of $4m; Socio-cultural value of the standing forest to local communities.
Ecosystem benefits of $232m; the value of standing forest to local communities including fuelwood, agricultural use, fisheries, and local and global biodiversity value (which in turn could drive eco-tourism).
GHG emission benefits of $9,702m; avoided climate change damages of rising sea levels, agricultural productivity loss, more frequent extreme weather events etc. (at $80/tCO2, minus credit monetized value above). This is the largest benefit category.
In addition there are hidden costs included in the net value of the BAU scenario, including:
Peat soil drainage issues causing significant yield deteriorations over time (a net present cost of around $297m)
Negative knock-on impacts to surrounding agricultural landscapes within the same watershed (a net present cost of around $295m)
28 I.e., the investor treats peatland as if it were typical mineral soil and does not anticipate subsidence or major hydrological changes on their own land following drainage. Moreover, it is assumed that no policy or property rights regime is in place to internalize these costs on downstream landowners.
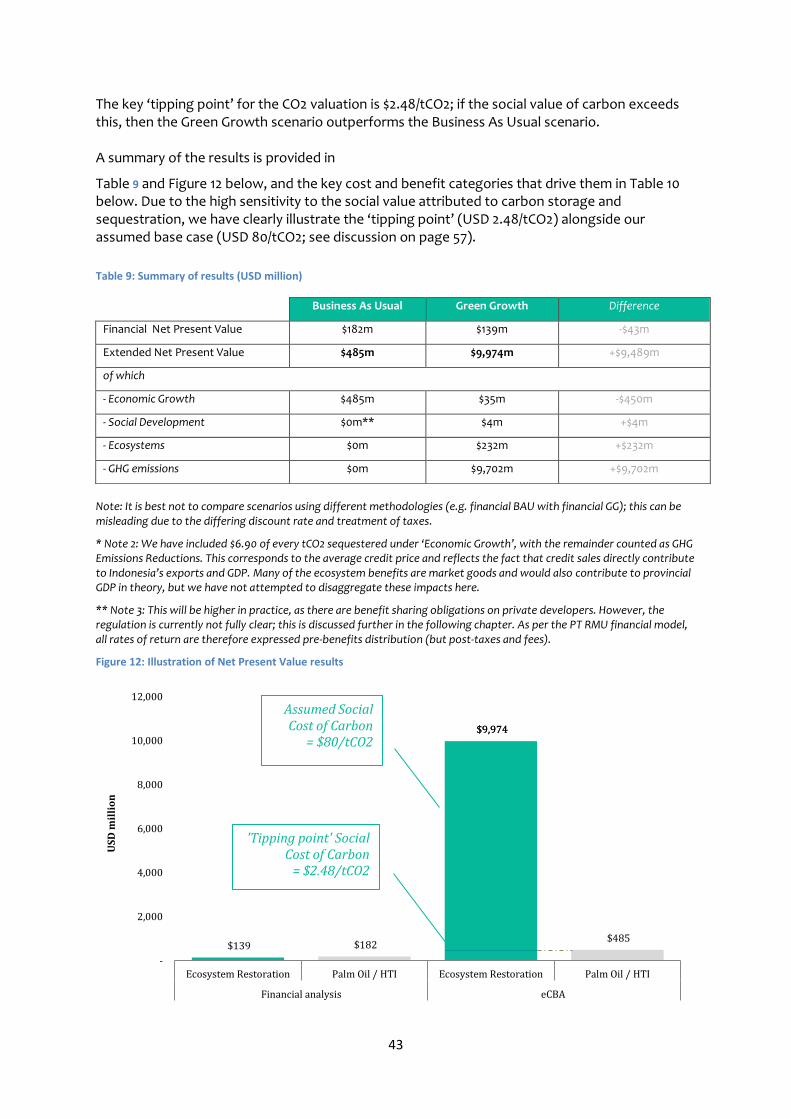
43
The key ‘tipping point’ for the CO2 valuation is $2.48/tCO2; if the social value of carbon exceeds this, then the Green Growth scenario outperforms the Business As Usual scenario. A summary of the results is provided in
Table 9 and Figure 12 below, and the key cost and benefit categories that drive them in Table 10 below. Due to the high sensitivity to the social value attributed to carbon storage and sequestration, we have clearly illustrate the ‘tipping point’ (USD 2.48/tCO2) alongside our assumed base case (USD 80/tCO2; see discussion on page 57).
Table 9: Summary of results (USD million)
Note: It is best not to compare scenarios using different methodologies (e.g. financial BAU with financial GG); this can be misleading due to the differing discount rate and treatment of taxes.
* Note 2: We have included $6.90 of every tCO2 sequestered under ‘Economic Growth’, with the remainder counted as GHG Emissions Reductions. This corresponds to the average credit price and reflects the fact that credit sales directly contribute to Indonesia’s exports and GDP. Many of the ecosystem benefits are market goods and would also contribute to provincial GDP in theory, but we have not attempted to disaggregate these impacts here.
** Note 3: This will be higher in practice, as there are benefit sharing obligations on private developers. However, the regulation is currently not fully clear; this is discussed further in the following chapter. As per the PT RMU financial model, all rates of return are therefore expressed pre-benefits distribution (but post-taxes and fees).
Figure 12: Illustration of Net Present Value results
$139 $182
$9,974
$485
$9,974
-
2,000
4,000
6,000
8,000
10,000
12,000
Ecosystem Restoration Palm Oil / HTI Ecosystem Restoration Palm Oil / HTI
Financial analysis eCBA
US
D m
illi
on
Assumed Social Cost of Carbon
= $80/tCO2
'Tipping point' Social Cost of Carbon
= $2.48/tCO2
Business As Usual Green Growth Difference
Financial Net Present Value $182m $139m -$43m
Extended Net Present Value $485m $9,974m +$9,489m
of which
- Economic Growth $485m $35m -$450m
- Social Development $0m** $4m +$4m
- Ecosystems $0m $232m +$232m
- GHG emissions $0m $9,702m +$9,702m

44
In Table 10 below, we have provided the individual items that are included in model calculations. One important point to note is the role of ‘avoided costs’. The costs of BAU (e.g. flooding impacts) could equally well be described as avoided costs of the Green Growth scenario (under which they would not occur). It is arbitrary whether they are included as costs of BAU or avoided costs of Green Growth, and re-allocation does not affect the relative performance of the scenarios; but it is critical that they are not double-counted under both scenarios. Table 10: Summary of costs and benefits in each scenario
Costs Benefits
Financial Cost Benefit Analysis
Business As Usual (@ 10%)
Palm Oil Plantation
[24,428 ha]
Capex (planting)
Opex (harvesting)
Taxes
Revenue from FFB
Logging, HTI Plantations
[179,142 ha]
Capex (planting, land prep., logging)
Opex (harvesting)
Taxes
Revenue from MTHW and Acacia crassicarpa
Green Growth (@ 10%)
ERC followed by sustainable logging
[203,570 ha]
Setup and admin costs
Opex (monitoring)
Taxes
CO2 credit sales
Sustainable timber net income
Extended Cost Benefit Analysis (incremental on above)
Business As Usual (@ 5%)
Palm Oil Plantation
Lost revenues from land flooding
Knock-on impacts to surrounding watershed agriculture
Taxes
Removal of FFB price distortion
Logging, HTI Plantations
Green Growth (@ 5%)
ERC followed by sustainable logging
Taxes Social value of carbon sequestered (net of CO2 credit price)
Agricultural produce
Non-Timber Forest Products
Fishing produce
Socio-cultural benefits
Clean water benefits
Biodiversity/tourism benefits

45
Results: Financial
The financial analysis uses only cash costs and benefits such as revenue, capital costs and operating costs, over a 60-year timeframe. This is a fundamental tool for private sector and other investors to make decisions. This section will explain the financial analysis of the BAU scenario activities and Katingan Restoration and Conservation activities. There are two assumptions running throughout the financial analysis:
The cost of capital used to generate Net Present Values is 10% (in real terms)
That investors are ‘myopic’ (short-sighted) with respect to ecological changes in the peatlands ecosystem, and do not anticipate changes in soil fertility/hydrology etc29.
The overall time profile of the financial costs and benefits is presented in Figure 13 below. These flows are volatile in the case of the BAU scenario since large capital outlays results in large and occasional harvest revenues. Overall though the BAU generates USD 43 million more value when discounted at 10%. On the following pages we explain in detail the scope, assumptions and data sources used to calculate the costs and benefits for the two scenarios. Figure 13: Financial analysis; comparison of the Green Growth and BAU scenario (undiscounted net benefits)
29 I.e., we are assuming a market failure in terms of asymmetric or imperfect information; see also footnote 25.
(300)
(250)
(200)
(150)
(100)
(50)
-
50
100
150
2014 2024 2034 2044 2054 2064 2074
$ m
illi
on
Green growth scenario: Ecosystem Restoration (Financial)
Baseline scenario: Palm oil/timber plantations (Financial)
CO2 revenue Harvest revenue
Capital outlays (e.g. planting costs)
Sustainable logging

46
Business As Usual
There are 2-3 core activities under the BAU scenario:
Palm oil plantations
Selective Logging
Selective Logging followed by Industrial Timber Plantations (HTI). In the case of palm oil, it is assumed that the 24,428 ha due for conversion are already degraded and ready for planting (in line with the existing condition of the Katingan area30). The key cost items are therefore land preparation and planting costs of around USD 9,006/ha over a 25-year harvest cycle, and operational costs of USD 315 – 1,565/ha depending on the stage in the harvest cycle31. Corporation tax is applied to all net revenues at 25% (net of opex and depreciation and assuming no tax carry forward). Figure 14: Assumed Palm Oil Yield Curve (years since planting)
On the revenue side, the scope of analysis is focused on the plantation only, not the (downstream) Crude Palm Oil mills. The relevant revenue stream relates to Fresh Fruit Bunches therefore, valued at USD 150/tonne32. We assumed a maximum yield of 29 tonnes/ha of FFB distributed over the lifetime of a harvest as per Figure 14; this is best-in-class in Indonesia and flatters the BAU value,
which is conservative for the purposes of demonstrating the value of the Green Growth Scenario33.
We assumed that the 25-year harvest cycle repeats itself indefinitely in the financial analysis (i.e., the investor does not factor in likely subsidence and flooding into their financial decisions). At the end of the last year of analysis (2074), a Terminal Value was assigned to the land. This is equal to a perpetuity of the average annual income stream over a 25-year harvest cycle, and pre-discounting is worth around USD 973 thousand.
In total, the NPV of the 24,428 ha used for Palm Oil could be expected to return around USD 15.1 million to investors; equivalent to an Internal Rate of Return of 10.6%. The time profile is illustrated below (excluding Terminal Value).
30 18,400 hectares at the project site are already non-forested (e.g. grasslands, croplands 31 Source: Bogor Agricultural University (2010). Establishment costs are uprated by 33% to account for the difficulty of operating on peatland (Source: World AgroForestry Centre). 32 Source: Bappeda, East Kalimantan (2010) 33 Source: Bogor Agricultural University (2010). Yield curve from PPKS, Medan (1997).
0%
20%
40%
60%
80%
100%
1 3 5 7 9 11 13 15 17 19 21 23 25

47
Figure 15: Palm Oil Financial Costs and Benefits
In the case of timber, it is assumed that the 179,142 hectares is divided into two areas. The first is selectively logged and abandoned. The second is also logged and then HTI plantations established for pulpwood production.
Drawing from two studies, we assume a logging cost per cubic meter of around USD 51, which includes harvest planning, pre- and post-harvest operations, infrastructure construction and maintenance, harvesting itself, administration and taxes34. We note that the cost in Katingan is likely to be slightly higher for infrastructure construction as canals are more expensive per km to construct than roads. We therefore include this assumption in our sensitivity analysis in the next section.
On the revenue side, a gross yield of 31.7 m3/ha is assumed. Since the site covers a large area and does not have substantial existing access routes, it is assumed that the logging of the entire 179,142 ha takes 10 years. The primary product, Mixed Tropical Hardwood (MTHW), is priced at the sawmill gate in Kalimantan at USD 104/m3, which corresponds to the cost of production based on the surveys mentioned above, including a 15% profit margin.
As mentioned above, after 10 years of logging, it is assumed that 50% of the land becomes HTI Industrial Timber Concessions. Each block of land is prepared and planted as soon as it is selectively logged, so there is a rotating HTI harvest schedule.
The capital outlays are around $1,200/ha including further land clearance, and result in net revenues of $25/m3 after a 10-year planting and harvesting cycle35. The yields, assumed for Acacia crassicarpa species, are assumed to be 100 m3/ha per growth cycle36.
34 Sources: World Bank / URS Forestry (2002), Association of Indonesian Concession Holders (APHI) (2003). Their respective estimates of $85.47/m3 and $83.27/m3 at the sawmill gate were uprated by US CPI inflation to $104/m3, and then split into pure production cost of 85% and profit margin of 15%. 35 Standard block sizes are likely not to exceed 10,000 ha and take around a year to clear, but given existing degradation and economies of scale from working on a large site we assume 180,000 ha would take around 10 years to clear and plant. 36 Source for costs and yields: International Finance Corporation, Developing a Sustainable Plantation Wood Supply through successful community-company partnerships in Indonesia
$-
$50
$100
$150
$200
$250
$3002
01
42
01
62
01
82
02
02
02
22
02
42
02
62
02
82
03
02
03
22
03
42
03
62
03
82
04
02
04
22
04
42
04
62
04
82
05
02
05
22
05
42
05
62
05
82
06
02
06
22
06
42
06
62
06
82
07
02
07
22
07
4
Mil
lio
n U
SD
Total Costs Total Benefits
25-year harvest cycle
Capital outlays

48
We assumed that the 10-year harvest cycle repeats itself indefinitely in the financial analysis (i.e., the investor does not factor in likely subsidence and flooding into their financial decisions). At the end of the last year of analysis (2074), a Terminal Value was assigned to the land. This is equal to a perpetuity of the average annual income stream (net of costs) over a 10-year harvest cycle, and pre-discounting is worth around USD 632 thousand. The NPV of the 89,571 ha selectively logged and abandoned is around USD 84 million. The NPV of the 89,571 ha selectively logged and then becoming HTI Plantations is around USD 83 million. In total therefore, the NPV of the 179,142 ha used for logging and HTI could be expected to return around USD 167 million to investors. It is not possible to derive an Internal Rate of Return for this profit due to the timing of costs and revenues. The time profile is illustrated below (excluding Terminal Value). Figure 16: Logging/Timber Plantation Financial Costs and Benefits
$-
$10
$20
$30
$40
$50
$60
$70
$80
$90
$100
20
14
20
16
20
18
20
20
20
22
20
24
20
26
20
28
20
30
20
32
20
34
20
36
20
38
20
40
20
42
20
44
20
46
20
48
20
50
20
52
20
54
20
56
20
58
20
60
20
62
20
64
20
66
20
68
20
70
20
72
20
74
Mil
lio
n U
SD
Financial Costs Financial Benefits
Initial logging period
10-year harvest cycles Planting costs

49
Green Growth Scenario (PT RMU Ecosystem Restoration Concession)
In the Green Growth scenario, the financial costs relate directly to the core activities described in Chapter 2, including ecosystem restoration, forest resources conservation, research and development, livelihood development, and community resilience.
Cost items corresponding to these activities were sourced directly from PT RMU and include:
REDD+ Development
Ecosystem Restoration
Protection and Enforcement
Training, Research and Development
Community Development
Sales and Marketing
General Administration
Government Fees
Corporation Tax
Marketing commission
Selling commission
These items total around $1.9 million in start-up capital costs and result in average operational costs of $9 million a year until 2037 (excluding corporation tax and commission on credit sales), when the ecosystem restoration is complete.
On the revenue side, we have used PT RMU’s worst case carbon price scenario given current market conditions. In this scenario, the assumed market price for VCS REDD+ credits is $2/tCO2 in the short term, $5/tCO2 in the medium-term and $8/tCO2 from 2022 (average $6.9/tCO2).
Actual carbon emissions reductions were estimated using IPCC factors for palm oil and timber plantations, and logging. The specific factors used (including the 95% confidence interval) are provided in Table 7, and the headline result of applying these emissions factors to our scenario is 232.8 MtCO2 over 25 years. We note that this range is quite uncertain and have therefore conducted sensitivity analysis on the carbon factors using the IPCC’s high and low range. The range, 174.7 – 292.3 MtCO2, can be seen in Figure 19 below.
This is relatively conservative compared to an earlier approximate range of 141 – 170 MtCO2 which excluded peat soil emissions, the largest single source, using the datasets presented in Figure 17 and Figure 18 (although this was over a slightly larger area of 225,000 hectares, and excluded above-ground biomass carbon storage during plantation operations)37. This number also excluded non-carbon Green House Gases; yet substantial methane emissions have been noted from organic matter decomposition in the canals.
37 The previous calculation was explained as follows in the Project Design Document: The carbon stocks are estimated using the Intergovernmental Panel on Climate Change (IPCC) Good Practice Guidance Tier-1 approach for national greenhouse gas inventory (IPCC 2006, Gibbs et al. 2007). Biomass carbon stocks were also estimated using an updated map for Southeast Asia that was based on forest inventory data. The calculation is based on empirical–statistical methods which rely on rule based models of climate, soils, topographic, population and land-use information to spatially extrapolate forest inventory data to map forest carbon stocks in the 1980s (Brown et al 1993). [The figures] below show forest stratum and biomass carbon stocks in the Katingan Conservation site and surrounding regions. Both methods relied on the widely accepted Global Land Cover 2000 map of vegetation. Thus, forest location and description represent conditions circa 2000 and may have changed in recent years

50
Figure 17: Land cover map of the Katingan Conservation Area and surrounding region
Figure 18: Map of forest biomass carbon stocks in the Katingan Conservation Area
Note: Map is from the Global Land Cover database (GLC 2000) created from SPOT-VEGETATION satellite imagery for the year 2000
Note: Forest biomass was estimated using the IPCC GPG Tier-1 approach for greenhouse gas inventories and applied to the GLC 2000 land cover map
In the absence of verified emissions reductions under the VCS standard (the project is still in the validation phase under VCM0007 methodology), we have assumed that 70% of the IPCC-estimated emissions reductions are marketable. This reflects a conservative insurance, risk and leakage buffer of 30%. We have also restricted carbon sales for the first five years to 2 MtCO2/year based on the PT RMU project team’s expectations of likely market demand. Figure 19: Estimated actual - and assumed marketable - emissions reductions over 25 years
It is assumed that after the 35-year Ecosystem Restoration is complete, the land would be suitable for low-intensity sustainable logging, and therefore sold for $398/ha38. We note that this is not in the current business plan or financial model for PT RMU but is a plausible use of the land after project completion, which also retains the economic and environmental value.
38 Source: World Agroforestry Centre, Carbon Emissions from LULUCF in Berau District, East Kalimantan, Indonesia (2010). Value for low-intensity logging.
-
50
100
150
200
250
300
350
Low Medium High
Me
ga
ton
ne
s C
O2
Estimated Actual ERs (as perIPCC)
Marketable ERs (Estimatedless 30% buffer and reducedsales in early years)

51
In total, the NPV of the 203,570 ha used for Ecosystem Restoration could be expected to return around USD 139 million to investor39 with the Internal Rate of Return of 116%. This IRR is a misleading statistic though as:
It is based on an artificially small capital investment mainly related to license acquisition. Moreover, many wider, non-core, ERC activities such as CSR are not in the scope of analysis.
It represents the total returns before benefits distribution (to government and local communities; see discussion on page 70)
Operational costs have escalated since project design and are not reflected in the calculations
Even the ‘worst case’ carbon price and volume assumption can be considered optimistic in the short-term (when discounted impacts are highest) given current market conditions.
The realistic returns are therefore likely to be lower. The time profile is illustrated below (excluding Terminal Value). Figure 20: PT RMU Ecosystem Restoration Concession Financial Costs and Benefits
39 We note that these estimates deviate from the PT RMU Project Team’s Financial Projection based on the same CO2 quantities and prices (NPV of $178m). This is due to differing treatment of taxes, timing of cash flows, a differing cost of capital (13.1% weighted), and the assumption of financial activity after the project life cycle has finished.
$-
$10
$20
$30
$40
$50
$60
$70
20
14
20
16
20
18
20
20
20
22
20
24
20
26
20
28
20
30
20
32
20
34
20
36
20
38
20
40
20
42
20
44
20
46
20
48
20
50
20
52
20
54
20
56
20
58
20
60
20
62
20
64
20
66
20
68
20
70
20
72
20
74
Mil
lio
n U
SD
Financial Costs Financial Benefits
Revenue from VCS credit sales at $2-8/tCO2
Net revenue from low intensity logging

52
Results: Extended Cost Benefit Analysis
The eCBA extends the financial analysis to account for externalities and other market failures, expressing all costs and benefits in terms of shadow prices. This section will explain the eCBA of the BAU scenario activities and Katingan Restoration and Conservation activities. There are three assumptions running through the eCBA analysis:
The social discount rate used to generate Net Present Values is 5% (in real terms)
Cash costs that are social transfers (i.e., taxes) are excluded from the analysis
Market wages provide a reasonable proxy for the opportunity cost of labor in Central Kalimantan
The overall time profile of the extended costs and benefits is presented in Figure 21 below. Overall the Green Growth scenario generates USD 9.5 billion more value when discounted at 5%. However, the result is strongly dependent on the Social Cost of Carbon. A carbon price of at least $2.48 is the ‘tipping point’ required for the Green Growth scenario to equate to the social value of the BAU scenario. We discuss this further on page 56. Figure 21: eCBA analysis; comparison of the Green Growth and BAU scenario (undiscounted net benefits)
We also note here that the change in discount rate from 10% to 5%, which would normally be expected to favor good environmental management over hurried resource extraction, has offsetting effects:
Since the CO2 emissions are front-loaded, decreasing the discount rate favors the BAU scenario
Since the Terminal Values of the BAU scenario are low as the land is heavily degraded, decreasing the discount rate favors the Green Growth scenario
As the flooding impacts increase over time in the BAU scenario, decreasing the discount rate favors the Green Growth scenario
Overall, a lower discount rate (i.e., taking a longer-term view of investment returns) does not favor the Green Growth scenario as the carbon benefits ‘accrue’ in the first 25 years. On the following pages we explain in detail the scope, assumptions and data sources used to calculate the costs and benefits for Business As Usual and Green Growth.
(400)
(200)
-
200
400
600
800
1,000
2014 2024 2034 2044 2054 2064 2074
Green growth scenario: Ecosystem Restoration (eCBA)
Baseline scenario: Palm oil/timber plantations (eCBA)
Mill
ion
USD

53
Business As Usual scenario
Internationally, it is well-recognized that agricultural and similar activities that require peat soil drainage will lead to soil subsidence and hydrological disruption40. Emerging scientific evidence is demonstrating that South East Asia is no exception. Depending on the peat depth, gradient and elevation, subsidence associated with these activities can result in serious flooding and ultimately loss of gravity drainage. At this point, the affected land is effectively useless for agriculture or timber. Furthermore, again depending on specific watershed characteristics, equivalent impacts are likely to be felt on the landscape within the adjacent and downstream watershed.
For our analysis, we have drawn data from one particular study that quantified these effects based on sampling in Kalimantan and Sumatera41. We are aware of other (unpublished) results that corroborate these findings. And, as mentioned there exists a base of international evidence highlighting this phenomenon. We have reproduced the key findings of this study below as it is central to proving the hypothesis and driving the results.
In short, within 50 years, 70% of the land studies suffered from serious drainage problems and on 28% of the land, gravity drainage had failed completely. In other words, the land was inundated. Taking an average of these figures as the point at which the land is unproductive, we assume 49% of the land yields zero output within 50 years.
Table 11: Subsidence characteristics of peat land in Kalimantan and Sumatera
After 25 years
After 50 years
After 100 years
Result A: Trend in start of serious drainage problems (% peat surface below Drainage Base)
49% 70% 92%
Result B: Trend in end of gravity drainage (peat surface potentially at MSL)
12% 28% 54%
Value used in this analysis as % land that would have zero-productivity after year x
= Average (A + B)
31% 49% 72%
Source: Hooijer et al (2012)
It is assumed that land owners notice deteriorating revenue performance and so stop maintaining the affected land. However, the capex is already sunk by this point, and hence average profitability is dragged down over time. This negative externality is valued at around 23% of net Timber revenue and 13% of net Palm Oil revenue by 2050. We note that this is based on a relatively small land area, contained within Mentaya and Katingan Rivers, and the ocean on the South Coast. This hydrological negative multiplier would likely be significantly larger in a more upstream location. This also affects the Terminal Value of the land in perpetuity; unproductive land bequeathed to the next generation is worth less than natural and well-maintained forest.
40 See commentary and references in Chapter 1
41 Hooijer et al (2012), Subsidence in drained coastal peatlands in SE Asia: implications for sustainability. The sample characteristics were: 11.5km average cross-section length from river, 7.5m average peat depth, 88% of peat depth above 3m, 72% of the peat bottom was below Mean Sea Level, 98% was below high water level and 99% was below drainage base.

54
Figure 22: eCBA Costs and Benefits for Palm Oil Plantations
Figure 23: eCBA Costs and Benefits for HTI Timber Plantations
At the same time, we assume that the surrounding agricultural land adjacent to, and downstream from, the project zone area (approximately 200,000 ha42), which will be at the lowest elevation in the peat dome, is equally prone to flooding. The base value of this land is based on use for agriculture, at $3,424/ha43. This can be seen in Figure 23 as a rising external cost. As discussed in Chapter 3, we make a 23% upwards adjustment to the FFB price (to $185/tonne) to account for market dominance on the buy-side. This has the rather perverse effect from an environmentalist’s perspective of significantly enhancing the eCBA valuation of Palm Oil land despite the hydrology costs discussed. Nevertheless, it also suggests a genuine feature of the economy, which is that market concentration may be artificially holding down Palm Oil production and reducing the rate of land degradation.
42 Source: Approximate calculation based on distance calculator on htpp://maps.google.com 43 Source: Source: World Agroforestry Centre, Carbon Emissions from LULUCF in Berau District, East Kalimantan, Indonesia (2010). Value for palm oil.
$-
$50
$100
$150
$200
$250
$300
20
14
20
16
20
18
20
20
20
22
20
24
20
26
20
28
20
30
20
32
20
34
20
36
20
38
20
40
20
42
20
44
20
46
20
48
20
50
20
52
20
54
20
56
20
58
20
60
20
62
20
64
20
66
20
68
20
70
20
72
20
74
Mil
lio
n U
SD
Total Costs Total Benefits
Declining yields as peatland floods
$-
$10
$20
$30
$40
$50
$60
$70
$80
$90
20
14
20
16
20
18
20
20
20
22
20
24
20
26
20
28
20
30
20
32
20
34
20
36
20
38
20
40
20
42
20
44
20
46
20
48
20
50
20
52
20
54
20
56
20
58
20
60
20
62
20
64
20
66
20
68
20
70
20
72
20
74
Mil
lio
n U
SD
Total Costs Total Benefits
Increasing costs on watershed agriculture Declining yields as peatland
floods

55
Lastly, we also adjust costs downwards to exclude national corporation tax, concession fees and local taxes, which all represent transfers to government, not a resource cost.
Green Growth Scenario (PT RMU Ecosystem Restoration Concession)
On the other hand, the value adjustments to the Green Growth scenario are all positive when viewed from a wider perspective. The natural capital including soil, vegetation and timber, and supporting hydrology, generate key and sustained benefits for local communities.
Firstly, many local communities rely directly on the forest for their livelihoods and well-being.
Traditional farming is common, mainly swidden cultivation and small-scale group farming. This typically revolves around vegetable cultivation including cassava, chili, cucumbers, eggplants, long beans, galingale and lemongrass. They are generally consumed or sold locally to neighbouring villages. Non-Timber Forest Products are also significant for trading and local use, including gemor bark, jelutung sap, wild honey, mushroom, kalakai leaf, plant roots, pasak bumi and akar tampelas. They are used for food, incense and medicinal purposes. Lastly, fishing is particularly important to communities living in Katingan district, especially in the dry season when fish are concentrated. Fish are not only a source of protein but provide an income of IDR 20,000 – 50,000 a day for the average person.44
Secondly, the land may provide indirect benefits such as clean drinking water, and carry socio-cultural significance.
Thirdly, the site is rich in biodiversity even after some degradation. Preliminary field surveys identified 68 mammal, 159 bird, 44 reptile, 7 amphibian, 110 fish and 204 floral species in the concession area. In particular, the Project Design Document outlines how conservation of the existing biodiversity and selected restoration activities will bring about positive impacts on High Conversation Value and floral species including S. balangeran and D. lowii/polyphylla, C. rotundatus, Orangutans, Gibbons and Proboscis monkeys.
To value these three benefit streams, we drew on a study by the Ministry of Environment (KLH) in the neighboring national park (Sebangau National Park) with very similar topography and conditions45. Rebasing the values in this study to be consistent with the assumptions used elsewhere in this analysis, we estimate the PT RMU project zone would generate around USD 6.6 million in annual benefits. The majority of these can be expected to accrue directly to local communities.
To this number we added an intangible biodiversity value of $27/ha/yr46. In line with the author’s assumptions, we also assumed that this covers the tourism aspect of the project, since biodiversity is the main draw for tourism spending in the area.
The project team note that the KLH valuations are broadly in line with other local studies47. But, they are significantly lower than community-based land valuations conducted by the Central Kalimantan Peatlands Project. In fact they are ten-fold lower if applied to the population in the project zone. If correct, this is a significant result since it would mean the Green Growth case does not rest on CO2 valuation alone but instead on local community and environmental benefits. We discuss this further in the sensitivity analysis.
44 Source: Project Design Document 45 Peraturan menteri negara lingkungan hidup republik indonesia, Nomor 14 tahun 2012Tentang, Panduan valuasi ekonomi ekosistem gambut 46 WWF Heart of Borneo (2012), Investing in Nature for a Green Economy 47 Including the KLH National Ecosystem Valuation Guide and the assumptions used in the WWF Heart of Borneo (2012) study

56
The natural capital also generates benefits at global scale. As was discussed in the previous section, below- and above- ground carbon is significant. Preserving and restoring the ecosystem avoids 224 MtCO2 of GHG emissions (see page 50). The true value of this carbon is not its market price, but its impact in mitigating climate change. This valuation relies on modelling future economic impacts of climate change and so is inherently uncertain. A range of estimates from the literature is outlined below.
Table 12: Estimates for the Global Social Cost of Carbon
Source Value Unit Comments
Tol (2009)48 78 USD (2013)/tCO2
Mean, peer-reviewed, recent studies, for PRTP = 0% (implies social discount rate of 3-5%)
United States EPA (2013)49
15 USD (2011)/tCO2
Discount rate of 5%, 2015 emissions
United States EPA (2013)
39 USD (2011)/tCO2
Discount rate of 3%, 2015 emissions
Stern (2006)50 85 USD (2000)/tCO2
PRTP = 0.1%
We have taken Tol’s estimate based on the assumptions listed as it is based on a large sample of
literature51. Since this assumption is inherently uncertain, and also hugely influential as a driver of the value of green growth we have presented the ‘tipping point’ of the Social Cost of Carbon ($2.48/tCO2) in our key results alongside the headline result driven by $80/tCO2.
The tipping point is the point at which the social value of the Green Growth scenario is equal to the Business As Usual Scenario. The SCC would have to be below $2.48/tCO2 for our policy prescriptions to be invalid. Figure 24: eCBA Costs and Benefits for PT RMU project
48 Tol (2009), The Economic Effects of Climate Change, Journal of Economic Perspectives (2009). 49 Interagency Working Group on Social Cost of Carbon, United States Government (2013) Technical Support Document: Technical Update of the Social Cost of Carbon for Regulatory Impact Analysis 50 The Stern Review (2006) The Economics of Climate Change 51 This assumes a 0% Pure Rate of Time Preference, which given Indonesia’s economic growth rate is broadly consistent with a Social Discount Rate of 5%. We have adjusted the source estimates for inflation and the rising stock of CO2 in the atmosphere since publication.
$-
$100
$200
$300
$400
$500
$600
$700
$800
$900
20
14
20
17
20
20
20
23
20
26
20
29
20
32
20
35
20
38
20
41
20
44
20
47
20
50
20
53
20
56
20
59
20
62
20
65
20
68
20
71
20
74
Mil
lio
n U
SD
Total Costs Total Benefits

57
Sensitivity Analysis In this section, we test the sensitivity of the results to variations in the underlying assumptions, including costs, quantities, prices and discount rates. In one case (ecosystem valuation), we use another data source entirely to illustrate the potential range.
All input values are flexed by ±25%, and a number of additional assumptions are also flexed by a custom amount if there are grounds for believing the uncertainty is likely greater than 25% (e.g. CO2 volumes and prices). Table 13 lists the variables which are flexed, and by how much.
Table 13: Variation of input variables in sensitivity analysis (financial)
Base Case Value Unit Low % High %
Business As Usual
WACC 10.0 % 7.5 -25% 12.5 +25%
Area used for Palm Oil 12.0 % 9.0 -25% 15.0 +25%
Area used for Logging/HTI 44.0 % 33.0 -25% 55.0 +25%
Gross MTHW Timber Yield 31.7 m3/ha/
harvest 23.8 -25% 39.6 +25%
MTHW Price at Sawmill Gate 104.0 $/m3 78.0 -25% 130.0 +25%
HTI Net Revenue 25.0 $/m3 18.8 -25% 31.3 +25%
Max Palm Oil Yield 29.0 t/ha 21.8 -25% 36.3 +25%
Opex 1,564.9 $/ha 1,173.7 -25% 1,956.1 +25%
FFB Price 150.0 $/tonne 112.5 -25% 187.5 +25%
Green Growth
WACC 10.0 % 7.5 -25% 12.5 +25%
Total carbon sold 133.9 MtCO2 102.9 -23% 155.7 +16%
Average carbon credit price 6.9 $/tCO2 5.2 -25% 8.7 +25%
NPV of Low Intensity Logging land
398.0 $/ha 298.5 -25% 497.5 +25%

58
Table 14: Variation of input variables in sensitivity analysis (eCBA)
Base Case Value Unit Low % High %
Social Discount Rate 5.0 % 3.8 -25% 6.3 +25%
Business As Usual
Area used for Palm Oil 12.0 % 9.0 -25% 15.0 +25%
Area used for Logging/HTI 44.0 % 33.0 -25% 50.0 +13.6%
Gross MTHW Timber Yield 31.7 m3/ha/
harvest 23.8 -25% 39.6 +25%
MTHW Price at Sawmill Gate 104.0 $/m3 78.0 -25% 130.0 +25%
HTI Net Revenue 25.0 $/m3 18.8 -25% 31.3 +25%
Max Palm Oil Yield 29.0 t/ha 21.8 -25% 36.3 +25%
Shadow FFB Price 150.0 $/tonne 112.5 -25% 187.5 +25%
Trend in start of serious drainage problems / end of gravity drainage (Year 50)
49.0 % 36.8 -25%
61.3 +25%
% surrounding watershed that is agricultural land
90.0 % 67.5 -25% 100 +11.1%
NPV of agricultural land 3,424.0 $/ha 2,568.0 -25% 4280.0 +25%
Green Growth
Total carbon storage and sequestration 223.5 MtCO2 167.7 -25% 266.6 +19%
Social Cost of Carbon 80.0 $/tCO2 60.0 -25% 100.0 +25%
Ecosystem Valuation 59.3 $/ha/yr 44.5 -25% 302.0 +409.6%
NPV of Low Intensity Logging land 398.0 $/ha 298.5 -25% 497.5 +25%

59
Figure 25: Variation in results (financial)
Figure 26: Variation in results (eCBA)
There are three findings in particular that stand out in the above results:
Commodity revenues matter: The results are sensitive to the amount and value of pulpwood and palm oil produced per hectare of land, both in terms of financial and eCBA results. Given the volatility in the year-to-year spot prices of these commodities (see Figure 27 below), this suggests that the risk-adjusted returns for the BAU scenario would be significantly lower.
-100% -80% -60% -40% -20% 0% 20% 40% 60% 80% 100%
WACC
Area used for Palm Oil
Area used for Logging/HTI
Gross MTHW Timber Yield
MTHW Price at Sawmill Gate
HTI Net Revenue
Max Palm oil Yield
Opex
FFB Price
WACC
Total carbon sequestration
Average carbon credit price
NPV of Low Intensity Logging Land
Bu
sin
ess
as u
sual
Gre
en g
row
th
Low High
-100%-80% -60% -40% -20% 0% 20% 40% 60% 80% 100%
Social Discount Rate
Area used for Palm Oil
Area used for Logging/HTI
Gross MTHW Timber Yield
MTHW Price at Sawmill Gate
HTI Net Revenue
Max Palm oil Yield
FFB Price
Serious drainage problem
% Surrounding watershed that is agricultural land
NPV of agricultural land
Social Discount Rate
Total carbon sequestration
Social cost of carbon
Ecosystem Valuation
NPV of Low Intensity Logging Land
Bu
sin
ess
as u
sual
Gre
engr
ow
th
Low High

60
Figure 27: Palm Oil and Timber international price trends 2009-2014
Hard Logs, Best quality Malaysian meranti, import price Japan Palm oil, Malaysia Palm Oil Futures (first contract forward) 4-5 percent FFA Source: Indexmundi.com
‘Business As Usual’ can take many forms: In our analysis, whether the land is used for Palm Oil or HTI Plantations has a significant impact. Site-by-site consideration of the counterfactual is important therefore, and ERC projects should focus on areas where opportunity costs are likely to be low.
Carbon storage/sequestration projects are more sensitive to revenues than costs: The value of the project investment fluctuates practically one-for-one with the carbon volumes and price. A market fall in the carbon price of 50% therefore reduces investor returns by at least 50%. We discuss uncertainty in price in the next section, although note here that reducing the uncertainty associated with carbon storage and sequestration methodologies will be important to reduce the risk perception of ERC-REDD+ projects.
The scope and methodology for ecosystem valuations matter: Taking an alternative source based on Willingness To Pay estimates from local communities, which are broader and more intangible, boosts the overall eCBA NPV of the RMU scenario by more than 70% and eliminates the overall reliance on CO2 to drive the headline conclusion that ecosystem restoration provides greater social returns than Business As Usual. This is particularly important given uncertainty in the ecosystem valuation.
Below, we have outlined a range of values for different non-carbon ecosystem services - Inland Wetlands, Coastal Wetlands and Tropical Forest - in Malaysia and Indonesia52. The full details of the studies from which we have drawn can be found in Appendix C. As can be seen, adding together the different ecosystem services gives something in the range of $100-200/ha/yr, ignoring hydrology effects and raw materials, which are already accounted for elsewhere in our analysis.
These studies are useful reference points, especially as some cover conditions similar to the Central Kalimantan peatbelt such as Malaysian Borneo, and do suggest that the ecosystem valuations from Sebangau National Park are on the low side. However, the data published by
52 Source: UN TEEB Database
0
50
100
150
200
250
300
350
400
450
500
0
200
400
600
800
1000
1200
1400
Au
g-0
9
Dec
-09
Ap
r-1
0
Au
g-1
0
Dec
-10
Ap
r-1
1
Au
g-1
1
Dec
-11
Ap
r-1
2
Au
g-1
2
Dec
-12
Ap
r-1
3
Au
g-1
3
Dec
-13
Ap
r-1
4
Au
g-1
4
US
D/
m3
US
D/
ton
ne
Palm Oil (LHS) Hard Logs (RHS)

61
KLH is extremely site-specific and furthermore is official government data. Since ultimately one of the objectives of the eCBA analysis is to embed Green Growth Assessment within government decision making, it is important to use data that government itself has generated.
Figure 28: Ecosystem service valuations
Source: The Economics of Ecosystems and Biodiversity
020406080
100120140160180
Po
llin
atio
n o
f cr
op
s
Raw
mat
eria
ls
To
uri
sm
Fis
h
Fo
od
Bio
div
ersi
ty p
rote
ctio
n
Bio
pro
spec
tin
g
Raw
mat
eria
ls
Rec
reat
ion
To
uri
sm
Was
te t
reat
men
t
Wat
er
Wat
er r
egu
lati
on
Indonesia Malaysia
US
D (
20
13
)/h
a/
yr

62
6 Policy implications
Key Messages
To encourage uptake of ERC projects by the private sector, green growth policy will be needed. This should be targeted at the three key stakeholder groups and incentivize each of them.
1. Policy for Investors: To address regulatory issues, mitigate business risks and improve financial performance it will be necessary to streamline licensing procedures and defer their cost, support demonstration projects, guarantee carbon prices, provide low-cost funding, and insure or fund monitoring costs.
2. Policy for Government: To make the best zoning decisions and mitigate fiscal opportunity costs for districts, it will be necessary to enhance land use governance, provide fiscal compensation through inter-governmental transfers and embed green growth tools within planning and project appraisal processes.
3. Policy for Communities: To avoid strained relations between project developers, government and local communities, it will be necessary for communities to have an adequate stake in project benefits and a clear voice in governance processes.
Introduction
The results of the eCBA show that, measured in terms of wider social, economic and environmental costs and benefits, sustainable management of peat land has huge value for Indonesia (and the international community through climate change mitigation).
Yet, the results also show that, in the absence of green growth policy, peatland has limited financial value if left standing. This latter fact is perhaps reflected in historical rates of deforestation on peat land.
A recent study confirmed that Indonesia has experienced the highest deforestation rate in the world over the past 12 years. The study found that between 2000 and 2003 the rate of deforestation in Indonesia was about one million hectares per year. In the years 2011 and 2012, the rate doubled to about two million hectares per year, despite a moratorium on deforestation53.
The moratorium prevents the issuance of new licenses but does not actually prevent deforestation resulting from the conversion of existing licenses. Further, the moratorium only covers around 14.5 million ha54. Recalling that most of Indonesia’s forests fall under production forest areas (covering a surface area of over 76.6 million ha), potential for deforestation remains high. Between 2012 and 2013, 618 licenses have been issued to convert production forest into plantation or agriculture businesses, allowing for the conversion of close to 6 million ha into plantation, agriculture, and forest concessions55. It is therefore likely that under Business As Usual continued degradation of peat swamp and other socially-valuable forest will continue.
In order to curb this degradation and deforestation in production forests, the Ministry of Forestry developed an Ecosystem Restoration Concession (ERC or UUHHK-RE) legal framework. ERC
53 Margono et al (2014) Primary Forest Cover Loss in Indonesia over 2000-2012 Nature Climate Change 54 This does not include over 57 million of pre-existing protected areas (data dan informasi pemanfaatan hutan tahun 2012) 55 Data Dan Informasi Ditjen Planologi Kehutanan Tahun 2013, Table Ii.7, Perkembangan Perubahan Peruntukan Kawasan Hutan Produksi Yang Dapat Di Konversi Untuk Pertanian/Perkebunan Tahap Sk Pelepasan 2013

63
licenses are aimed at private companies willing to invest in ecosystem restoration and conservation, to return degraded or damaged production forests to their biological equilibrium.
The first ERC license was issued in 2008 to a 98,000 ha concession in Jambi, to Burung Indonesia and the BirdLife International Consortium, through PT REKI. Since this first license was issued, strong interest in ERC has been witnessed; as of March 2012, the Ministry of Forestry had received 44 applications from private companies to develop ER Concessions56, totalling more than 4 million ha. In spite of such interest, only 7 licenses had been issued by the end of 2012, for a total of around 270,000 ha57. This compares to the Ministry of Forestry target of 2.5 million hectares of natural forest and ecosystem restoration on formerly logged areas by 201458.
No Name Province Areas (Ha)
1 PT. Restorasi Ekosistem Indonesia (2007) South Sumatra 52,170
2 PT. Restorasi Ekosistem Indonesia (2010) Jambi 46,385
3 PT. Restorasi Habitat Orangutan Indonesia (2010) East Kalimantan 86,450
4 PT. Ekosistem Khatulistiwa Lestari (2011) West Kalimantan 14,080
5 PT. Gemilang Cipta Nusantara (2011) Riau 20,265
6 PT. Rimba Raya Conservation (2013) Middle Borneo 36,331
7 PT Sipef Biodiversity Indonesia (2013) Bengkulu 12,672
8 PT Rimba Makmur Utama (2013) Central Kalimantan 108,255
9 PT. Gemilang Cipta Nusantara (2013) Riau 20,450
10 PT . Karawang Ekawana Nugraha South Sumetera 8,265
11 PT . Sinar Mutiara Nusantara Riau 37,100
12 PT . Global Alam Nusantara Riau 36,850
Total 480,093
Source: Burung Indonesia
Why has progress been slow? As the results in the previous section show, the business case for ERC is less persuasive to private investors than extracting natural capital through Palm Oil plantations and logging/pulpwood plantations. Furthermore, wider experience suggest that the business environment for ERC is far from friendly; regulatory risks, a lack of government co-ordination at national and local level, and a lack of government support in the policy and planning regime are all issues for potential investors.
As is discussed later in this section, a multi-pronged policy response is necessary to realize the true benefits of ERC including:
Addressing regulatory issues
Reducing business and financial risks
56 Thomas A. Walsh, Yoppy Hidayanto, Asmui and Agus Budi Utomo (2013) Ecosystem restoration in Indonesia’s production forests: towards financial feasibility 57 Keynote speech on International Seminar on Ecosystem Restoration in the Tropics: Lesson learned and Best Practice IPB, 28 November 2013. Note there is also a related type of license, Izin Usaha Pemanfaatan Jasa Konsultasi Penyerapan & Penyimpanan Karbon (IUPJLPP: Business License on Utilization of Consulting Services and Carbon Absorption and Sequestration 58
http://www.dephut.go.id/index.php/news/details/6557
Table 15: Seven ERC Licenses in Indonesia

64
Improving financial performance
Improving land use governance
Incentivizing local government to support ERC
Integrating analysis of extended costs and benefits into the planning process
Encouraging community participation and benefit sharing
Green Growth Policy for Business
Addressing regulatory issues
Based on the experience of the existing companies that have received an ERC license, the process took from 14 to 36 months. By the end of 2012, six ERC applications submitted in 2009 had yet to be finalized59. Unnecessary delays in processing licenses will contribute to higher costs since these delays may limit opportunities to secure long-term financing for the concessions. They also send a poor signal to the investment community.
Licensing delays, during which land remains an unlicensed and unproductive ‘no man’s land’, also increase the risk of encroachment and illegal exploitation of forest resources. In other words, unless forest resources are being legally used, they can be illegally exploited. Besides putting forest cover and ecosystems at risk, it will also increase restoration costs and costs to resolve social conflicts resulting from encroachment, which will also hinder the ERC holder’s ability to secure funding.
However, consultation with key stakeholders60 has suggested that political commitment and support could greatly contribute to ease the process and drastically reduce licensing delays.
The Public Private Partnership approach provides one model. Indeed, several of the ERC project characteristics are similar to the PPP model:
Very long project cycles ( more than 20-30 years)
Private sector bears the design, ‘construction’ and operational performance risk
It is very difficult for the private sector to also bear the ‘usage’ risk (i.e. revenue uncertainty from carbon prices) and borrow debt. Without some guarantee from the public sector this project is not bankable and thus dependent on equity or donor support
The sponsors set up a company dedicated to the project (not quite a Special Purpose Vehicle but similar idea)
The concept of Life Cycle Cost and Value for Money to the public sector is prominent (including hidden costs)
In practice, the use of a formal PPP structure will be difficult and probably unnecessary. Firstly, forestry/conservation is not a priority sector as defined by Presidential Regulation 67/2005 and 13/2010 (airport, ports, roads etc.). Secondly, the capital needs are not comparable to typical PPP projects either in absolute terms (USD billion) or relative to revenue. Thirdly, currently regulation
59 Thomas A. Walsh, Yoppy Hidayanto, Asmui and Agus Budi Utomo , 2013, Ecosystem restoration in Indonesia’s production forests: towards financial feasibility 60 Stakehodlers in two of the seven ERC concessions aforementioned

65
is hostile to the use of foreign national grants or debt61, which restricts funding options.
A more pragmatic option is to take the salient features of the PPP arrangement that make them attractive to investors and apply them to the ERC license. For example, greater government involvement in securing licenses and land titles could contribute to boost interest in ER investment by reducing legal and political risk. Licensed ERC could then be tendered to private investors, or awarded to an ERC developer alongside strong public participation in the project. Further tax breaks and revenue risk guarantees characteristic of PPP projects are discussed in the following sections.
Ideally, the scheme would be synchronized with further efforts to map out ecosystem hotspots such as High Conservation Value Forest areas to be protected through ERC development, above-and-beyond the current 2.5 million ha.
In addition to delays, the number of licenses required is obstructive to business. As stipulated in Forestry Law No 41/1999, the commercialization of forest-based resources requires obtaining a license. In the case of ERCs, resources fall under three different kinds of licenses:
Utilization of forest area;
Non timber products utilization; and,
Ecosystem services utilization.
ERC holders therefore have to go through multiple licensing processes, incurring further delays and costs to start operations. According to MR.36/Menhut-II/2009 on Procedures for Licensing of Carbon Sequestration and/or Carbon Storage Business in Production Forests, ERC holders must also apply for a separate business license for entering carbon markets (IUP-PAN-KARBON).
In the absence of the ambitious PPP reforms mentioned above, alternative reforms would consist of streamlining the ERC licensing process to reduce unexpected delays, and reassessing the cost of licensing against the benefits provided by ERC developers. Recalling that the ERC application must be supported by a business plan outlining how the project developer intends to generate revenues, it would also make sense to integrate all forest-based resources commercialization licenses into a single ERC license.
The theoretical impacts of bringing forward the starting year of net positive revenues from Year 5 to Year 4 for RMU is relatively small, at around $3m discounted at 10%. But, the impact of reducing the payback period by one year and the signaling effect to other investors of achieving such streamlining of licensing procedures is substantial. Moreover, delays in project implementation will contribute to increased risk of social conflicts and forest encroachment.
Reducing Business Risks
ERCs are still relatively new in Indonesia. So far, only 7 ERC licenses have been issued, and most have been initially designed as non-profit ventures, relying on donor support. Although ERC holders are required to develop a business plan outlining their strategy to generate revenues, notably from NTFPs and carbon credits, most have failed to develop convincing business cases62. Only Rimba Raya has managed to generate significant revenues with the issuance of carbon credits (through the Verified Carbon Standard, known as VCS, and with the help of a large buyer who committed to a forward contract for future volumes).
61 P.31/Menhut-II/2014 “Dalam hal permohonan IUPHHK-RE, sumber pendanaan kegiatan tidak dibenarkan diperoleh dari pinjaman atau hibah negara asing” 62 With the exception of one to two of the seven projects aforementioned, all are dependent to some extent on donor funding

66
In a context of high regulatory uncertainty, the absence of demonstrated business models remains a key obstacle in accessing seed funding. Developers will therefore have to either rely on donor funding or ‘relationship funding’ to start up ERC projects, until the industry matures. Those projects that are on the cusp of success though could be considered for one-off benefits such as tax holidays. The cost would be immaterial to government but the confidence effect to the rest of the industry would be large if the business model were proven in practice.
Reducing financial risks
Carbon credits play a central role in the financial viability of ERC projects. A 2009 study conducted by the Bogor Agricultural University (IPB) has demonstrated that ER businesses are more financially sensitive to revenue decreases than cost increase63, and this is supported by the sensitivity analysis in the previous section; which demonstrated an enormous range in NPV from the reported market price of $1-34/tCO264.
This risk is two-fold. Not only can the international price fluctuate in line with unrelated factors such as European industrial output, but also the volume demanded can be unpredictable. Despite the market focus on price, the latter is just as important as the former; if volumes fail to materialize then the price is irrelevant. For the Green Growth scenario to be attractive to investors, it is imperative that a minimum volume of, and price for, carbon can be reasonably expected.
A stabilization fund-like scheme would help mitigate the risk. The government would buy carbon credits at a guaranteed minimum price, and re-sell those credits on voluntary carbon markets, taking over the price risk. This could be done through any future funding mechanism under REDD+ Indonesia, or an independent government or donor-funded trust fund. For example, the Government of Japan makes substantial carbon purchases through its Bilateral Offset Crediting Mechanism, The World Bank oversees the Bio-Carbon Fund and a range of OCED country governments fund the Forest Carbon Partnership Facility.
The guaranteed price should be closely tied to the cost-recovery price (including the opportunity cost of capital); for the PT RMU project this is in the region of $2/tC02. However, as discussed in the previous section this is probably an under-estimate and the average break-even price across a
wider project portfolio is closer to $5/tCO265. Of course, the break-even price is contingent on volumes sold, too, and break-even volumes would need to be specified alongside the price. Government should establish clear project benchmarks to avoid ‘gaming’ of the fund, and also to encourage ongoing efficiency savings.
If it is a national fund, then the Government of Indonesia would probably need to mitigate its own fiscal risk (which in the event of a collapse in credit demand could run into the billions of dollars at $5/tCO2). This could be achieved through top-level inter-governmental guarantees. Key bilateral partners could be identified who are willing to purchase forestry credits centrally. Bilateral partners who are unwilling to fund direct project carbon sales may be more willing to provide financial guarantees at the inter-governmental level. A sweetener may be allowing government to absorb upside risk in the carbon price; so they can profit from strong global carbon prices like they do with many natural resource extraction contracts.
Improving financial performance
Low relative returns
63 Bogor Agricultural University. 2009. Business Development of Ecosystem Restoration Concessions. L’Agence Française de Développment (AFD) and Burung Indonesia. 64 Ecosystem Marketplace State and Trends of the Voluntary Carbon Markets 2013 65 Estimate from PT RMU financial model

67
Reduction of financial risks will make significant headway towards attracting private sector investors. However, for the investment to be fundamentally attractive, more than downside risk mitigation is required. Expected returns need to compete with alternative uses of capital.
The price required to compensate for the opportunity cost of planting Palm Oil and Logging/Timber averages around $10/tCO2, according to the financial model used for this report. However, ERC and timber/palm oil plantation investments should not necessarily be seen as alternative investment options for the same areas. There is an abundance of degraded land, which could accommodate plantation activities with limited additional environmental impact. ERC and plantation investments should not compete for the same areas, but rather focus on clearly designated and mutually exclusive areas (i.e. land suitable for palm oil Vs. HCV). Both investments would then become the optimal choice to maximize returns in those clearly designated areas. ERC returns would then not have to compete with plantation returns (the fundamental assumption of the analysis in the previous chapter), but instead just need to cover costs.
And, equivalently, if the social costs of Business As Usual are borne by the investors, then this increases the relative attractiveness of the Green Growth scenario. This of course, is the Polluter Pays Principle. This is better for government in terms of being revenue-raising rather than the opposite, but requires strong institutional capacity in tax collection as well as law enforcement. It also does not improve the financial case for investment in ERC projects in terms of Return On Investment.
As an aside, it is important to maintain continuity of carbon financing. If opportunity costs are genuinely eliminated then ER Concessions would not be eligible for most forms of financing since the emissions reductions would not be additional. This of course is the ultimate goal, but undermining the short-run business model could undermine the broader transition to better land use. The timing of land-use reform and carbon funding needs to be considered carefully. In the short-term when governance and law enforcement issues are still being addressed in Indonesia, private sector, project-based carbon financing will still play an important role.
In making the business case, there is also an implicit assumption that monetization should focus on the most valuable aspect of the ecosystem services, carbon, so as to preserve the whole. However, another way to boost returns would be to develop multi-commodity based business strategies. This would require the development of market strategies, infrastructure, and incentives for the development of NTFP, ecotourism, and other environmental services. This would entail government support in Research and Development (use and processing of NTFP and other natural resources), support for ecotourism (marketing and crucially, infrastructure), and targeted incentives for environmental services-based economic activities.
For example, although the PT RMU team intends to support NTFP activities generating revenues for local communities, agro-forestry and eco-tourism66, these are not included in the financial appraisal that attracts investors to the project.
The potential for monetizing these at present is debatable. NTFP and Agro-forestry can be monetized to an extent; although if the project developer seeks to control the profit, then local communities are deprived of it, which defeats the very purpose of protecting community land. Our model suggests that some sort of ‘NTFP incentive’ of at least $60/ha/year is required (on top of the carbon price) to compete with timber/pulpwood revenues, and around $120-150/ha/year to compete with Palm Oil. Formalizing NTF products has the added benefit of opening up the possibility of creating finished products and increasing value-add in the local economy.
Currently, biodiversity is partly monetized, since the VCS carbon credits are expected to attain CCBA certification (Climate, Community and Biodiversity Alliance). This means that buyers are in
66 Source: Project Design Document

68
principle willing to pay a higher price for VCS-CCBA credits than, for example, VCS Energy Efficiency projects, on account of their value to global biodiversity.
Biodiversity is potentially further monetizable through the biodiversity offset market. However, the market is immature, illiquid and generally geared towards getting approval of environmentally-destructive projects in developed markets. Demand will inevitably be driven by regulation, and it is likely that most projects will have to be in the same country that the negative impacts take place in. Notwithstanding these factors, successful monetization could be lucrative and support the business case, with biodiversity restoration costs in developed countries (and therefore an approximation of the Willingness to Pay for offsets) as high as USD 50,000 – 200,00067.
Lastly, in the longer-term it is possible that innovative Payment for Ecosystem Services (PES) models could support the financial case alongside carbon and biodiversity credits. For example, private sector or community reimbursement for clean water is a potential future market in Indonesia.
Monitoring costs
Leakage refers to the risk that a restoration or conservation initiative might simply displace deforestation to another area rather than prevent it. Therefore, REDD+ projects require that ERC holders monitor leakage within a range of 100km around the concession. This is a very large area to cover, and can entail significant monitoring costs.
In the case of PT RMU, the budgeted costs are significant – representing around a fifth of non-tax operating costs – although unlikely to be a deal-breaker. However, other developers have stated that monitoring costs can quickly escalate beyond original budget projections and undermine the financial case for an ERC project.
There is a strong argument for reassigning monitoring obligations to government. They are strongly linked to law enforcement in many cases, and have the characteristics of a public good. Furthermore, monitoring by a centralized agency would be more cost-efficient, especially with advances in Information and Communications Technology that can be used to remotely monitor sites (satellite imagery etc). A compromise solution might be for government to insure the risk of monitoring costs exceeding a certain amount, or agree to make excess monitoring costs tax-deductible.
Access to, and cost of, funding
It is fair to say that traditional financial institutions are unlikely to invest in ERC projects, as they feature a higher risk profile and lower returns perspectives than competing investment opportunities such as palm oil or mining. The 7 ERC projects referred to in the introduction to this section have been developed with either donor funding or through personal relationships with wealthy investors. Access to debt finance in particular therefore remains a key bottleneck for ERC investment.
The cost of finance is also a key, and often overlooked, factor in the financial equation. Reducing the cost of capital by two percentage points would generate a USD 45 million rise in Net Present Value; equivalent to a nearly $2 boost in the carbon price over the project lifetime.
Any funding mechanism under REDD+ could play a central role in developing a strong assessment framework to build a large pipeline of eligible ERC projects and channel preferential long-term funding towards ERC development. Other supporting financial policies such as subsidized loans, government-guaranteed loans could support this. This would have the arguably beneficial effect of also giving government a vested interest in the success of ERC projects if they wish to see their
67 Source: United Kingdom, www.environmentbank.com, Agri-Environment vs. Biodiversity Offsetting

69
debt repaid, which might add impetus to harmonizing national-local government coordination (see below).
Cashflow timings and fee structures An ERC license, issued by the Ministry of Forestry, has cost roughly IDR 2,500/ha per year68 since late 2014. The fee is ‘progressive’ and rises 25% for each additional 25,000 in concession size after 100,000 ha up to a maximum of 200,00 ha. For a 203,570 ha concession this would cost around IDR 674 million (approx. USD 56 thousand) every year, which corresponds to a significant up-front payment for long concession terms. Some would argue that this should be reduced, given the positive outcomes of ERC projects.
But, there needs to be some incentive for government to support ERC projects over Palm Oil and Timber concessions. More acceptable to government might be a deferred payment scheme; where license debts are settled as project revenue accrues. Basically, this moves the license closer in nature to a tax, which can be deferred until profits are positive. This has a significant advantage in terms of financial performance of the project by deferring an element of the early-year investments.
More importantly is the perverse incentives the progressive schedule provides. This makes it more than twice as expensive to run a 200,000 ha concession as a 100,000 ha concession. Yet, many of the benefits of ecosystem restoration rely on protecting the entire system; the landscape approach69. Graduated tariffs should run the other way; larger, landscape-wide concessions should get per hectare discounts on their concession fees.
68 P.76/Menhut-II/2014 69 See e.g. Government of Malaysia (2009) Managing Biodiversity in the Landscape, Guidelines for Planners, Decision-Makers and Practitioners

70
Green Growth Policy in Government
There are several issues and policy solutions from the government perspective that could help bolster support for ERC and similar projects:
1. The fiscal opportunity cost to government of ERC compared to Palm Oil and HTI Plantations can disincentivise support for ERCs. Clearer land use governance so ERC is not competing for the same land as Palm Oil and Timber would offset this issue, as would serious consideration of the effective tax rate paid by commodities companies.
2. Even where land use governance has been optimized at the national level, because land swaps entail transferring fiscal revenue from one district/regency to another, local government will need compensation if they are to support ERC activities, through alterations to the tax/concession fee setup or through intergovernmental fiscal transfers.
3. Currently, government does not have to consider the external costs likely to be generated by Business As Usual activities. However, if these were incorporated into the policy and planning process, including potential fiscal consequences, then this would support ERC activities.
Land Use Governance
Central and local government is regularly under pressure to reach their fiscal revenue targets. Therefore, they are pressured to pursue palm oil and mining expansion, which in principle generate higher fiscal revenues than ERC, and disincentivized to provide tax holidays for ERCs. Such risk could be mitigated by avoiding competition between ERC and other land use investment, by identifying land suitable for palm oil, and HCV reserved for ERC investment.
Improved land use governance would require two key steps:
Rigorous biophysical mapping: in order to identify (current and potential) protected peatland areas and be able to promote such areas as ERC investment.
A clear and widely accepted spatial plan: The validation of a reference ‘one map’, including ecological hotspots designated for ERC investment, would be a major step in that direction.
It is worth noting that the actual fiscal opportunity cost may be significantly lower than the perceived cost both at national and regional level. Two recent studies support the notion that the effective tax rate in sectors such as Palm Oil and Timber is significantly lower than the statutory rate. The first is a Human Rights Watch study70 that alleged that uncollected forestry fees (due to illegal operations and weak governance) exceeded $2bn in 2011 alone. The second is the allegation by a senior tax expert at Indonesia Corruption Watch, Justin Prastowo, that tax evasion in the Palm Oil sector is rampant71.
Mitigate fiscal opportunity cost
As discussed above, it will be important to ensure land use types are classified and permitted appropriately to avoid perceptions of an opportunity cost of ERC.
Land swaps (aiming to relocate palm oil development from forested production forest into degraded land), would accommodate palm oil expansion while mitigating its impact on
70 Human Rights Watch (2013), The dark side of green growth: Human Rights Impacts of Weak Governance in Indonesia’s Forestry Sector 71 See e.g. http://www.tribunnews.com/bisnis/2013/10/27/icw-pajak-negara-dari-perkebunan-cuma-125-persen

71
deforestation. Forested areas eligible for conversion could then either be reclassified as protected forest (a long and uncertain process) or be protected through the development of an ERC project; which might be seen by some as a more convenient solution.
Indonesia displays considerable potential for land swaps: according to the Bogor Agricultural University, over 1.6 million hectares of deforested land could be utilized for land swaps in Central Kalimantan alone.
However, land swaps will have to be done across regencies, resulting in fiscal opportunity costs for affected local governments, which will then produce lower fiscal revenues from ERCs than they would receive from palm oil companies. Those districts that are asked to support ERC rather than palm oil/pulpwood (i.e., those with the highest value ecosystems and less degraded land) will suffer revenue losses from the issuance of Plantation Permits or Izin Usaha Perkebunan. For example, a district like Murung Raya in Central Kalimantan, which is mainly covered with high Conservation Value land, could forfeit significant fiscal revenues if land use is solely restricted to ERC-type projects.
These opportunity costs may include wider economic opportunity costs to the District/Region, such as job creation and other spillover effects (and indirect fiscal losses relating to these activities). In particular, palm oil plantations are a major source of employment, absorbing around 0.14 workers per ha, i.e. a 100,000 Ha plantation would provide employment to 14,000 people. This is an order of magnitude higher than the jobs required for an ER Concession. Fiscal compensation schemes should aim to compensate for the whole economic opportunity cost rather than fiscal opportunity costs alone72.
Fiscal incentives are likely to be crucial to overcome this obstacle. This could be in the form of benefit sharing: Ministry of Forestry regulation P.36/200973 states that benefits (defined as revenue) from carbon credit-generating projects must be apportioned between communities (20%), government (20%) and developers (60%). And, within government, the benefits should be distributed 40:40:20 between central government, district government and provincial government. Revenue-based benefit sharing agreements have the advantage of being highly transparent and less easily subject to accounting manipulation.
However, such policy, by lowering private sector returns, makes investment in ERC less attractive. A cut of forty percent of revenues in an environment of high-price uncertainty is a major risk factor for investors.
At the same time, this regulation has unclear implementation status. It is subject to revision, has been augmented by 2013 Regulation P.11/Menhut-II/2013, and anecdotal evidence suggests that it has been unofficially challenged by other Ministries as a conflict of jurisdiction. Given these uncertainties it is not surprising that project developers are confused by the appropriate benefit sharing parameters.
Reconciling the need to incentivize local government with the need to create attractive private sector returns suggests an alternative path: creating fiscal benefits for local government. Currently, most fiscal revenues from ERCs flow primarily to national government (concession fees, land licenses, land and property tax, corporate income tax etc.). This revenue can be redirected to local government in two ways:
Direct payment of fiscal revenues to local government
Intergovernmental fiscal transfers
72 Note that jobs estimates are not conventionally provided with the eCBA framework. Instead the social opportunity
cost of labor is considered.
73 Peraturan Menteri Kehutanan Republik Indonesia Nomor: P.36/Menhut-II/2009

72
The first of these would involve re-directing selected payments from national to provincial/district government. For example, delegating jurisdiction for the concession fee to district government would provide a serious incentive to compete with Izin Lokasi (local permit) revenue from Palm Oil and HTI Plantations.
The drawback to this approach is that a certain amount of overhead relating to the administration of the concession should probably sit with national government (due to skills and capacity, need for consistency of spatial planning, links with law enforcement, links with monitoring and enforcement 74, assuming large-scale risk and liability). By defining jurisdiction as ‘all or nothing’ (national or district government) it is difficult to allocate costs proportionately. Further, this possibility largely centers on concession fees only; it would not be practical to re-route primary tax revenues such as corporate income tax to district governments as it would involve fundamental legal reform of the tax system.
The second approach would involve payments from national to sub-national government. This approach is gaining traction in the research community in the context of environmental policy, and several vehicles for implementation have already been identified75:
Channeling fiscal flows through the Special Purpose Fund (Dana Alokasi Khusus, DAK) in exchange for successful outcomes for individual projects or programs.
Direct grant agreements with districts hosting ER Concessions
A Regional Incentive Fund (Dana Insentif Daerah) with funding linked to aggregate outcomes such as CO2 emissions reductions in line with RAD-GRKs or the extent of forest cover, rather than individual projects.
An illustration of one proposed model for the Regional Incentive Fund is provided below:
Figure 29: Payment Mechanism under a Regional Incentive Fund
74 Irawan and Tacconi (2009) Reducing Emissions from Deforestation and Forest Degradation (REDD) and decentralized forest management 75 The following discussion draws from a Ministry of Finance Green Paper: Economic and fiscal policy strategies for climate change mitigation in Indonesia (2009)

73
Source: Ministry of Finance (2009)
Such intergovernmental fiscal transfers are already active in Brazil and Portugal for biodiversity protection payments and are under consideration elsewhere76.
We note that current research very much focuses on this issue from the angle of international donor funding, to be channeled through national to local government. Our focus is more on incentivizing local government to support private sector projects who are directly funded by international and national carbon buyers (‘other entities’ in Figure 29 above). The fundamental recommendations still stand, but we would welcome further research on possible implementation routes for private-sector-led ERC projects specifically.
Finally, the discussion on fiscal opportunity cost should not mask another driver of palm oil expansion at the District/provincial level; in addition to revenues generated through licensing fees, the role that vested interests and corruption play in driving palm oil expansion should not be under-estimated. According to the Corruption Eradication Commission (KPK), ‘all activities in forest zones have a very high risk of corruption’ and ‘Officials and civil servants may ... actively misuse their positions to determine forestry concessions’77. Many civil society organizations believe that corruption in business licensing is a major driver for plantation expansion into forested land; fiscal redistribution schemes will only be able to address the fiscal opportunity gap for local governments, not the personal opportunity cost for corrupt officials. Addressing wider governance issues will be critical to enabling the success of green growth policies.
The planning process
As mentioned above, taking the environmental and social costs and benefits into account, ERC development actually generates greater long-term returns for society than plantation development. In addition, external costs associated with plantation development - such as increased flood risk, and decreasing crop yields due to the impact on downstream watersheds and localized changes in climate and rainfall patterns– are likely to be at least partly borne by the government. In this analysis, it is likely that the farmers planting on land adjacent to the RMU project would have been seeking government support under the Business As Usual scenario following widespread hydrological damage to their land in the long-run.
In order for government to be able to take these costs into account, practical tools and methodologies are required, which must also be embedded into the planning and project appraisal process. This was discussed for the eCBA tool in Figure 8 in Section 1 of this report, and GGGI has also produced more detailed separate documents outlining how this might happen in Indonesia78.
76 Irawan and Tacconi (2009) 77 Greenpeace (2013) License to Kill, How deforestation of palm oil is driving Sumatran tigers toward extinction 78 GGGI (2015) Scoping green growth in Indonesia. Working Paper GGGI Indonesia Program

74
Green Growth Policy for Communities
Community Relations
Local communities’ endorsement and participation is indispensable to the development of successful ER projects. Degraded land, which is often located at the vicinity of populated areas, is particularly sensitive to encroachment and social conflicts. In 2012, 250 land conflicts were recorded in Central Kalimantan alone79.
Long licensing delays risk igniting new and unexpected social conflicts, as they in turn delay the delivery of economic empowerment activities. This can exacerbate tensions and escalate developer costs in a vicious circle of deteriorating trust. This reinforces the case for accelerated and streamlined government licensing procedures discussed earlier.
But, more important is the role of benefit sharing mechanisms. According to industry stakeholders, the original intention of the benefit sharing regulation discussed was designed to achieve buy-in from local communities and provide seed funding for local businesses and social services. In turn, this would avoid carbon leakage as communities would have a viable livelihood alternative to land clearance activities. The current benefit sharing regulations on the previous page provide a starting point; allocating of 20% of revenues into a trust fund that accumulates over time is clearly a good source of funding to develop livelihoods and ultimately reduce leakage (which in turn would reduce operating costs for developers). However, there are several issues for clarification:
Who qualifies as ‘local communities’?
With the referenced ‘trust fund’, how would community projects be prioritized and planned?
What will be the governance arrangements for the trust fund? Especially where, for example, 20% of revenue amounts to more cash than communities can absorb in the short-run.
Lessons emerging from projects such as The Nature Conservancy Forest Carbon Program in Berau in East Kalimantan80, and others, include:
It is crucial that benefits sharing be a participatory process, with communities having a strong say in spending patterns (water, health clinics, scholarships etc.) as well as governance processes (who implements projects, how financial flows are monitored)
The options for benefits sharing to be presented to communities within a clear development-needs framework if optimal choices are to be made.
Benefits sharing should be treated as much as a ‘livelihoods development’ strategy as a task of redistribution; the RMU project is an example of a project where management aims to channel agriculture, NTFP, fishing and eco-tourism benefits to local communities.
Supporting CSR activity such as micro-finance, education and electrification is likely to play a strong role in winning hearts and minds and proving that there is an attractive alternative to natural resources exploitation.
79 http://news.mongabay.com/2014/0424-Hadinaryanto-palmoil-kalimantan.html 80 See e.g. TNC, Ministry of Forestry (2010) Berau Forest Carbon Program, Delivering Practical Solutions to Support Development of a National-level REDD Framework in Indonesia

75
Table 16: Summary of key policy suggestions
Key Issue Proposed Policy Intervention Expected Outcome
Po
licy
fo
r In
vest
ors
Addressing Regulatory Issues
Uncertainty regarding licensing (time and cost)
Streamlining and increasing the transparency of the ERC licensing process Greater government participation in the project: local government acquires the land and/or licenses
Decreased legal uncertainty and implementation delays Reallocation of regulatory risks to local government and de-risking of the investment
Addressing Business/Financial Risks
Absence of proven business model
Additional one-off support for early stage projects such as tax holidays
Awareness raising of long-run impacts of peat drainage in the business community
Increased investor confidence that ERC projects are practical
Increased investor understanding of the hidden costs of BAU
Financial risks (uncertainty regarding CER/VCS prices / volumes)
National Carbon Market and stabilization fund (minimum price at which GoI would buy a guaranteed volume of credits)
Other bilateral and multilateral guarantees
Decreased financial risks
Improving financial performance
Low returns on investment relative to commodities
Land swap (land suitable for palm oil expansion vs. HCV land)
Application of Polluter Pays Principle through carbon pricing
Decreased (legal) opportunity cost of investing in ERC in degraded peat swap forest
Low absolute returns on investment
Mandate a government agency to monitor leakage or absorb risk of spiraling monitoring costs
Decreased operation costs and improved financial performance
Allow concession fee to be paid in installments
Lower capital costs and higher financial performance

76
Provide preferential long-term funding to ERC developers through REDD+ Fund
Reduced cost of capital and improved financial performance
Po
licy
fo
r G
ove
rnm
ent
Incentivizing Government
Perceived attractiveness of commodity revenues and fiscal opportunity cost of ERC (national/provincial)
Clear spatial plan, including zoning of HCV areas (validation of ‘one map’)
Increase in palm oil output without further deforestation
Fiscal opportunity cost of land swaps (especially at district level)
Redirect revenue flows from project developers from national to local government
Intergovernmental fiscal transfers
Compensate eventual losses in fiscal revenues for local governments
Costs and benefits (including future fiscal liabilities) not included in decision making
Include green growth tools and methodologies in project and planning appraisal
Internalization of ecosystem service values into planning and investment decisions
Po
licy
fo
r C
om
mu
nit
ies
Addressing Social Risks
Absence of socio-economic opportunity means land clearance activities continue (or are simply displaced elsewhere; leakage)
Clarify benefit sharing mechanisms and establishing guidelines for participatory processes
Benefits funneled into long-term trust funds used to support livelihood development
Establish guidelines to assist developers include livelihood development in project design
Viable alternative to land clearance activities and sustainable long-term livelihoods
Greater buy-in for project and reduced monitoring and enforcement costs
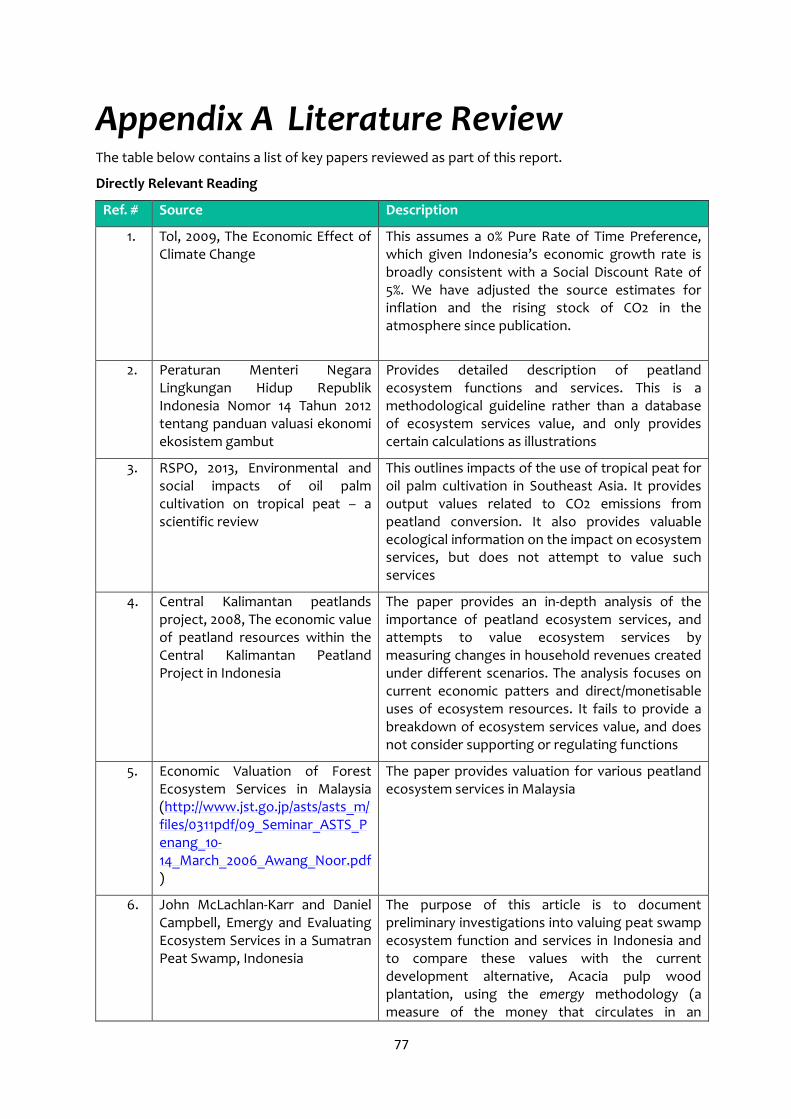
77
Appendix A Literature Review The table below contains a list of key papers reviewed as part of this report.
Directly Relevant Reading
Ref. # Source Description
1. Tol, 2009, The Economic Effect of Climate Change
This assumes a 0% Pure Rate of Time Preference, which given Indonesia’s economic growth rate is broadly consistent with a Social Discount Rate of 5%. We have adjusted the source estimates for inflation and the rising stock of CO2 in the atmosphere since publication.
2. Peraturan Menteri Negara Lingkungan Hidup Republik Indonesia Nomor 14 Tahun 2012 tentang panduan valuasi ekonomi ekosistem gambut
Provides detailed description of peatland ecosystem functions and services. This is a methodological guideline rather than a database of ecosystem services value, and only provides certain calculations as illustrations
3. RSPO, 2013, Environmental and social impacts of oil palm cultivation on tropical peat – a scientific review
This outlines impacts of the use of tropical peat for oil palm cultivation in Southeast Asia. It provides output values related to CO2 emissions from peatland conversion. It also provides valuable ecological information on the impact on ecosystem services, but does not attempt to value such services
4. Central Kalimantan peatlands project, 2008, The economic value of peatland resources within the Central Kalimantan Peatland Project in Indonesia
The paper provides an in-depth analysis of the importance of peatland ecosystem services, and attempts to value ecosystem services by measuring changes in household revenues created under different scenarios. The analysis focuses on current economic patters and direct/monetisable uses of ecosystem resources. It fails to provide a breakdown of ecosystem services value, and does not consider supporting or regulating functions
5. Economic Valuation of Forest Ecosystem Services in Malaysia (http://www.jst.go.jp/asts/asts_m/files/0311pdf/09_Seminar_ASTS_Penang_10-14_March_2006_Awang_Noor.pdf)
The paper provides valuation for various peatland ecosystem services in Malaysia
6. John McLachlan-Karr and Daniel Campbell, Emergy and Evaluating Ecosystem Services in a Sumatran Peat Swamp, Indonesia
The purpose of this article is to document preliminary investigations into valuing peat swamp ecosystem function and services in Indonesia and to compare these values with the current development alternative, Acacia pulp wood plantation, using the emergy methodology (a measure of the money that circulates in an

78
economy as the result of some flow or process).
7. Wetlands International, Review of policies and practices in tropical peat swamp forest management in Indonesia.
The paper provides ample descriptions of peatland ecosystem functions and benefits. It also lists regulations governing peatland use, as well as recommendations for improved peatland management. The paper however does not provide valuations of ecosystem services.
8. Wetlands international, conservation and sustainable use of peat swamp forests by local communities in South East Asia
The paper provides valuations for peatland NTFP in Malaysia
9. University of Palangkaraya, restoration of hydrological status as the key to rehabilitation of damaged peatland in Central Kalimantan
The paper explores the impact of peat drainage on ecosystem functions and services.
10. Deltares, 2012, Subsidence in drained coastal peatlands in SE Asia: Implications for sustainability
Provide evidence from plantation in Indonesia/Malaysia on subsidence on peatland
11. Institute for Environmental Security, 2005, Promoting Environmental Security and Poverty Alleviation in the Peat Swamps of Central Kalimantan, Indonesia
The paper looks at the contribution of peatland services on environmental security, and analyses the social impact (occurrence of conflict) of biodiversity loss
12. The orangutan–oil palm conflict: economic constraints and opportunities for conservation
The paper provides valuable information on the enabling habitat conditions required for sustained orangutans’ existence, e.g. ha of forest per animal, but it does not attempt to value biodiversity
13. Borneo insider (data for Sabah, Malaysia)
http://borneoinsider.com/2013/02/22/factual-data-for-sabah-tourism-industry/
The paper provides information on tourist visits and average spending per visit in the Malaysian province of Sabah, the leading eco-tourism destination on the island of Borneo
14. Recensement des études d’impact menée sur la microfinance
http://www.cerise-microfinance.org/IMG/pdf/Recensement_des_etudes_d_impact_en_microfinance_2011.pdf
The paper lists a comprehensive list of studies on the socio-economic impact of micro-finance
15. GIZ, 2013, The Impact of Electricity Access on Economic Development: A Literature
The paper lists the most relevant sources on the socio-economic impact of access to electricity

79
Review
16. Health transition review, 1995, The effects of access to health care on infant mortality in Indonesia
This paper examines the impact of access to health facilities and personnel on infant and child mortality in Indonesia
17. Water and Sanitation Program, 2008, Economic Impacts of Sanitation in Indonesia
The paper provides an analysis of the economic implications of poor water and sanitation at macro and micro levels
18. The Developing Economies, 2013, Monetary and Nonmonetary Returns to Education in Indonesia
The paper analyses monetary and non-monetary returns to Education
19. Climate Policy Initiative, 2013, Demonstrating Approaches to REDD+ Lessons from the Kalimantan Forests and Climate Partnership
The paper presents the findings of an economic Cost Benefit analysis of the KFCP conservation project, looking at potential returns against the opportunity cost of not developing palm oil plantations
20. Rhett A. Butler, mongabay.com, 2007, Is peat swamp worth more than palm oil plantations?
http://news.mongabay.com/2007/0717-indonesia.html
The article compares potential returns of peat swamp conservation Vs. conversion to palm oil.
21. Lembaga Riset Perkebunan Indonesia, analisis finansial dan keuntungan yang hilang dari pengurangan emisi karbon dioksida pada perkebunan kelapa sawit
The paper provides a detailed breakdown of the cost structure of palm oil development and potential returns
22. Palm Oil development cost benchmark from the Ministry of Agriculture (Kepdirjen No 192/KPTS/RC.110/6/2013)
The document provides a maximum cost benchmark for palm oil development in every producing province of Indonesia.
23. CIFOR, Economic Costs and Benefits of Allocating Forest Land for Industrial Tree Plantation Development in Indonesia
This paper examines the total economic costs and benefits of five large pulp plantation projects in Sumatra, Indonesia.
24. Beukering. Van Pieter et al, 2008, The economic value of peat land resources within the Central Kalimantan Peatland project in Indonesia
Provide data on Marginal Rate of substitution fr one hectare of forest (stock) converted to an annual flow
25. A. Hooijer et al, 2012, Subsidence in Drained Coastal Peatlands in SE Asia: Implication for Sustainability
Provide explanation on drainage of peatlands to subsidence that leads to gravity drainage and reduced agricultural production and cost-benefit analyses in land use planning.
26. Boer. Rizaldi, 2012, Reducing agricultural expansion into forests
Provide the analysis of the potential to reconcile growth of the palm oil sector and reducing

80
in Central Kalimantan Indonesia, Analysis of Implementation and financing gaps
deforestation through the expansion of palm oil plantation on low carbon land and increasing productivity
27. World Agroforestry Centre, 2010, Carbon Emission from Land Use, Land Use Change and Forestry (LULUCF) in Berau Disctrict East Kalimantan, Indonesia
Provide the value for low-intensity logging
28. WWF Heart of Borneo, 2012, Investing in Nature for a Green Economy
Provide information on the value of the Heart of Borneo and biodiversity
29. Ministry of Forestry, 2013, Data dan Informasi Ditjen Planologi Kehutanan Tahun 2013
Provide information on number of permits issued on forest conversion to plantation or agriculture business
30. IPCC, 2013, Supplement to the 2006 IPCC Guidelines for National GHG Inventories: Wetlands
Contains emissions factors for drained peatland used in this report. See Table 2.1.
Wider Reading
No Source
1 Ministry of Forestry Regulation; P.36/Menhut-11/2009
2 Ministerial Decree 159/Menhut-II/2004
3 Ministerial Regulation No 61/2008
4 Peraturan menteri negara lingkungan hidup republik indonesia, Nomor 14 tahun 2012Tentang, Panduan valuasi ekonomi ekosistem gambut
5 Zhuang et al, 2007, Theory and Practice in the Choice of Social Discount Rate for Cost Benefit Analysis
6 Forest People Programme, 2006, Ghosts on our Own Land: Indonesian Palm Oil Smallholders and the Roundtable on Sustainable Palm Oil
7 Yusuf et all, 2004,Pricing of Palm Oil Fresh Fruit Bunches for Smallholders in South Sumatra
8 PwC Indonesia, 2014, Indonesian Pocket tax Book 2014
9 Bloomberg, 2013, Indonesia cuts Palm Oil Export-Tax to Boost Sales as Price Drop
10 World Bank/URS Forestry, 2002, Association of Indonesian Concession Holders (APHI)
11 International Finance Corporation, 2010, Developing a Sustainable Plantation Wood Supply through Successful Community-Company Partnerships in Indonesia
12 United Nations for The Economics of Ecosystems and Biodiversity (UN TEEB) database
13 Redd-monitor.ord, 2013, Indonesia’s rate of deforestation has doubled under the moratorium

81
14 Thomas A. Walsh, Yoppy Hidayanto, Asmui, Agus Budi Utomo, 2013, Ecosystem restoration in Indonesia’s production forest: towards financial feasibility
15 Keynote Speech on International Seminar on Ecosystem Restoration in the Tropics, Lesson learned and Best Practice IPB, November 2013
16 Forest-trends.org, 2013, State of the Voluntary Carbon Markets 2013
17 Bogor Agricultural University, 2009, Business Development of Ecosystem Restoration Concession. L’agence Francaise de Developpement (AFD) and Burung Indonesia
18 Priadjati. Aldrianto, 2013, Aplikasi Kebijakan HPH Restorasi Ekosistem (IUPHHK-RE) PT RHOI di Kalimantan untuk Pelepasan kembali Orangutan
19 www.environmentbank.com, Agri-Environment vs. Biodiversity Offsetting
20 Human Rights Watch, 2013, The Dark Side of Green Growth: Human Rights Impact of Weak Governance in Indonesia’s Forestry Sector
21 Greenpeace,2013, License to Kill, How deforestation of palm oil is driving Sumatran tigers toward extinction
22 Hardyanto. Satria, 2014, Special Report: Palm oil, politics, and land use un Indonesian Borneo (Part I). mongabay.com
23 FAO, 2014, Towards Climate-responsible Peatlands Management

82
Appendix B Model Architecture Below, we have provided an overview of the structure of the eCBA model accompanying this report.
Figure 10: Architecture of eCBA model
Crucial valuation and biophysical
assumptions
Most important and uncertain
assumptions
Other assumptions and data inputs
Supporting data and assumptions
Output calculations
Quantifying number of units (m3, kWh, people
etc.)
Summary of Results
NPV, ERR, CBR ratiosSplit across time and 5
dimensions
Cash flow and discounting calculations
Allocating costs and benefits over time and
expressing in NPV
Outcome calculations
Monetising value of outputs ($)
Output data (non-monetary)
Outcome data (monetary)
CBA>>>
Dashboard
Assumptions and Values
CBA>>> CBA>>> Dashboard
Step
Explanation
MS Excel tab name
Key:

83
Appendix C Ecosystem Valuations
Biome Ecosystem Ecosystem Service
Ecosystem Subservice
Protected Status Location Name Year Valuation Method Value (2013 $/ha/yr)
Title
Inland Wetlands
Swamps / marshes
Climate C-sequestration Partially protected
Malaysia 1994 Avoided Cost 372 Sustainable forest management: myth or reality? Exploring the prospects for Malaysia. Ambio 25(7): 459-467.
Tropical Forest
Tropical forest general
Climate Climate regulation [unspecified]
Partially protected
Malaysia 1994 Avoided Cost 365 Sustainable forest management: myth or reality? Exploring the prospects for Malaysia. Ambio 25(7): 459-467.
Tropical Forest
Tropical forest general
Climate Climate regulation [unspecified]
Partially protected
Malaysia 2007 Direct market pricing 851 Environmental resource services of Malaysian moist tropical forest. Johns Hopkins University Press, for Resources for the Future, Baltimore, USA.
Inland Wetlands
Swamps / marshes
Food Fish Partially protected
Malaysia 1994 Direct market pricing 60 Sustainable forest management: myth or reality? Exploring the prospects for Malaysia. Ambio 25(7): 459-467.
Tropical Forest
Tropical forest general
Food Food [unspecified]
Partially protected
Malaysia 1994 Direct market pricing 10 Sustainable forest management: myth or reality? Exploring the prospects for Malaysia. Ambio 25(7): 459-467.
Inland Wetlands
Swamps / marshes
Genepool Biodiversity protection
Partially protected
Malaysia 1994 Contingent Valuation 28 Sustainable forest management: myth or reality? Exploring the prospects for Malaysia. Ambio 25(7): 459-467.
Tropical Forest
Tropical rain forests
Medical Bioprospecting Partially protected
Peninsular Malaysia
2000 Factor Income / Production Function
6 Valuing research leads: bioprospecting and the conservation of genetic resources. UC Berkeley: Berkeley Program in Law and Economics. Journal of Political Economy 108(1): 173-206.
Tropical Forest
Tropical rain forests
Medical Bioprospecting Partially protected
Northern Borneo, Peninsular Malaysia
2000 Factor Income / Production Function
1 Valuing research leads: bioprospecting and the conservation of genetic resources. UC Berkeley: Berkeley Program in Law and Economics. Journal of Political Economy 108(1): 173-206.
Tropical Forest
Tropical forest general
Pollination Pollination of crops
Partially protected
Central Sulawesi, Indonesia
2001 Direct market pricing 58 Linking deforestation scenarios to pollination services and economic returns in coffee agroforestry systems. Ecological Applications 17(2): 407-417.
Inland Wetlands
Swamps / marshes
Raw materials
Raw materials [unspecified]
Partially protected
Malaysia 1994 Direct market pricing 18 Sustainable forest management: myth or reality? Exploring the prospects for Malaysia. Ambio 25(7): 459-467.

84
Tropical Forest
Tropical forest general
Raw materials
Raw materials [unspecified]
Partially protected
Indonesia 1994 Direct market pricing 163 A method for the economic valuation of non-timber tropical forest products. Economic Botany 47(3): 220-233.
Multiple Ecosystems
Multiple ecosystems
Recreation Tourism Protected Komodo National Park, Indonesia
1995 Contingent Valuation 3 Pricing policy for tourism in protected areas: lessons from Komodo National Park, Indonesia. Conservation Biology 15(1): 218-227.
Inland Wetlands
Swamps / marshes
Recreation Recreation Partially protected
Malaysia 1994 Travel Cost 8 Sustainable forest management: myth or reality? Exploring the prospects for Malaysia. Ambio 25(7): 459-467.
Coastal wetlands
Tropical forest general
Recreation Tourism Not protected Benut, Johor State, Malaysia
1999 Contingent Valuation 4 A contingent valuation of the mangroves of Benut, Johor State, Malaysia. Report to DANCED, Copenhagen, Denmark.
Tropical Forest
Tropical forest general
Recreation Recreation Partially protected
Malaysia 1994 Direct market pricing 20 Sustainable forest management: myth or reality? Exploring the prospects for Malaysia. Ambio 25(7): 459-467.
Inland Wetlands
Swamps / marshes
Waste Waste treatment [unspecified]
Partially protected
Malaysia 1994 Factor Income / Production Function
42 Sustainable forest management: myth or reality? Exploring the prospects for Malaysia. Ambio 25(7): 459-467.
Tropical Forest
Tropical forest general
Water Water [unspecified]
Partially protected
Malaysia 1994 Direct market pricing 11 Sustainable forest management: myth or reality? Exploring the prospects for Malaysia. Ambio 25(7): 459-467.
Tropical Forest
Tropical forest general
Water flows
Water regulation [unspecified]
Partially protected
Malaysia 1994 Factor Income / Production Function
24 Sustainable forest management: myth or reality? Exploring the prospects for Malaysia. Ambio 25(7): 459-467.
AVERAGE 108
SUM 2045 Note: Double-counting
Source: The Economics of Ecosystems and Biodiversity Database
85
Copyright © January 2015 The Global Green Growth Institute 19F Jeongdong Building, 21-15, Jeongdong-gil, Jung-gu, Seoul, Korea 100-784 The Global Green Growth Institute does not make any warranty, either express or implied, or assumes any legal liability or responsibility for the accuracy, completeness, or any third party’s use or the results of such use of any information, apparatus, product, or process disclosed of the information contained herein or represents that its use would not infringe privately owned rights. The text of this publication may be reproduced in whole or in part and in any form for educational or nonprofit uses, provided that acknowledgement of the source is made. Resale or commercial use is prohibited without special permission. The views and opinions of the authors expressed herein do not necessarily state or reflect those of the Global Green Growth Institute.