costar template
TRANSCRIPT
© Copyright 2013 CoStar Group, Inc. All Rights Reserved. Although CoStar
makes efforts to ensure the accuracy and reliability of the information
contained herein, the following information includes projections that are
based on various assumptions by CoStar concerning future events and
circumstances, as well as historical and current data maintained in CoStar’s
database. Actual results may vary from the projections presented.
The information in this presentation is provided ‘as is’ and CoStar expressly
disclaims any guarantees, representations or warranties of any kind,
including those of merchantability and fitness for a particular purpose.
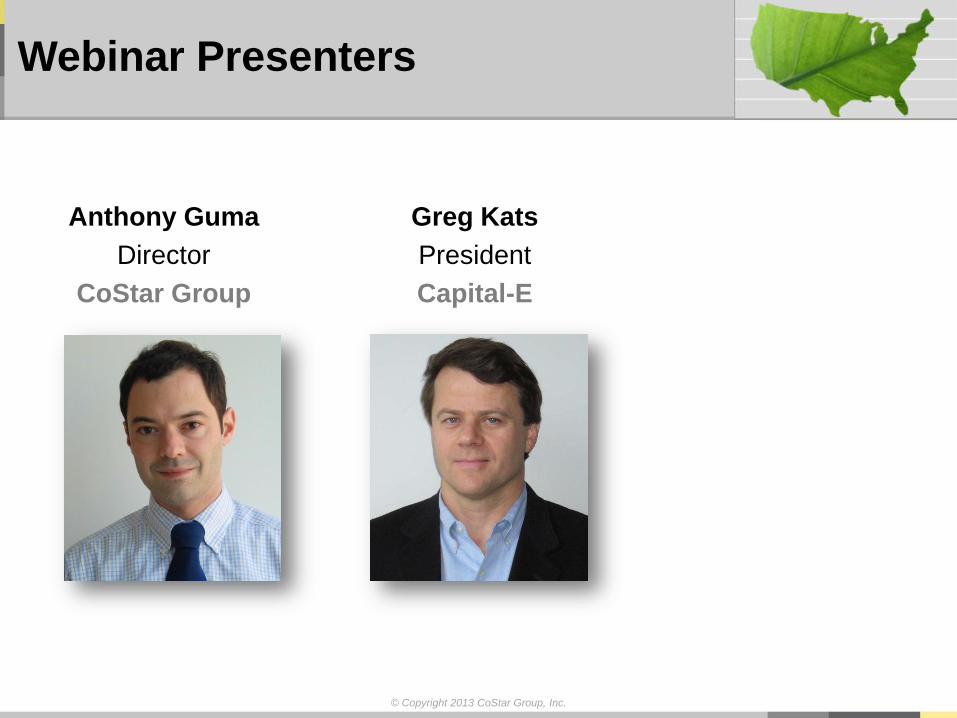
Webinar Presenters
Anthony Guma
Director
CoStar Group
© Copyright 2013 CoStar Group, Inc.
Greg Kats
President
Capital-E
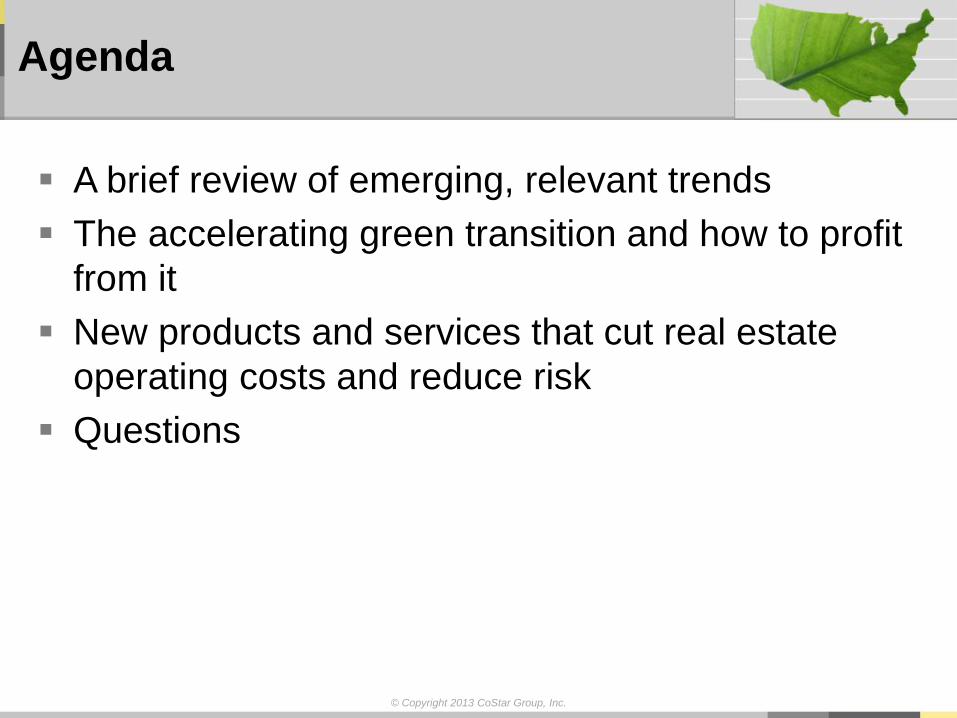
Agenda
A brief review of emerging, relevant trends
The accelerating green transition and how to profit
from it
New products and services that cut real estate
operating costs and reduce risk
Questions
© Copyright 2013 CoStar Group, Inc.

Anthony Guma
© Copyright 2013 CoStar Group, Inc.
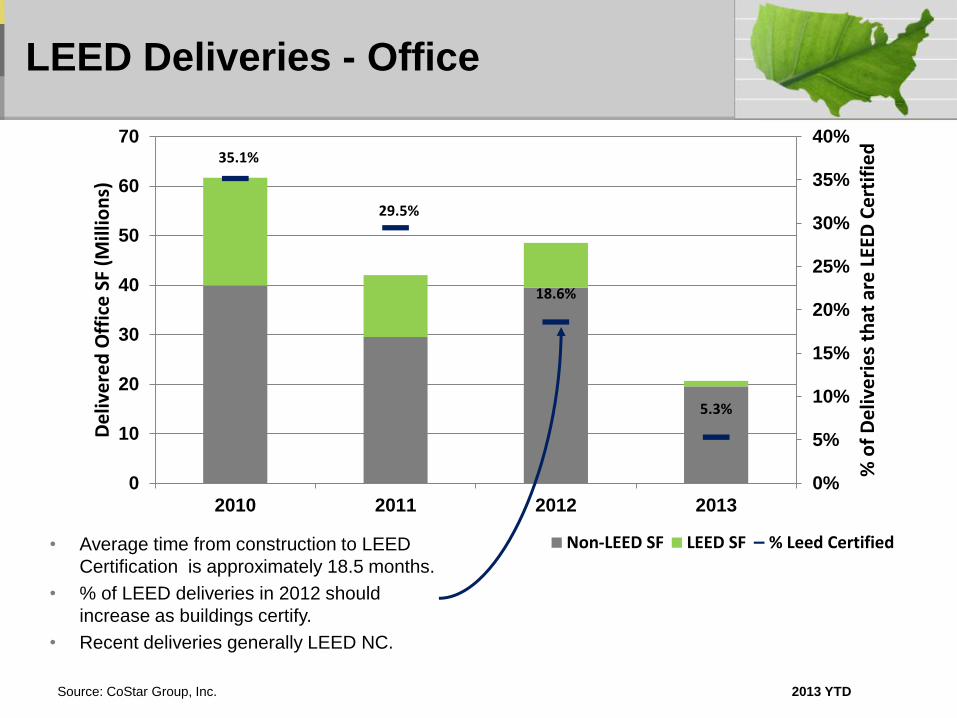
LEED Deliveries - Office
35.1%
29.5%
18.6%
5.3%
0%
5%
10%
15%
20%
25%
30%
35%
40%
0
10
20
30
40
50
60
70
2010 2011 2012 2013
% o
f D
eliv
eri
es
that
are
LEE
D C
ert
ifie
d
De
live
red
Off
ice
SF
(Mill
ion
s)
Non-LEED SF LEED SF % Leed Certified• Average time from construction to LEED
Certification is approximately 18.5 months.
• % of LEED deliveries in 2012 should
increase as buildings certify.
• Recent deliveries generally LEED NC.
Source: CoStar Group, Inc. 2013 YTD
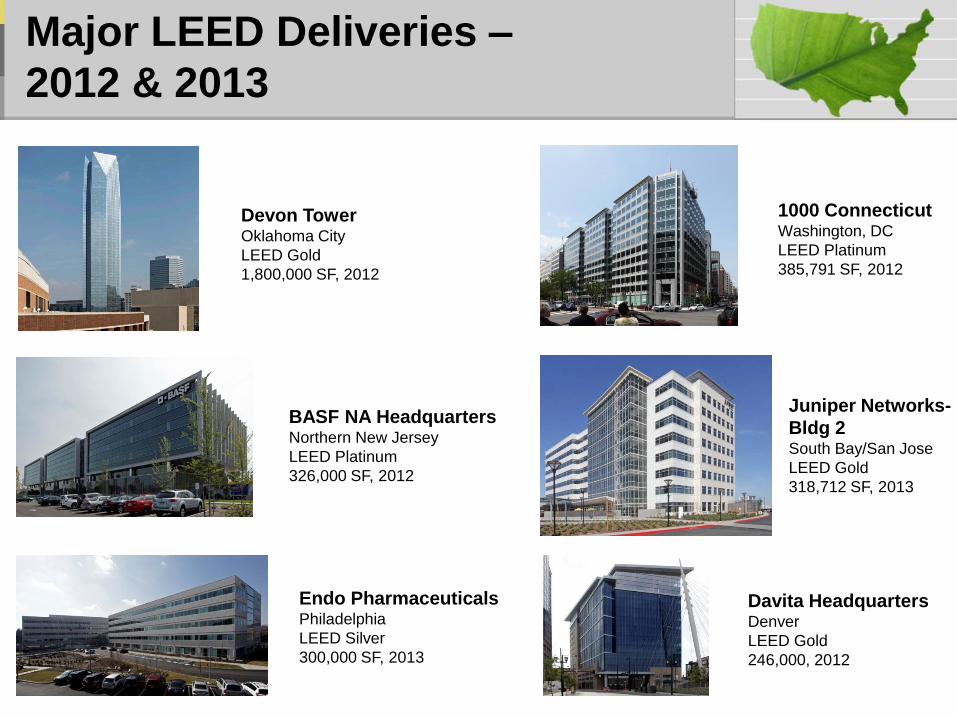
Major LEED Deliveries –
2012 & 2013
Devon Tower Oklahoma City
LEED Gold
1,800,000 SF, 2012
Endo Pharmaceuticals Philadelphia
LEED Silver
300,000 SF, 2013
1000 Connecticut Washington, DC
LEED Platinum
385,791 SF, 2012
Juniper Networks-
Bldg 2 South Bay/San Jose
LEED Gold
318,712 SF, 2013
BASF NA Headquarters Northern New Jersey
LEED Platinum
326,000 SF, 2012
Davita Headquarters Denver
LEED Gold
246,000, 2012
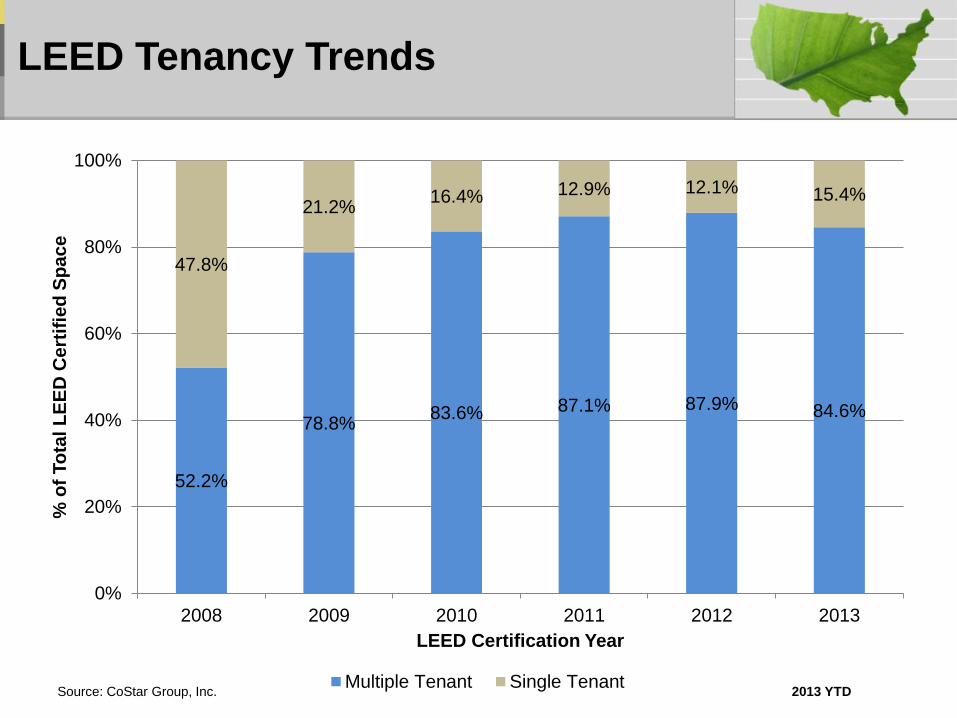
LEED Tenancy Trends
Source: CoStar Group, Inc. 2013 YTD
52.2%
78.8% 83.6% 87.1% 87.9% 84.6%
47.8%
21.2% 16.4% 12.9% 12.1% 15.4%
0%
20%
40%
60%
80%
100%
2008 2009 2010 2011 2012 2013
% o
f To
tal L
EE
D C
ert
ifie
d S
pa
ce
LEED Certification Year
Multiple Tenant Single Tenant
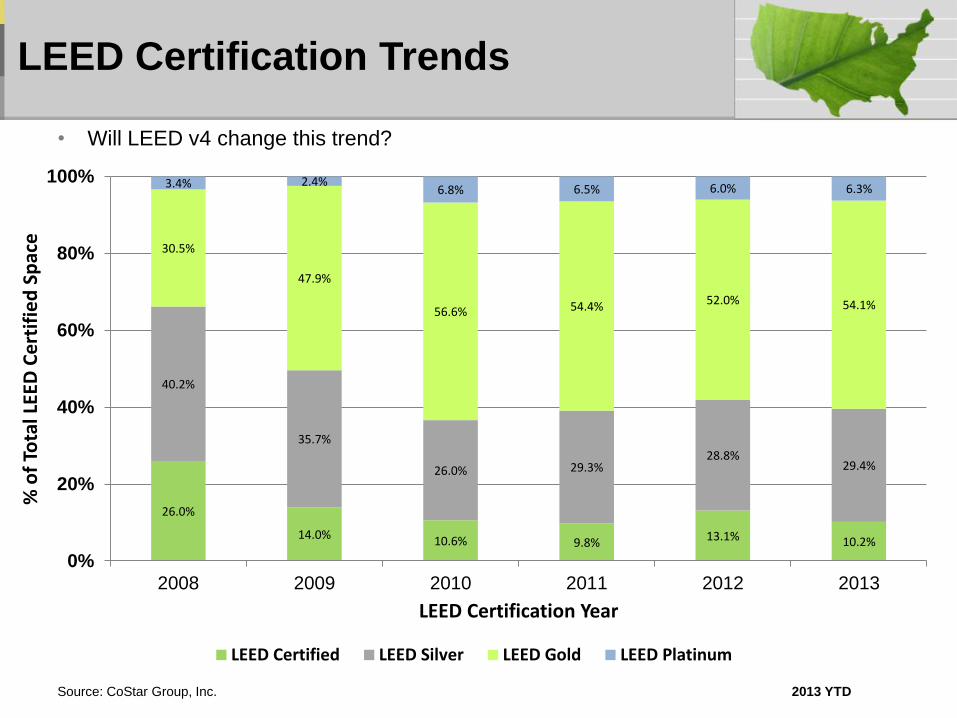
LEED Certification Trends
Source: CoStar Group, Inc.
26.0%
14.0% 10.6% 9.8% 13.1% 10.2%
40.2%
35.7%
26.0% 29.3% 28.8%
29.4%
30.5%
47.9%
56.6% 54.4% 52.0% 54.1%
3.4% 2.4% 6.8% 6.5% 6.0% 6.3%
0%
20%
40%
60%
80%
100%
2008 2009 2010 2011 2012 2013
% o
f To
tal L
EED
Ce
rtif
ied
Sp
ace
LEED Certification Year
LEED Certified LEED Silver LEED Gold LEED Platinum
2013 YTD
• Will LEED v4 change this trend?
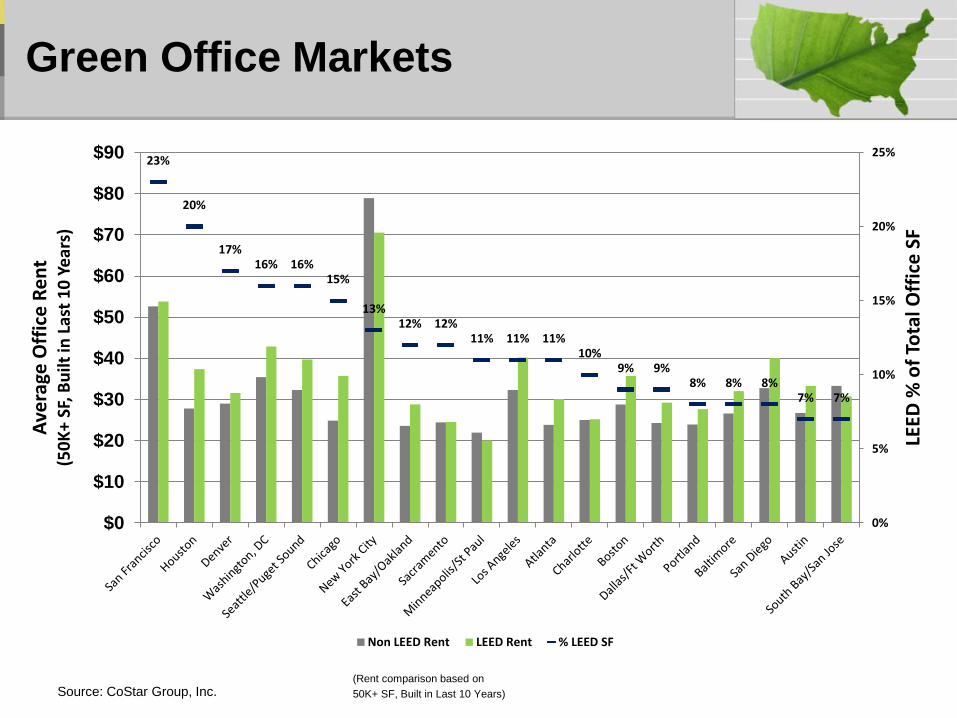
Green Office Markets
23%
20%
17% 16% 16%
15%
13% 12% 12%
11% 11% 11% 10%
9% 9% 8% 8% 8%
7% 7%
0%
5%
10%
15%
20%
25%
$0
$10
$20
$30
$40
$50
$60
$70
$80
$90
LEED
% o
f To
tal O
ffic
e S
F
Ave
rage
Off
ice
Re
nt
(50
K+
SF, B
uilt
in L
ast
10
Ye
ars)
Non LEED Rent LEED Rent % LEED SF
Source: CoStar Group, Inc. (Rent comparison based on
50K+ SF, Built in Last 10 Years)
Greg Kats
© Copyright 2013 CoStar Group, Inc.
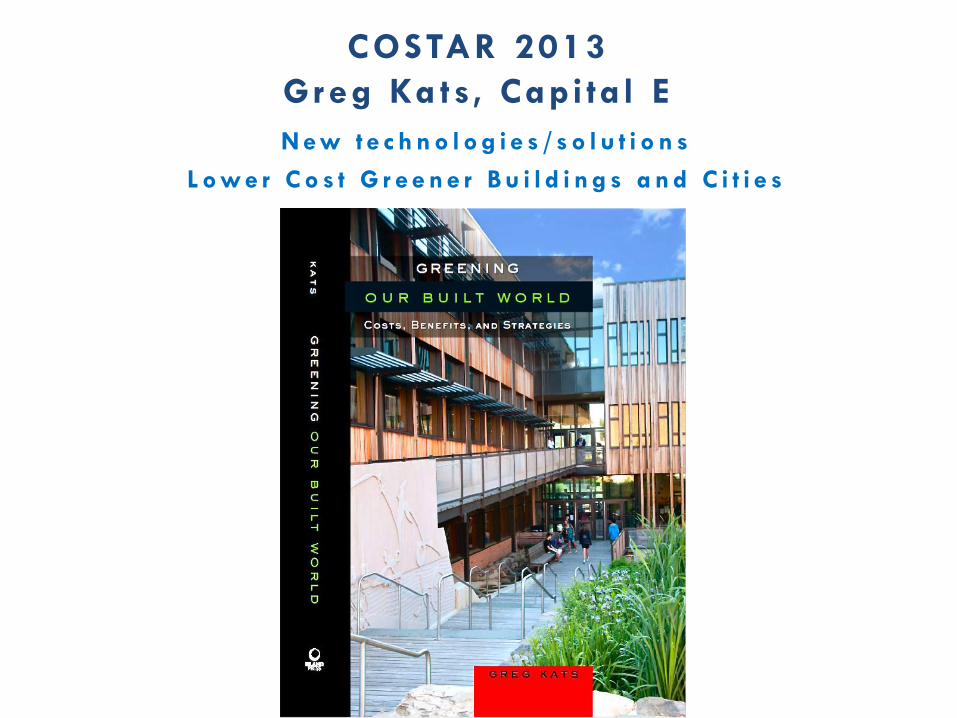
N ew t e c h n o l o g i e s / s o l u t i o n s
L ow e r C o s t G r e e n e r B u i l d i n g s a n d C i t i e s
COSTAR 2013
Greg Ka ts, Capi ta l E
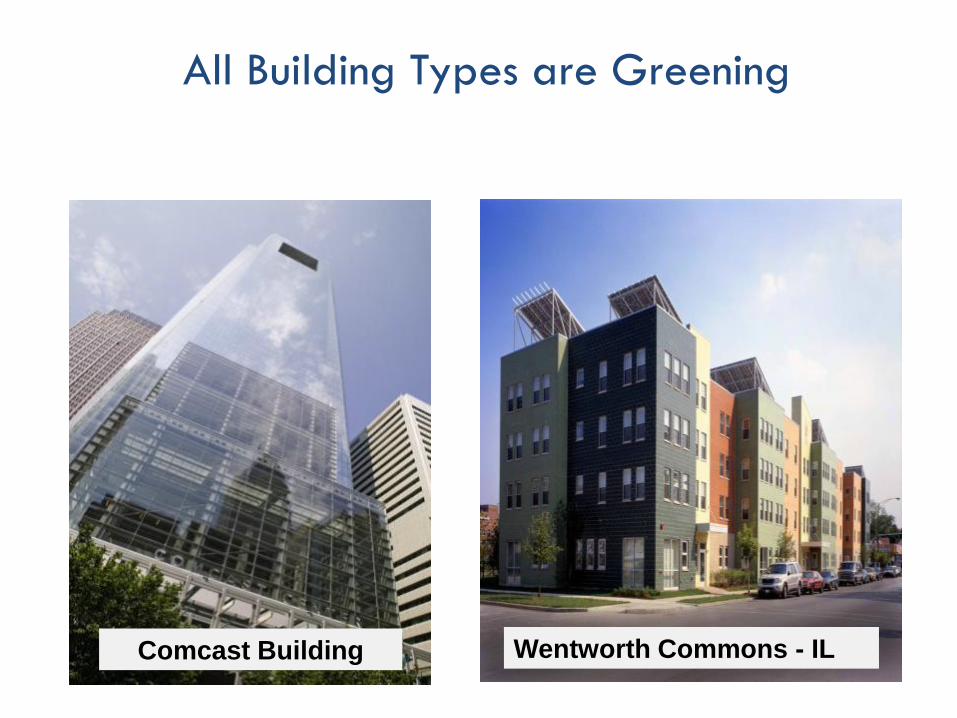
Comcast Building
All Building Types are Greening
Wentworth Commons - IL
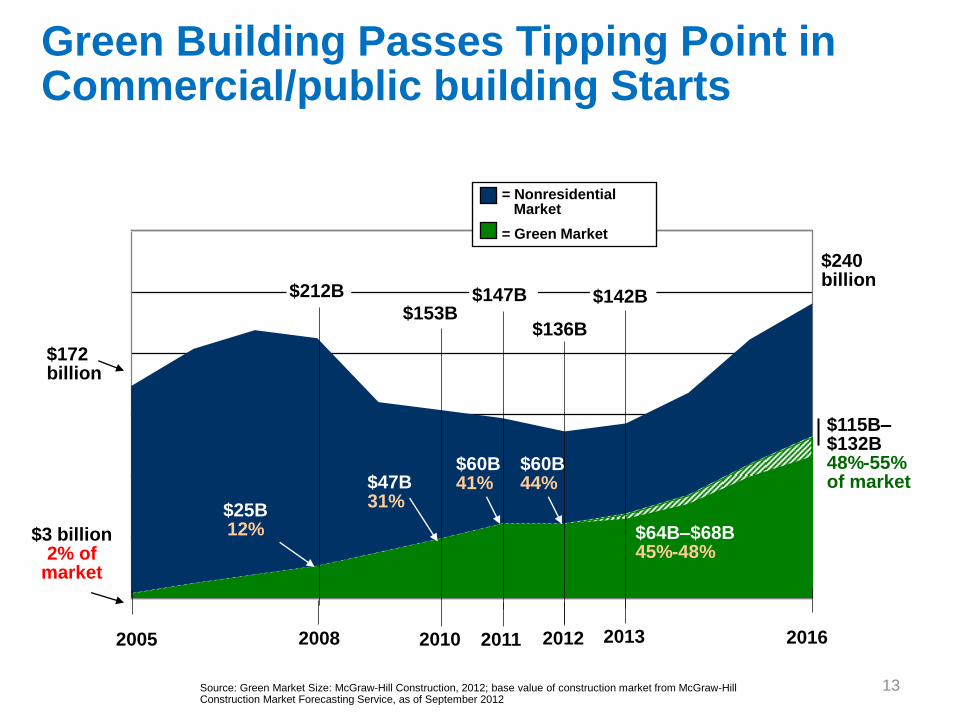
13 13
2005 2008 2010 2016
= Nonresidential Market
$172 billion
$3 billion 2% of
market
$60B 41%
$212B
= Green Market
$153B
$240 billion
$25B 12%
Green Building Passes Tipping Point in Commercial/public building Starts
$136B
$47B 31%
2011 2013
$60B 44%
$64B–$68B 45%-48%
$115B– $132B 48%-55% of market
$142B $147B
2012
Source: Green Market Size: McGraw-Hill Construction, 2012; base value of construction market from McGraw-Hill Construction Market Forecasting Service, as of September 2012
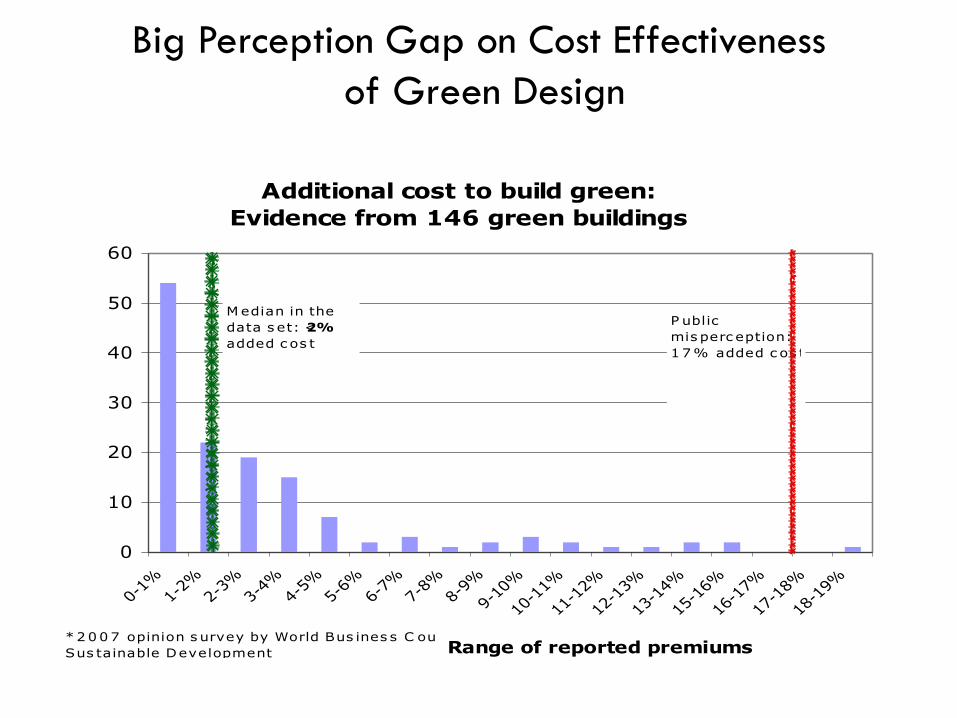
Big Perception Gap on Cost Effectiveness
of Green Design
Additional cost to build green:
Evidence from 146 green buildings
0
10
20
30
40
50
60
0-1%
1-2%
2-3%
3-4%
4-5%
5-6%
6-7%
7-8%
8-9%
9-10
%
10-1
1%
11-1
2%
12-1
3%
13-1
4%
15-1
6%
16-1
7%
17-1
8%
18-1
9%
Range of reported premiums
# o
f bu
ildin
gs in
data
set
M edian in the
data s et: <2%
added c os t
P ublic
mis perc eption:
17% added c os t*
*2007 opinion s urvey by World Bus ines s C ounc il for
Sus tainable Development
15 Source: Carnegie Mellon University Center for Building Performance
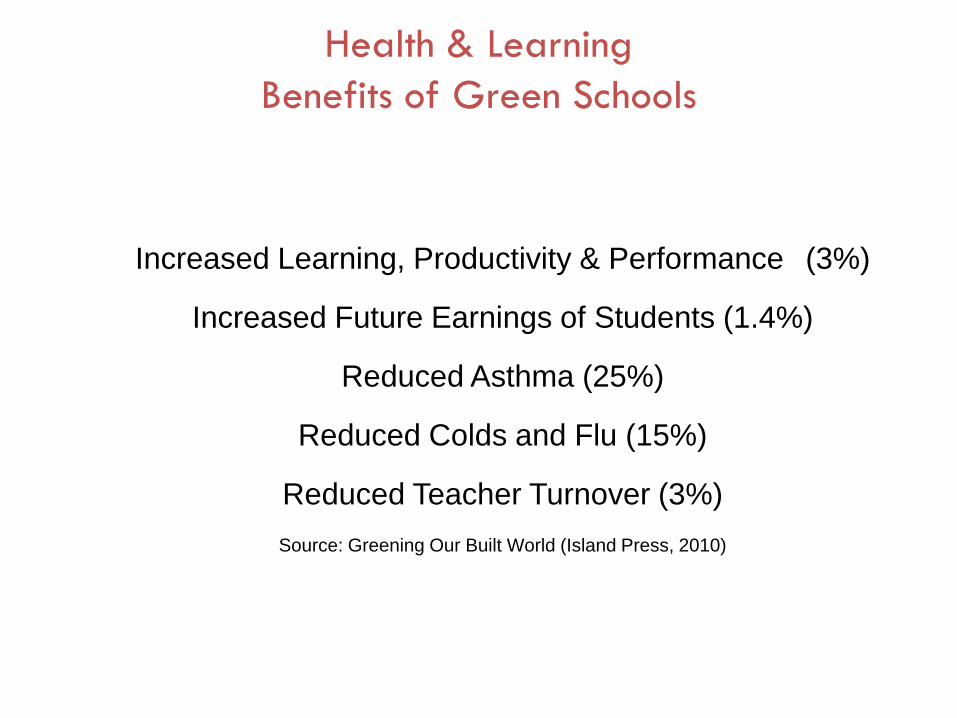
Health & Learning
Benefits of Green Schools
Increased Learning, Productivity & Performance (3%)
Increased Future Earnings of Students (1.4%)
Reduced Asthma (25%)
Reduced Colds and Flu (15%)
Reduced Teacher Turnover (3%)
Source: Greening Our Built World (Island Press, 2010)
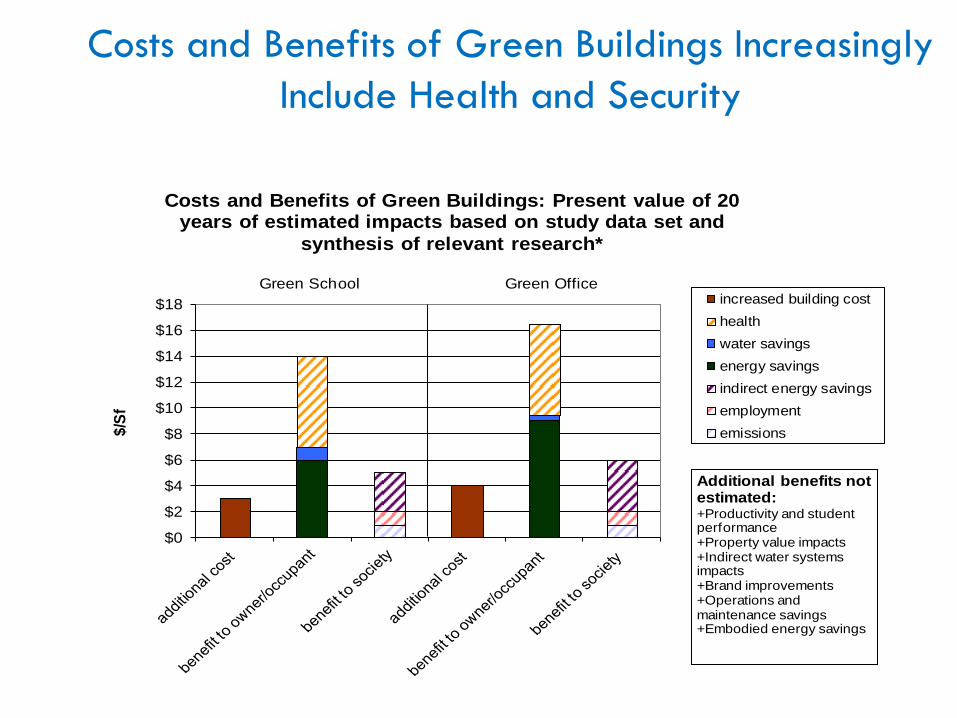
$0
$2
$4
$6
$8
$10
$12
$14
$16
$18
$/S
f
Costs and Benefits of Green Buildings: Present value of 20 years of estimated impacts based on study data set and
synthesis of relevant research*
increased building cost
health
water savings
energy savings
indirect energy savings
employment
emissions
Green School Green Office
Additional benefits not estimated:+Productivity and student performance+Property value impacts+Indirect water systems impacts+Brand improvements+Operations and maintenance savings+Embodied energy savings
Costs and Benefits of Green Buildings Increasingly
Include Health and Security
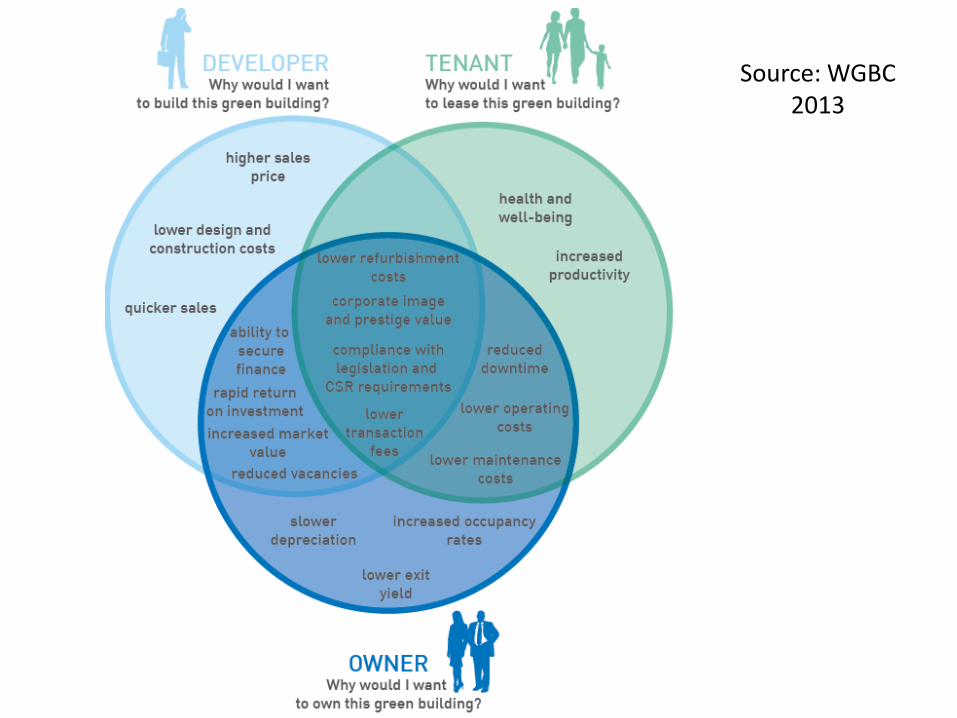
Source: WGBC 2013
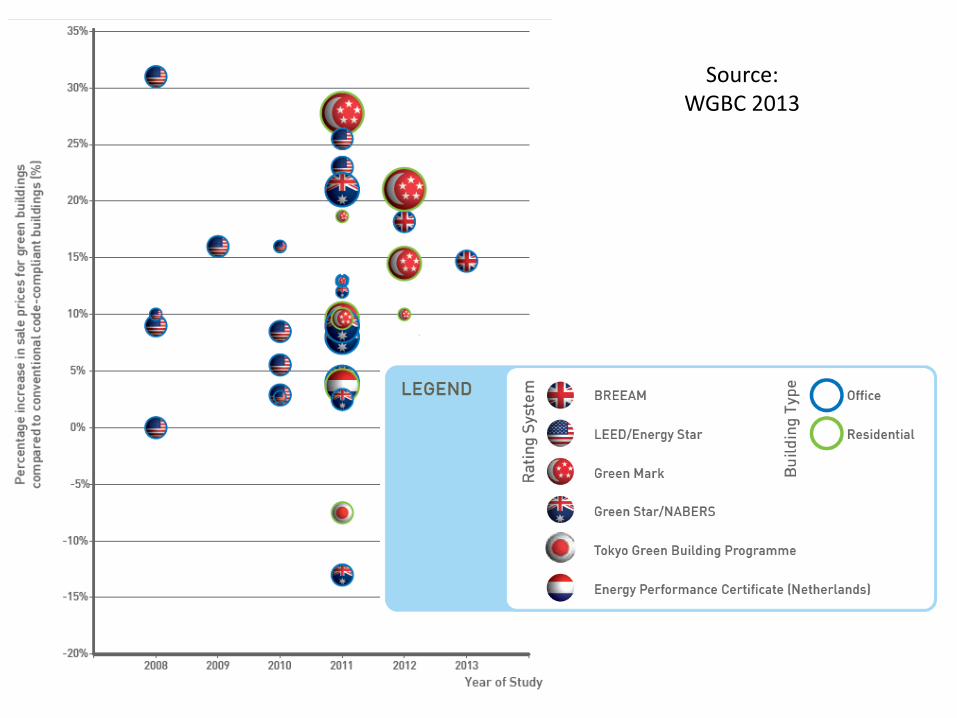
Source: WGBC 2013
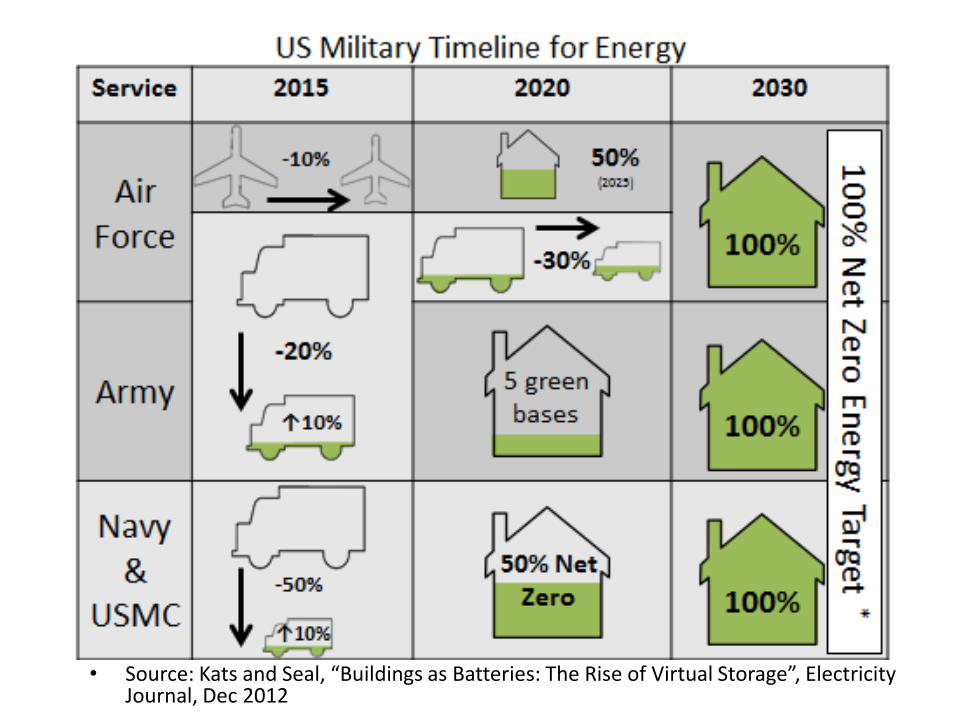
• Source: Kats and Seal, “Buildings as Batteries: The Rise of Virtual Storage”, Electricity Journal, Dec 2012
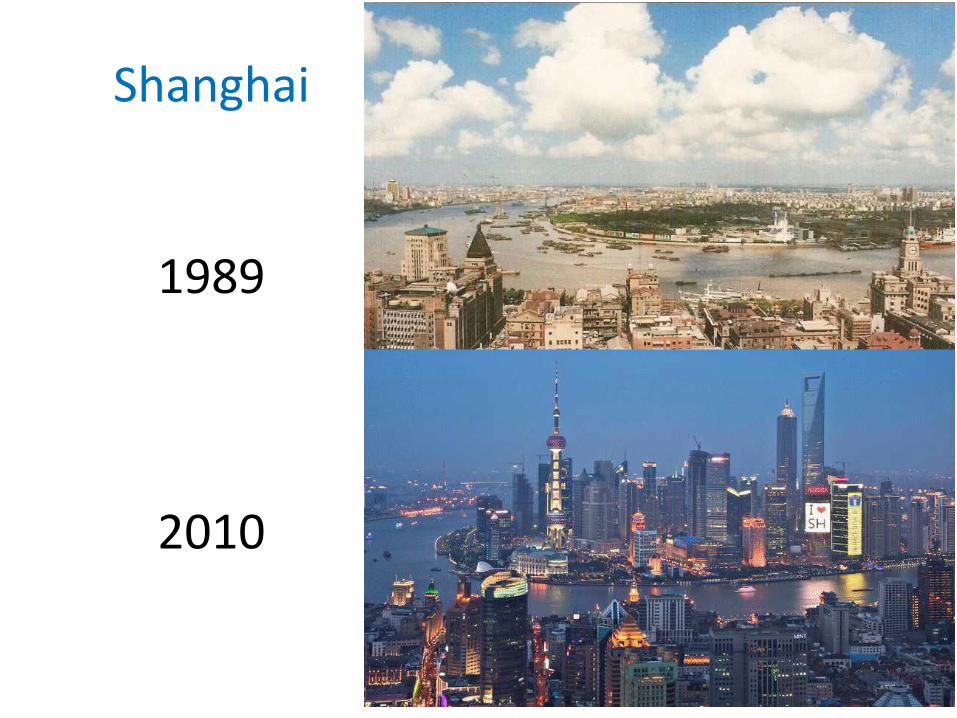
Shanghai
1989
2010
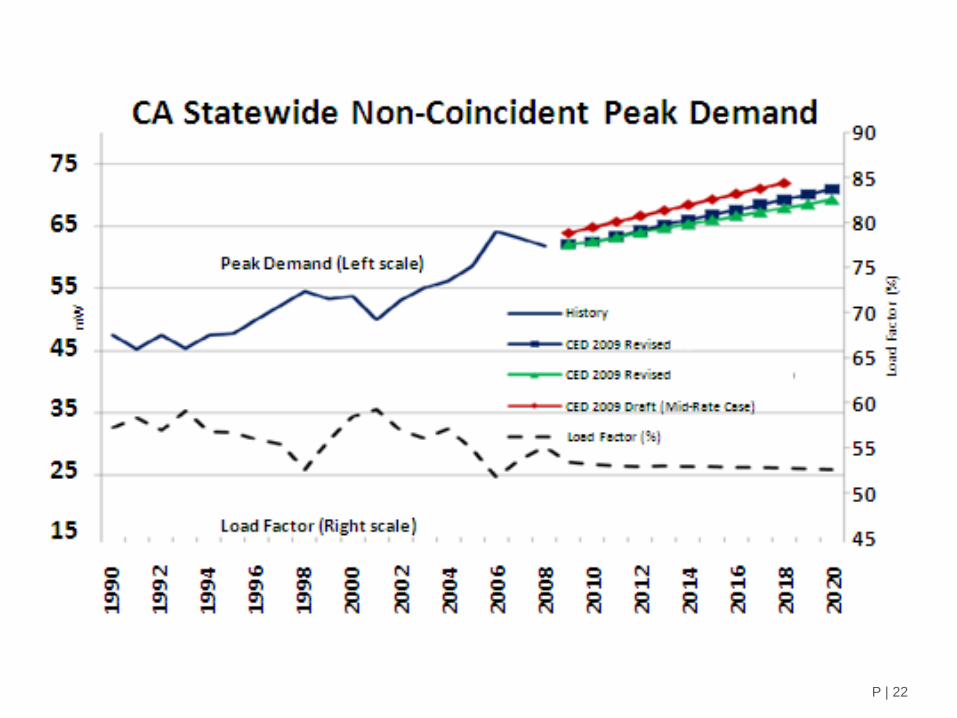
P | 22
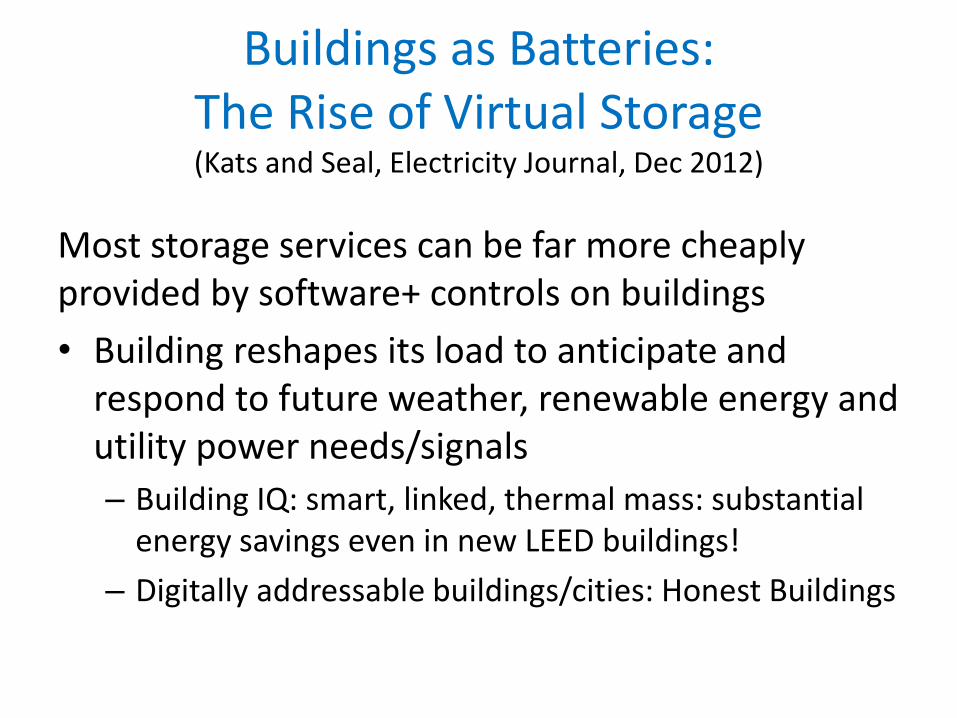
Buildings as Batteries: The Rise of Virtual Storage (Kats and Seal, Electricity Journal, Dec 2012)
Most storage services can be far more cheaply provided by software+ controls on buildings
• Building reshapes its load to anticipate and respond to future weather, renewable energy and utility power needs/signals
– Building IQ: smart, linked, thermal mass: substantial energy savings even in new LEED buildings!
– Digitally addressable buildings/cities: Honest Buildings
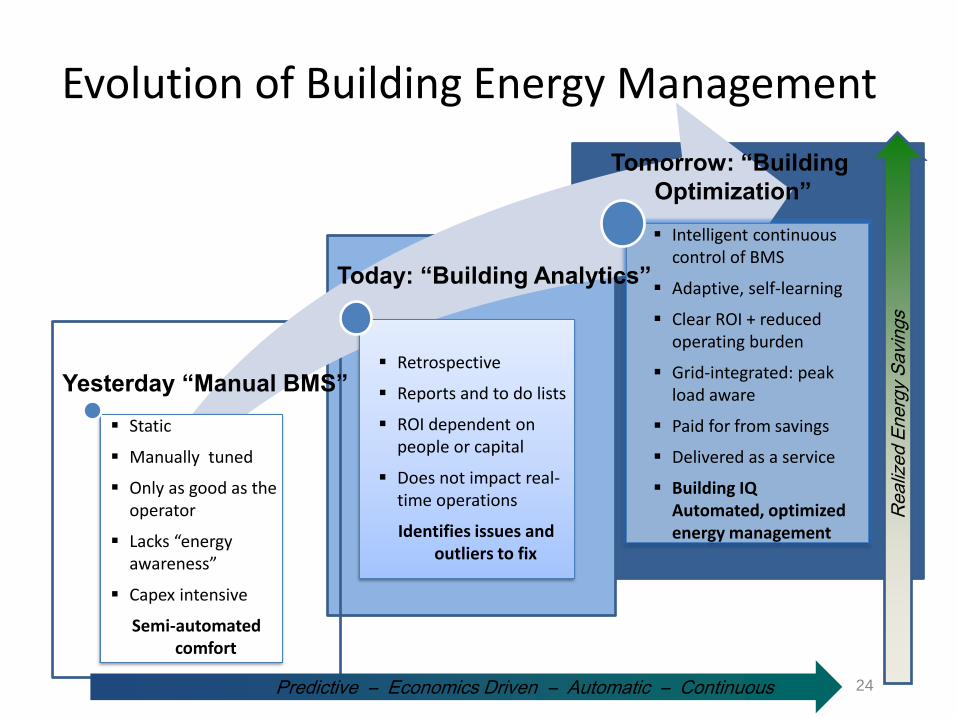
Evolution of Building Energy Management
BuildingIQ 24
Static
Manually tuned
Only as good as the operator
Lacks “energy awareness”
Capex intensive
Semi-automated comfort
Retrospective
Reports and to do lists
ROI dependent on people or capital
Does not impact real-time operations
Identifies issues and outliers to fix
Intelligent continuous control of BMS
Adaptive, self-learning
Clear ROI + reduced operating burden
Grid-integrated: peak load aware
Paid for from savings
Delivered as a service
Building IQ Automated, optimized energy management
Yesterday “Manual BMS”
Today: “Building Analytics”
Tomorrow: “Building
Optimization”
Re
aliz
ed
En
erg
y S
avin
gs
Predictive – Economics Driven – Automatic – Continuous
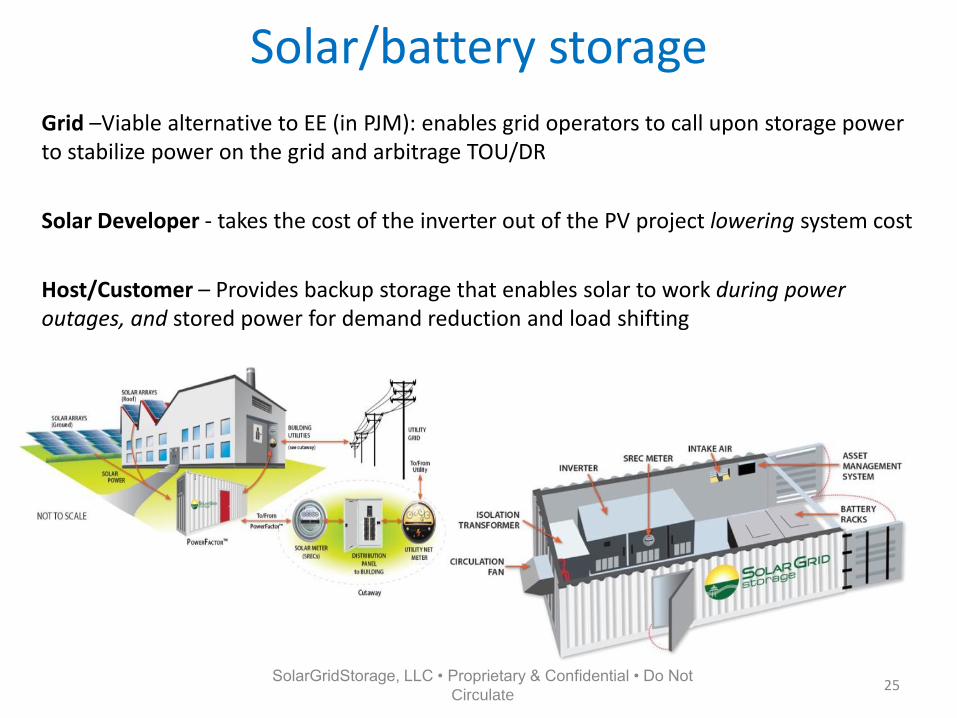
Solar/battery storage
Grid –Viable alternative to EE (in PJM): enables grid operators to call upon storage power to stabilize power on the grid and arbitrage TOU/DR
Solar Developer - takes the cost of the inverter out of the PV project lowering system cost
Host/Customer – Provides backup storage that enables solar to work during power outages, and stored power for demand reduction and load shifting
25 SolarGridStorage, LLC • Proprietary & Confidential • Do Not
Circulate
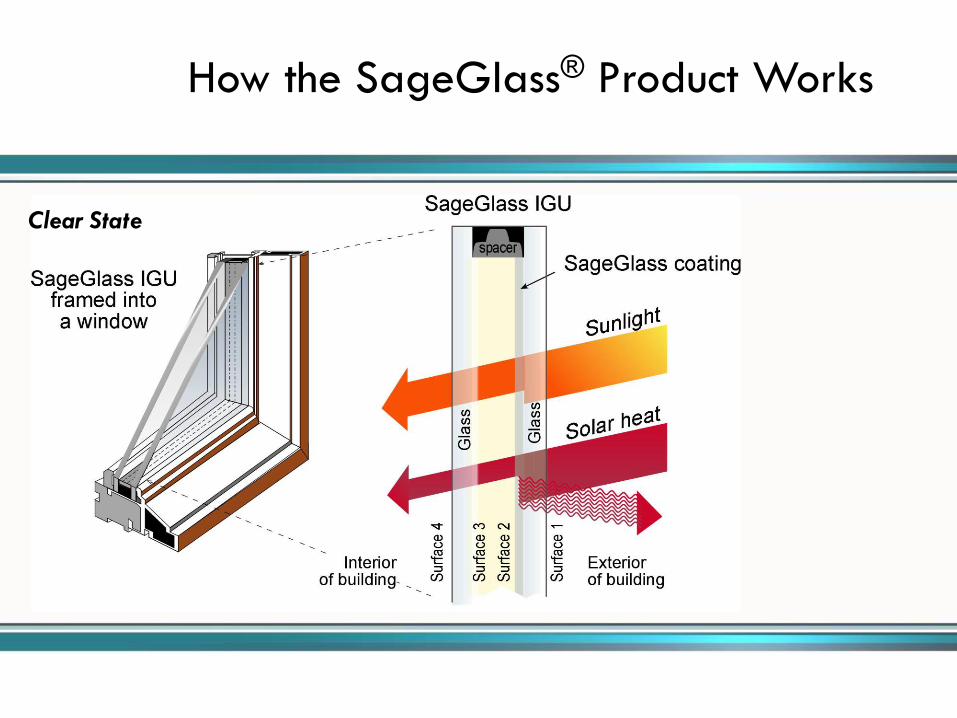
How the SageGlass® Product Works
Clear State
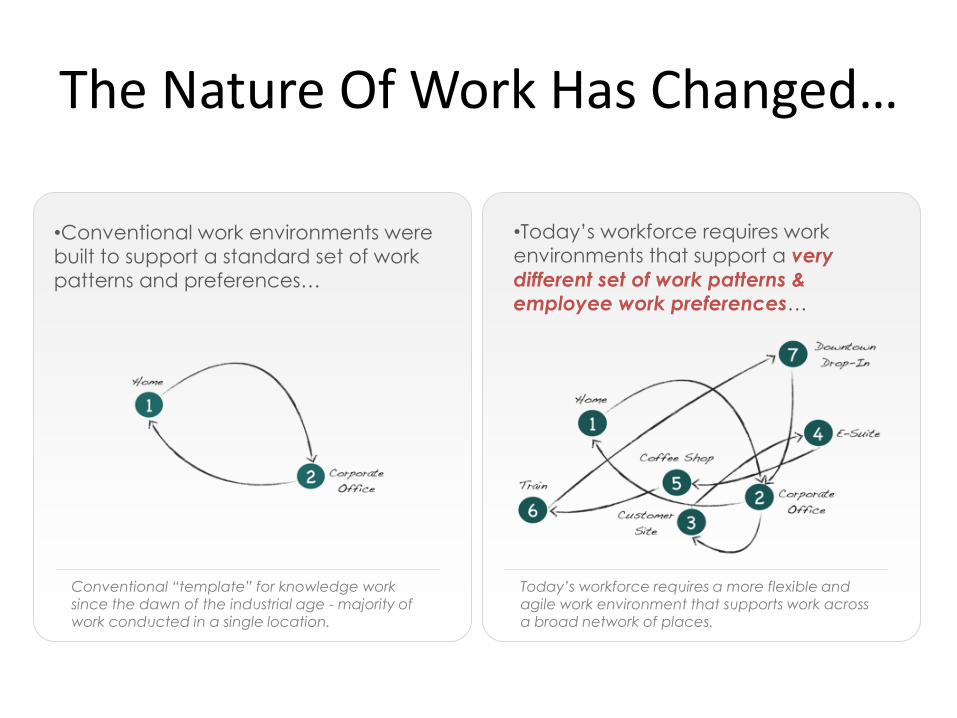
The Nature Of Work Has Changed…
Conventional “template” for knowledge work
since the dawn of the industrial age - majority of work conducted in a single location.
Today’s workforce requires a more flexible and
agile work environment that supports work across a broad network of places.
•Today’s workforce requires work
environments that support a very
different set of work patterns & employee work preferences…
•Conventional work environments were
built to support a standard set of work
patterns and preferences…
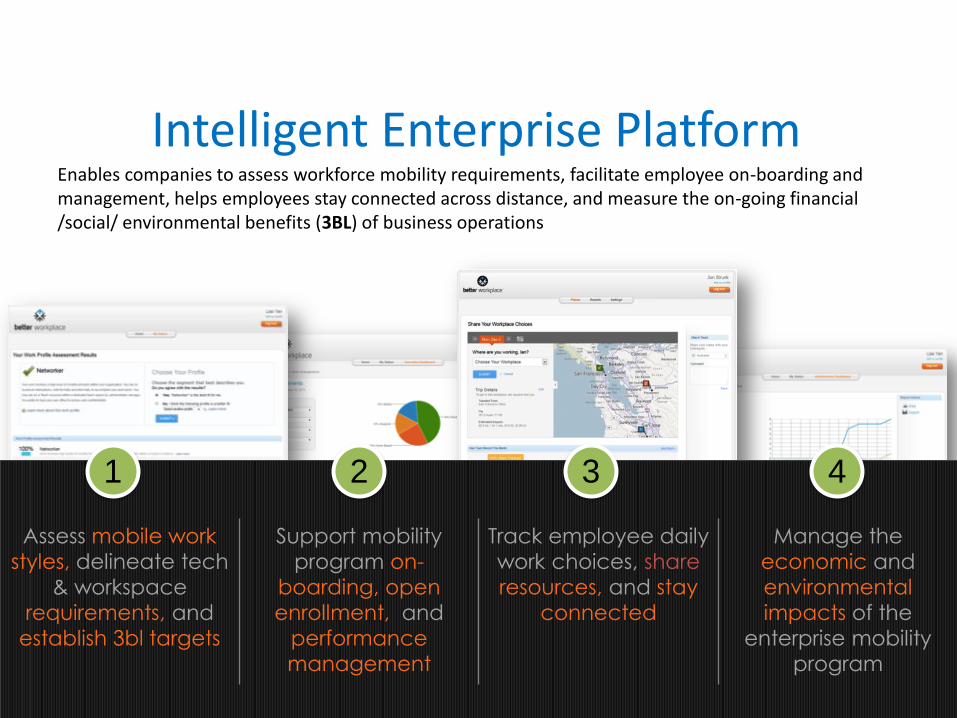
Assess mobile work
styles, delineate tech
& workspace
requirements, and
establish 3bl targets
Support mobility
program on-
boarding, open
enrollment, and
performance
management
Track employee daily
work choices, share
resources, and stay
connected
Manage the
economic and
environmental
impacts of the
enterprise mobility
program
1 2 3 4
Intelligent Enterprise Platform Enables companies to assess workforce mobility requirements, facilitate employee on-boarding and management, helps employees stay connected across distance, and measure the on-going financial /social/ environmental benefits (3BL) of business operations
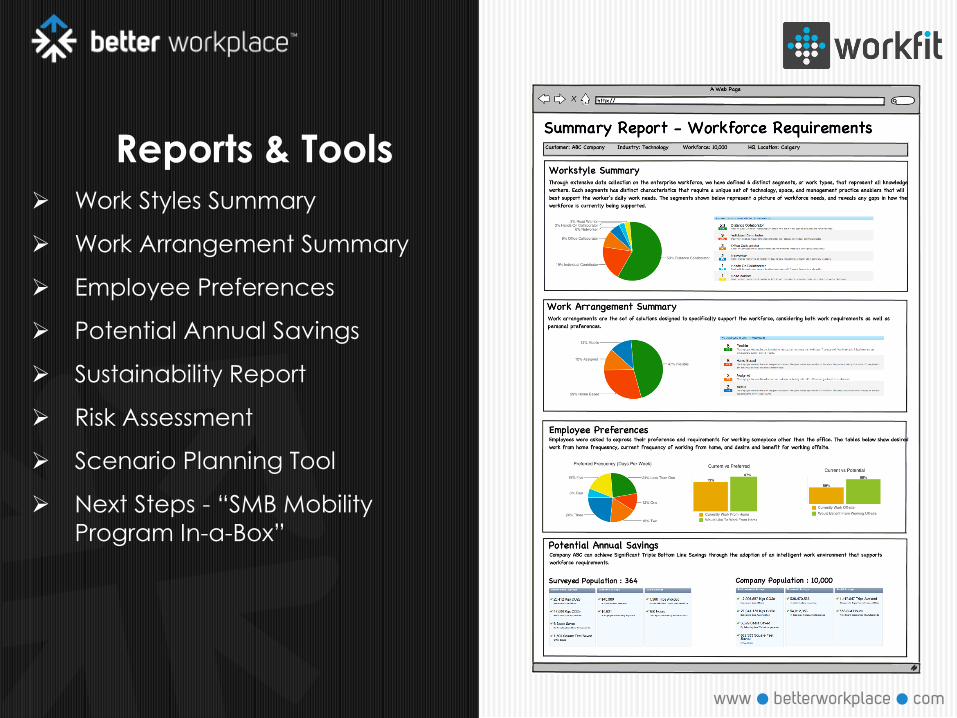
Reports & Tools
Work Styles Summary
Work Arrangement Summary
Employee Preferences
Potential Annual Savings
Sustainability Report
Risk Assessment
Scenario Planning Tool
Next Steps - “SMB Mobility
Program In-a-Box”
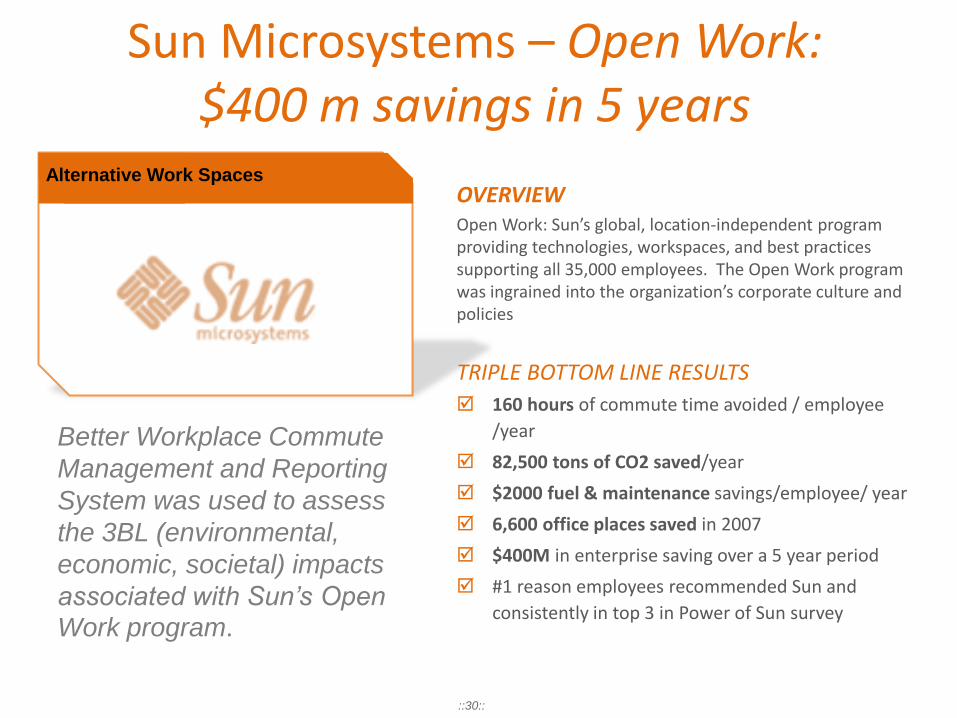
Sun Microsystems – Open Work: $400 m savings in 5 years
Better Workplace Commute
Management and Reporting
System was used to assess
the 3BL (environmental,
economic, societal) impacts
associated with Sun’s Open Work program.
OVERVIEW Open Work: Sun’s global, location-independent program providing technologies, workspaces, and best practices supporting all 35,000 employees. The Open Work program was ingrained into the organization’s corporate culture and policies
TRIPLE BOTTOM LINE RESULTS
160 hours of commute time avoided / employee
/year
82,500 tons of CO2 saved/year
$2000 fuel & maintenance savings/employee/ year
6,600 office places saved in 2007
$400M in enterprise saving over a 5 year period
#1 reason employees recommended Sun and
consistently in top 3 in Power of Sun survey
Alternative Work Spaces
::30::
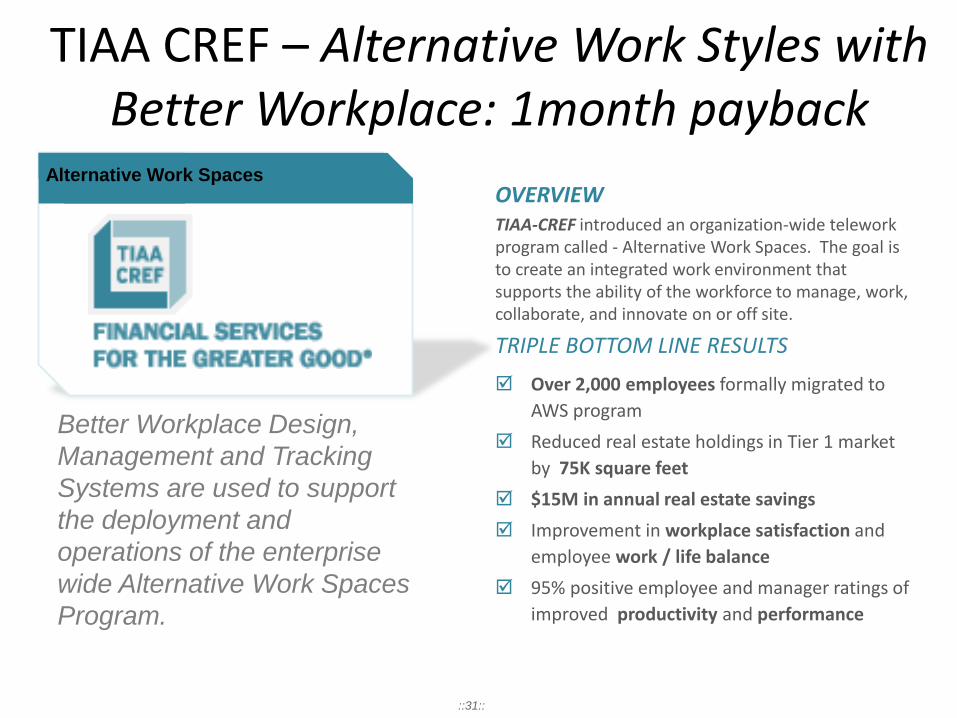
TIAA CREF – Alternative Work Styles with Better Workplace: 1month payback
Better Workplace Design,
Management and Tracking
Systems are used to support
the deployment and
operations of the enterprise
wide Alternative Work Spaces
Program.
OVERVIEW TIAA-CREF introduced an organization-wide telework program called - Alternative Work Spaces. The goal is to create an integrated work environment that supports the ability of the workforce to manage, work, collaborate, and innovate on or off site.
TRIPLE BOTTOM LINE RESULTS
Over 2,000 employees formally migrated to
AWS program
Reduced real estate holdings in Tier 1 market
by 75K square feet
$15M in annual real estate savings
Improvement in workplace satisfaction and
employee work / life balance
95% positive employee and manager ratings of
improved productivity and performance
Alternative Work Spaces
::31::
Thank you!
www.cap-e.com
www.betterworkplace.com

Your Questions
© Copyright 2013 CoStar Group, Inc.