cost effectiveness of phosphorus removal processes in ... · cost effectiveness of phosphorus...
TRANSCRIPT

lable at ScienceDirect
Chemosphere 197 (2018) 280e290
Contents lists avai
Chemosphere
journal homepage: www.elsevier .com/locate/chemosphere
Cost effectiveness of phosphorus removal processes in municipalwastewater treatment
Rania Bashar a, Kerem Gungor b, K.G. Karthikeyan a, *, Phillip Barak c
a Department of Biological Systems Engineering, University of Wisconsin-Madison, WI 53706, USAb Maine Department of Environmental Protection, Bureau of Land Resources, ME 04333, USAc Department of Soil Science, University of Wisconsin-Madison, WI 53706, USA
h i g h l i g h t s
� IFAS-EBPR is the most cost-effective system ($42.25/lb-P removed; Peff¼ 0.82mg/L).� MBR systems are the least cost-effective ($60.89/lb-P removed; Peff¼ 1.02mg/L).� Tertiary filtration (high investment) is cost effective due to low Peff¼ 0.05mg/L.� Side stream struvite recovery is not helpful in meeting stringent effluent TP limits.� Due to high capital and maintenance costs, MBR systems are not cost effective.
a r t i c l e i n f o
Article history:Received 19 September 2017Received in revised form11 December 2017Accepted 26 December 2017Available online 10 January 2018
Handling Editor: A Adalberto Noyola
Keywords:Biological phosphorus removalPhosphorus recoveryCost of phosphorus removalWWTP sustainabilityEnergy requirementsWaste resource recovery
* Corresponding author.E-mail address: [email protected] (K.G. Kart
https://doi.org/10.1016/j.chemosphere.2017.12.1690045-6535/© 2018 Elsevier Ltd. All rights reserved.
a b s t r a c t
Meeting stringent phosphorus (P) discharge standards remains one of the major challenges for waste-water utilities due to increased economic burdens associated with advanced (i.e., secondary, tertiary)treatment processes. In a trade-off between higher treatment cost and enhanced P removal, it is criticalfor the treatment plants to be able to select the most appropriate technology. To this end, established/emerging high performing P removal/recovery technologies (e.g., Modified University of Cape Towneprocess, Bardenpho process, membrane bioreactors, IFAS-EBPR, struvite recovery, tertiary reactive mediafiltration) were identified and full-scale treatment plant designs were developed. Using advancedmathematical modeling techniques, six different treatment configurations were evaluated in terms ofperformance and cost effectiveness ($/lb of P removed). Results show that the unit cost for P removal indifferent treatment alternatives range from $42.22 to $60.88 per lb of P removed. The MUCTBNR þ tertiary reactive media filtration proved to be one of the most cost effective configurations($44.04/lb P removed) delivering an effluent with total P (TP) concentration of only 0.05 mg/L. Althoughstruvite recovery resulted in significant reduction in biosolids P, the decrease in effluent TP was notsufficient to meet very stringent discharge standards.
© 2018 Elsevier Ltd. All rights reserved.
1. Introduction
The social, economic and environmental issues associated withuncontrolled phosphorus (P) release to surface waters have beenrecognized for decades (Chislock et al., 2013). Consequently,increasing regulatory impetus to reduce P release to the environ-ment has resulted in tightening of discharge permit limits formunicipal wastewater treatment plants (WWTPs). With this
hikeyan).
continuing trend, there has been an ongoing need for investment(i.e., infrastructure, chemical, energy) to efficiently remove/manageP in domestic wastewater. With the world's increasing populationand growing energy crisis, modern WWTPs are also faced with thenew challenge of shifting to sustainable, and energy/ resourcepositive operations (Wang et al., 2017a). Currently, significant ef-forts are being expended to integrate low-energy consumptionprocesses with resource (e.g., energy, nutrients) recovery inwastewater treatment layouts (Chen et al., 2015). To address thehuge challenge of ensuring sustainable treatment and simulta-neous maximum pollutant removal, careful assessment of treat-ment cost will be required.

Nomenclature
WWTP wastewater treatment plantTP total phosphorusBNR biological nutrient removalAOB ammonia oxidizing bacteriaGHG greenhouse gasPOTW publicly owned treatment worksEBPR enhanced biological phosphorus removalMBR membrane bioreactorWAS waste activated sludgeSRT solids retention timeHRT hydraulic retention timeMUCT Modified University of Cape TowneIFAS integrated fixed-film activated sludgePAO polyphosphate accumulating organismTMDL total maximum daily load
R. Bashar et al. / Chemosphere 197 (2018) 280e290 281
Several established and emerging P removal technologies havebeen practiced on full-scale systems. Among the established Premoval technologies, enhanced biological phosphorus removal(EBPR) and chemical precipitation have the most widespread use(Pratt et al., 2012). However, biological treatment schemes usesubstantial amount of energy for aeration (Foley et al., 2010). Thesesystems are also known to be inconsistent in achieving low Pconcentrations in the effluent (Oehmen et al., 2007; Pratt et al.,2012). Chemical P removal is generally an expensive treatmentoption and these systems are known to increase sludge production.Also, PO4
3� forms a strong bond with Al3þ and Fe3þ metal ionswhich often reduces its plant availability in the biosolids (Tian et al.,2016).
Few emerging alternative P removal technologies implementedon a full-scale basis that show great promise include: (i) Membranebioreactors (MBRs), (ii) Integrated Fixed-Film Activated SludgeSystems with Enhanced Biological Phosphorus removal (IFAS-EBPR), and (iii) Continuous flow, no backwash, upflow, deep-bedgranular media filters (USEPA, 2013). MBRs have gained popu-larity over the last 10e15 years due to smaller footprint and abilityto meet stringent discharge limits with high process reliability(Smith et al., 2015). However, membrane fouling remains a criticalobstacle for widespread implementation of MBRs as it decreasesthe membrane lifespan and increases energy requirements forsludge recirculation. IFAS-EBPR is a hybrid process that enablesseparate solids retention time (SRT) control for slower growingnitrifiers and faster growing heterotrophs (i.e., denitrifiers or Pol-yphosphate Accumulating Organisms (PAOs)), which is a significantadvantage over conventional biological processes (Bai et al., 2016).Continuous backwash, upflow, deep-bed granular media filter unitscombine co-precipitation and adsorption of P on a reactive mediafilter (USEPA, 2013). Full-scale implementations of this technologyfor tertiary treatment are meeting effluent total P (TP) limits of0.05mg/L (USEPA, 2007).
Over the past 20 years though, P found in wastewater streamshas been recognized as a recoverable product rather than apollutant (Desmidt et al., 2013). Several P recovery technologieshave been developed that can produce high-grade P minerals, inthe form of struvite or Ca phosphate, for use as fertilizer. Currently,fourteen full-scale struvite recovery systems are operational inNorth America (Ostara, 2017) with most of the commercially-available processes primarily implemented on the side streams.
A major focus of the Federal Water Pollution Control Act and its
amendments has been to improve surface water quality throughcontrol of point source P inputs from wastewater treatment plantsto waterbodies. A review of USEPA's Discharge Monitoring Report(DMR) data shows that states like Florida, Michigan, New Hamp-shire, Massachusetts, Maryland, Delaware and Vermont havealready set P permit limits for more than 40% of the publicly ownedtreatment works (POTWs). Among these states, Massachusetts(0.1mg/L), New Hampshire (0.2mg/L), Michigan (0.3mg/L) andMaryland (0.3mg/L) have the lowest TP permit limits for one ormore POTWs (USEPA, 2017). Currently, most US treatment plantshave a TP limit in the range of 0.5e1.5mg/L. With the USEPAfocusing towards allotment of total maximum daily loads (TMDL)for P management in river basins, it is evident that future dischargelimits will be increasingly more stringent. Restricting P loads fromdischargers will inevitably exert a significant financial burden onthe municipalities. Greater emphasis will also be placed on recov-ering P from wastewater due to its worldwide dwindling high-quality supplies (Desmidt et al., 2013). To keep up with the futuretrends, it is very important for the treatment facilities to identifyopportunities for upgrade and develop robust long-range economicplans.
To date, not much research has been conducted to compare theoperational and economic advantages/disadvantages of establishedand emerging P removal systems. Several studies have examinedestablished competing P removal configurations in terms of per-formance and cost effectiveness (Falk et al., 2013; Hao et al., 2001;Jiang et al., 2004, 2005; Ohio EPA, 2013; WSDOE, 2011; Zhang et al.,2009). Jiang et al. (2004, 2005) estimated the cost of P removal frommunicipal wastewater for facilities constructed de novo and adap-tation of existing facilities. From the analysis, they concluded thatfor an effluent TP concentration between 0.5 and 2.0mg/L, acti-vated sludge (AS) process followed by alum addition is the mosteconomical configuration. However, under a TP limit of 0.13mg/L,three step Biological nutrient removal (BNR), chemical addition andtertiary filtration was found to be the most cost effective configu-ration for a large treatment facility (>10 MGD) by Jiang et al. (2004,2005). WSDOE (2011) includes cost curves that can be used to es-timate costs of certain treatment processes scaled to design ca-pacity. However, most of these studies are limited in scope in termsof the number of alternative process configurations considered.While the established treatment technologies (e.g., AS, chemicalprecipitation) were the main focus, emerging treatment alterna-tives (e.g., tertiary filtration, fixed film systems, membrane pro-cesses) were ignored in most studies. Also, recycling and recoveryof P from the sidestream was not considered, which is a significantlimitation.
Therefore, themajor goal of this study is to perform an advancedmathematical model based technical and economical evaluation ofthe high-performing P removal/recovery processes (secondary andtertiary) that have been implemented on full-scale systems. Thisgoal encompasses the following objectives/components:
1. Technical and economic evaluation of established and emergingsecondary P removal processes;
2. Technical and economic evaluation of implementing a sidestream P recovery system in conjunction with a mainstream Premoval process;
3. Evaluation of process modifications and incremental opera-tional costs to achieve a specific nutrient removal goal (effluentTP� 0.05mg/L) using tertiary treatment; and
4. Comparison of treatment technologies in terms of overallannual economic cost (total capital, operational and mainte-nance costs) and cost effectiveness ($/lb of P removed).

R. Bashar et al. / Chemosphere 197 (2018) 280e290282
2. Methodology
2.1. Treatment process scenarios and simulation
For the analysis, six full-scale treatment scenarios wereconsidered. Each configuration consisted of preliminary and pri-mary treatment, mainstream P removal, sludge line (thickening,dewatering and mesophilic anaerobic digestion of primary andwaste activated sludge), and biogas recovery from the sludge. Thesix P removal/recovery processes considered are: (i) ModifiedUniversity of Cape Towne (MUCT) process, (ii) five-stage BardenphoProcess, (iii) membrane bioreactors (MBRs), (iv) Integrated Fixed-Film Activated Sludge Systems with Enhanced Biological Phos-phorus Removal (IFAS-EBPR), (v) struvite recovery by chemicalprecipitation, and (vi) tertiary media filtration. Relevant publica-tions on nutrient removal systems by USEPA (Ohio EPA, 2013;USEPA, 2007) were reviewed to identify the above high perform-ing P removal/recovery technologies.
The general layouts of the whole plant process configurations
considered in this study are presented in Fig. 1. Scenario 1 (S1)represented MUCT process nutrient removal configuration (anaer-obic, primary anoxic, secondary anoxic and aerobic). This systemconsists of a two-step anoxic process to avoid the intrusion of ni-trate in the anaerobic zone, which results in enhanced P removalperformance (WEF, 2008).
Scenario 2 (S2) comprised “advanced” nutrient removal using 5-stage (anaerobic, primary anoxic, primary aerobic, secondaryanoxic, secondary aerobic) Bardenpho process configuration. TheBardenpho process has been implemented in many developed
Fig. 1. General layout of process flow diagrams for six treatment scenarios simulated inmesophilic anaerobic digestion) were common to all the treatment configurations. Secondafrom the anoxic reactor to tertiary media filter in S6.
countries for excellent nutrient (N & P) removal (Foley et al., 2010).
Scenario 3 (S3) involved a MUCT process activated sludge treat-
ment and a MBR. Scenario 4 (S4) represented an IFAS-EBPR processconfiguration with side-stream sludge treatment. The mainstreamP removal configuration simulated in S1 (i.e., MUCT process) wascoupled with side-stream P recovery from anaerobic digestate to
come up with Scenario 5 (S5). A similar full-scale treatmentconfiguration has been successfully implemented at the local NineSpringsWWTP (Madison, WI). The sludge from anaerobic digestionwas thickened and the supernatant containing elevated levels ofsoluble P entered the struvite precipitator. Magnesium chloride(MgCl2) was added in the struvite precipitator based on a 1:1 molarratio of the supernatant P feed. To maintain an operating pH of 8 inthe reactor, sodium hydroxide (NaOH) was also added to the
reactor. In Scenario 6 (S6), a reactive media filtration step (contin-uous backwash, upflow, deep-bed granular media filter) was addedto the process configuration considered in S1 to reduce the effluentTP level to 0.05mg/L. The secondary system in S6 is intended tolower effluent TP to � 1mg/L using biological treatment. This stepwas followed by hydrous ferric oxide (HFO) coated sand filters foradsorptive P removal. The reject stream from the filtration systemwas recycled to the secondary system to allow for P uptake by theexcess adsorptive capacity remaining in the HFOwaste particulates.The chemically-bound P was removed with the wasted sludge. Toregenerate adsorptive capacity of the HFO coated sand, ferricchloride (FeCl3) was dosed before the filters (Newcombe et al.,2006a, 2006b).
All six scenarios were constructed using a widely-used processmodel simulating software BioWin v. 5.2 (EnviroSim Associates
this study. Preliminary, primary, and sludge treatments (thickening, dewatering andry clarifier was replaced by MBR in S3. The ferric salt addition location was transferred

R. Bashar et al. / Chemosphere 197 (2018) 280e290 283
Ltd., Canada). BioWin uses an integrated kinetic model and massbalance approach, incorporating pH/alkalinity and general Acti-vated Sludge/Anaerobic Digestion Models (Envirosim, 2007). Themost recent version of the software (v. 5.2) also enables users toobtain a plant-wide inventory of power demand and operatingcost. Steady state simulations, with an effluent TP goal < 1mg/L andTotal Inorganic Nitrogen (TIN)< 8mg/L were performed for S1 toS5. Biological P removal processes were combined with chemically-assisted precipitation of P to reach the effluent goal where neces-sary. For S6, a stringent target effluent TP limit 0.05mg/L wasconsidered. These treatment objectives were selected based on thegenerally accepted performance of established and emergingnutrient removal technologies for municipal WWTPs, as suggestedin WSDOE (2011).
2.2. Calibration of P recovery module
To simulate struvite precipitation, BioWin's default chemicalprecipitation module (developed based on Musvoto et al., 2000)was calibrated and validated using literature data from full- and/orpilot-scale studies. The precipitation of struvite or magnesiumammonium phosphate (MAP) is expressed as:
Mg2þ þ NНþ4 þ PO3�
4 4MgNH4PO4 (1)
The rate of crystallization was expressed as (Musvoto et al.,2000):
ddt
½MgNH4PO4� ¼ RpreciphhMg2þ
i1=3hNHþ
4
i1=3hPO3�
4
i1=3
�ΚspMgNH4PO41=3
i3(2)
where:
Mg2þ, NH4þ and PO4
3� correspond to soluble magnesium,ammonium and phosphate speciesMgNH4PO4 represents struvite or MAP, andKspMgNH4PO4 is the struvite solubility product. In the abovemodel, the equation is valid only if [Mg2þ] 1/3[NH4
þ] 1/3 [PO43�] 1/3
>ΚspMgNH4PO41=3.
Three independent sets of experimental data (Battistoni et al.,2001; Jaffer et al., 2002; Pastor et al., 2010) were used for calibra-tion and three additional independent datasets (Pastor et al., 2008;Rahaman et al., 2008, 2014) were used for validation. The datasetfor calibration was chosen such that it covers a wide range of pH(7.5e8.9) andMg:P ratios (0.8e1.7). Themodulewith the calibratedprecipitation rate constant parameter (Rprecip) minimized the MeanSquared Error (MSE) based on measurements of orthophosphateremoval. The MSE values used for model calibration can be definedas:
MSE ¼ 1n
Xn
i¼1
�Yexp � Ymodel
�2 (3)
where,
Yexp¼ Experimental data on orthophosphate removal (fromliterature),Ymodel¼Modeled orthophosphate removal values,n¼Number of observations.
An iterative approach for model calibration was adopted untilthe MSE value could not be further minimized. Detailed calibration
approach for the struvite recovery module is included in Supple-mentary Information (S1).
2.3. Simulation of tertiary media filtration
To model adsorptive P removal in BioWin, a ‘model builderreactor’ element was used in conjunction with a solids removalunit. The adsorption process occurred in the model builderelement. The solids removal unit was configured such that itselectively retained the media and recycled back to the system.BioWin's user defined variable UD4 was used to represent theadsorbed component. The reactive media filtration system wasdesigned to consist of six Centra-flo moving bed sand filters (modelCF-200, Blue Pro, Nexom.). Each filter has a filtration surface area of18.6m2 (200 ft2) with a hydraulic loading rate of 578.7 gpm, whichis consistent with the manufacturer's guidelines. To regenerate themedia periodically, ferric salt was added prior to tertiary mediafiltration. The application rate was set to 15mg Fe/L, which isconsistent with the typical application rates in full-scale systems ofsimilar influent and effluent P concentration (Newcombe et al.,2006b).
The kinetic model developed by Mao and Yue (2016) wasadopted to simulate adsorption of phosphate by preformed HFO inBioWin. The surface complexation reaction was conceptualized as:
PO3�4 þ ≡FeOH þ nHþ 4
ka
kd≡FeHnPO
ð3�nÞ�4 þ H2O (4)
ka and kd are adsorption and desorption reaction rate constantsPO4
3� represents the dissolved phosphate species≡FeOH represents the active surface sorption sites on the mediaand, ≡FeHnPO4
(3�n)- is representative of the surface complex thatforms over the HFO media
The rate of adsorptionwas expressed by the following equation:
ddt
ðPadsÞ ¼ kahPO3�
4
i½≡FeOH�
hHnþ
i� kd½Pads� (5)
where, Pads represents the concentration of adsorbed P and n rep-resents the number of protons associated with each surface com-plex. Experimentally determined values for ka, kd and number ofactive sites were obtained from Mao and Yue (2016).
2.4. Influent characteristics and design parameters
Each treatment configuration was simulated under identicalinfluent flowrate and characteristics to facilitate direct compari-sons. It was assumed that the facility is a mid-sized U.S. treatmentWWTP with a capacity of 5 MGD (average dry weather flow). Toestablish the wastewater load characteristics, the monthly averagedata for the time period of January 2010 to November 2015 werecollected from the local Nine Springs Wastewater Treatment Plant(Madison, WI). The averaged data (Table 1) were introduced intoBioWin. Influent COD, TKN and TP fractionation parameters werecalculated from the collected data (S2.1 in Supplementary Infor-mation). The influent composition thus obtained was furthercompared to the typical municipal wastewater characteristicssuggested by Tchobanoglous et al. (2013) to ensure all the con-centrations were within the typical range.
Tank sizes and process parameters, such as, hydraulic retentiontime (HRT), SRT, were established according to the standards setforth in the WEF manual (WEF, 2008). Summary of design

Table 1Influent operational data from Nine Springs Wastewater Treatment Plant, Madison, WI (N¼ 71).
Parameter Mean Min Max SD Typical rangea
Flow, million gallons per day (MGD) 38.0 32.0 48.4 3.9 e
Chemical Oxygen Demand (COD), mg/L 507 450 540 28.2 250e800Biochemical oxygen demand (BOD5), mg/L 239.4 177.8 295.6 24.2 110e350pH 7.5 7.3 9.6 0.3 7.0e8.0Total Kjeldahl Nitrogen (TKN), mg/L 42.5 32.5 49.0 4.1 20e70Total Phosphorus (TP), mg/L 5.7 4.6 6.7 0.5 4e12Total Suspended Solids (TSS), mg/L 230.0 183.0 277.3 19.5 12e400Calcium (Ca), mg/L 86.5 85.3 89.3 1.1 e
Magnesium (Mg), mg/L 45.6 44.8 46.8 0.6 e
NH3-N, mg-N/L 26.8 20.1 32.7 3.1 20e75Alkalinity, eqv/m3 4.8 4.6 5.0 0.2 1e7
Min¼Minimum, Max¼Maximum, SD¼ Standard Deviation.a Tchobanoglous et al. (2013).
R. Bashar et al. / Chemosphere 197 (2018) 280e290284
parameters for the treatment configurations are presented in S3 inSupplementary Information.
2.5. Cost effectiveness of process configurations
The cost-effectiveness of the configurations was determinedusing the following equation:
CEK ¼ TACKPEK
(6)
where,
CE ¼ cost-effectiveness ($/lb-P removed),TAC ¼ total annualized cost ($),PE ¼ amount of P removed in pounds (lb-P), andk ¼ process configuration.
The overall annualized expenses associated with a processconfiguration consist of capital investments, operation and main-tenance costs, and was calculated as follows (Jiang et al., 2004):
TACK ¼ ðCCa*CRFÞ þ COM (7)
where,
CCa ¼ total capital investment cost,COM ¼ annual operation and maintenance cost, andCRF ¼ capital recovery factor
Capital costs were annualized assuming a CRF of 8% and 20 yearlife-span of the WWTP. Cost of land, civil engineering, labor andconstruction were excluded because they are all highly dependenton location.
2.5.1. Capital costsThe capital cost for scenarios S1 and S2 was obtained from Ohio
EPA (2013) and USEPA (2007), respectively. The aforementionedstudies derived capital costs for EBPR systems based on casestudies, “CAPDETworks” and literature sources for expansion andmodifications over secondary treatment configurations. These es-timates were updated to reflect conditions in 2017 using con-struction cost index from the Engineering News Records (ENR,2017). For capital investment cost and membrane replacementreserve in scenario S3, pricing information of MBR was obtained onZeeWeed 500 membrane from GE Power (GE Corporation, 2017).The moving bed biofilm reactors (MBBRs) for IFAS process in sce-nario S4 were designed to be filled with plastic biofilm carriers(500m2/m3 protective surface area) at a biofilm-to-media filling
ratio of 33%. The pricing information for the media was obtainedfrom SEWPCC (2008). For scenario S5, the investment costs forstruvite recovery reactor was obtained using Water EnvironmentResearch Foundation (WERF) P recovery tool from Ostara NutrientRecovery Technologies Inc. The cost for the sand filter in scenario S6was obtained from Nexom Blue Pro (Nexom, 2017), as they haveperformed several successful full-scale implementations of thistechnology in municipal WWTPs (USEPA, 2013).
2.5.2. Operation and maintenance costsThe operation and maintenance costs consisted of four items:
energy, chemical, sludge disposal and maintenance & insurance.For estimation of energy requirements, aeration in the oxic zone,liquid mixing in the anoxic and anaerobic zone, pumping of solids,and mixing and heating for anaerobic sludge digestion unit wereconsidered. BioWin aeration model was used to determine theoxygen transfer rate. The electricity consumption for the aerationunit was subsequently calculated by assuming a standard oxygentransfer efficiency of 6.5% per meter of reactor depth, based onvalues typically stated by vendors of fine bubble aeration diffusers(Foley et al., 2010).
Electricity consumption for all pumps was estimated from in-dividual flow rate and the assumed pumping head (identical for allscenarios). Hydraulic efficiency of pumps was estimated fromstandard curves with a motor efficiency of 95% (Wang et al., 2012a).The stirring power for liquid mixing in the anoxic and anaerobiczones was assumed to be 5W/m3 liquor (Envirosim, 2007). Theamount of heat (KWh) required per wet metric ton (1000 kg) ofsludge during anaerobic digestion was calculated from the differ-ence between the initial and desired temperatures multiplied byspecific heat capacity of sludge with 6% solids content (1117 KWh/kg deg C) and the heat loss from the digester using available heattransfer coefficients (Wang et al., 2012b).
Chemical addition for the treatment configurations primarilyconsisted of FeCl3 for P removal, lime addition for alkalinitycorrection, and methanol dosing for carbon source. For the waste-water entering the denitrification system, the methanol-to-nitrogen (nitrate) ratio was kept at 3:1 based on typical amountused in full-scale facilities. The degree of chemical use was acquireddirectly from the BioWin simulator. Unit costs for chemicals usedfor the study are listed in S4.2 in Supplementary Information.
Repair and maintenance costs associated with scenarios S1, S2and S6 were calculated as 4% of the total capital expenditure (Jianget al., 2004). To account for the mechanical cleaning requirementsin S3, an additional 1.5% of capital cost associated with membraneswas added to the maintenance cost considered for the MUCT pro-cess in S1 (SEWPCC, 2008). The amount of 50% citric acid and 12.5%sodium hypochlorite required for chemical cleaning of membranes

R. Bashar et al. / Chemosphere 197 (2018) 280e290 285
was estimated according to WSDOE (2011). The maintenance costsassociated with Scenario S4 was calculated according to SEWPCC(2008). In Scenario S5, it was assumed that citric acid cleaning ofthe reactor will be required every four months, which is similar tothe full-scale operation at the local Nine Springs WWTP. The costdue to taxes and insurance was calculated as 2% of the total capitalexpenditure in all the treatment scenarios (Jiang et al., 2004).
Methane production from anaerobic digestion is an economicbenefit and was included in the operating cost calculation as anegative cost. The power and heat efficiency of the CHP technologywas 33% and 35%, respectively (Wan et al., 2016). Since recoveredstruvite is expected to be land applied as fertilizer, it was assumedthat synthetic fertilizer (mono-ammonium phosphate, MAP) willbe replaced. The cost of recovered struvite product (Table S3) wasadded as a credit to that particular scenario.
3. Results and discussion
3.1. Effluent quality
The TP removal efficiencies in six different treatment scenariosranged from 82.4% to 99.1% (Table 2). Among the scenarios, S3 andS6 were particularly efficient in solids removal attributable to thefiltration mechanism of membrane bioreactors and the media fil-ters to remove total suspended solids (TSS).
Scenarios S1 and S5 are directly comparable, since the onlydifference between the two is the addition of side-stream struviterecovery process in S5. Simulation results show that the inclusionof struvite recovery in S5 increased the TP removal by 6%, comparedto S1. This is primarily due to the reduction of P concentration in therecycle stream after struvite recovery. Configuration S4 was able toachieve the target N removal goal at a shorter SRT of 7.5 days thanthe other scenarios where the SRT ranged from 10 to 12 days. All the
Table 2Effluent quality for the six treatment scenarios evaluated in this study.
S1 (MUCT) S2 (Bardenpho) S3 (MBR)
EffluentTotal BOD, mg/L 2.05 1.20 0.80Total COD, mg/L 33.41 30.10 28.47TSS, mg/L 2.87 1.24 <0.01Ammonia N, mg/L 0.62 0.06 0.08NO3-N, mg/L 7.04 5.29 6.99NO2-N 0.18 0.02 0.02TIN, mg/L 7.84 5.37 7.09TP, mg/L 0.90 0.95 1.02TP Removal % 84.4 83.5 82.4pH 6.99 7.04 7.10
Table 3Phosphorus mass balance for the six treatment scenarios evaluated.
Scenario Location Flow ML/d Pho
Inputs All Influent 18.93 5.73Outputs S1 Effluent 18.79 0.93
Biosolids 0.14 617S2 Effluent 18.77 0.95
Biosolids 0.16 562S3 Effluent 18.79 1.02
Biosolids 0.17 583S4 Effluent 19.26 0.82
Biosolids 0.16 585S5 Effluent 18.35 0.58
Biosolids 0.22 234Struvite 0.36 125
S6 Effluent 18.77 0.05Biosolids 0.17 708
treatment scenarios needed lime addition for alkalinity correctionin the nitrification process. Other than S4, all the configurationsalso required significant amount of methanol addition for hetero-trophic denitrification process. In general, all of the treatmentscenarios could achieve very low concentrations of NH4-N (�1mg/L) and nitrite (�0.5mg/L) in the effluent.
3.2. P mass balance
On a mass basis, between 0.9 and 17.6% of the influent TP wasfound in the effluent for the six treatment scenarios considered(Table 3). Other than S5, the remaining five scenarios removed 82 to99 percent of influent P mass fromwastewater that ended up in thebiosolids. Importantly, implementation of the struvite P recoverysystem (S5) resulted in a substantial reduction (35.6%) in biosolids Pcontent compared to the highly efficient BNR process MUCT (S1),which focuses only on P removal. Overall, for all treatment con-figurations, biosolids is themajor outlet for P other than recovery asstruvite. Safe and efficient application of biosolids is a criticalcomponent of nutrient management on a watershed basis. Bio-solids normally supply similar amounts of plant-available P as N,but crops require only one-fifth to one-half asmuch P as N (Evanylo,2009). It should be pointed out here that, harvesting P (as struvite)from the side-stream of a treatment process could have a secondarybenefit for biosolids management by yielding a moreagronomically-balanced fertilizer product.
3.3. Total cost & energy requirements
In this section, operational costs and energy for differenttreatment configurations are compared in terms of net energy re-quirements, aeration requirement, chemical and sludge disposalcosts, and energy recovery. These parameters are expected to have
S4 (IFAS-EBPR) S5 (P Recovery) S6 (Tertiary Filtration)
1.36 1.46 1.0429.18 29.79 29.901.28 1.85 <0.010.35 0.31 0.627.36 7.15 7.050.11 0.41 0.187.82 7.87 7.850.82 0.58 0.0585.5 90.2 99.17.02 7.02 6.95
sphorus Concentration mg/L Phosphorus Load kg/day (% of influent P)
108.45 (100%)17.46 (16%)
.39 90.99 (84%)17.90 (16.5%)
.15 90.54 (83.5%)19.10 (17.6%)
.34 89.35 (82.4%)15.74 (14.5%)
.03 92.70 (85.5%)10.60 (9.8%)
.92 52.44 (48.4%)
.18 44.84 (41.3%)0.99 (0.9%)
.67 107.46 (99%)
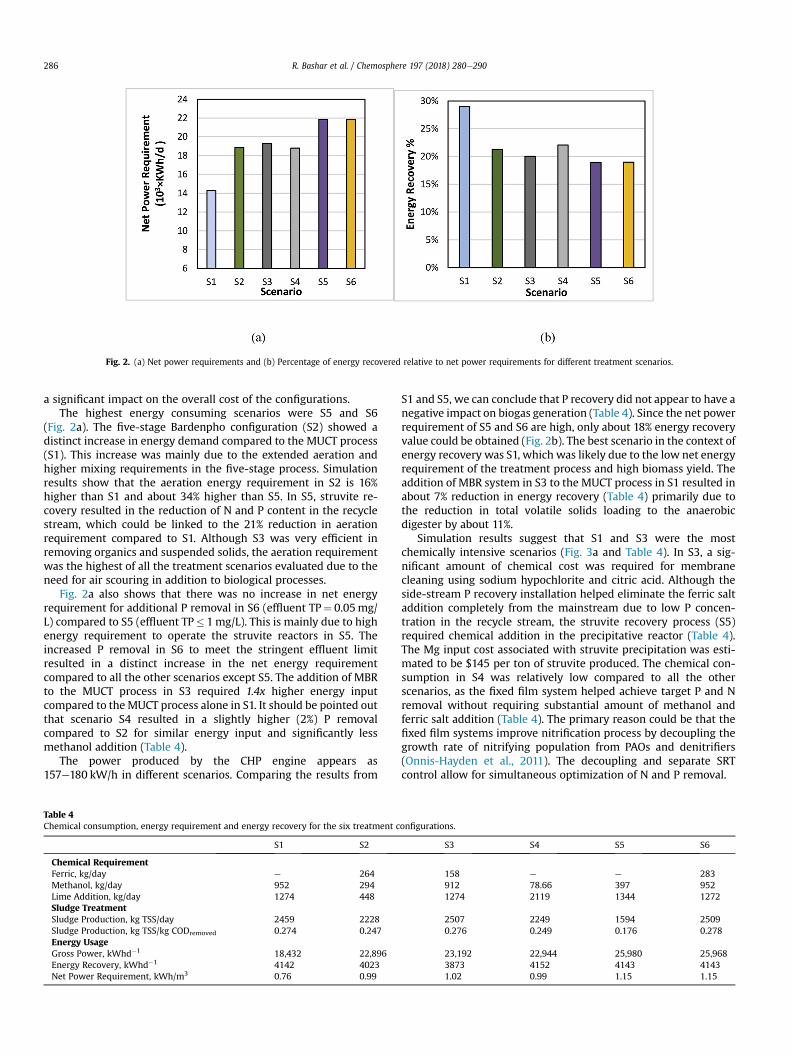
Fig. 2. (a) Net power requirements and (b) Percentage of energy recovered relative to net power requirements for different treatment scenarios.
R. Bashar et al. / Chemosphere 197 (2018) 280e290286
a significant impact on the overall cost of the configurations.The highest energy consuming scenarios were S5 and S6
(Fig. 2a). The five-stage Bardenpho configuration (S2) showed adistinct increase in energy demand compared to the MUCT process(S1). This increase was mainly due to the extended aeration andhigher mixing requirements in the five-stage process. Simulationresults show that the aeration energy requirement in S2 is 16%higher than S1 and about 34% higher than S5. In S5, struvite re-covery resulted in the reduction of N and P content in the recyclestream, which could be linked to the 21% reduction in aerationrequirement compared to S1. Although S3 was very efficient inremoving organics and suspended solids, the aeration requirementwas the highest of all the treatment scenarios evaluated due to theneed for air scouring in addition to biological processes.
Fig. 2a also shows that there was no increase in net energyrequirement for additional P removal in S6 (effluent TP¼ 0.05mg/L) compared to S5 (effluent TP� 1mg/L). This is mainly due to highenergy requirement to operate the struvite reactors in S5. Theincreased P removal in S6 to meet the stringent effluent limitresulted in a distinct increase in the net energy requirementcompared to all the other scenarios except S5. The addition of MBRto the MUCT process in S3 required 1.4x higher energy inputcompared to the MUCT process alone in S1. It should be pointed outthat scenario S4 resulted in a slightly higher (2%) P removalcompared to S2 for similar energy input and significantly lessmethanol addition (Table 4).
The power produced by the CHP engine appears as157e180 kW/h in different scenarios. Comparing the results from
Table 4Chemical consumption, energy requirement and energy recovery for the six treatment c
S1 S2
Chemical RequirementFerric, kg/day e 264Methanol, kg/day 952 294Lime Addition, kg/day 1274 448Sludge TreatmentSludge Production, kg TSS/day 2459 2228Sludge Production, kg TSS/kg CODremoved 0.274 0.247Energy UsageGross Power, kWhd�1 18,432 22,896Energy Recovery, kWhd�1 4142 4023Net Power Requirement, kWh/m3 0.76 0.99
S1 and S5, we can conclude that P recovery did not appear to have anegative impact on biogas generation (Table 4). Since the net powerrequirement of S5 and S6 are high, only about 18% energy recoveryvalue could be obtained (Fig. 2b). The best scenario in the context ofenergy recovery was S1, which was likely due to the low net energyrequirement of the treatment process and high biomass yield. Theaddition of MBR system in S3 to the MUCT process in S1 resulted inabout 7% reduction in energy recovery (Table 4) primarily due tothe reduction in total volatile solids loading to the anaerobicdigester by about 11%.
Simulation results suggest that S1 and S3 were the mostchemically intensive scenarios (Fig. 3a and Table 4). In S3, a sig-nificant amount of chemical cost was required for membranecleaning using sodium hypochlorite and citric acid. Although theside-stream P recovery installation helped eliminate the ferric saltaddition completely from the mainstream due to low P concen-tration in the recycle stream, the struvite recovery process (S5)required chemical addition in the precipitative reactor (Table 4).The Mg input cost associated with struvite precipitation was esti-mated to be $145 per ton of struvite produced. The chemical con-sumption in S4 was relatively low compared to all the otherscenarios, as the fixed film system helped achieve target P and Nremoval without requiring substantial amount of methanol andferric salt addition (Table 4). The primary reason could be that thefixed film systems improve nitrification process by decoupling thegrowth rate of nitrifying population from PAOs and denitrifiers(Onnis-Hayden et al., 2011). The decoupling and separate SRTcontrol allow for simultaneous optimization of N and P removal.
onfigurations.
S3 S4 S5 S6
158 e e 283912 78.66 397 9521274 2119 1344 1272
2507 2249 1594 25090.276 0.249 0.176 0.278
23,192 22,944 25,980 25,9683873 4152 4143 41431.02 0.99 1.15 1.15
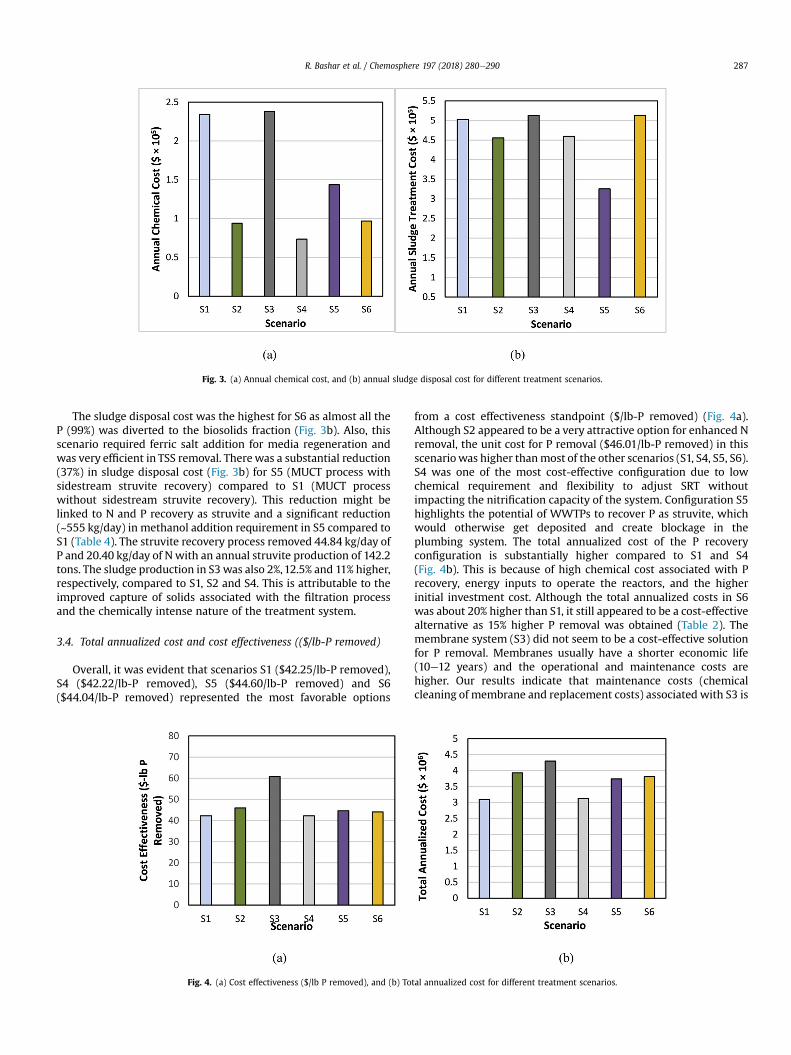
Fig. 3. (a) Annual chemical cost, and (b) annual sludge disposal cost for different treatment scenarios.
R. Bashar et al. / Chemosphere 197 (2018) 280e290 287
The sludge disposal cost was the highest for S6 as almost all theP (99%) was diverted to the biosolids fraction (Fig. 3b). Also, thisscenario required ferric salt addition for media regeneration andwas very efficient in TSS removal. There was a substantial reduction(37%) in sludge disposal cost (Fig. 3b) for S5 (MUCT process withsidestream struvite recovery) compared to S1 (MUCT processwithout sidestream struvite recovery). This reduction might belinked to N and P recovery as struvite and a significant reduction(~555 kg/day) in methanol addition requirement in S5 compared toS1 (Table 4). The struvite recovery process removed 44.84 kg/day ofP and 20.40 kg/day of N with an annual struvite production of 142.2tons. The sludge production in S3 was also 2%,12.5% and 11% higher,respectively, compared to S1, S2 and S4. This is attributable to theimproved capture of solids associated with the filtration processand the chemically intense nature of the treatment system.
3.4. Total annualized cost and cost effectiveness (($/lb-P removed)
Overall, it was evident that scenarios S1 ($42.25/lb-P removed),S4 ($42.22/lb-P removed), S5 ($44.60/lb-P removed) and S6($44.04/lb-P removed) represented the most favorable options
Fig. 4. (a) Cost effectiveness ($/lb P removed), and (b) To
from a cost effectiveness standpoint ($/lb-P removed) (Fig. 4a).Although S2 appeared to be a very attractive option for enhanced Nremoval, the unit cost for P removal ($46.01/lb-P removed) in thisscenariowas higher thanmost of the other scenarios (S1, S4, S5, S6).S4 was one of the most cost-effective configuration due to lowchemical requirement and flexibility to adjust SRT withoutimpacting the nitrification capacity of the system. Configuration S5highlights the potential of WWTPs to recover P as struvite, whichwould otherwise get deposited and create blockage in theplumbing system. The total annualized cost of the P recoveryconfiguration is substantially higher compared to S1 and S4(Fig. 4b). This is because of high chemical cost associated with Precovery, energy inputs to operate the reactors, and the higherinitial investment cost. Although the total annualized costs in S6was about 20% higher than S1, it still appeared to be a cost-effectivealternative as 15% higher P removal was obtained (Table 2). Themembrane system (S3) did not seem to be a cost-effective solutionfor P removal. Membranes usually have a shorter economic life(10e12 years) and the operational and maintenance costs arehigher. Our results indicate that maintenance costs (chemicalcleaning of membrane and replacement costs) associated with S3 is
tal annualized cost for different treatment scenarios.

R. Bashar et al. / Chemosphere 197 (2018) 280e290288
about 27% of the total annualized cost, which is the highest of allscenarios evaluated (Fig. 5).
A breakdown of operational and maintenance costs in Fig. 5shows that electricity consumption accounted for the largestportion in each scenario. It was evident that, improved levels of Premoval and effluent quality requires an increase in energy con-sumption for treatment. Chemical costs varied from 4 to 11 percentof the total operational costs. It should be noted that the charac-teristics of the wastewater or market situation might have a sig-nificant impact on chemical costs associated with P removal. Thecost of chemicals required for wastewater treatment usually variesfrom year to year. A mean cost of each type of chemical based onhistorical trends was adopted in this study. Another importantfactor affecting the cost of P removal was sludge production. In allthe treatment scenarios except S5, the cost of sludge disposalaccounted for about 20% of the total operational cost (Fig. 5). Thecost of sludge disposal may increase in the near future, as suitablelandfill locations diminish. If sludge has to be transported to distantlocations, or further treated due to regulatory requirements, cost ofP removal might rise sharply. Under such circumstances, cost of Premoval in scenarios S1 or S6 could be prohibitively high.
Fig. 5. Operational and maintenance cost brea
3.5. Comparisons with previous studies
As shown in Table 5, unit cost estimates for our treatment sce-narios compared favorably with two other previously publishedstudies (Jiang et al., 2005; WSDOE, 2011). Both these studies re-ported a decrease in unit costs for TP removal with increasing plantcapacity. While we obtained higher unit cost estimates comparedto Jiang et al. (2005), the differences can be attributed to the timeelapsed (12 years), which would have an impact on electricity,chemical, and maintenance costs. However, our unit cost estimatefor 5 MGD capacity is well within the range reported by WSDOE(2011) for 1 and 10 MGD plants. Also, for the 3-step BNR withchemical addition and tertiary filtration configuration, our estimateis lower than that obtained by Jiang et al. (2005). Possible reasonsinclude consideration of labor costs and engineering fees by Jianget al. (2005), which sharply increase for such advanced treatmenttechnologies. These cost components were not considered in thecurrent study.
Apart from the two studies mentioned above, some of the recentstudies published within the last five years focus on not onlymeeting the discharge permit limits economically but also on theenvironmental sustainability of the treatment systems. Falk et al.
kdown for different treatment scenarios.

Table 5Comparison of our cost estimates with those from other relevant studies.
Study Treatment Process Capacity (MGD) Effluent TP (mg/L) Unit Cost ($/kg P removed)
WSDOE (2011) 3-step BNR þ Chemical Addition 1 1 118.4910 1 52.82
Jiang et al. (2005) 3-step BNR þ Chemical Addition 1 1 8710 1 37.7
3 step BNR þ Chemical Addition þ Filtration 1 0.5 26910 0.5 89
This study 3-step BNR þ Chemical Addition 5 1 92.953 step BNR þ Chemical Addition þ Filtration 5 0.05 96.8
R. Bashar et al. / Chemosphere 197 (2018) 280e290 289
(2013) recommended a triple bottom line for fulfilling an effluentdischarge objective that includes environmental, economical andsocial pillars. Site specific costs associated with land, constructionand labor are included in some studies while one or all of the itemsare excluded in other studies. Some of the studies also ignore themaintenance costs associated with the treatment processes. Thus,the differences in methodology and components considered pre-vented us from performing a direct comparison with additionalpublished studies.
3.6. Limitations of our study
The assumptions used in this study could be a source of certainlimitations. Firstly, no consideration was given to land re-quirements in our economic calculations. The membrane systemsare compact and require much less footprint compared to con-ventional activated sludge systems. Therefore, the utilities forced tomeet very stringent discharge standards but incapable of furtherexpansion due to land unavailability, could find these systemsuseful. Secondly, the simulation exercises ought to be performedfor much longer periods, to cover both dry- and wet-weatherconditions, as well as seasonal variations. Thirdly, meeting thetarget effluent P was the major focus while designing and simu-lating the treatment systems in this study. But in reality, thewastewater treatment systems are employed to remove numerousconstituents and not just P. While exploring various strategic al-ternatives for P removal and/or recovery, we also had to considerthe need to achieve an acceptable effluent composition in terms ofTSS, COD, BOD and N.
4. Conclusions
We have presented a comprehensive operational and econom-ical evaluation of six different wastewater treatment scenarios,covering a wide variety of competing P removal processes fromsecondary to advanced tertiary treatment and one side-stream Precovery process. The main conclusions from this study are asfollows:
� The unit cost for P removal in different treatment alternativesranges from $42.22 to $60.88 per lb of P removed. The MUCTBNR þ tertiary reactive media filtration proved to be one of themost cost-effective configurations ($44.97/lb P removed) pro-ducing effluent with a TP concentration of 0.05 mg/L. Thistreatment method had the second lowest unit P removal costamong the six scenarios evaluated.
� Incorporation of struvite precipitation inWWTPs recovers P in asolid form that is separate from biosolids and can be used as afertilizer product. But, the accompanying reduction in effluent Pdue to struvite recovery is low (~6%). Therefore, side-stream Precovery process, while diverting away P loads from biosolids,would not help with meeting stringent TP discharge limits.
� Amajor operational expense during struvite precipitation arisesfrom chemical addition requirement. The typical Mg concen-tration in municipal wastewater is very low for struvite pre-cipitation. To reach the optimal ranges for struvite precipitation,pH levels had to be adjusted as well. Future research into al-ternatives to chemical inputs for pH adjustment and Mg isnecessary for cost effective P recovery.
� In all the treatment scenarios, biosolids was the major outlet forP (48e99% of influent P). So land application of biosolids isextremely important for efficient P management at the water-shed level. However, waste activated sludge from WWTP con-centrates numerous contaminants, such as persistent organicpollutants and heavy metals (Zhao et al., 2017; Xu et al., 2017). Alarge portion of these contaminants is not degraded by the mostcommon sludge treatment methods employed by the WWTPs,such as anaerobic digestion or fermentation (Wang et al.,2017b). The remaining pollutants in the biosolids have the po-tential to enter into the environment and cause risks to naturalorganisms and other biological processes. Thus, biosolids man-agement in an environmentally safe manner needs to beensured.
We anticipate use of this study results to determine the life cyclecost and environmental impact assessment of different P removaland recovery processes.
Acknowledgments
This work was supported by USDA NIFA Hatch Program (Project# WIS01646 and WIS01755). The authors would also like to thankAlan Grooms, Operations manager at the Madison MetropolitanSewage District (MMSD) for his consistent help in collection of dataand providing other operational information.
Appendix A. Supplementary data
Supplementary data related to this article can be found athttps://doi.org/10.1016/j.chemosphere.2017.12.169.
References
Bai, Y., Zhang, Y., Quan, X., Chen, S., 2016. Nutrient removal performance and mi-crobial characteristics of a full-scale IFAS-EBPR process treating municipalwastewater. Water Sci. Technol. 73, 1261e1268.
Battistoni, P., De Angelis, A., Pavan, P., Prisciandaro, M., Cecchi, F., 2001. Phosphorusremoval from a real anaerobic supernatant by struvite crystallization. WaterRes. 35 (1), 2167e2178.
Chen, H., Wang, D., Li, X., Yang, Q., Zeng, G., 2015. Enhancemnet of post-anoxicdenitrification for biological nutrient removal: effect of different carbon sour-ces. Environ. Sci. Pollut. Res. 22 (8), 5887e5894.
Chislock, M.F., Doster, E., Zitomer, R.A., Wilson, A.E., 2013. Eutrophication: causes,consequences, and controls in aquatic ecosystems. Nat. Educ. Knowl. 4 (4), 10.
Desmidt, E., Ghyselbrecht, K., Zhang, Y., Pinoy, L., Bruggen, B., Verstraete, W.,Rabaey, K., Meesschaert, B., 2013. Global phosphorus scarcity and full-scale P-recovery techniques: a review. Critic. Rev. Environ. Sci. Technol. 45, 336e384.
ENR, 2017. Engineering News Record Construction Economics. http://www.enr.

R. Bashar et al. / Chemosphere 197 (2018) 280e290290
com/economics.Envirosim, 2007. BioWin Process Simulator. Envirosim Associates Ltd, v.3.0. .Evanylo, G.K., 2009. Agricultural Land Application of Biosolids in Virginia : Man-
aging Biosolids for Agricultural Use. Virginia Cooperative Extension Publication,452e303.
Falk, M.W., Reardon, D.J., Neethling, J.B., Clark, D.L., Pramanik, A., 2013. Striking thebalance between nutrient removal, greenhouse gas emissions, receiving waterquality, and costs. Water Environ. Res. 85 (12), 2307e2316.
Foley, J.M., Haas, D.D., Hartley, K., Lant, P., 2010. Comprehensive life cycle in-ventories of alternative wastewater treatment systems. Water Res. 44,1654e1666.
GE Corporation, 2017. GE Power Water and Process Technologies ZeeWeed 500Membrane. https://www.gewater.com/products/zeeweed-500-membrane.
Hao, X., Loosdrecht, M., Meijey, S.C., Qian, Y., 2001. Model-based evaluation of twoBNR processes- UCT and A2N. Water Res. 35 (12), 2851e2860.
Jaffer, Y., Clark, T.A., Pearce, P., Parsons, S.A., 2002. Potential phosphorus recovery bystruvite formation. Water Res. 36 (7), 1834e1842.
Jiang, F., Beck, M.B., Cummings, R.G., Rowles, K., Russell, D., 2004. Estimation ofCosts of Phosphorus Removal in Wastewater Treatment Facilities.
Jiang, F., Beck, M.B., Rowles, K., Cummings, R.G., 2005. Estimation of costs ofphosphorus removal in wastewater treatment facilities: adaptation of existingfacilities. Water Policy Working Paper 2005e2011.
Mao, Y., Yue, Q., 2016. Kinetic modeling of phosphate adsorption and in situ formedhydrous ferric oxides at circumneutral pH. Sci. Rep. 6 (35292), 1e11.
Musvoto, E.V., Ekama, G.A., Wentzel, M.C., Loewenthal, R.E., 2000. Extension andapplication of the three-phase weak acid/base kinetic model to the aerationtreatment of anaerobic digester liquors. Water SA 26 (4), 417e438.
Newcombe, R.L., Hart, B.K., Moller, G., 2006a. Arsenic removal from drinking waterby moving bed active filtration. J. Environ. Eng. 132, 5e12.
Newcombe, R.L., Rule, R.A., Hart, B.K., 2006b. Phosphorus removal from municipalwastewater by hydrous ferric oxide reactive filtration and coupled chemicallyenhanced secondary treatment: Part IdPerformance. Water Environ. Res. 80(3), 238e247.
Nexom, 2017. Blue Pro Reactive Filtration for Phosphorus and Metals Removal.http://nexom.com/blue-pro#basics-blue-pro.
Oehmen, A., Lemos, P., Carvalho, G., Yuan, Z., Keller, J., Blackall, L., Reis, M., 2007.Advances in enhanced biological phosphorus removal: from micro to macroscale. Water Res. 41, 2271e2300.
Ohio EPA, 2013. Cost Estimate of Phosphorus Removal at Wastewater TreatmentPlants. Ohio Environmental Protection Agency, Columbus, Ohio.
Onnis-Hayden, A., Majed, N., Schramm, A., Gu, A.Z., 2011. Process optimization bydecoupled control of key microbial populations: distribution of activity andabundance of polyphosphate accumulating organisms and nitrifying pop-ulations in a full-scale IFAS-EBPR plant. Water Res. 45, 3845e3854.
Ostara, 2017. Ostara Nutrient Recovery Technologies Inc. http://ostara.com/nutrient-management-solutions/.
Pastor, L., Mangin, D., Barat, R., Seco, A., 2008. A pilot-scale study of struvite pre-cipitation in a stirred tant reactor: conditions influencing the process. Bio-resour. Technol. 99, 6285e6291.
Pastor, L., Mangin, D., Ferrer, J., Seco, A., 2010. Struvite formation from the super-natants of an anaerobic digestion pilot plant. Bioresour. Technol. 101, 118e125.
Pratt, C., Parsons, S., Soares, A., Martin, B., 2012. Biologically and chemically medi-ated adsorption and precipitation of phosphorus from wastewater. Curr. Opin.Biotechnol. 23, 890e896.
Rahaman, M.S., Ellis, N., Mavinic, D.S., 2008. Effects of Various Process Parameterson struvite precipitation kinetics and subsequent determination of rate con-stants. Water Sci. Technol. 57 (5), 647e654.
Rahaman, M.S., Mavinic, D.S., A.M., Ellis N, 2014. Modeling phosphorus removal andrecovery from anaerobic digester supernatant through struvite crystallizationin a fluidized bed reactor. Water Res. 51, 1e10.
SEWPCC, 2008. Upgrading/Expansion Preliminary Report- Biological NutrientRemoval Process Options. South End Water Pollution Control Center, City ofWinnipeg, Canada.
Smith, A.L., Stadler, L.B., Love, N.G., Skerlos, S.J., Raskin, L., 2015. Perspectives onanaerobic membrane bioreactor treatment of domestic wastewater: a criticalreview. Bioresour. Technol. 122, 149e159.
Tchobanoglous, G., Burton, F.L., Stensel, H.D., 2013. Metcalf and Eddy Inc., Waste-water Engineering Treatment and Reuse, fourth ed. McGraw Hill, New York, NY(US).
Tian, G., Cox, A.E., Kumar, K., Granato, T.C., O'Connor, G.A., Elliot, H.A., 2016.Assessment of plant availability and environmental risk of biosolids-phosphorus in a U.S. Midwest Corn-Belt Soil. J. Environ. Manag. 172 (1),171e176.
USEPA, 2007. Biological Nutrient Removal Processes and Costs. U.S. EnvironmentalProtection Agency, Office of Water, EPA-823-R-07-002, Washington, DC.
USEPA, 2013. Emerging Technologies for Wastewater Treatment and In-plant WetWeather Management. U.S. Environmental Protection Agency, Office ofWastewater Management, EPA-832-R-12-011, Washington, DC.
USEPA, 2017. Discharge Monitoring Report (DMR) Pollutant Loading Tool. https://cfpub.epa.gov/dmr/.
Wan, J., Gu, J., Zhao, Q., Liu, Y., 2016. COD capture: a feasible option towards energyself-sufficient domestic wastewater treatment. Sci. Rep. 6 (25054), 1e9.
Wang, X., Liu, J., Ren, N.Q., Duan, Z., 2012a. Environmental profile of a typicalanaerobic/anoxic/oxic wastewater treatment systems meeting increasinglystringent treatment standards from a life cycle perspective. Bioresour. Technol.126, 31e40.
Wang, X., Liu, J., Ren, N.Q., Yu, H.Q., Lee, D.J., Guo, X., 2012b. Assessment of multiplesustainability demands for wastewater treatment alternatives: a refined eval-uation scheme and case study. Environ. Sci. Technol. 46, 5542e5549.
Wang, D., Wang, Y., Liu, Y., Ngo, H.H., Lian, Y., Zhao, J., Chen, F., Yang, Q., Zeng, G.,Li, X., 2017a. Is denitrifying anaerobic methane oxidation-centered technologiesa solution for the sustainable operation of wastewater treatment plants? Bio-resour. Technol. 234, 456e465.
Wang, Y., Wang, D., Liu, Y., Wang, Q., Chen, F., Yang, Q., Li, X., Zeng, G., Li, H., 2017b.Triclocarban enhances short-chain fatty acids production from anaerobicfermentation of waste activated sludge. Water Res. 127, 150e161.
WEF, 2008. Operation of Municipal Waste Water Treatment Plants, MoP 11, sixth ed.WSDOE, 2011. Technical and Economic Evaluation of Nitrogen and Phosphorus
Removal at Municipal Wastewater Treatment Facilities. Washington StateDepartment of Ecology. Publication No. - 11-10-060, Olympia, WA.
Xu, Q., Li, X., Ding, R., Wang, D., Liu, Y., Wang, Q., Zhao, J., Chen, F., Zeng, G., Yang, Q.,Li, H., 2017. Understanding and mitigating the toxicity of cadmium to theanaerobic fermentation of waste activated sludge. Water Res. 124, 269e279.
Zhang, H., Wang, X., Xiao, J., Yang, F., Zhang, J., 2009. Enhanced biological nutrientremoval using MUCT-MBR. Bioresour. Technol. 100 (3), 1048e1054.
Zhao, J., Gui, L., Wang, Q., Liu, Y., Wang, D., Ni, B.-J., Li, X., Xu, R., Zeng, G., Yang, Q.,2017. Aged refuse enhances anaerobic digestion of waste activated sludge.Water Res. 123, 724e733.