cost benefit analysis - legislation.gov.uk · september 17 cost benefit analysis amendments to the...
TRANSCRIPT
September 17
Cost Benefit Analysis Amendments to the Renewable Transport Fuel Obligations Order
Moving Britain Ahead

The Department for Transport has actively considered the needs of blind and partially sighted people in accessing this document. The text will be made available in full on the Department’s website. The text may be freely downloaded and translated by individuals or organisations for conversion into other accessible formats. If you have other needs in this regard please contact the Department. Department for Transport Great Minster House 33 Horseferry Road London SW1P 4DR Telephone 0300 330 3000 General enquiries https://forms.dft.gov.uk Website www.gov.uk/dft
Crown copyright 2017 Copyright in the typographical arrangement rests with the Crown. You may re-use this information (not including logos or third-party material) free of charge in any format or medium, under the terms of the Open Government Licence v3.0. To view this licence visit http://www.nationalarchives.gov.uk/doc/open-government-licence/version/3 or write to the Information Policy Team, The National Archives, Kew, London TW9 4DU, or e-mail: [email protected]. Where we have identified any third-party copyright information you will need to obtain permission from the copyright holders concerned.

3
Contents
1. Executive summary 4
2. Problem under consideration and rationale for intervention 7
3. Policy 8
Policy options considered for consultation 8
Policy changes which are reflected in this cost benefit analysis 9
4. Analytical approach, evidence, uncertainties and sensitivities 12
Analytical approach 12
Evidence and assumptions 15
Key uncertainties and sensitivity analysis 15
5. Impacts of the policy on fuels supplied and GHG emissions 20
Baseline fuel supply 20
Fuel supply under the policy 21
Sensitivity analysis 25
6. Costs and benefits of the policy 29
Summary of costs and benefits 29
i - Quantified impacts 30
ii - Non-quantified impacts 31
7. Appendices 33
Appendix 1 - Details of analytical evidence and assumptions 33
Appendix 2 - Share of renewable fuels supplied by volume and by energy 52
Appendix 3 - Total volumes of renewable fuels supplied 53
Appendix 4 - NPVs sensitivity analysis scenarios 54
Appendix 5 - Summary of consultation responses 59

4
1. Executive summary
1.1 Following the recent consultation on the future of the Renewable Transport Fuel Obligation, the resulting policy is illustrated in detail in the Government Response. For the purposes of this Cost Benefit Analysis, we focus on the policy changes with the highest expected impacts, namely the increase in the RTFO obligation, the level of the crop cap and the level of the development fuel sub-target. To illustrate the expected impacts of these, we compare the central policy scenario to a do-nothing baseline.
1.2 To ensure long-term carbon savings, investor certainty and a link to carbon budgets, new RTFO obligation levels will be set from 2018 to 2032 and the costs and benefits are estimated for this time period. Increasing the RTFO obligation for this period contributes the UK's Carbon Budgets 3 to 5 (2018-2032) and ensures compliance with the EU Renewable Energy Directive and makes significant contributions to Fuel Quality Directive compliance.
Table 1: summary of options consulted on
1.3 The final policy is an amended version of Option 2 with a fuel specific development sub-target and a revised limit to crop-derived fuels. To estimate the impacts of the policy for this CBA, we have developed a central scenario of the fuels we consider most likely to be delivered under the new policy. Later in the CBA, we show sensitivity analysis of how these impacts may vary. The proposed measures are expected to add slightly to fuel pump prices, though any increase is more than offset by improvements in vehicle efficiency in recent years, which has been supported by government regulations1. The total cost in 2020 is estimated to be £351m (0.9ppl). This cost estimate is driven by the expected price spreads between fossil fuels and renewable fuels in global markets. However, as these cost projections are inherently uncertain, alternative market price scenarios have been modelled which provide a wider range of cost estimates (0.3 to 1.9 pence per litre (ppl) or £127m to £725m in total, in 2020).
1 We estimate that the average petrol car on the road is around 8% more fuel efficient in 2016 than the average in 2009. Given petrol prices around 110ppl at the pump this fuel saving reduces driving costs by the equivalent of 9ppl.
sub-target Approach to crop-based renewable fuels (% total fuel volume)
Option 1 Broad definition Increase use of crops (up to 7%)
Option 2 (preferred)
Fuel-specific Maintain current crop use (up to 2%)
Option 3 Fuel-specific Phase out crop use (0%)

5
1.4 We expect that the development sub-target will support the development of a new industry supplying advanced transport fuels and playing an important role in decarbonising road transport in the longer term. The overall obligation also maintains a market for current suppliers of the most sustainable fuels, the waste biodiesel industry, and existing UK ethanol producers.
1.5 There is an absolute increase in the demand for biofuels, which will contribute to meeting ambitious carbon budgets and will also ensure stable demand for renewable suppliers while the demand for fossil fuels is expected to decline. Currently, the majority of biofuels used in the UK are also processed in the UK and we estimate that this adds at least £60 million per year to the UK economy (net value added). We would expect the proposed policy to increase this contribution and estimates are included in table 3 below under "Present value benefits".
Table 2: 2020 pump price impact, carbon abatement cost, renewable energy
Costs are additional to baseline in 2020, 2015 prices
2020 Cost impact, £m (range)
2020
Pump price impact minus VAT, ppl
(range)
Additional VAT revenues, ppl (range)
Total pump price impact, ppl (range)
2020
Crop share (% by volume)
GHG savings¹ (MTCO2e)
Abatement cost ¹ (£/TCO2e) in 2020
TWh
renewable Energy (incl. baseline)
Central
351
(127-725)
0.72 (0.24-1.52)
0.18 (0.06 – 0.38)
0.9 (0.3 – 1.9)
1.7% (0-4%) 2.8
123
(44-256)
23.1
Option 2
for comparison
366
(143-729)
0.72 (0.24-1.52)
0.18 (0.06 – 0.38)
0.9 (0.3 – 1.9)
2%
(0-2%) 2.7
137
(53-273)
22.5
Table 3: summary of present value estimates (2018-2032):
Additional to baseline, 2015 prices
Total additional carbon savings¹ (MTCO2e)
Present value benefits (£m)
Present value costs estimate (£m)
Average abatement cost present value¹ (£/TCO2e) 2018-32
Present value costs (£m) range
Net present value (£m) range
Net present value (£m) central estimate
Central 52 3567 4276
119 1534 to 9313 2033 to -5746
-709
Option 2 33.6 2303 3107 95 1213 to 6313 1090 to -4011 -804
1.6 The central net present value estimates are negative, since we expect the cost of renewable fuels to exceed the value of the carbon saved plus the net value added to the UK economy. This holds true under BEIS's central and low non-traded carbon value projections. When we use BEIS's high carbon value projections for sensitivity analysis, the NPVs are positive. NPVs are also positive if we apply carbon budget methodology instead of lifecycle carbon accounting.

6
1.7 The central scenario assumes high levels of waste availability. It also assumes that E102 will be introduced and will make up 40% of retailed petrol with 60% remaining E5. Sensitivity analysis was carried out to show impacts for "noE10" and "HighE10". It is important to note that the high crop cap in the early years allows a much higher uptake of crop derived fuels than we have in the central scenario, and especially crop biodiesel. We have also undertaken a sensitivity to show impacts for high crop biodiesel uptake.
1.8 Table 3 above shows the expected impacts over the duration of the policy. The range of net present value estimates is based on three different long-term price scenarios (driven by global markets).
Chart 1: summary of renewable fuels supplied over the duration of the policy, central scenario
2 A blend of petrol and ethanol with up to 10% ethanol.

7
2. Problem under consideration and rationale for intervention
2.1 The Climate Change Act set a target of an 80% reduction in greenhouse gas emissions by 2050 compared to 1990 levels. As around one quarter of UK carbon emissions are from transport, decarbonisation of the transport sector is vital to achieving this long term goal. Renewable fuels are expected to have an important role to play in delivering this long-term decarbonisation. Despite increased uptake of electric vehicles, a significant share of road vehicles and virtually all planes and ships are expected to still use liquid or gaseous fuels well into the 2030s, showing the need for further low-carbon options and for a strategy beyond meeting the 2020 targets. Advanced renewable fuels could be key to this long-term decarbonisation, as they may provide a means to decarbonise heavy goods vehicles (HGVs), ships and aircraft, where electrification is difficult or impractical, few alternatives to liquid or gaseous fuels are available and increased supply of first generation biofuels is either unavailable or unsustainable.
2.2 Currently, UK fuel suppliers are obligated to provide 4.75% (by volume) of road transport fuel from renewable sources, under the Renewable Transport Fuel Obligation (RTFO). However, this falls short of what is required to meet carbon budgets and also falls short of the Renewable Energy Directive's transport sub-target, which requires 10% of road transport fuel by energy to be from renewable sources in 2020.
2.3 Current supply of renewable fuels under the RTFO is 3.3% by volume (4.75% if you include double reward of waste derived fuels) and 2.6% by energy (4% with double rewarding.
8
3. Policy
3.1 The consultation put forward three policy options and we still refer to those options for comparison in this CBA. To quantify the impacts of the final policy, we compare estimated impacts against a 'Do-nothing' baseline, which assumes the RTFO remains as it is with an obligation level of 4.75% by volume, with double rewarding of waste-derived fuels, no sub-target for development fuels and no crop cap. The policy options were partly informed by the requirements of meeting the Renewable Energy Directive in 2020 as well as the requirements of carbon budgets. The baseline is not considered as a viable policy option because it does not ensure compliance with carbon budgets or with the minimum requirements of the RED.
Policy options considered for consultation
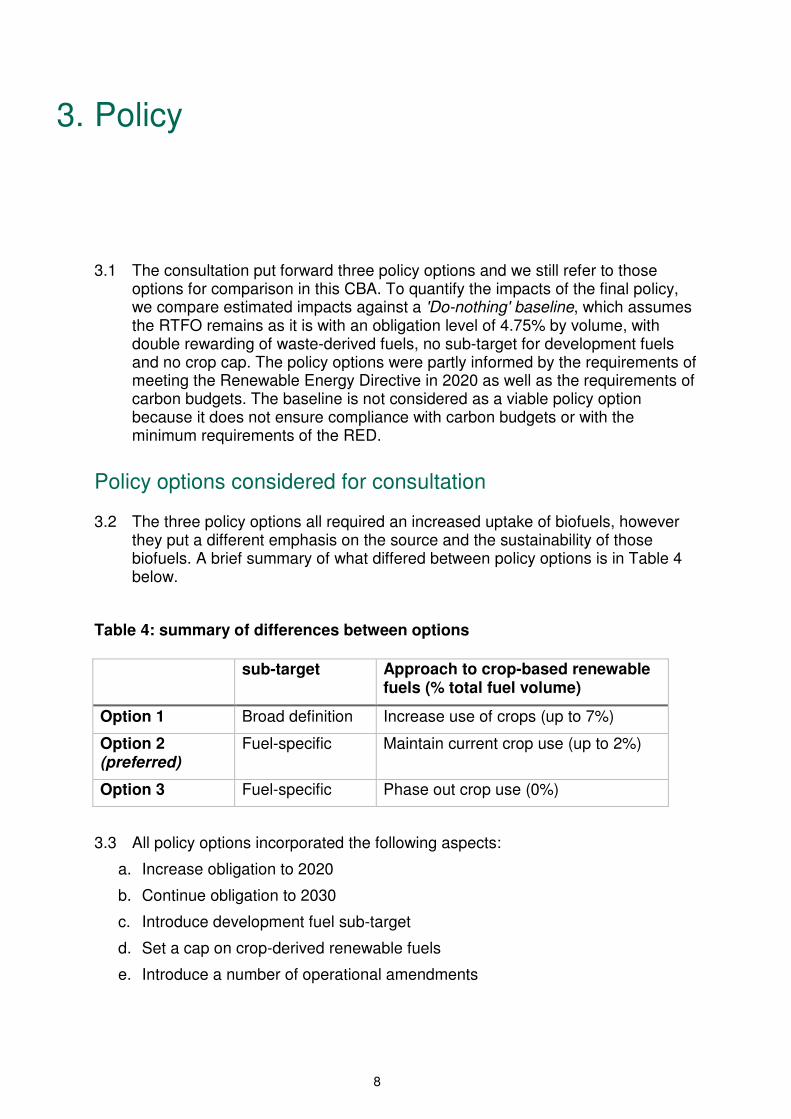
3.2 The three policy options all required an increased uptake of biofuels, however they put a different emphasis on the source and the sustainability of those biofuels. A brief summary of what differed between policy options is in Table 4 below.
Table 4: summary of differences between options
3.3 All policy options incorporated the following aspects:
a. Increase obligation to 2020
b. Continue obligation to 2030
c. Introduce development fuel sub-target
d. Set a cap on crop-derived renewable fuels
e. Introduce a number of operational amendments
sub-target Approach to crop-based renewable fuels (% total fuel volume)
Option 1 Broad definition Increase use of crops (up to 7%)
Option 2 (preferred)
Fuel-specific Maintain current crop use (up to 2%)
Option 3 Fuel-specific Phase out crop use (0%)
9
Policy changes which are reflected in this cost benefit analysis
1) Increase the obligation level and continue obligation to 2032
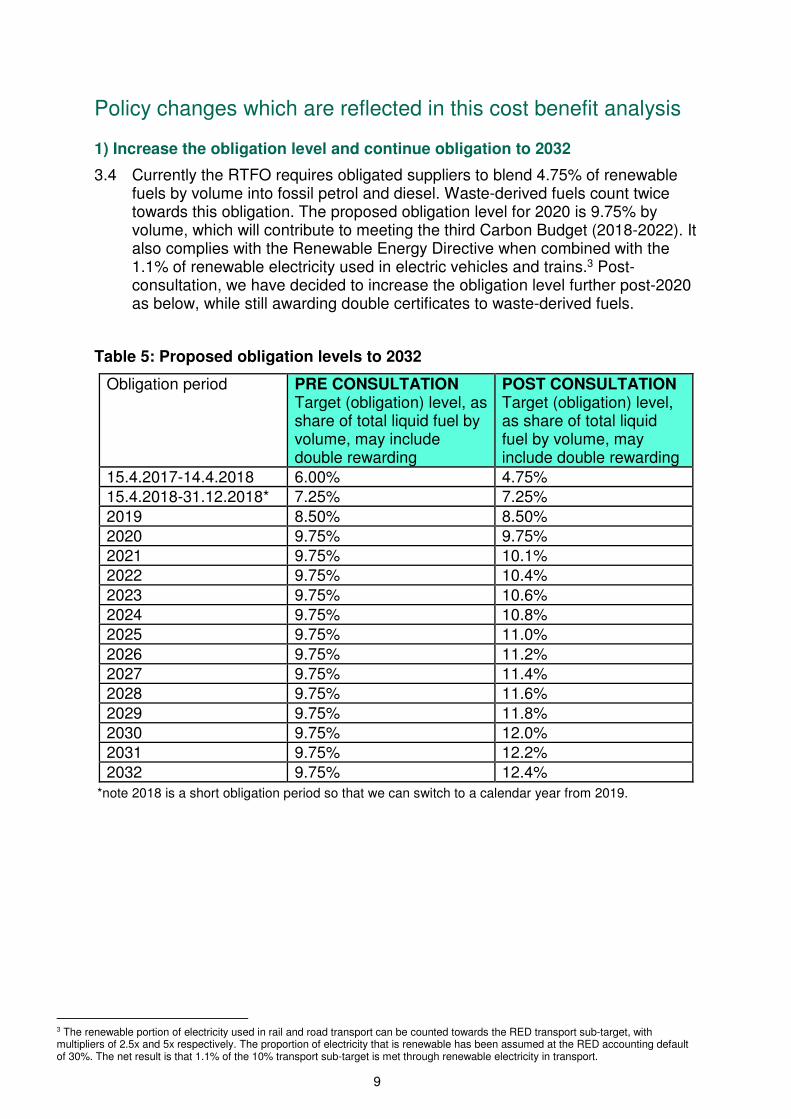
3.4 Currently the RTFO requires obligated suppliers to blend 4.75% of renewable fuels by volume into fossil petrol and diesel. Waste-derived fuels count twice towards this obligation. The proposed obligation level for 2020 is 9.75% by volume, which will contribute to meeting the third Carbon Budget (2018-2022). It also complies with the Renewable Energy Directive when combined with the 1.1% of renewable electricity used in electric vehicles and trains.3 Post-consultation, we have decided to increase the obligation level further post-2020 as below, while still awarding double certificates to waste-derived fuels.
Table 5: Proposed obligation levels to 2032
Obligation period PRE CONSULTATION Target (obligation) level, as share of total liquid fuel by volume, may include double rewarding
POST CONSULTATION Target (obligation) level, as share of total liquid fuel by volume, may include double rewarding
15.4.2017-14.4.2018 6.00% 4.75%
15.4.2018-31.12.2018* 7.25% 7.25%
2019 8.50% 8.50%
2020 9.75% 9.75%
2021 9.75% 10.1%
2022 9.75% 10.4%
2023 9.75% 10.6%
2024 9.75% 10.8%
2025 9.75% 11.0%
2026 9.75% 11.2%
2027 9.75% 11.4%
2028 9.75% 11.6%
2029 9.75% 11.8%
2030 9.75% 12.0%
2031 9.75% 12.2%
2032 9.75% 12.4%
*note 2018 is a short obligation period so that we can switch to a calendar year from 2019.
3 The renewable portion of electricity used in rail and road transport can be counted towards the RED transport sub-target, with multipliers of 2.5x and 5x respectively. The proportion of electricity that is renewable has been assumed at the RED accounting default of 30%. The net result is that 1.1% of the 10% transport sub-target is met through renewable electricity in transport.

10
2) Introduce a sub-target for particular 'development' fuels
3.5 To take advantage of the commercial opportunities and environmental benefits of advanced renewable fuels we propose the introduction of a 'development fuels sub-target' to incentivise the production of new, more sustainable advanced fuels from waste feedstocks. We have decided to focus this sub-target on specific fuels that are most consistent with the UK’s long term strategic needs, namely those suited for aviation and road freight where electrification options are most limited. In addition we seek to incentivise fuels that broaden the base of waste feedstocks beyond those currently processed. To give industry time to ramp up supply, the proposal is to require 0.05% of fuels (by volume) to come from 'development' fuels in 2019, increasing gradually to 1.4% in 2032. There will be separate certificates awarded for development fuels under the RTFO, dRTFCs. These will be used to meet the development fuels sub-target, or alternatively can be used to meet the main obligation. The development sub-target will have its own buy-out price, which will be set at 80 pence per certificate (up to £1.60 per litre of fuel).
Table 6: the volume requirements of the development fuels sub-target are:
Obligation period
PRE CONSULTATION Sub target (obligation) level, includes double rewarding
POST CONSULTATION Sub target (obligation) level, includes double rewarding
Resultant "development" renewable fuel supply as proportion of total fuel supply (by volume)*
15.4.2017-14.4.2018
0.1%
15.4.2018-31.12.2018*
0.2%
2019 0.3% 0.1% 0.05%
2020 0.4% 0.15% 0.075%
2021 0.6% 0.5% 0.25%
2022 0.8% 0.8% 0.4%
2023 1% 1% 0.5%
2024 1.2% 1.2% 0.6%
2025 1.4% 1.4% 0.7%
2026 1.6% 1.6% 0.8%
2027 1.8% 1.8% 0.9%
2028 2% 2% 1%
2029 2.2% 2.2% 1.1%
2030 2.4% 2.4% 1.2%
2031 2.4% 2.6% 1.3%
2032 2.4% 2.8% 1.4%
Post-2032 2.4% Review obligation in line with Carbon Budget 6
* As development fuels will be eligible for double reward, the resultant development fuel supply is calculated as half of the sub-target. However, the actual development
11
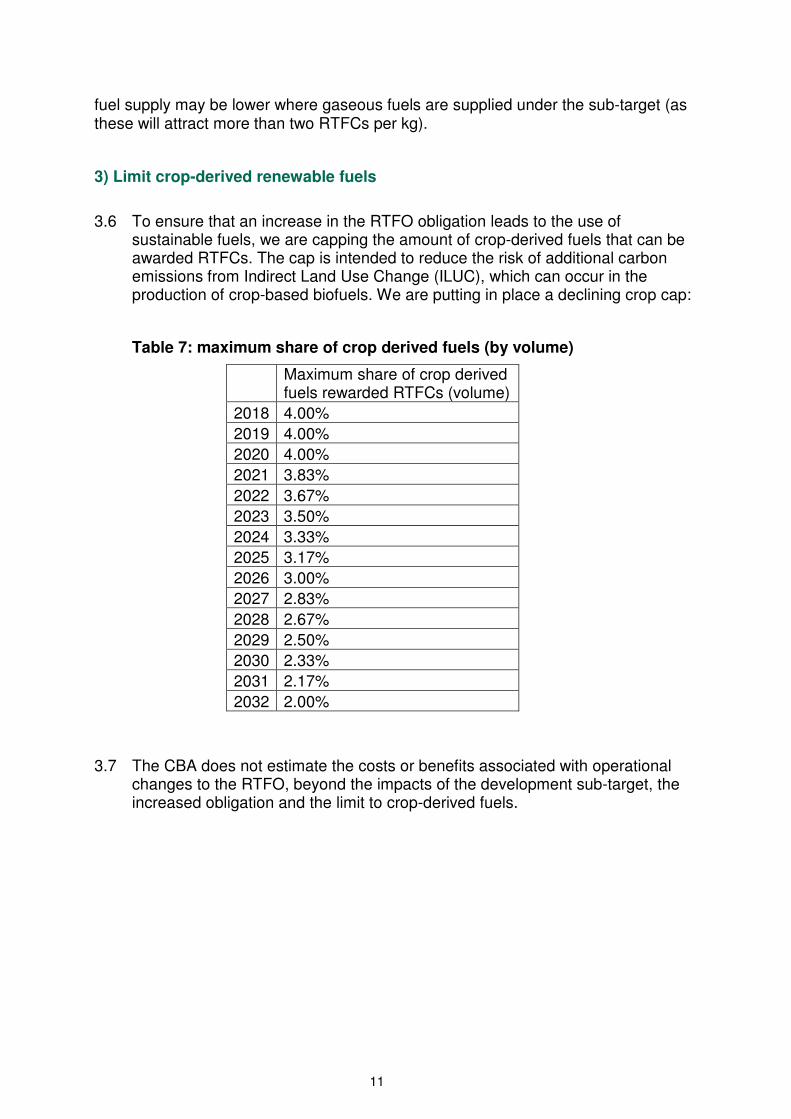
fuel supply may be lower where gaseous fuels are supplied under the sub-target (as these will attract more than two RTFCs per kg).
3) Limit crop-derived renewable fuels
3.6 To ensure that an increase in the RTFO obligation leads to the use of
sustainable fuels, we are capping the amount of crop-derived fuels that can be awarded RTFCs. The cap is intended to reduce the risk of additional carbon emissions from Indirect Land Use Change (ILUC), which can occur in the production of crop-based biofuels. We are putting in place a declining crop cap:
Table 7: maximum share of crop derived fuels (by volume)
Maximum share of crop derived fuels rewarded RTFCs (volume)
2018 4.00%
2019 4.00%
2020 4.00%
2021 3.83%
2022 3.67%
2023 3.50%
2024 3.33%
2025 3.17%
2026 3.00%
2027 2.83%
2028 2.67%
2029 2.50%
2030 2.33%
2031 2.17%
2032 2.00%
3.7 The CBA does not estimate the costs or benefits associated with operational
changes to the RTFO, beyond the impacts of the development sub-target, the increased obligation and the limit to crop-derived fuels.

12
4. Analytical approach, evidence, uncertainties and sensitivities
Analytical approach
Estimating changes in fuel use, resource cost and carbon savings
4.1 The impacts of policy amendments are estimated in four steps:
1 Determine the volume of different fuels supplied under the baseline
2 Quantify the expected change in fuels used relative to the baseline once the new policy has been implemented (i.e. less fossil, more renewable, and a changing share of feedstocks)
3 Based on this change, estimate carbon saved/emitted through the increased use of renewable fuels (benefit estimate) and change in resource cost (cost estimate). In addition, we have estimated net value added to the UK economy as a benefit
4 Use cost and benefit estimates to generate a range of net present value estimates
4.2 The flow chart below shows the four steps and highlights where there is considerable uncertainty around key inputs:
1) Baseline - expected fuel use in do-nothing scenario
Demand uncertainty is low (dieselisation, total demand)
Market price uncertainty is high addressed through low/central/high
resource cost scenarios
2) Projected change in fuel use under policy scenario
3) Projected change in resource cost and carbon emissions
As above plus additional uncertainty associated with fuel uptake and
impact of policy on market prices
As above plus additional uncertainty around quantification and valuation
of carbon benefits
4) Net Present Value estimates

13
4.3 To estimate the quantity of different renewable fuels supplied under the baseline and new policy (steps 1 and 2), we assume that fuel suppliers meet the obligation at least cost subject to certain constraints. The estimated supply of fuels under the baseline and new policy is based on assumptions about overall demand for road transport fuel, the petrol/diesel split, blending limits and projections of the relative costs of supplying different types of fuel.
4.4 The calculation of fuel costs and carbon benefits for the central scenario (step 3) draws on the estimated fuels supplied, estimated in steps 1 and 2. To estimate the costs we combine the estimated fuels supplied under the baseline and new policy with estimates of the resource cost differential between renewable fuels and fossil fuels.4 (This uses resource cost estimates in £/MWh, to account for the different energy density of different fuels.)
4.5 To estimate the benefits of each option, we combine the estimated fuels supplied under the baseline and new policy with estimates of the greenhouse gas intensity of renewable and fossil fuels. This allows us to calculate the change in carbon emissions relative to the baseline. We then value the changes in emissions in each year following guidance published by BEIS.
Estimating Net Value Added to the UK economy
Estimating economic value added per litre:
4.6 We calculate an average cost of the inputs to each fuel (UCO for biodiesel, wheat for ethanol). We then look at the corresponding price data for the outputs (biodiesel, ethanol and the by-product "distillers grains" (DDGS), which is used as animal feed), to calculate gross value added per litre of biofuel.
Estimating share of RTFO supply coming from UK sources:
4.7 We then estimate what share of additional biofuel feedstocks come from UK sources. Combined with our processing assumptions, this gives us the total additional biofuels supply processed in the UK. To calculate this, we looked at the total of each biofuel supplied in year 7 of the RTFO, calculated the share that came from UK sources, and developed three scenarios for sources of additional future supply:
• Optimistic: Same proportions UK/abroad as present
• Pessimistic: All additional biofuel comes from abroad
• Central: Halfway between optimistic and pessimistic
Estimating share of biofuels processed in UK:
4.8 For this, we assume that all biofuels that come from UK feedstocks and that are supplied into the UK are also processed here. For biofuels that are sourced from abroad, we first calculate the current share of UK-processed biofuels that come from non-UK feedstocks, by taking total production of that biofuel and the total quantity of that biofuel supplied into the UK that also uses a UK feedstock.
4 Please note that the cost of blending renewable fuels and generating RTFCs depends on the difference in market prices between fossil fuels and renewable fuels, which is why we use the terms "price projections" and "cost projections" interchangeably in this CBA.
14
Once this share is calculated, we again create three scenarios that match up with those above:
• Optimistic: 50% increase in current proportion of imported biofuel feedstocks processed in UK
• Pessimistic: 50% decrease in current proportion of imported biofuel feedstocks processed in UK
• Central: Processing - same proportion of imported biofuel feedstocks processed in UK as present
Estimating Gross Value Added
4.9 To calculate the gross value added to the UK economy by the biofuels industry, we use the figures outlined above to calculate what proportion of the additional biofuels supplied under the RTFO CBA scenarios are produced in the UK in each year, and then multiply this by our economic value added per litre estimates.
Factoring in additionality
4.10 Gross value added, however, does not provide a full picture of the economic impacts. It is very likely that at least some of the capital investment and jobs created in this industry will simply be diverted from other uses and are therefore not really additional. We must therefore estimate how much of this impact is additional to a ‘do-nothing’ baseline.
4.11 To do so, we have calculated three ‘additionality’ percentages, which estimate what proportion of the gross impacts are additional to the baseline and therefore a benefit attributable to the policy. These are based on information given to us by the biofuels industry, and match up to the three scenarios outlined above. These are then multiplied by their respective gross value-added estimates to give us a range of net value-added estimates.
4.12 We consider that some of the value which is not additional and which would have been generated in the UK economy in the absence of this policy would have come from the fossil fuel industry. Hence some of the value lost to the fossil fuel industry is indirectly taken into account here. However, we appreciate that this may not fully reflect the impact of the policy on the fossil fuel industry.
Converting to Net Present Values (NPVs)
4.13 Once we have net value-added figures for each year, we time-discount these according to the standard Green Book guidance, using an annual discount rate of 3.5% and taking 2015 as the base year. This gives us the final monetised impacts that can be compared and combined with the rest of the RTFO CBA analysis.
Assumptions
4.14 Profit and spending on capital and labour are considered additional to the baseline; feedstock and operating costs are not. All biofuels supplied under the RTFO and with feedstocks sourced from the UK are assumed to have been

15
processed/produced in the UK. The value-added per litre of biofuel remains constant in real terms until 2030.
4.15 Due to limited information, at present we assume that the share of advanced biofuels processed in the UK is equivalent to that of waste biodiesel. This assumption may be revised if further information comes to light.
4.16 There are a range of other economic benefits that are extremely difficult to quantify. These include the potential benefits for energy security from associated UK production and reduced reliance on imported animal feed. We have not attempted to quantify these.
4.17 The final step in the analysis is to combine all the estimated costs and benefits of each option, and discount them to produce net present value estimates.
Evidence and assumptions
4.18 The evidence and assumptions we use to model impacts build on the evidence agreed by Working Group 1 of the Transport Energy Taskforce in early 20155 and have more recently been shared and tested with stakeholders, at a workshop in December 2015. Some aspects of these have been updated post-consultation. They are explained in detail in Appendix 1 and include:
• Projections for road transport energy demand from BEIS's Energy Projections
• Projections for petrol/diesel split from DfT scenarios and BEIS's Energy Projections
• Price projections for the different types of renewable fuels supplied under the RTFO
• Different scenarios for E10 uptake: No E10, High E10 and central E10
• Contribution of electricity to meeting the RED sub-target
• Availability of waste-derived fuels
• Assumed carbon intensity of different fuels
• Value of carbon savings
Key uncertainties and sensitivity analysis
4.19 Below, we explain what we consider to be the main uncertainties in the modelling, by order of impact/importance, and how we have addressed the uncertainty:
• Difference in costs of supplying renewable fuels and fossil fuels
• Uptake of E10 fuel
• Use of crop biodiesel
• Dieselisation of the vehicle fleet
• Waste biodiesel price/availability
• Valuing carbon savings
5 http://www.lowcvp.org.uk/projects/transport-energy-task-force.htm
16
• ILUC factors
• 'Development' renewable fuels availability
• Biomethane uptake
• The uncertainties around blending of biofuels into NRMM (fuels used for non-road mobile machinery)
Difference in costs of supplying renewable fuels and fossil fuels
4.20 The uncertainty around the policy costs is driven by a range of factors. The key single factor we have identified is uncertainty around market price developments, i.e. how renewable fuel prices change in relation to fossil fuel prices. Global energy and commodity markets are inherently volatile and future market developments are notoriously difficult to predict, but the price spread between fossil fuels and renewable fuels determines the cost impact of the policy. To capture this uncertainty, we have developed low/central/high projections of the price spreads between renewable fuels and fossil fuels. (See Appendix 1 for details)6 These are based on historical spreads and are projected independently of the underlying fossil fuel prices and commodity prices. In the analysis, they are used to generate ranges of cost estimates and net present values.
4.21 In our central price scenarios, the spreads between fossil fuels and renewable fuels fall steadily, since historically the cost of renewable feedstocks has fallen faster than the cost of fossil fuels. We also consider the possibility of spreads either rising (high price scenario) or falling faster (low price scenario).
Uptake of E10 fuel
4.22 There is also high uncertainty around the future uptake of E10 due to a range of factors including consumer acceptance. The future uptake of E10 has a significant impact on which mix of renewable fuels is likely to be supplied but it has a less significant impact on costs and benefits.
4.23 Since ethanol has significantly lower energy density than petrol, fossil diesel or renewable diesel, whether E10 is introduced and the extent of uptake affects how much total renewable energy is supplied. We have developed three different uptake scenarios for E10 to estimate the impact on total renewable energy being supplied. The different E10 uptake scenarios are:
i) no uptake (the UK continues to use E5)
ii) medium uptake (a mid point between E5 and high uptake) = central scenario
iii) high uptake (85% E10 and 15% E5)
4.24 For quantifying costs and benefits in this CBA, we use the central scenario 'moderate E10 uptake'. In section 5, we show as a sensitivity analysis what
6 Please note that the cost of blending renewable fuels and generating RTFCs depends on the difference in market prices between fossil fuels and renewable fuels, which is why we use the terms "price projections" and "cost projections" interchangeably in this CBA.
17
different levels of E10 uptake would mean for renewable energy being delivered as well as costs and benefits.
4.25 Sections of industry have commented that they consider a 'moderate' E10 uptake highly unlikely, because there are limitations to the refining and refuelling infrastructure that make it challenging to supply a wider variety of fuel grades than currently available. As such, the view of some stakeholders in the industry is that the 'no E10 uptake' and 'high E10 uptake' are more likely than our central scenario. However, the experience in other countries which have deployed E10 has generally not been a wholesale switch of the standard grade of petrol from E5 to E10. In Germany, France and the Netherlands there has been a moderate uptake of E10, with some refuelling stations offering E5 whilst others offer E10. As in the UK, there are few forecourts in these countries that offer more than two grades of petrol (typically 'super' and standard grade), so typically individual fuel stations either have E5 or E10 as the standard grade.
Use of crop biodiesel
4.26 The higher crop cap in the early years of the policy allows potentially for the use of some crop biodiesel. It is uncertain under which circumstances the market would supply this, as it is currently nearly absent from the UK fuel supply. If the crop cap allows crop biodiesel, its use may still be limited by the B7 blendwall of biodiesel. For the purpose of a sensitivity analysis, we have included some crop biodiesel up to the B7 blendwall in the early years of the policy.
Waste biodiesel availability/price
4.27 The market for waste biodiesel has a slightly different dynamic from the other renewable fuels, since it has fewer uses and would not be traded globally if it was not for European demand for it as a transport fuel. The demand for waste biodiesel is driven by EU renewables policy and is set to increase between now and 2020. In addition to the uncertainty of global commodity markets, which indirectly affect waste biodiesel prices, there is also significant uncertainty around the availability of waste feedstocks and how the prices of waste derived fuels will respond to a significant increase in European (and UK) demand in the run-up to 2020.
4.28 For the pre-consultation CBA we looked at different cost projections just for waste biodiesel. Consultation responses assured us that in principle enough waste biodiesel can be supplied. And given that the policy now includes a crop cap, which is unlikely to be filled with crop ethanol in the early 2020s, there will be less upward market pressure on waste biodiesel prices than we considered for policy options 2 and 3 and for the sensitivity analyses of the pre-consultation CBA. The central scenario in this CBA uses the same waste biodiesel cost projections that were previously used for policy option 1 with no crop cap. We still include a sensitivity analysis for a scenario where waste biodiesel becomes scarce and market prices increase significantly.
Dieselisation of the vehicle fleet
4.29 The dieselisation of the fleet is relevant, since it determines how much ethanol can be blended, and blending ethanol is expected to remain the most cost-

18
effective option for generating RTFCs. We use BEIS' EEP projections for our central diesel/petrol split and also perform a sensitivity analysis using a declining diesel share. (See appendices for details)
Valuing carbon savings
4.30 We use BEIS carbon values for carbon savings in the non-traded sector to estimate carbon saving benefits. Alongside their central values, BEIS also provide high and low carbon values, which we have used for a sensitivity analysis.
ILUC factors, and GLOBIOM as sensitivity test
4.31 There is some uncertainty around the amount of carbon saved by the policy, and specifically around the importance of indirect land use change for different renewable fuels.
4.32 The greenhouse gas intensities we use reflect lifecycle emissions and take account of ILUC emissions factors published in the revised Renewable Energy Directive, which provide current best evidence on the net greenhouse gas benefits of using biofuels. (See appendix for values.)
4.33 As a sensitivity, we also repeat the analysis with ILUC factors from the recently published GLOBIOM study. Recent research published by the GLOBIOM consortium, commissioned by the European Commission, has suggested that ILUC emissions from crop-based biofuels may be significantly higher than previous estimates.7 This is especially so for crop-based biodiesels.
4.34 We have therefore examined the effects of a 'GLOBIOM' scenario on our central scenario. ILUC values from the directive and from the GLOBIOM study are shown in Appendix 1. Using GLOBIOM values reduces carbon savings NPVs are shown in Annex 4.
'Development' renewable fuels availability
4.35 The fuels required by the development fuel sub-target may not be available in 2019 when the development sub-target is introduced. We have included a high cost estimate across all scenarios for these fuels for 2019 and 2020 to account for the possibility of buy out.
Non-Road Mobile Machinery (NRMM)
4.36 There is also uncertainty regarding the future share of renewable fuels that is used in non-road mobile machinery. This fuel counts towards the RTFO but not towards the RED. If there was a significant increase in renewable fuels being used in NRMM, this would increase the risk of the RED target not being met, however this seems unlikely. In the analysis, we assume that biodiesel is only blended in road diesel. As the biodiesel blend in road diesel approaches the blendwall, we may see some biodiesel blended into NRMM fuels or used in HGVs and busses as high blends. However, we would not expect this to
7 https://ec.europa.eu/energy/sites/ener/files/documents/Final%20Report_GLOBIOM_publication.pdf

19
happen, unless there is a significant shift to petrol and away from diesel, which would reduce the maximum capacity for biodiesel blending in road fuel.
Biomethane
4.37 Biomethane uptake scenarios were developed for the 2015 amendments to the RTFO and are also included in the baseline of this analysis. (Details are in Appendix 1.)

20
5. Impacts of the policy on fuels supplied and GHG emissions
Baseline fuel supply
5.1 In the absence of any amendments, we would expect the proportion of renewable fuels to continue at similar levels to those seen in recent years. Our projections for total demand and for the petrol/diesel split are based on BEIS's Energy and Emissions Projections 2016 (EEP)8. (Details are shown in Appendix 1). Projected baseline volumes are shown in chart 2.
Chart 2: expected supply of biofuels under the RTFO baseline
5.2 We do not expect the fuels supplied to vary between low/central/high price scenarios. This is because the relative cost effectiveness of generating RTFCs from different fuels is not expected to change between different price scenarios (e.g. ethanol is always expected to be the cheapest per litre, and the price of waste biodiesel is always higher than the price of crop biodiesel per litre).
8 https://www.gov.uk/government/collections/energy-and-emissions-projections

21
Fuel supply under the policy
Impacts of the increased obligation and development fuels sub-target
5.3 Increasing the RTFO obligation and introducing a development fuel sub-target requires larger volumes of renewable fuels to be used than under the baseline. For our central scenario we assume moderate uptake of E10, which drives the amount of ethanol that can be supplied. We look at high E10 and No E10 as a sensitivity. We do not expect significant volumes of crop biodiesel to be supplied but we look at potential supply of crop biodiesel as a sensitivity.
Chart 3: overview of renewable fuels supplied 2018-2032 by volume - central scenario
5.4 This fuel supply would meet the transport sub-target of the RED in 2020 and would also contribute to meeting the 2020 FQD target.
Table 8: contribution to the 2020 Fuel Quality Directive target
% contribution to 6% FQD target 2019 2020
With policy 3.81% 4.45%
22
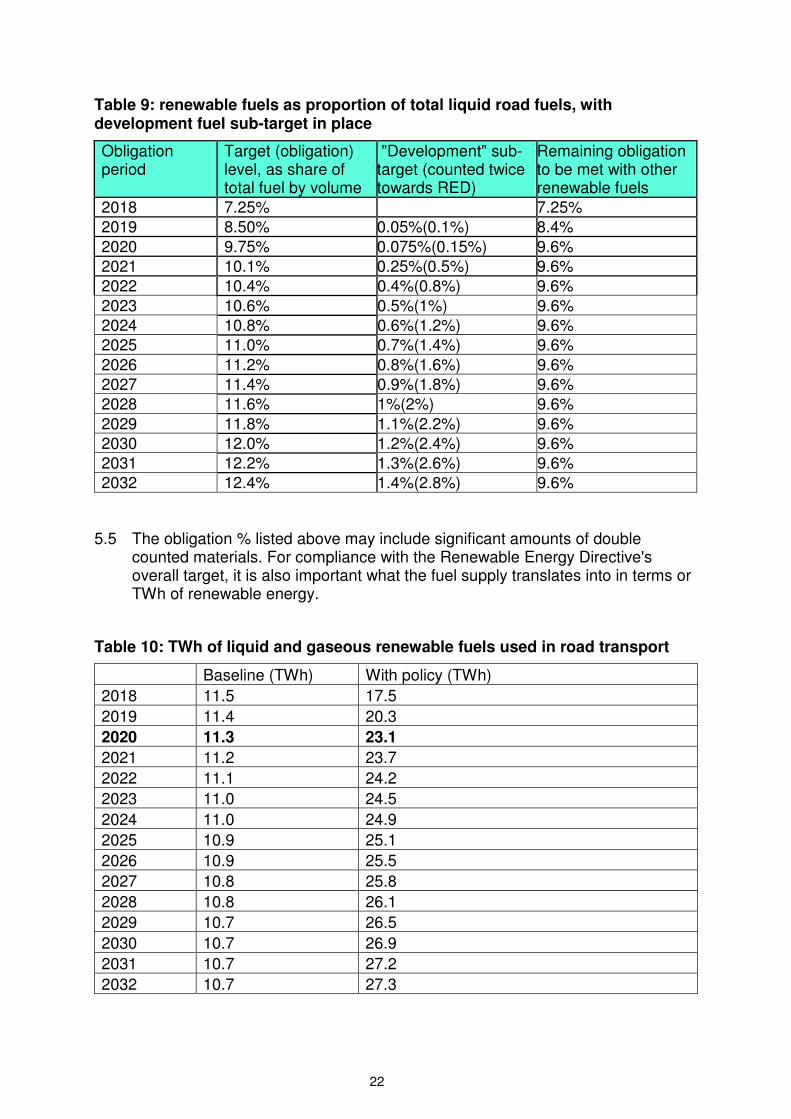
Table 9: renewable fuels as proportion of total liquid road fuels, with development fuel sub-target in place
Obligation period
Target (obligation) level, as share of total fuel by volume
"Development" sub-target (counted twice towards RED)
Remaining obligation to be met with other renewable fuels
2018 7.25% 7.25%
2019 8.50% 0.05%(0.1%) 8.4%
2020 9.75% 0.075%(0.15%) 9.6%
2021 10.1% 0.25%(0.5%) 9.6%
2022 10.4% 0.4%(0.8%) 9.6%
2023 10.6% 0.5%(1%) 9.6%
2024 10.8% 0.6%(1.2%) 9.6%
2025 11.0% 0.7%(1.4%) 9.6%
2026 11.2% 0.8%(1.6%) 9.6%
2027 11.4% 0.9%(1.8%) 9.6%
2028 11.6% 1%(2%) 9.6%
2029 11.8% 1.1%(2.2%) 9.6%
2030 12.0% 1.2%(2.4%) 9.6%
2031 12.2% 1.3%(2.6%) 9.6%
2032 12.4% 1.4%(2.8%) 9.6%
5.5 The obligation % listed above may include significant amounts of double counted materials. For compliance with the Renewable Energy Directive's overall target, it is also important what the fuel supply translates into in terms or TWh of renewable energy.
Table 10: TWh of liquid and gaseous renewable fuels used in road transport
Baseline (TWh) With policy (TWh)
2018 11.5 17.5
2019 11.4 20.3
2020 11.3 23.1
2021 11.2 23.7
2022 11.1 24.2
2023 11.0 24.5
2024 11.0 24.9
2025 10.9 25.1
2026 10.9 25.5
2027 10.8 25.8
2028 10.8 26.1
2029 10.7 26.5
2030 10.7 26.9
2031 10.7 27.2
2032 10.7 27.3

23
Table 11: progress towards meeting the RED transport sub-target
Some tables are by volume Some are by energy
Obligation period
Target (obligation) level, as share of total liquid fuel by volume
% of transport sub-target met through renewable fuels with E5 (estimate, includes double rewarding and development fuel sub-target, by energy
% of transport sub-target met through renewable fuels with moderate E10*** (estimate, includes double rewarding and development fuel sub-target) by energy
% of transport sub-target met through renewable fuels with high E10** uptake (estimate, includes double rewarding and development fuel sub-target) by energy
1/1/2019 – 31/12/2019
8.50% 8.1% 8.0% 7.9%
1/1/2020 – 31/12/2020
9.75% 9.4% 9.2% 9.0%
2020 contribution renewable electricity
1.1% (4.77 TWh) 1.1% (4.77 TWh) 1.1% (4.77 TWh)
Total 10.5% 10.3% 10.1%
* note 2018 is a short obligation period so that we can switch to a calendar basis.
** Assumes 15% of E5 and 85% of E10 on average across the entire petrol supply, i.e. an overall
ethanol content of 9.05% by volume
*** Assumes 59.5% of E5 and 40.5% of E10 on average across the entire petrol supply, i.e. an
overall ethanol content of 6.825% by volume. This is half way between no E10 and high E10 and is
meant to reflect uncertainty around actual E10 uptake.
5.6 Under the Renewable Energy Directive, renewable electricity used in electric road vehicles and trains will also count towards meeting the requirements of the Directive. We expect this to account for 4.77 TWh or 1.1% of the transport sub-target in 2020, based on methodology provided by the RED.9
5.7 In addition to the contribution from E5, E10 and development fuels, we would expect the majority of renewable fuel to come from biodiesel, either waste-derived or crop-derived. This is because there is significant room to deploy biodiesel within the 7% "blend wall" provided by the diesel standard EN590 (nationally, deployment is currently around 3%). We also expect small amounts of other renewable fuels, such as renewable methanol.
5.8 Appendices 2 and 3 show how we would expect supply to develop, both in volume and in energy terms. The chart below shows the overall trajectory.
9 Article 3, paragraph 4, point c, page 14 of the amendments document here: http://eur-lex.europa.eu/legal-content/EN/TXT/PDF/?uri=CELEX:32015L1513&rid=2.

24
Renewable fuel supply above baseline - with policy
5.9 In summary, we expect the below volumes to be supplied under the policy, in
addition to the baseline.
Table 12: renewable fuel additional to baseline
Fuel supplied additional to RTFO baseline
1G Ethanol (million litres)
Waste biodiesel (million litres)
Fuels supplied under the development fuel sub-target (million litres)
Total (million litres)
2018 172 547 361 2019 253 814 3 719 2020 327 1071 15 1071 2021 322 1066 101 1414
2022 319 1061 173 1489 2023 317 1057 220 1553 2024 317 1051 267 1594 2025 317 1043 313 1635 2026 320 1037 359 1673
2027 321 1032 404 1716 2028 324 1025 449 1757 2029 328 1020 494 1797 2030 332 1015 539 1842 2031 337 1011 584 1887 2032 27010 972 630 1931
Carbon savings with policy
5.10 The main benefits that we expect to see from the increased use of renewable fuels are savings in carbon emissions above the baseline of the existing RTFO obligation. The exact savings depend on which fuels are used to meet the increased RTFO obligation and also the development fuel sub-target.
5.11 From the volumes of renewable fuels that are supplied and the volumes of fossil fuel that they displace, we have modelled the savings for the fuel use projected under the central scenario.
10 Plus 72 million litres of advanced ethanol

25
Table 13: estimated total carbon savings additional to baseline with policy, including ILUC, mtCO2
GHG savings additional to baseline,MTCO2e With Policy
2018 1.43
2019 2.14
2020 2.84
2021 3.07
2022 3.26
2023 3.39
2024 3.51
2025 3.62
2026 3.74
2027 3.86
2028 3.98
2029 4.10
2030 4.22
2031 4.35
2032 4.43
Total 52
Sensitivity analysis
High E10 Trajectory
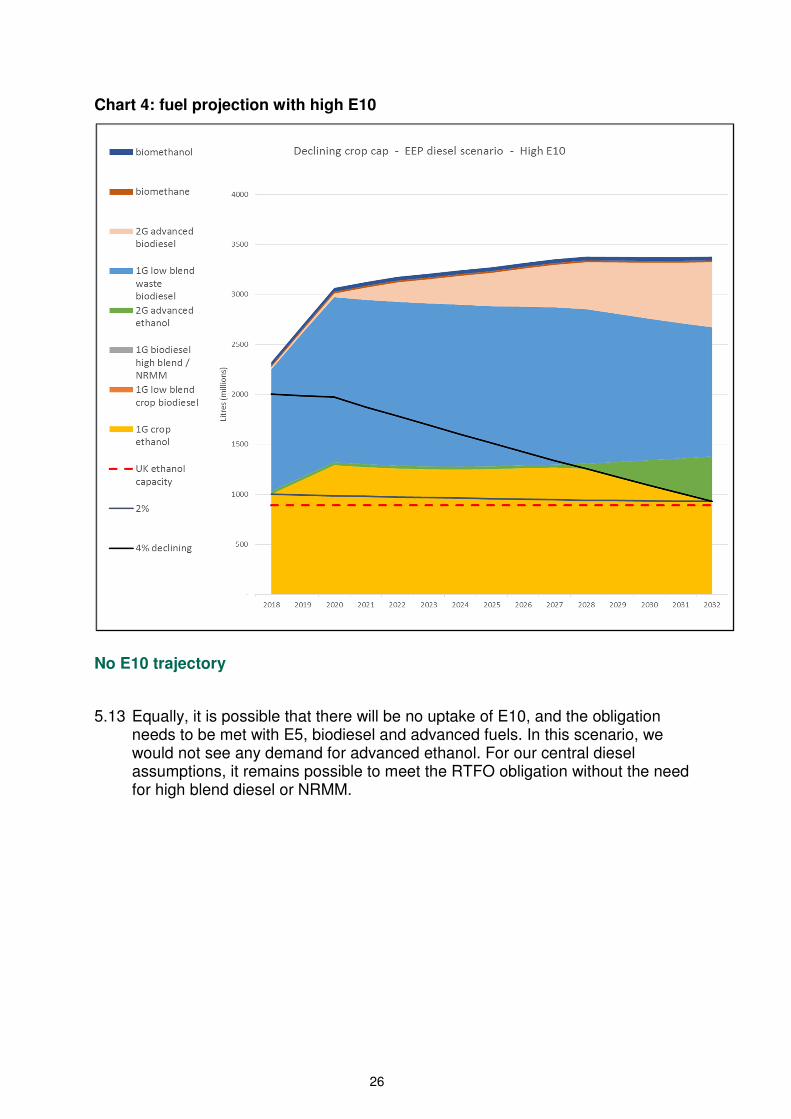
5.12 Since there is considerable uncertainty around the future use of E10, we have considered alternative uptake scenarios. If there is a high E10 uptake, the demand for crop ethanol is likely to exceed the crop cap. At that point, we would expect to see an increased uptake of advanced, waste-derived ethanol post-2028. (Some waste-derived ethanol is already supplied under the current RTFO.)
26
Chart 4: fuel projection with high E10
No E10 trajectory
5.13 Equally, it is possible that there will be no uptake of E10, and the obligation needs to be met with E5, biodiesel and advanced fuels. In this scenario, we would not see any demand for advanced ethanol. For our central diesel assumptions, it remains possible to meet the RTFO obligation without the need for high blend diesel or NRMM.

27
Chart 5: fuel projection without E10
High-crop biodiesel trajectory
5.14 Under the B7 blend wall and the declining crop cap, it would be possible to see significant amounts of crop biodiesel supplied, although we do not consider this likely and it is not part of our central scenario. For illustrative purposes, the chart below shows the maximum possible amount of crop biodiesel that could be supplied under the declining crop cap and the B7 blend wall. The strange shape of this supply profile is due to the blendwall limiting supply from 2020 onwards but not before.

28
Chart 6: possible high-crop biodiesel trajectory (million litres)

29
6. Costs and benefits of the policy
Summary of costs and benefits
6.1 The two tables below show a summary of impacts both for the duration of the policy and for 2020. The range presented in these tables does not cover the full range of values presented in the CBA as it does not include sensitivities.
Table 14: summary of net present value estimates (2018-2033)
Additional to baseline, 2015 prices
Total additional carbon savings
(MTCO2e)
Present value benefits (£m)
Present value costs central estimate (£m)
Present value costs (£m) range
Net present value (£m) range, (benefits minus costs)
Net present value (£m) central estimate
With Policy 52 3567 4276 1534 to 9313 2033 to -5746 -709
Consultation
Option 2 33.6 2303 3107 1213 to 6313 1090 to -4011
-804
Table 15: 2020 pump price impact, crop share, carbon abatement & RED compliance cost
Costs are additional to baseline in 2020, 2015 prices
2020 Resource cost impact, £m (range)
2020
Pump price impact, ppl
(range)
2020
Crop share (% by volume)
RED compliance cost (£/MWh)
Abatement cost (£/TCO2e) in 2020
Average Abatement cost present value (£/TCO2e) 2017-30 or 2018-2032
With Policy
351
(127-725) 0.9 (0.3-1.9)
1.7% (0-4%)
123 (44-256)
119
Consultation
Option 2
366 (143- 729) 1.0 (0.4-2) 2% (0-2%) 31.2
137 (53-273)
95
6.2 The quantified benefits of the proposed changes are lower carbon emissions from transport as well as value added to the UK economy from domestic biofuel production. This includes the expected development of an industry that can deliver low carbon transport fuel in the long run. The main cost impacts are higher fuel costs, since renewable fuels are more expensive than fossil fuels per unit of energy.

30
6.3 These proposed carbon savings are already included in BEIS's latest emissions projections. If they were not realised, additional carbon savings would need to be generated elsewhere in order to meet carbon budgets.
6.4 There is considerable uncertainty around the cost estimates, since the cost impact is driven by two volatile variables, the market price of fossil fuels and the market price of renewable fuels. In spite of significant uncertainties, we have developed projections of the price differential between fossils and renewables. (See Appendix 1.) The price projections are first derived per MWh and not per litre, to account for the different energy content of different fuels. To make them accessible to the audience, we also present them in terms of pence per litre spreads.
6.5 Based on our central price projections, the methodology outlined in Section 4, and the evidence outlined in Appendix 1, the estimated cost impacts and carbon savings of the policy is shown below:
i - Quantified impacts
6.6 The tables below show central estimates of quantified costs and benefits over the duration of the policy
Table 16: cost impacts and carbon savings with policy and above baseline (2015 prices, undiscounted)
Additio-nal to RTFO baseline
Energy used (TWh)
Price premium (£/MWh)
Cost impact (£m)
Pump price impact (ppl)
Carbon savings without ILUC (MTCO2e)
Carbon savings with ILUC (MTCO2e)
Abatement cost* (£/TCO2e)
2018 6.00 30 178 0.47 1.65 1.43 124
2019 8.95 29 263 0.70 2.46 2.14 123
2020 11.84 30 351 0.94 3.27 2.84 123
2021 12.54 31 391 1.06 3.50 3.07 127
2022 13.13 32 423 1.15 3.70 3.26 130
2023 13.51 32 433 1.19 3.83 3.39 128
2024 13.88 32 440 1.21 3.95 3.51 125
2025 14.22 31 444 1.23 4.06 3.62 122
2026 14.61 31 448 1.25 4.19 3.74 120
2027 14.98 30 450 1.26 4.31 3.86 116
2028 15.34 29 448 1.27 4.43 3.98 113
2029 15.73 28 445 1.26 4.56 4.10 109
2030 16.13 27 440 1.25 4.68 4.22 104
2031 16.52 28 463 1.32 4.81 4.35 106
2032 16.62 30 499 1.43 4.88 4.43 113
*includes ILUC factors

31
Net Present Values
6.7 The table below shows the central net present value estimates (NPV = discounted benefits minus discounted costs) for the policy under different cost projection scenarios.
Table 17: summary of NPVs
£m, 2015 prices
Discounted
Low Cost Central Cost High Cost
Total carbon benefits
Net value added
Resource cost
Net cost/ benefit
Resource cost
Net cost/ benefit
Resource cost
Net cost/ benefit
2018 85 16 65 36 160 -59 261 -160
2019 124 24 86 62 229 -81 426 -278
2020 162 31 106 88 295 -102 610 -417
2021 172 43 114 100 318 -104 664 -450
2022 179 51 119 111 332 -102 689 -459
2023 183 56 117 121 329 -91 691 -452
2024 186 60 121 125 323 -78 690 -445
2025 188 63 121 130 314 -63 686 -434
2026 191 67 117 140 307 -50 680 -423
2027 193 70 111 151 298 -35 672 -410
2028 195 72 103 164 287 -20 663 -395
2029 197 75 94 178 275 -3 653 -382
2030 199 77 84 192 263 13 643 -367
2031 216 79 85 210 267 28 643 -348
2032 231 84 89 226 278 37 643 -327
Total 2701 866 1534 2033 4276 -709 9313 -5746
NPVs under sensitivity analysis
6.8 Detailed NPV estimates for sensitivity analyses are shown in appendix 4.
ii - Non-quantified impacts
6.9 Beyond the impacts on resource costs and carbon savings that have been quantified for this cost benefit analysis, we would expect to see wider economic impacts which we have not attempted to quantify.
Impacts on motorists
6.10 Increasing the RTFO obligation level with a crop cap at or above current levels of crop-derived supply (options 1 or 2) will increase the likelihood of E10 being introduced to the market, and there are possible consequences and real consumer impacts associated with the introduction of E10 including:

32
• Limited access to E5 on forecourts, which would be problematic for drivers of older, incompatible cars. This only applies to older petrol cars and by current estimates this will affect around 5% of drivers of petrol cars by 2020.
• The cost per mile driven increases marginally due to the lower energy content of ethanol.
6.11 We are aware of the potential impacts of E10 introduction on E10-unsuitable vehicles, and have examined them as part of the review of the E5 protection grade. We will consult on an extension to the protection grade.
Impacts on fuel suppliers
6.12 The policy represents an increase in demand for the renewable fuels industry as a whole. It also generates the opportunity for a new industry to emerge to supply fuels under the development sub-target. We attempt to reflect this in the CBA through "net value added" estimates for the increase in first generation fuels as well as the supply of development fuels. The value added methodology recognises that not all value generated by these suppliers is new or "additional".
6.13 An increase in the RTFO obligation and the introduction of the "development fuels" sub-target may increase the risk that fossil fuel suppliers will choose to buy out of the obligation.
6.14 The new requirement on the UK to report ILUC impacts of crop-derived fuels is not expected to generate an administrative burden on fuel suppliers but could affect the public image of some fuel suppliers.
6.15 The changes to the 'carry-over' of RTFCs will also have an impact on fuel suppliers, especially the suspension of the RTFC carryover from 2019 to 2020.However, we do not have enough evidence to quantify these impacts.
Impacts on the wider economy
6.16 Apart from contributing to UK carbon budgets, the policy contributes to meeting the requirements of the Fuel Quality Directive, the transport-specific RED sub-target, and the cross-sector 2020 RED target, the latter of which requires 15% of energy to come from renewable sources across heating, electricity generation and transport.
6.17 For the UK economy as a whole, fuel security is expected to increase as dependence on imported fossil fuels decreases.

33
7. Appendices
Appendix 1 - Details of analytical evidence and assumptions
Current share of biofuels and baseline renewable share
7.1 The current share of biofuels is used to estimate biofuel use under the baseline.
The table below shows UK biofuels historically supplied under the RTFO, as recorded in RTFO statistics.11
Table 18: renewable fuels supplied under the RTFO by volume
million litres 2012/13 (Year 5)
2013/14 (Year 6)
2014/15 (Year 7)
2015/16 (Year 8)
Total fuel use
44,706
50,417
50,882
51,666
Single rewarded renewable fuels
805
933
835
920
Double rewarded renewable, after double reward
1,058
1,621
1,662
1,840
Single + double rewarded renewable
1,863
2,554
2,496
2,485
as % of total (incl. double reward)
4.2%
5.1%
4.9%
4.96%
Table 19: fuels supplied historically under the RTFO as % of energy supplied and baseline projections
Fuel 2012/13 (Year 5)
2013/14 (Year 6)
2014/15 (Year 7)
Model Baseline
Biodiesel 1.05% 1.63% 1.57% 1.53%
Ethanol 1.09% 1.01% 0.98% 0.93%
Other fuels 0.07% 0.07% 0.02% 0.14%
Total 2.21% 2.71% 2.57% 2.6%
RED contribution (including fuels that are double rewarded) 3.24% 4.12% 4.01%
4.27%
11 https://www.gov.uk/government/collections/biofuels-statistics

34
Demand projections
7.2 Projections for road transport energy demand from BEIS's EEP 2015:
This is taken from BEIS’s Energy and Emissions Projections (EEP) 2015, Reference scenario. https://www.gov.uk/government/collections/energy-and-emissions-projections
All existing and planned UK government policies are taken into account. It projects that total energy demand will come to 421 TWh and 468 TWh in 2020 (for the purposes of the RED and FQD respectively). Given the relative stability of total energy demand, we have not modelled sensitivities around this.
Chart 7: transport energy demand projections, TWh
Chart 8: transport energy demand projections, million litres

35
7.3 Projections for petrol/diesel split from EEP 2015
This is also taken from BEIS’s EEP 2015. https://www.gov.uk/government/collections/energy-and-emissions-projections
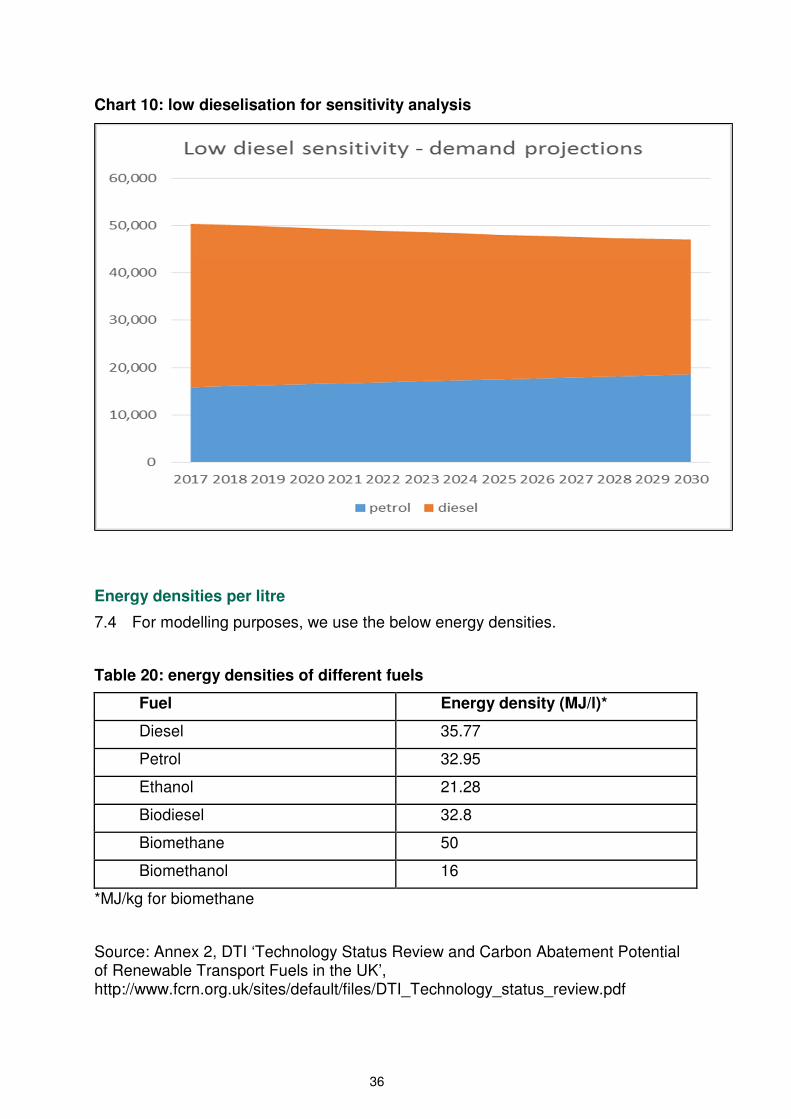
It projects that the diesel share of road transport energy will rise from 65% in 2015 to 70% in 2020. Given potential uncertainty, we have also modelled a ‘low dieselisation’ scenario, where we examine the impact of a reversal in the dieselisation trend.
Chart 9: updated EEP demand projections
36
Chart 10: low dieselisation for sensitivity analysis
Energy densities per litre
7.4 For modelling purposes, we use the below energy densities.
Table 20: energy densities of different fuels
Fuel Energy density (MJ/l)*
Diesel 35.77
Petrol 32.95
Ethanol 21.28
Biodiesel 32.8
Biomethane 50
Biomethanol 16
*MJ/kg for biomethane
Source: Annex 2, DTI ‘Technology Status Review and Carbon Abatement Potential of Renewable Transport Fuels in the UK’, http://www.fcrn.org.uk/sites/default/files/DTI_Technology_status_review.pdf

37
Cost projections for renewable fuels supplied under the RTFO
7.5 The cost of blending renewable fuels and generating RTFCs depends on the difference in market prices between fossil fuels and renewable fuels, which is why we use the terms "price projections" and "cost projections" interchangeably in this CBA.
7.6 Global energy and commodity markets are inherently volatile and future market developments are notoriously difficult to predict. To capture this uncertainty, we have developed low/central/high projections of the price spreads between renewable fuels and fossil fuels. (Charts 12, 14, 16) These are projected independently of the underlying fossil fuel prices and commodity prices.
7.7 The low/central/high cost projections were developed for the price spreads between fossil fuels and renewable fuels per unit of energy and reflect different possible future developments of global fossil oil, vegetable oil and ethanol markets. To make them more accessible to the audience, we have also translated these into price projections per litre. (Charts 13, 15, 17)
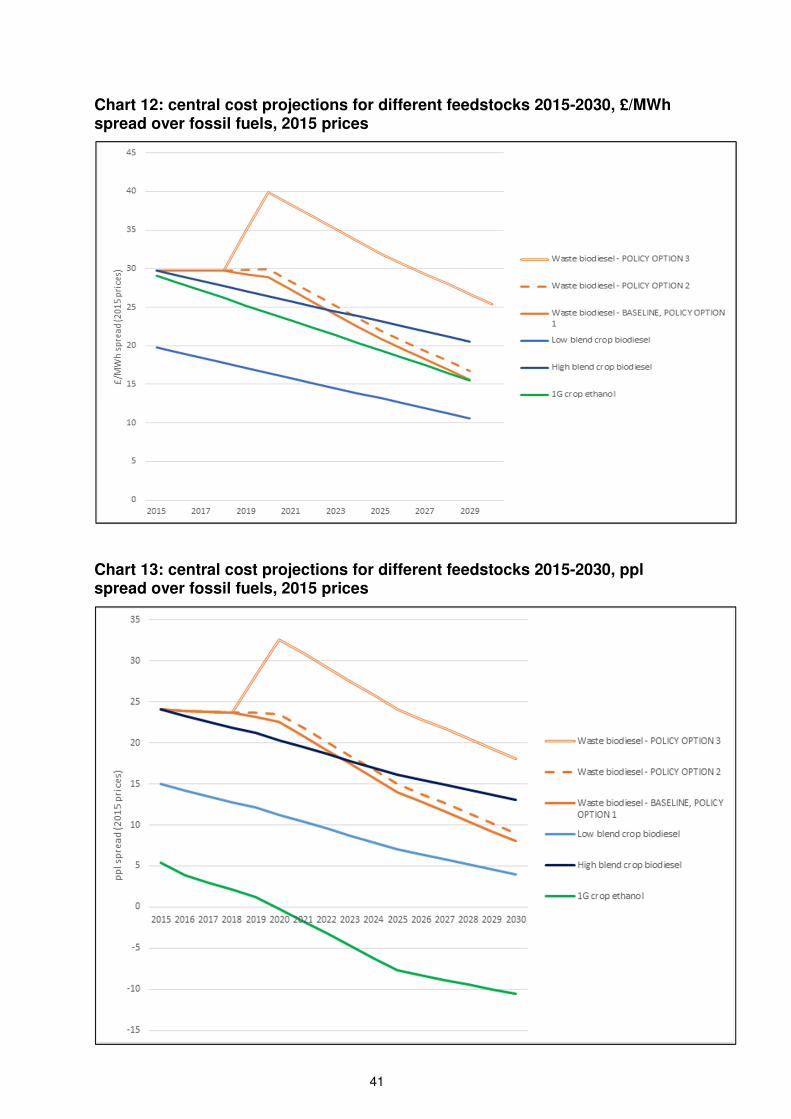
7.8 In our central cost projections, the spreads between fossil fuels and renewable fuels fall steadily, since historically the cost of renewable feedstocks has fallen faster than the cost of fossil fuels. We also consider the possibility of spreads either rising (high cost projections) or falling faster (low cost projections).
7.9 Though the majority of our projections predict ethanol will be more expensive than crop biodiesel in energy terms (£/MWh), as the RTFO is a volume-based measure and ethanol has a relatively low energy density, we anticipate ethanol will still be cheaper by volume (p/litre). We expect that generating RTFCs from blending ethanol will therefore remain most cost-effective for suppliers, and ethanol will be supplied in preference to other fuels up to the blendwall (E5 or E10) and subject to the crop cap.
7.10 The cost projections for "waste biodiesel" are based on the following: 2015 value based upon observed historical diesel- waste biodiesel spreads. This increases to two times the crop biodiesel spread per litre (not per MWh) in 2020, due to a significant increase in demand for waste biodiesel. From 2020, the waste biodiesel spread tracks the crop biodiesel spread (times 2) over the period to 2030.

38
Chart 11: waste biodiesel spreads, central projection
7.11 As illustrated in Charts 14 and 15, under the high cost projections, waste biodiesel prices reach the buy out price in 2020 and stay at the buy-out price (in real terms) from then onwards.
7.12 For the purposes of labelling, 'low blend' biodiesel is defined as biodiesel blended into fossil diesel at proportions up to 7%. All biodiesel used in blends above 7% is defined as 'high blend', which is not suitable for all diesel engines, and is modelled with a cost uplift of 9 pence per litre to represent the higher costs of using this fuel. This is a DfT estimate, which has been validated by stakeholders with experience of using high blend biodiesel.

39
Box1: Central cost projection methodology
Cost projections for waste biodiesel under waste scarcity
7.13 These cost projections were developed for the consultation CBA and have not been amended for the final CBA. The methodology is still sound but the description still refers to the three different policy options. We assume throughout the CBA that waste biodiesel prices will follow the "baseline/policy option 1" trajectory, except for the purposes of sensitivity analysis (Table 34).
7.14 In principle, we assume that the UK is a price taker for renewable fuels and we assume that the policy will have no impact on their market prices through increasing demand. For sensitivity analysis in the consultation, we considered that at higher levels of UK demand for waste biodiesel, the increase in UK demand resulting from the policy could be sufficient to increase the price of waste biodiesel.
7.15 Given that the crop cap is now above 2% for almost the entire duration of the policy, and in line with assumptions used in the consultation CBA, we now use the same cost projections for waste biodiesel that were used for the baseline and for policy option 1 in the consultation CBA.
7.16 We also perform a sensitivity analysis around the central scenario where the cost of waste biodiesel increases due to exogenous scarcity.
7.17 As shown in section 5, while option 1 results in a significant increase in the demand for waste biodiesel relative to the baseline, fuel suppliers retain flexibility to supply crop biodiesel instead. We assume that the price of waste biodiesel is the same under policy option 1 as in the baseline. Under option 2, the crop cap results in a further small increase in the demand for waste biodiesel relative to option 1. Of itself, we would not expect this increase in demand to be sufficient to increase the price of waste biodiesel. However, under option 2, the low crop cap restricts supplier's ability to use crop biodiesel instead of waste biodiesel. We assume this marginally increases the price of
Resource cost projections were derived as below:
• 1G crop ethanol – 2015 value based upon observed historical petrol-ethanol spreads with a gradual decline over time reflecting a gradually rising oil price and agricultural productivity improvements which allow supply to keep pace with increased demand without significant agricultural commodity price rises.
• 1G low blend crop biodiesel – 2015 value based upon observed historical diesel-crop biodiesel spreads, with a gradual decline over time reflecting a gradually rising oil price and agricultural productivity improvements which allow supply to keep pace with increased demand without significant agricultural commodity price rises.
• 1G high blend crop biodiesel – low blend crop biodiesel plus 9ppl
• 1G Waste biodiesel - 2015 value based upon observed historical diesel-waste biodiesel spreads. Going forward, it is a function of the crop biodiesel spread per litre, reaching two times the crop biodiesel spread per litre in 2020. Post-2020 it tracks the crop biodiesel spread (2x) over the period to 2032.
40
waste biodiesel paid. For modelling purposes we have assumed a one penny per litre premium.
7.18 Under option 3, UK waste biodiesel use increases to 2.16 billion litres, significantly above the 1.7bn litres expected under policy option 2 and above the level at which we expect price increases to set in, reflecting the likelihood of significant supply constraints in meeting this level of demand. There is high uncertainty surrounding how an increase in demand of this scale will affect the price that UK suppliers pay for waste biodiesel.
7.19 In assessing the impact of option 3 on prices, we define the concept of a "max scarcity" price of biodiesel. This is defined as being the price of biodiesel that we would see if significant additional demand for waste biodiesel across Europe put pressure on the market and if other EU member states were restricted in their ability to use low blend biodiesel (e.g. by the blend wall). In this situation, the closest substitute for waste biodiesel for some member states would be high blend crop biodiesel and we would expect the international price of waste biodiesel to be driven up to the point where it would cost the same to use one litre of waste biodiesel or two litres of high blend crop biodiesel.
7.20 In a situation where this "max scarcity" scenario is combined with a low crop cap in the UK, we expect the price to increase above this "max scarcity" price, given that the low crop cap will limit UK suppliers' ability to substitute waste biodiesel for any blend of crop biodiesel. For the purposes of modelling we assume that prices increase to one penny per litre above the "max scarcity" price (represented by the highest price projection in charts 18-21).
7.21 Under option 3, we assume that the significant increase in demand for waste biodiesel coupled with a crop cap significantly increase the likelihood that the price of waste biodiesel increases to the "max scarcity" price plus a one penny premium. For the purposes of modelling policy option 3, we assume the price spread increases to a point exactly half way between the waste biodiesel price under a low crop cap and no scarcity (baseline plus 1 penny premium) and the "max scarcity" price plus one penny premium.
7.22 The waste biodiesel price projections converge for policy options 1, 2 and 3, under the high price projections because they all hit the buy-out price in 2020/21. Beyond 2020, the price projections track the buy-out price and decline, as the buy-out price falls in real terms.
41
Chart 12: central cost projections for different feedstocks 2015-2030, £/MWh spread over fossil fuels, 2015 prices
Chart 13: central cost projections for different feedstocks 2015-2030, ppl spread over fossil fuels, 2015 prices

42
Chart 14: high cost projections for different feedstocks 2015-2030, £/MWh spread over fossil fuels, 2015 prices
Chart 15: high cost projections for different feedstocks 2015-2030, ppl spread over fossil fuels, 2015 prices

43
Chart 16: low cost projections for different feedstocks 2015-2030, £/MWh spread over fossil fuels, 2015 prices
Chart 17: low cost projections for different feedstocks 2015-2030, ppl spread over fossil fuels, 2015 prices

44
Chart 18: cost projections assuming higher waste biodiesel prices under baseline (£/MWh), 2015 prices
Chart 19: cost projections assuming higher waste biodiesel prices under baseline (pence per litre), 2015 prices

45
Additional cost projections for waste biodiesel - sensitivity analysis
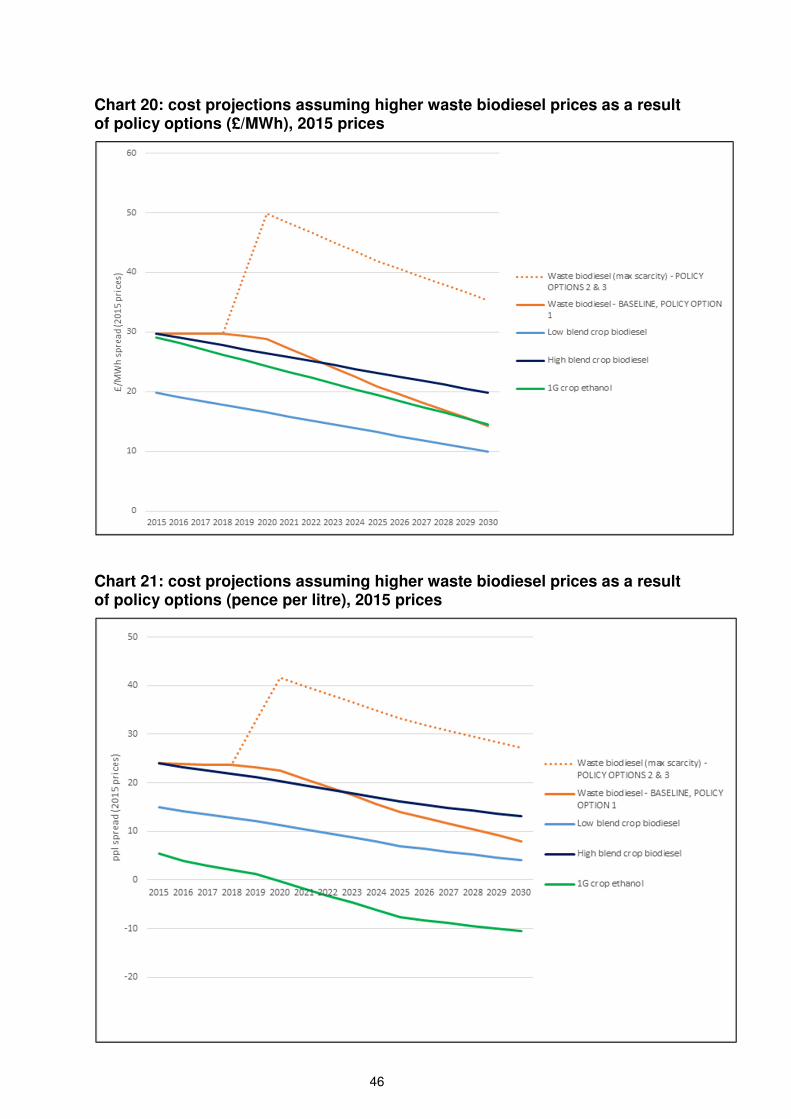
7.23 We have performed two sensitivity tests using alternative assumptions about waste biodiesel prices. The first of these considers the possibility that biodiesel prices are significantly higher than we have assumed for reasons other than the introduction of the policy options considered in this CBA and their impact on UK demand (exogenous price increase). In this scenario we have assumed that the international price of waste biodiesel increases to the "max scarcity" price (see 7.18 above). We also assume that the UK waste biodiesel price increases slightly more under options 2 and 3 as a result of the low crop cap restricting the ability of suppliers to substitute crop biodiesel for waste biodiesel. For modelling purposes, we assume this premium is one penny per litre. The cost projections are set out in charts 18 and 19 below, and the charts show that most of the cost increase also occurs in the baseline.
7.24 The second sensitivity considers the possibility that while baseline waste biodiesel prices are as assumed in our central cost projections, the significant increases in UK demand for waste biodiesel resulting from options 2 and 3 result in significantly greater increases in price than we have assumed in our core low, central and high price scenarios (endogenous price increase). For options 2 and 3 we assume that the price of waste biodiesel increases to the "max scarcity" price (as defined in paragraph 7.18) plus a 1 penny premium to account for the low crop cap as above. The cost projections are set out in charts 20 and 21 below, and the charts show that for this sensitivity, most of the cost increase does not occur in the baseline.
46
Chart 20: cost projections assuming higher waste biodiesel prices as a result of policy options (£/MWh), 2015 prices
Chart 21: cost projections assuming higher waste biodiesel prices as a result of policy options (pence per litre), 2015 prices
47
Cost projections for fuels supplied under development fuels sub-target
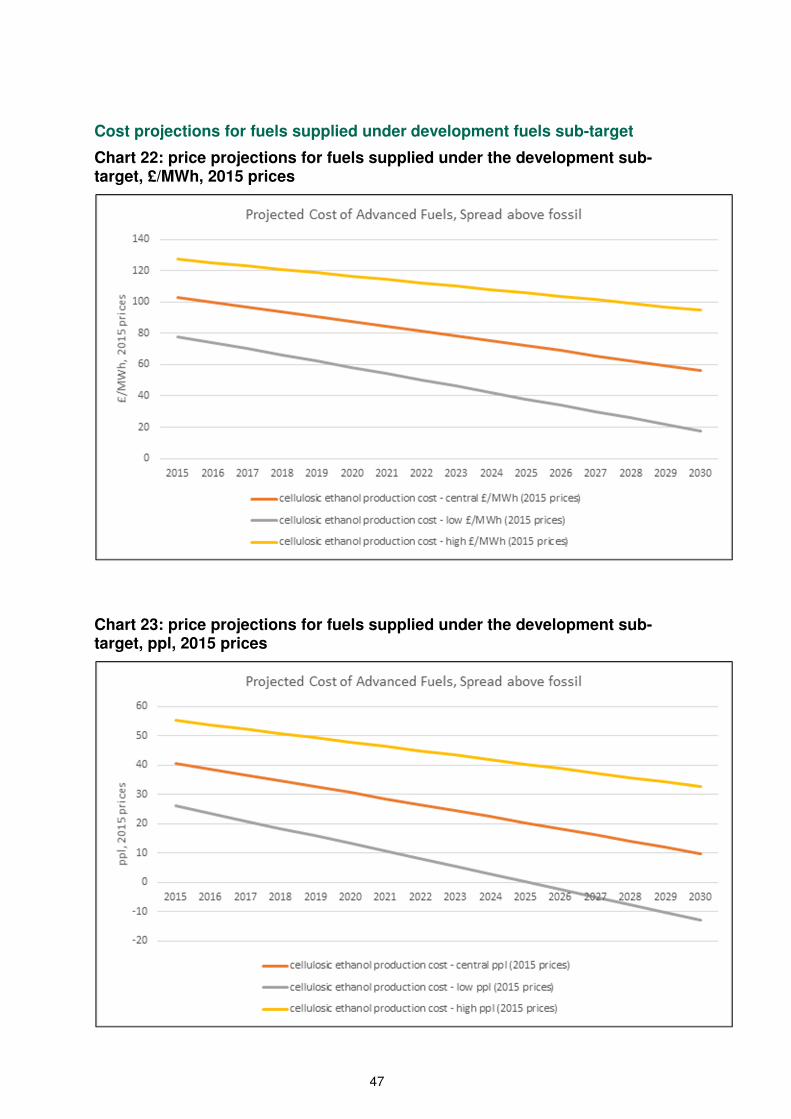
Chart 22: price projections for fuels supplied under the development sub-target, £/MWh, 2015 prices
Chart 23: price projections for fuels supplied under the development sub-target, ppl, 2015 prices
48
7.25 The price projections £/MWh for cellulosic ethanol are also used as a proxy for advanced biodiesel and other waste-derived drop in fuels. Biodiesel has higher energy content per litre, so the price per litre is higher for advanced biodiesel than for cellulosic ethanol. This means we use the supply cost £/MWh of advanced ethanol as a proxy for supply cost of other advanced fuels, due to a lack of other evidence.
Different scenarios for E10 uptake
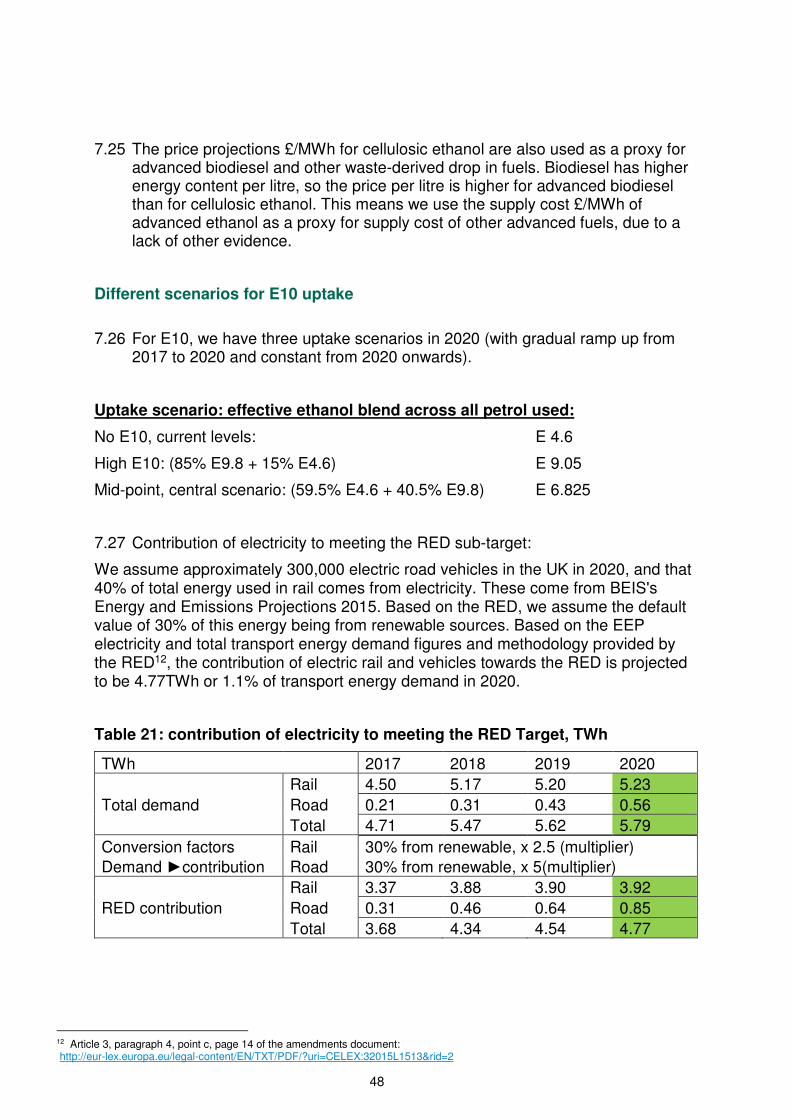
7.26 For E10, we have three uptake scenarios in 2020 (with gradual ramp up from
2017 to 2020 and constant from 2020 onwards).
Uptake scenario: effective ethanol blend across all petrol used:
No E10, current levels: E 4.6
High E10: (85% E9.8 + 15% E4.6) E 9.05
Mid-point, central scenario: (59.5% E4.6 + 40.5% E9.8) E 6.825
7.27 Contribution of electricity to meeting the RED sub-target:
We assume approximately 300,000 electric road vehicles in the UK in 2020, and that 40% of total energy used in rail comes from electricity. These come from BEIS's Energy and Emissions Projections 2015. Based on the RED, we assume the default value of 30% of this energy being from renewable sources. Based on the EEP electricity and total transport energy demand figures and methodology provided by the RED12, the contribution of electric rail and vehicles towards the RED is projected to be 4.77TWh or 1.1% of transport energy demand in 2020.
Table 21: contribution of electricity to meeting the RED Target, TWh
TWh 2017 2018 2019 2020
Rail 4.50 5.17 5.20 5.23
Total demand Road 0.21 0.31 0.43 0.56
Total 4.71 5.47 5.62 5.79
Conversion factors Rail 30% from renewable, x 2.5 (multiplier)
Demand ►contribution Road 30% from renewable, x 5(multiplier)
Rail 3.37 3.88 3.90 3.92
RED contribution Road 0.31 0.46 0.64 0.85
Total 3.68 4.34 4.54 4.77
12 Article 3, paragraph 4, point c, page 14 of the amendments document: http://eur-lex.europa.eu/legal-content/EN/TXT/PDF/?uri=CELEX:32015L1513&rid=2
49
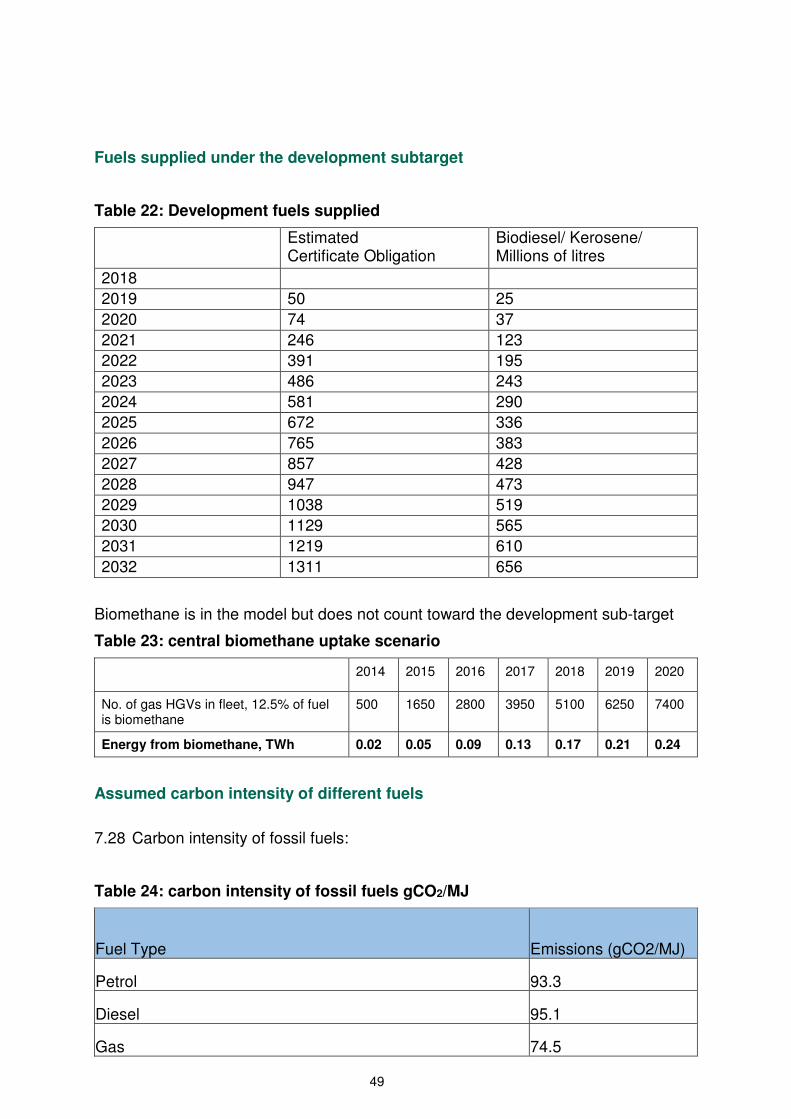
Fuels supplied under the development subtarget
Table 22: Development fuels supplied
Estimated Certificate Obligation
Biodiesel/ Kerosene/ Millions of litres
2018
2019 50 25
2020 74 37
2021 246 123
2022 391 195
2023 486 243
2024 581 290
2025 672 336
2026 765 383
2027 857 428
2028 947 473
2029 1038 519
2030 1129 565
2031 1219 610
2032 1311 656
Biomethane is in the model but does not count toward the development sub-target
Table 23: central biomethane uptake scenario
2014 2015 2016 2017 2018 2019 2020
No. of gas HGVs in fleet, 12.5% of fuel is biomethane
500 1650 2800 3950 5100 6250 7400
Energy from biomethane, TWh 0.02 0.05 0.09 0.13 0.17 0.21 0.24
Assumed carbon intensity of different fuels
7.28 Carbon intensity of fossil fuels:
Table 24: carbon intensity of fossil fuels gCO2/MJ
Fuel Type Emissions (gCO2/MJ)
Petrol 93.3
Diesel 95.1
Gas 74.5

50
Petrol/diesel GHG intensities are based upon Fuel Quality Directive default values -
http://iet.jrc.ec.europa.eu/about-jec/sites/iet.jrc.ec.europa.eu.about-
jec/files/documents/report_2014/wtt_appendix_4_v4a.pdf
Gas GHG intensities are taken from European Commission's JRC Well-to-Wheels report
(GRLG1), April 2014 - http://iet.jrc.ec.europa.eu/about-jec/sites/iet.jrc.ec.europa.eu.about-
jec/files/documents/report_2014/wtt_appendix_4_v4a.pdf
7.29 Carbon intensity of renewable fuels:
Table 25: carbon intensity of renewable fuels gCO2/MJ
Fuel Type Total Ems (gCO2/MJ)
Direct Ems (gCO2/MJ)
Indirect Ems (gCO2/MJ)
1G waste biodiesel (UCO) 14.9 14.9 0.0
1G waste biodiesel (tallow) 72.9 14.9 58.0
1G crop biodiesel 96.8 42.0 54.8
2G advanced biodiesel (land using) 21.0 6.0 15.0
2G advanced biodiesel (non land using) 4.0 4.0 0.0
1G waste ethanol 29.2 29.2 0.0
1G crop ethanol 47.0 35.5 11.5
2G advanced ethanol (land using) 35.0 20.0 15.0
2G advanced ethanol (non land using) 17.0 17.0 0.0
Biomethane 21.4 21.4 0.0
Biomethanol 36.1 36.1 0
1st generation biofuel emissions (direct) are based upon historical RTFO data (from year 4b
onwards) - https://www.gov.uk/government/collections/biofuels-statistics
2nd generation biofuel emissions (direct) have been taken from Renewable Energy Directive,
Annex V, Part E - http://faolex.fao.org/docs/pdf/eur88009.pdf
1st generation crop biofuel emissions (indirect) and 2nd generation biofuel emissions
(indirect) have been taken from the European Commission ILUC impact assessment -
http://eur-lex.europa.eu/legal-content/EN/TXT/PDF/?uri=CELEX:52014SC0127&from=EN
1st generation tallow biodiesel emissions (indirect) have been taken from Ecofys research
http://webarchive.nationalarchives.gov.uk/20110407094507/http://www.renewablefuelsagenc
y.gov.uk/sites/rfa/files/_documents/Appendix_7_-_Tallow_Case_Study_200912231729.pdf
51
7.30 We recognise that for zeros, biofuels are assumed to have zero carbon
emissions associated with them
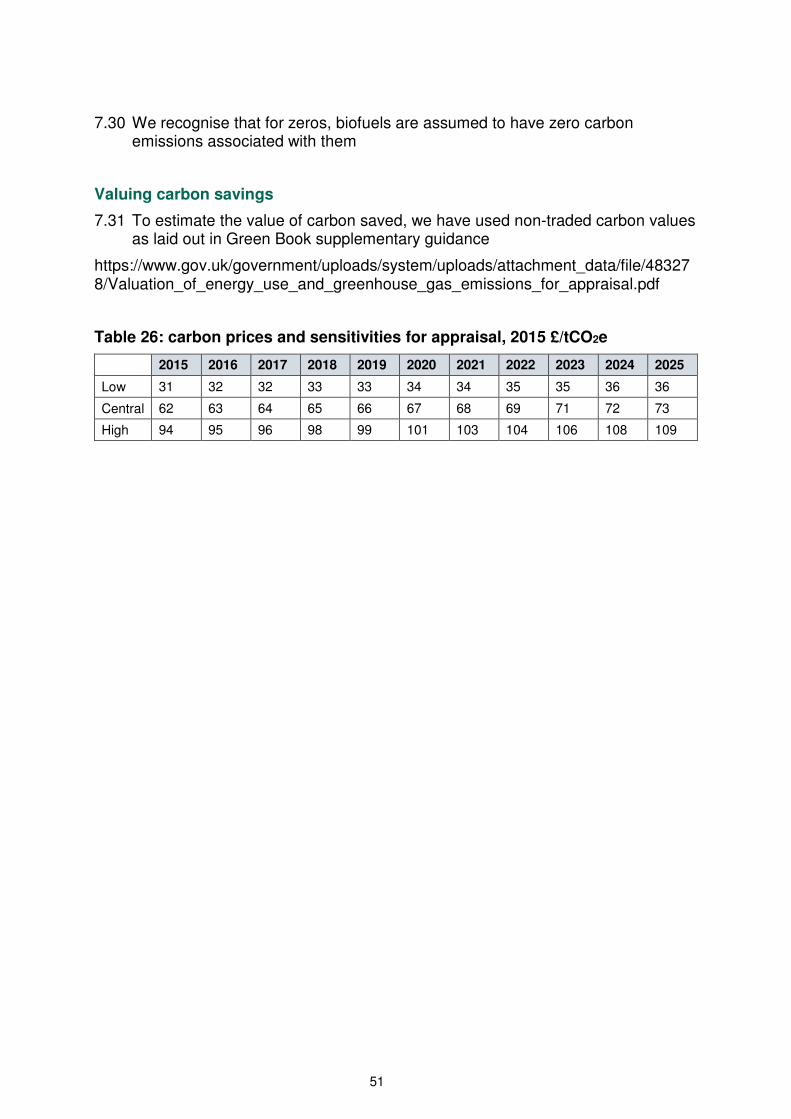
Valuing carbon savings
7.31 To estimate the value of carbon saved, we have used non-traded carbon values as laid out in Green Book supplementary guidance
https://www.gov.uk/government/uploads/system/uploads/attachment_data/file/483278/Valuation_of_energy_use_and_greenhouse_gas_emissions_for_appraisal.pdf
Table 26: carbon prices and sensitivities for appraisal, 2015 £/tCO2e
2015 2016 2017 2018 2019 2020 2021 2022 2023 2024 2025
Low 31 32 32 33 33 34 34 35 35 36 36
Central 62 63 64 65 66 67 68 69 71 72 73
High 94 95 96 98 99 101 103 104 106 108 109

52
Appendix 2 - Share of renewable fuels supplied by volume and by energy
Renewable fuels supplied, share of total volume with policy
Table 27: renewable fuels as share of fuels by volume, with policy
Fuels supplied, share of total by volume
1G Ethanol (= crop share)
1G Waste biodiesel
Advanced fuels*
Total
2018 1.65% 2.58% 0.20% 4.43% 2019 1.79% 3.12% 0.21% 5.12% 2020 1.92% 3.64% 0.24% 5.81% 2021 1.91% 3.65% 0.42% 5.97%
2022 1.90% 3.65% 0.57% 6.12% 2023 1.90% 3.65% 0.67% 6.22% 2024 1.91% 3.65% 0.77% 6.32% 2025 1.92% 3.64% 0.87% 6.43% 2026 1.95% 3.63% 0.97% 6.54% 2027 1.97% 3.62% 1.07% 6.65%
2028 1.99% 3.61% 1.17% 6.77% 2029 2.03% 3.59% 1.27% 6.88% 2030 2.06% 3.57% 1.36% 7.00% 2031 2.09% 3.56% 1.46% 7.12% 2032 1.98% 3.47% 1.72% 7.16%
*includes waste derived ethanol as well as fuels delivered under the development sub target
Table 28: renewable fuels as share of fuels by energy, with policy
By energy as % share of fuel supply under RED definition
1G Ethanol**
1G Waste biodiesel
Advanced Total
Total with double rewarding
2018 1.11% 2.66% 0.16% 3.93% 6.75%
2019 1.20% 3.22% 0.17% 4.59% 7.99%
2020 1.29% 3.76% 0.21% 5.26% 9.23%
2021 1.28% 3.77% 0.39% 5.44% 9.60%
2022 1.27% 3.78% 0.54% 5.60% 9.92%
2023 1.27% 3.78% 0.65% 5.70% 10.13%
2024 1.28% 3.78% 0.75% 5.81% 10.33%
2025 1.29% 3.77% 0.85% 5.92% 10.54%
2026 1.31% 3.75% 0.96% 6.02% 10.73%
2027 1.32% 3.75% 1.06% 6.13% 10.93%
2028 1.34% 3.73% 1.16% 6.24% 11.13%
2029 1.36% 3.72% 1.27% 6.35% 11.33%
2030 1.33% 3.59% 1.68% 6.60% 11.87%
2031 1.32% 3.55% 1.80% 6.67% 12.01%
2032 1.32% 3.51% 1.92% 6.76% 12.19%
** From 2020 onward, this assumes 59.5% of E5 and 40.5% of E10 on average across the entire petrol supply, i.e. an overall ethanol content of 6.825%
53
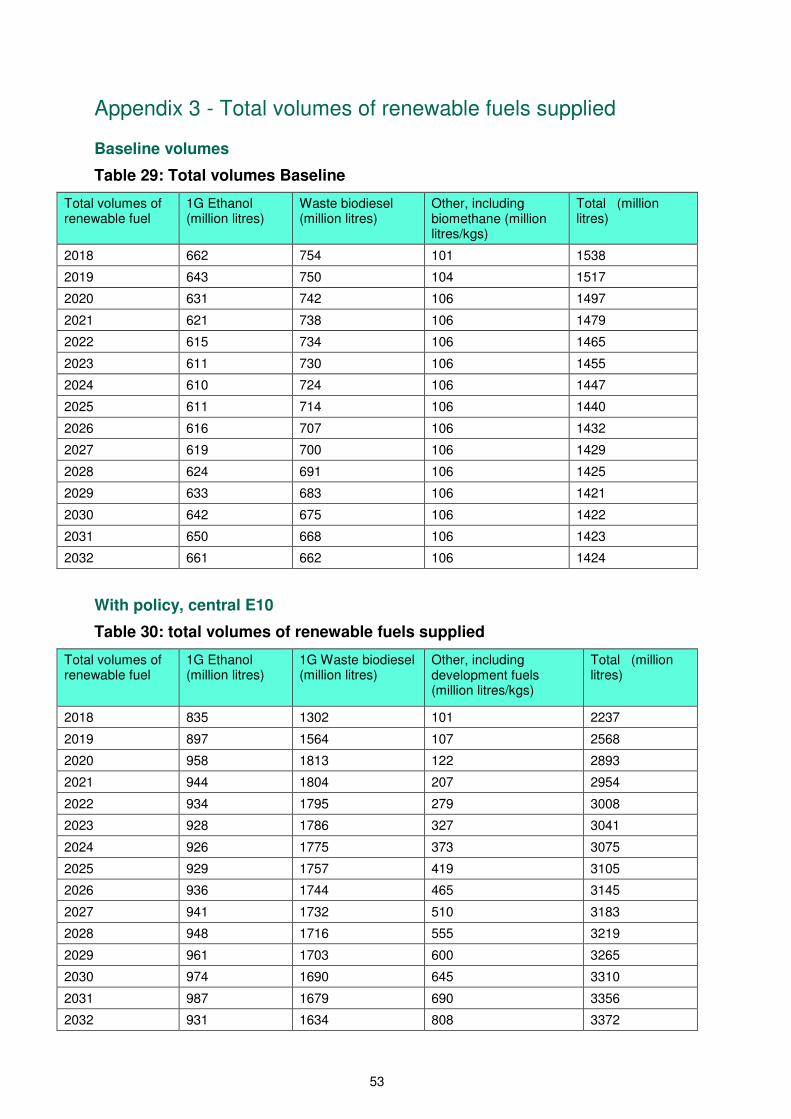
Appendix 3 - Total volumes of renewable fuels supplied
Baseline volumes
Table 29: Total volumes Baseline
Total volumes of renewable fuel
1G Ethanol (million litres)
Waste biodiesel (million litres)
Other, including biomethane (million litres/kgs)
Total (million litres)
2018 662 754 101 1538
2019 643 750 104 1517
2020 631 742 106 1497
2021 621 738 106 1479
2022 615 734 106 1465
2023 611 730 106 1455
2024 610 724 106 1447
2025 611 714 106 1440
2026 616 707 106 1432
2027 619 700 106 1429
2028 624 691 106 1425
2029 633 683 106 1421
2030 642 675 106 1422
2031 650 668 106 1423
2032 661 662 106 1424
With policy, central E10
Table 30: total volumes of renewable fuels supplied
Total volumes of renewable fuel
1G Ethanol (million litres)
1G Waste biodiesel (million litres)
Other, including development fuels (million litres/kgs)
Total (million litres)
2018 835 1302 101 2237
2019 897 1564 107 2568
2020 958 1813 122 2893
2021 944 1804 207 2954
2022 934 1795 279 3008
2023 928 1786 327 3041
2024 926 1775 373 3075
2025 929 1757 419 3105
2026 936 1744 465 3145
2027 941 1732 510 3183
2028 948 1716 555 3219
2029 961 1703 600 3265
2030 974 1690 645 3310
2031 987 1679 690 3356
2032 931 1634 808 3372
54
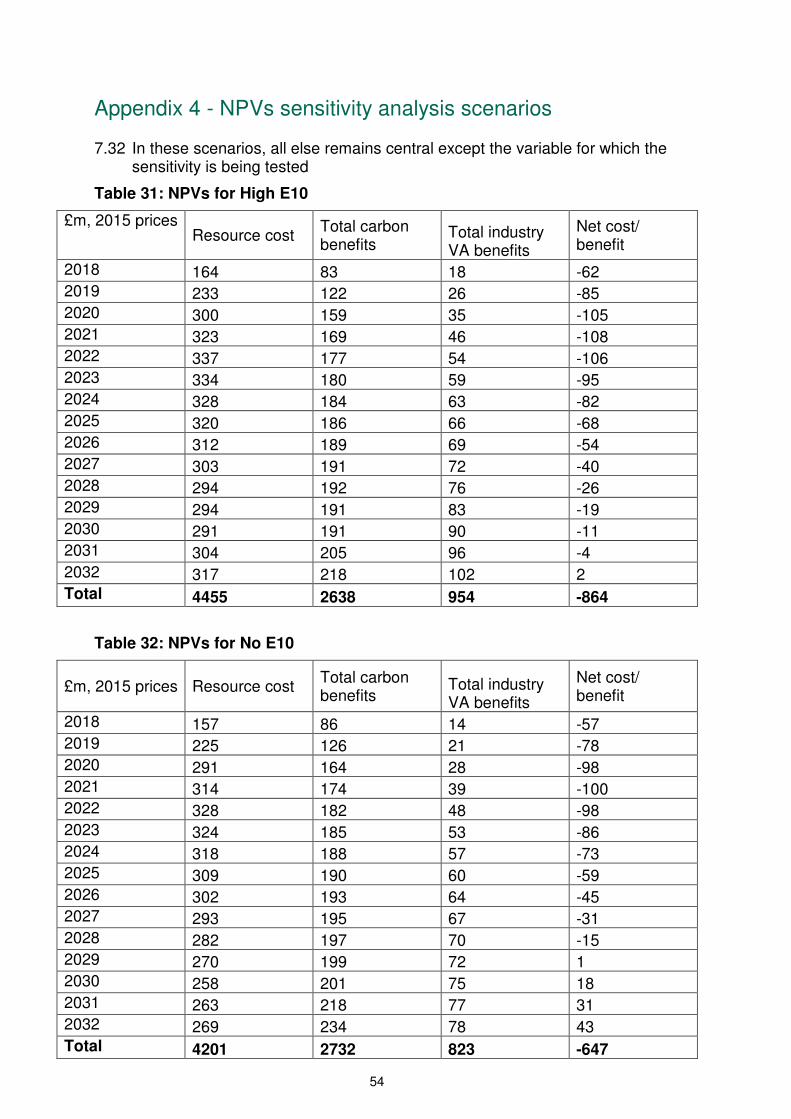
Appendix 4 - NPVs sensitivity analysis scenarios
7.32 In these scenarios, all else remains central except the variable for which the sensitivity is being tested
Table 31: NPVs for High E10
£m, 2015 prices Resource cost
Total carbon benefits
Total industry VA benefits
Net cost/ benefit
2018 164 83 18 -62 2019 233 122 26 -85
2020 300 159 35 -105 2021 323 169 46 -108 2022 337 177 54 -106 2023 334 180 59 -95 2024 328 184 63 -82
2025 320 186 66 -68 2026 312 189 69 -54 2027 303 191 72 -40 2028 294 192 76 -26 2029 294 191 83 -19 2030 291 191 90 -11 2031 304 205 96 -4
2032 317 218 102 2 Total 4455 2638 954 -864
Table 32: NPVs for No E10
£m, 2015 prices Resource cost Total carbon benefits
Total industry VA benefits
Net cost/ benefit
2018 157 86 14 -57 2019 225 126 21 -78 2020 291 164 28 -98 2021 314 174 39 -100 2022 328 182 48 -98
2023 324 185 53 -86 2024 318 188 57 -73 2025 309 190 60 -59 2026 302 193 64 -45 2027 293 195 67 -31
2028 282 197 70 -15 2029 270 199 72 1 2030 258 201 75 18 2031 263 218 77 31 2032 269 234 78 43 Total 4201 2732 823 -647
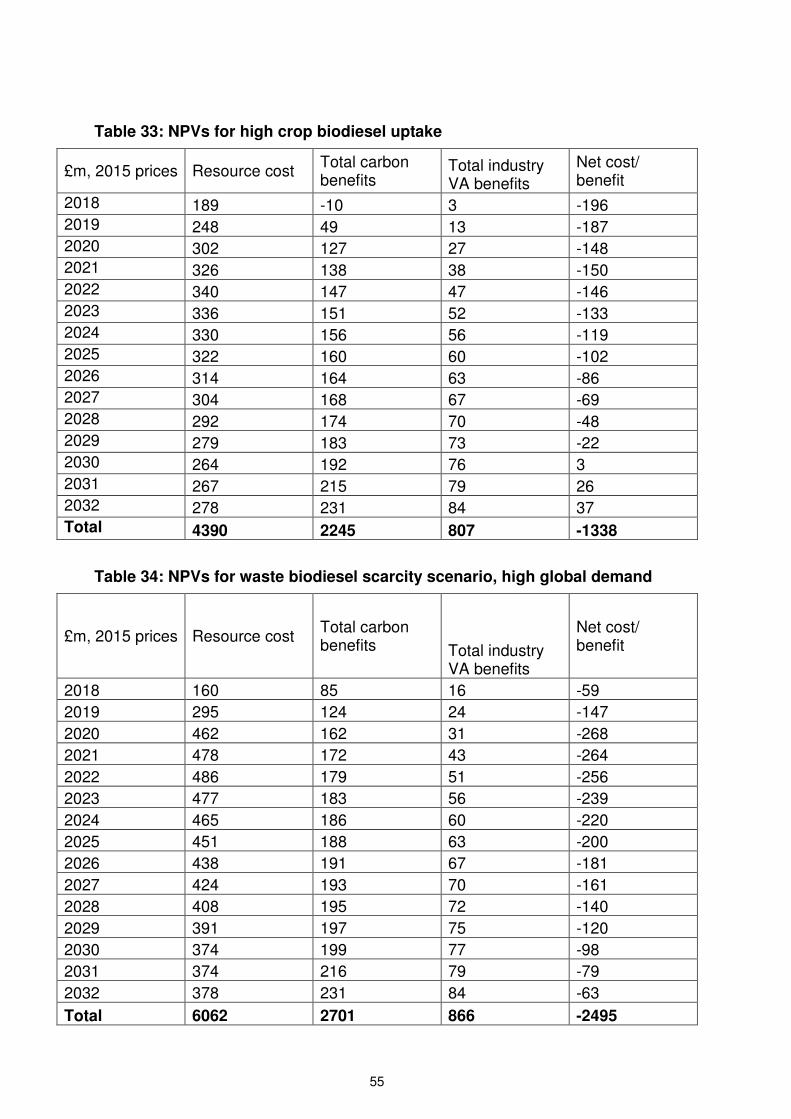
55
Table 33: NPVs for high crop biodiesel uptake
£m, 2015 prices Resource cost Total carbon benefits
Total industry VA benefits
Net cost/ benefit
2018 189 -10 3 -196
2019 248 49 13 -187 2020 302 127 27 -148 2021 326 138 38 -150 2022 340 147 47 -146 2023 336 151 52 -133 2024 330 156 56 -119 2025 322 160 60 -102
2026 314 164 63 -86 2027 304 168 67 -69 2028 292 174 70 -48 2029 279 183 73 -22 2030 264 192 76 3
2031 267 215 79 26 2032 278 231 84 37 Total 4390 2245 807 -1338
Table 34: NPVs for waste biodiesel scarcity scenario, high global demand
£m, 2015 prices Resource cost Total carbon benefits Total industry
VA benefits
Net cost/ benefit
2018 160 85 16 -59
2019 295 124 24 -147
2020 462 162 31 -268
2021 478 172 43 -264
2022 486 179 51 -256
2023 477 183 56 -239
2024 465 186 60 -220
2025 451 188 63 -200
2026 438 191 67 -181
2027 424 193 70 -161
2028 408 195 72 -140
2029 391 197 75 -120
2030 374 199 77 -98
2031 374 216 79 -79
2032 378 231 84 -63
Total 6062 2701 866 -2495
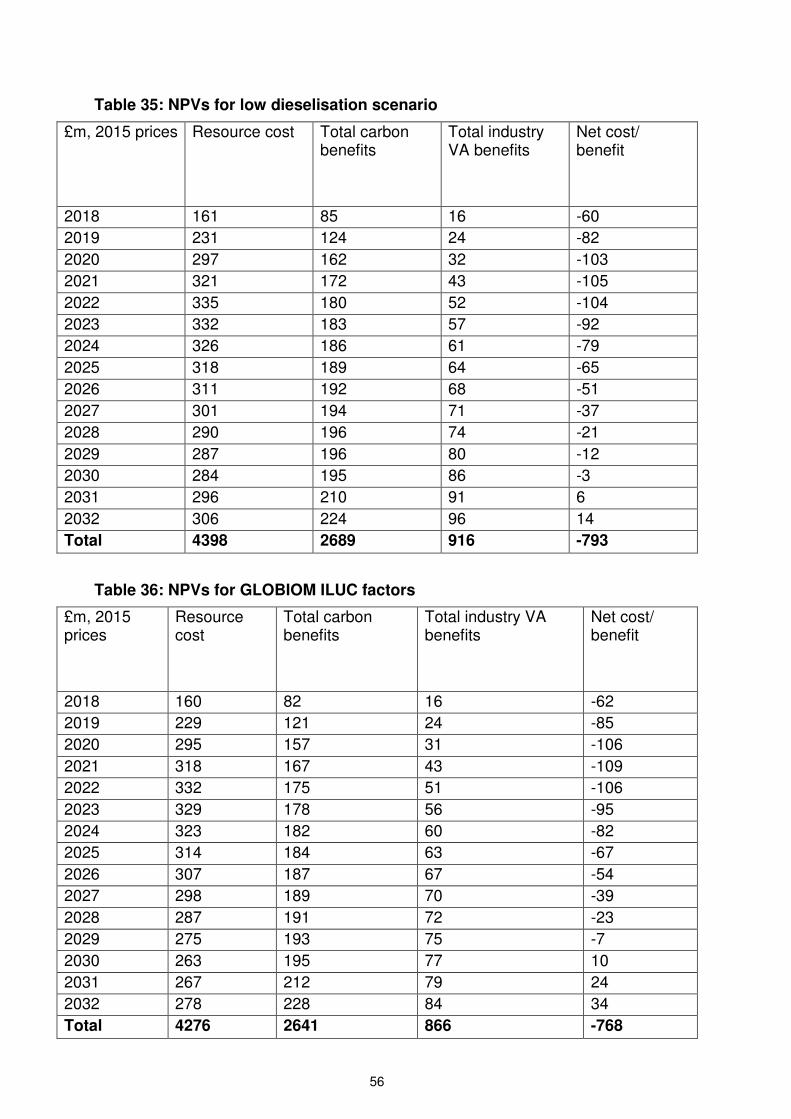
56
Table 35: NPVs for low dieselisation scenario
£m, 2015 prices Resource cost Total carbon benefits
Total industry VA benefits
Net cost/ benefit
2018 161 85 16 -60
2019 231 124 24 -82
2020 297 162 32 -103
2021 321 172 43 -105
2022 335 180 52 -104
2023 332 183 57 -92
2024 326 186 61 -79
2025 318 189 64 -65
2026 311 192 68 -51
2027 301 194 71 -37
2028 290 196 74 -21
2029 287 196 80 -12
2030 284 195 86 -3
2031 296 210 91 6
2032 306 224 96 14
Total 4398 2689 916 -793
Table 36: NPVs for GLOBIOM ILUC factors
£m, 2015 prices
Resource cost
Total carbon benefits
Total industry VA benefits
Net cost/ benefit
2018 160 82 16 -62
2019 229 121 24 -85
2020 295 157 31 -106
2021 318 167 43 -109
2022 332 175 51 -106
2023 329 178 56 -95
2024 323 182 60 -82
2025 314 184 63 -67
2026 307 187 67 -54
2027 298 189 70 -39
2028 287 191 72 -23
2029 275 193 75 -7
2030 263 195 77 10
2031 267 212 79 24
2032 278 228 84 34
Total 4276 2641 866 -768

57
Table 37: NPVs for Carbon Budget carbon accounting
£m, 2015 prices Resource cost Total carbon benefits
Total industry VA benefits
Net cost/ benefit
2018 160 121 16 -23
2019 229 177 24 -28
2020 295 230 31 -34
2021 318 239 43 -37
2022 332 246 51 -35
2023 329 249 56 -25
2024 323 251 60 -12
2025 314 252 63 1
2026 307 254 67 14
2027 298 256 70 28
2028 287 257 72 42
2029 275 258 75 58
2030 263 259 77 74
2031 267 281 79 93
2032 278 296 84 102
Total 4276 3627 866 218
Table 38: NPVs for low carbon values
£m, 2015 prices Resource cost Total carbon benefits
Total industry VA benefits
Net cost/ benefit
2018 160 42 16 -102
2019 229 62 24 -143
2020 295 81 31 -183
2021 318 86 43 -190
2022 332 90 51 -192
2023 329 91 56 -182
2024 323 93 60 -170
2025 314 94 63 -157
2026 307 95 67 -145
2027 298 97 70 -132
2028 287 97 72 -117
2029 275 99 75 -102
2030 263 99 77 -86
2031 267 108 79 -80
2032 278 116 84 -78
Total 4276 1350 866 -2059

58
Table 39: NPVs for high carbon values
£m, 2015 prices Resource cost Total carbon benefits
Total industry VA benefits
Net cost/ benefit
2018 160 127 16 -17
2019 229 186 24 -19
2020 295 243 31 -21
2021 318 258 43 -18
2022 332 269 51 -12
2023 329 274 56 1
2024 323 279 60 15
2025 314 282 63 31
2026 307 286 67 46
2027 298 290 70 61
2028 287 292 72 78
2029 275 296 75 95
2030 263 298 77 113
2031 267 324 79 136
2032 278 347 84 153
Total 4276 4051 866 642
Sensitivity analysis for carbon abatement cost estimates
Table 40: carbon abatement cost estimates for sensitivity scenarios
PRE-CONSULTATION Average abatement cost, present value (£/TCO2e) 2017-30
Central assumptions
Low waste/ high crop
GLOBIOM ILUC values
Carbon Budget Accounting
Option 2 95 128 98 N/A POST-CONSULTATION Average abatement cost, present value (£/TCO2e) 2018-32
Central scenario 119 N/A 122 88

59
Appendix 5 - Summary of consultation responses
Question 45: Do you have any evidence on the supply cost of 'development fuels' or any other evidence that could inform the level of the buy-out price?
Summary of responses
Total Yes No
28 10 18
7.33 We received 28 responses to this question, 10 "yes" and 18 "no" responses. Several respondents ticked "no" and then expressed views on the level of the buy-out price.
• There was a prevailing view from a range of different respondents that a high buy out price would be required to support the large capital investments needed for development fuels.
• Several respondents pointed out that the volatility of RTFC prices limits their “bankability”, which is necessary to attract capital investors.
• A number of renewable fuel suppliers expressed the view that there would be little risk of over-rewarding development fuel suppliers with a high buy out price. If the buy-out price is too high it would lead to oversupply, this would result in the obligation being exceeded and allow the market to set the correct support price.
• The idea of a development sub-target was opposed by several fossil fuel suppliers who instead suggested development fuels should receive multiple (three to four) RTFCs per litre.
7.34 Out of the ten respondents who ticked "yes", three provided supply cost estimates for relevant fuels:
• One industry representative body estimated that the buy-out price would need to be at least 55 pence per certificate to match the support biomethane from AD receives under the RHI.
• One renewable fuel supplier estimated that the supply cost of syngas would require a buy-out price above 30 pence per certificate, assuming that syngas is awarded 3.8 certificates per kg.
• One renewable fuel supplier estimated that the buy-out price would need to be at least 60 pence per certificate for waste-derived biomethane to be supplied and that advanced biodiesel and jet fuel would require a much higher buy-out price.
7.35 In addition, support for a high development fuel buy-out price was expressed by three industry representative bodies, one road freight sector operator and seven renewable fuel producers/suppliers and one fossil fuel producer/supplier. This includes one industry representative body and two renewable fuel producer/suppliers who suggest the need for floor price support, i.e. a minimum value for development RTFCs.
7.36 Arguments in support of a high buy out price include the high capital cost of development fuel plants and views on future diesel and gas prices. Equally, a

60
floor price for development RTFCs was suggested as a way to overcome the volatility of RTFC prices, which means they are not “bankable” and do not guarantee the minimum return that capital investors would require. One industry representative body illustrated how the certain revenue from the RHI was preferable to a biomethane producer over the uncertain revenue from RTFCs. Regarding the floor price, it was suggested that this should be based on a carbon damage cost of £70 per tonne of carbon-dioxide equivalent, quoting from a 2010 publication by HMT “Carbon Price Floor”. They also suggest that cost neutrality could be achieved by using revenues from buy-out to compensate suppliers when the market price falls below the floor price.
7.37 One renewable fuel supplier suggested that high blends of biofuels should be rewarded under the development sub-target including all Annex IX or waste feedstocks, since this would ensure sufficient volumes are available and that in this case no buy-out mechanism would be needed. Their argument is that this would prevent a situation where high buy-out costs are incurred without achieving any carbon savings.
7.38 One consultant suggested that the buy-out price should be set according to what is "a reasonable amount to spend in £/t CO2 on decarbonation of transport fuels, compared to other climate change mitigation options."
7.39 One industry representative body suggested that cost neutrality could be achieved through a combination of a floor price and a mechanism akin to the Contract for Difference strike price. In this case, when the RTFC market price is below the floor price, payments would be made to fuel suppliers to make up the difference, but when the market price is above the buy-out price any payments made to fuel suppliers when the market price was below would be deducted from above floor price revenue and paid to Treasury.
Government response
7.40 The consultation responses have been very helpful in confirming that both a high buy-out price and a tight definition of fuels qualifying under the development sub-target are required to improve the bankability of dRTFCs and stimulate investment in this new industry.
Question 46: Do you agree with the approach taken to calculating net value added to the economy by UK biofuel production?
Summary of responses
Total Yes No
30 15 15
7.41 We received 30 responses to this question. Fifteen respondents agreed with the approach taken and 15 disagreed.
7.42 Six fossil fuel suppliers disagreed with the approach taken, suggesting that the methodology used failed to consider the costs to other impacted sectors. It was argued that increasing the biofuel blend in UK transport fuels would displace fossil fuels, putting greater pressure on UK refineries. This would result in

61
further refining capacity reductions and closures which would have a negative impact on the economy and employment.
7.43 One fossil fuel supplier identified that the large positive and negative range highlighted the uncertainty surrounding any economic impact.
7.44 Renewable fuel producers and industry representatives were split between those who thought the methodology was correct (twelve) and those who disagreed and thought it was underestimating the benefits from biofuel production (seven). Those that disagreed argued that the net value added calculations failed to account for indirect impacts which benefited the supply chain other than the biofuel supplier. It was suggested that multiplier benefits would be observed from new employees being hired and those already working in the biofuel industry. Animal feed benefits were claimed to have been omitted, which one respondent stated is a substantial part of the overall benefits to be gained from UK biofuel production.
7.45 Renewable fuel producers (and one fossil fuel supplier) who agreed with the government's methodology claimed that the displacement of crop biodiesel with waste biodiesel will cause positive indirect land use change, in addition to other benefits received from increased demand and prices from waste based feedstocks.
7.46 One respondent welcomed a specific breakdown of technologies within UK biofuel production as they believe biomethane from anaerobic digestion (AD) has great potential with regards to capital investment, job creation and export potential.
7.47 Alternative methodological approaches suggested by respondents included the consideration of non-quantified impacts from cost savings associated with meeting the obligation by double counted fuels (as each litre satisfies the obligation twice as efficiently as a crop derived litre). The fossil fuel supplier in this case argued that this will benefit fuel suppliers due to lower incorporation of physical biofuel and will reduce the movement of physical biofuel litres, saving carbon emissions for transport.
7.48 It was also suggested that power to gas systems (P2G) producing SNG as well as next generation technologies such as DIAGEN would add additional value to the economy through innovation.
Government response
7.49 The value of animal feed benefits (DDGS) was already included in the CBA. The impacts on the fossil fuel industry are reflected in the "displacement" aspect of our value added methodology.
7.50 We have insufficient robust evidence to estimate multiplier effects and other indirect effects of biofuel production. Therefore we have not amended the value added methodology post consultation.
Question 47: Do you have any additional evidence we should consider in estimating the costs and benefits of the policy options?

62
Summary of responses
Total Yes No
25 24 1
7.51 We received 24 "yes" responses to this question. Nine respondents from a variety of industries only referred to their answer to Q46, 15 respondents provided additional information.
7.52 Twelve respondents comprising seven renewable fuel producers, one fossil fuel supplier, two waste recycling companies and two industry representatives cited the recent change in exchange rates as a factor which should be considered if we were to look at the cost of biofuels and biofuel feedstocks from the UK again (costs have fallen).
7.53 Two respondents suggested that additional fuels should be considered (SNG and biomethanol).
7.54 One fossil fuel supplier suggested that the UK should aim to reduce GHG emissions at the lowest cost to consumers which may require alternative fuels to be used instead of biofuels.
7.55 One renewable fuel producer suggested that the government should use an end-of-life route for treated timber products.
7.56 One consultancy made reference to multiple studies which looked into reducing carbon emissions in the production process.
Government response
7.57 Regarding the lower value of the pound, this increases the cost of some feedstocks and lowers the cost of others, while all feedstocks continue to be traded in international commodity markets. We have already included high price and low price scenarios in the CBA and we feel that this sufficiently covers the possible cost variations following from exchange rate changes.
7.58 Regarding the other information provided, we did not find that there was enough robust evidence to change the CBA methodology.
Q 48- Do you have any evidence of waste feedstock availability to 2020 and how markets are likely to react to increased demand in the run up to 2020?
Summary of responses
Total
45
7.59 We received 45 responses from a wide range of stakeholders. There were three distinct themes in the responses:

63
• Among renewable fuel suppliers the prevailing view is that enough waste feedstocks are available to meet the potential need of 2bn litres and several stakeholders provided quantitative estimates of available feedstocks.
• Fossil fuel suppliers share concerns that the incremental volume may not be commercially available in the market.
• At least five renewable fuel suppliers and one consultancy expect the buy-out price may be breached before 2020 and suggest that the buy-out price should be increased from 30p per certificate to 40p or 45p per certificate.
Government response
7.60 The consultation responses have been very helpful in confirming that the required volumes of waste feedstocks are likely to be available. For the post-consultation CBA, we continue to assume that the required waste feedstocks can be supplied.
7.61 We recognise that there is a risk of the buy-out price being breached. However, given the post-consultation amendments to the amount of crop-derived fuels being eligible for RTFCs as well as the increased target for development fuels, we consider that this risk is now reduced for the fuels supplied under the main obligation.
Q49: Do you have any additional evidence regarding expected future supply cost of renewable fuels, and specifically of waste biodiesel?
Summary of responses
Total Yes No
30 18 12
7.62 Eighteen respondents chose "yes", 14 of these then stated "see Question 48". We received four substantive responses supplied by three Renewable Fuel Producers/Suppliers and one industry representative body and some comments from those who had chosen "no". These responses included the following information:
• A cost estimate for advanced biodiesel that would require a buy-out price of 80p per dRTFC to make the first commercial plant viable, suggesting that the cost would fall for second and third plants;
• Information on a cost target of £100/MWh for electricity from anaerobic digestion by 2020 in 2016 prices of levelised cost;
• Information on the cost of SNG, which is linked to the cost of renewable electricity: the cost of off-shore wind electricity generation has recently dropped from €72.7 to €50/MWh. This supplier expects the cost of P2G (power to gas, i.e. SNG made from renewable electricity) could fall dramatically with large scale deployment;
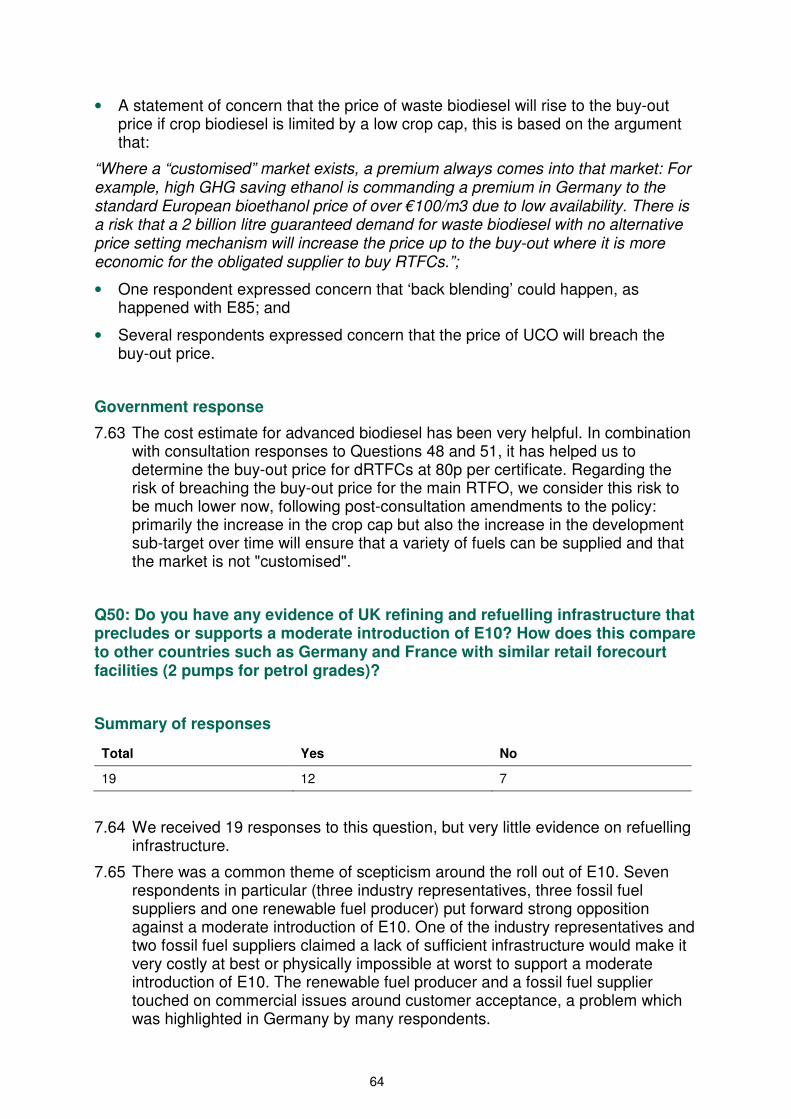
64
• A statement of concern that the price of waste biodiesel will rise to the buy-out price if crop biodiesel is limited by a low crop cap, this is based on the argument that:
“Where a “customised” market exists, a premium always comes into that market: For example, high GHG saving ethanol is commanding a premium in Germany to the standard European bioethanol price of over €100/m3 due to low availability. There is a risk that a 2 billion litre guaranteed demand for waste biodiesel with no alternative price setting mechanism will increase the price up to the buy-out where it is more economic for the obligated supplier to buy RTFCs.”;
• One respondent expressed concern that ‘back blending’ could happen, as happened with E85; and
• Several respondents expressed concern that the price of UCO will breach the buy-out price.
Government response
7.63 The cost estimate for advanced biodiesel has been very helpful. In combination with consultation responses to Questions 48 and 51, it has helped us to determine the buy-out price for dRTFCs at 80p per certificate. Regarding the risk of breaching the buy-out price for the main RTFO, we consider this risk to be much lower now, following post-consultation amendments to the policy: primarily the increase in the crop cap but also the increase in the development sub-target over time will ensure that a variety of fuels can be supplied and that the market is not "customised".
Q50: Do you have any evidence of UK refining and refuelling infrastructure that precludes or supports a moderate introduction of E10? How does this compare to other countries such as Germany and France with similar retail forecourt facilities (2 pumps for petrol grades)?
Summary of responses
Total Yes No
19 12 7
7.64 We received 19 responses to this question, but very little evidence on refuelling infrastructure.
7.65 There was a common theme of scepticism around the roll out of E10. Seven respondents in particular (three industry representatives, three fossil fuel suppliers and one renewable fuel producer) put forward strong opposition against a moderate introduction of E10. One of the industry representatives and two fossil fuel suppliers claimed a lack of sufficient infrastructure would make it very costly at best or physically impossible at worst to support a moderate introduction of E10. The renewable fuel producer and a fossil fuel supplier touched on commercial issues around customer acceptance, a problem which was highlighted in Germany by many respondents.

65
7.66 A combination of two renewable fuel producers, one industry representative and one consultancy referred to the LowCVP report “Successfully deploying E10 petrol”.
7.67 A consultancy highlighted that several Safeway/Morrison sites are configured to take three grades of petrol through segregated underground tanks.
7.68 One industry representative and renewable fuel producer cited the implementation strategy used in Finland and Belgium where the number of petrol grades was restrained to two (E10 and E5 – premium legacy grade). They both claimed this would increase uptake, while simplifying the choice for consumers. It was suggested that to avoid a repetition of consumer distrust (as observed in Germany), the UK should follow Belgium’s example for E10’s introduction. In preparation for E10’s introduction on Jan 1st 2017 in Belgium, both respondents highlighted, there was close stakeholder involvement in developing a communication strategy which ensur ed that consumers would receive accurate and consistent information about E10. Respondents went onto suggest that the UK should introduce E10 as a standard fuel for RON-95 and have one alternative, a premium grade RON-98 with up to 5% ethanol.
7.69 Two separate industry representatives raised concerns about the impact on consumers, with one highlighting the reduced fuel efficiency from E10 increasing costs for consumers and highlighted E10’s environmental impacts. Their research suggested reductions in tailpipe CO (carbon monoxide) and CO2 but an increase in NOx emissions. The government was urged to assess the performance of E10 from a consumer and environmental perspective, tested under real world conditions.
7.70 The other industry representative raised the issue of the “large number” of older vehicles which are not compatible with E10. If E10 were rolled out nationally it is claimed that motorists will be required to use the more expensive super grade. The government was urged here to consider the “financially vulnerable” consumers who are likely to be disproportionately impacted by this.
Government response
7.71 The evidence provided by respondents has not clarified whether a full switch to E10 would be required. The CBA continues to assume a 40% uptake of E10 for the central scenario but looks as "no E10" and "high E10" as sensitivity scenarios, since many industry stakeholders consider these scenarios more likely than a moderate E10 uptake.
7.72 Introducing E10 to the UK will require co-ordination with industry, and public communication. DfT will work with industry to ensure any potential roll-out of E10 in the UK is carefully planned and handled.
7.73 We recognise the need for drivers of older vehicles to continue to have access to suitable fuel in the event of the introduction of E10. We will consult on proposals both to ensure E5 remains available, and for how long.
7.74 There is some conflicting evidence with regards to NOx impacts of E10, though E10 has been shown to have other air quality benefits. We understand that the research quoted by stakeholders showed an increase in NOx from E10 petrol in aggressive/high-speed conditions. This research has not been published and we do not have access to the underlying data. We understand that the same

66
research also showed benefits including a decrease in tailpipe carbon emissions.
7.75 To put the results into context, NOx emissions from petrol are very low relative to diesel under real-world driving and are generally closer to their regulatory limits. So in absolute terms a potential increase in NOx from petrol would only result in a very small increase in emissions overall and E10 petrol would still be significantly lower than diesel.
7.76 This research is only a snapshot of the petrol vehicles on the market so does not give a complete picture of the emissions effect from E10. There is considerable variance in their results between models which reflects the fact that the impact on emission from E10 will very much depend on how the vehicle has been tailored to respond to the ethanol content of the fuel. The testing is also subject to the variances in driving style, climatic conditions and measurement accuracy. Whilst steps were taken to mitigate these factors it would have given more rigour to the outcome if some laboratory testing had been completed to give assurance through truly accurate and repeatable results.
7.77 Note that E10 has been the mandated reference fuel for vehicle testing of fuel consumption and emissions since March 2016 and this will be extended to all cars on sale in the UK in August 2018. Therefore, newer cars are more likely to be tuned for E10 so should see no adverse impact from the fuel. This was reflected in the testing quoted by stakeholders, which saw worse results with the older vehicles.
7.78 Other work undertaken in 2011 by the DEFRA Air Quality Expert Group concluded that E10 petrol will have no change in oxides of nitrogen (NOx) emissions but would lead to a reduction in the other regulated pollutant emissions; carbon monoxide (CO), hydrocarbons (HC), and particulate matter (PM). The Air Quality Expert Group also concluded that the reductions in emissions may be more apparent for older vehicles.
7.79 In advance of any decision to introduce E10 we are carefully considering the evidence on air quality impacts and will work with industry to determine what technical testing and assessment may be needed to provide assurance on impacts on fuel consumption and air quality. We are also actively considering undertaking our own testing to verify the impact on air quality and will publish more details on this issue in due course.
Q51: Do you have any evidence on the supply cost of waste-derived drop-in fuels that can be used either in aviation or in diesel (in excess of B7, still meeting the diesel standard EN590)?
Summary of responses
Total Yes No
20 2 18

67
7.80 Substantive responses to this question came from one consultancy and one renewable fuel producer/supplier.
7.81 The most relevant answer received to this question came from a renewable fuel supplier. They have shared evidence to show that a waste biodiesel or bio-jet plant in the UK using the gasification / FT route would require a buy-out price of at least 80p per dRTFC.
7.82 The other substantive response was from a consultancy and stated that a supermarket chain had previously developed B30 biodiesel that fully met the requirements of EN590 as a forecourt grade with a range of existing companies as customers. They also stated that bio-LPG should be included in the development sub-target, a direct secondary fuel when HVO biodiesel is manufactured.
7.83 Several fossil fuel suppliers marked this as a "No" and then stated that HVO has already been sold in the UK market (8 million litres in 2015/16, RTFO Year 8) which suggests this could sometimes be competitive with FAME and/or RTFCs. However, they expect that HVO will command a premium over FAME and that its deployment and price premium will depend on the capacity available and the penalties for non-compliance in different European markets.
Government response
7.84 To reflect the high initial supply cost of development fuels, we have increased the cost estimate for advanced fuels in the CBA. For the first two years of the development sub-target we use the "High cost" estimate also for "low" and "central" cost estimates for development fuels only. We expect that competition between suppliers will bring down supply costs for development fuels after the initial two years.
Q52: Do you expect to see any significant changes in the share of renewable fuels used in non-road mobile machinery? Can you provide any evidence of these changes?
Summary of responses
Total Yes No
15 8 7
7.85 We received eight substantive responses to this question. Three fossil fuel suppliers and one industry representative replied with ‘yes’ and were of the view that a likely increase of biofuels levels in Gasoil 10ppm will increase the risk of fuel quality and safety issues.
7.86 Three respondents suggested that biopropane be added to the development fuels sub-target as this would help renewable fuel supply increase in this sector.
7.87 Two industry representatives believed the current proposals offered in the RTFO will have a negligible impact on the RED target, with respondents going further to suggest renewable fuels should be made to be more attractive than the red diesel alternative. This was the view echoed by a consultancy firm who

68
believe that the lower fuel duty rate of red diesel made it the preferred fuel unless legislated otherwise.
7.88 One fossil fuel supplier and renewable producer agreed that there were benefits to be had from using HVO in NRMM. The fossil fuel supplier went on to suggest the use of rebated (unmarked) diesel, crediting end users directly for the duty differential between road diesel and gasoil. An approach however that would only be viable for high-volume users (of which there are few) and could introduce compliance risks and fraudulent behaviour.
7.89 A fossil fuel supplier provided evidence on the increasing use of biopropane in road transport by stating that in 2017 up to 20,000 tonnes of biopropane, equalling 24% of all LPG used in UK road transport, will be imported to the UK from the HVO production plant in Rotterdam. The amount of biopropane they believe available in Europe could increase quickly with the commercial deployment of gas conversion expected in 2017. On LPG’s use in NRMM, they stated that there is already an established demand for it, with notably a third of fork lift trucks running on it.
7.90 Two fossil fuel suppliers expressed their reluctance in having to blend high levels of FAME into gasoil in order to meet the 9.75% obligation across petrol, diesel and gasoil volume in 2020. They cited safety risks as one of their main concerns.
7.91 One renewable fuel producer highlighted that train operators still require zero FAME gasoil/diesel and believes the rail sector should be utilising 7% blends at least and preferably high bio-blends.
7.92 Finally, an academic acknowledged the difficulty in decarbonising a sector such as agriculture but suggested there should be greater focus on developing alternative types of agricultural machinery such as battery powered machinery.
Government response
7.93 We have not received any evidence that would suggest a significant change in proportions of NRMM relative to petrol and diesel. Assumptions in the CBA remain unchanged. We continue to assume that renewable fuels are only blended intopetrol and road diesel and not gasoil.
Q53: Do you have any additional evidence regarding expected deployment of gas-powered vehicles and likely future demand for biomethane as a transport fuel?
Summary of responses
Total Yes No
30 10 20
7.94 We received ten substantive responses to this question. A combination of an industry representative (one) and fossil fuel suppliers (three) urged caution around the UK picking renewable fuel “winners” and urged for the market to develop solutions. Respondents here cited previous artificially imposed

69
infrastructure projects that did not have a good track record, e.g. the UK’s LPG initiative that resulted in an estimated £150 million sunk cost for retailers who invested in equipment on the assumption that LPG’s popularity would grow via government subsidies. They went on to say that the government, on the behalf of the taxpayer, invested £150 million in grants and duty incentives but brought the programme to a close after the environmental benefits between LPG and road fuels became less apparent (due to fuel and vehicle technology improvements). Consumers who had paid for converting their vehicles and service station owners who had invested in storage and refuelling equipment both lost out.
7.95 A fossil fuel supplier cited the USDA FAS 2016 report which states that in 2014 the total EU consumption of purified biogas for transport of 134 MT of oil equivalent is marginal, with the majority of biogas instead being used to generate electricity and/or heat.
7.96 An NGO stated that the climate benefits of using natural gas were non-existent or questionable at best. Upstream emissions of natural gas are thought to make it especially problematic. This respondent stressed that natural gas should not be seen as a solution for light duty vehicles as electrification is more credible.
7.97 One fossil fuel supplier saw a future role for natural gas and biomethane as transport fuels with the greatest potential as a liquefied fuel for ships and long distance HGVs. In contrast they did not expect a significant penetration of natural gas and biomethane in the light duty vehicle sector.
7.98 One fossil gas supplier made reference to the Element Energy report ‘The case for biopropane in transport'.
7.99 A consultancy stated that natural gas/biomethane trucks were already widely used around the globe, namely the US, and that the supply of trucks will migrate to Europe. The same point was made by an industry representative who stated that under the right conditions by 2025, biomethane gas engines could account for 25-50% of the HGV vehicle market. While another fossil fuel supplier expected the number of gas vehicles to double between 2020 and 2030 with government support.
7.100 Two industry representatives mentioned the large GHG savings that could be achieved with the use of biomethane. One representative in this case believed that biomethane used in advanced dedicated spark-ignition engines for large goods vehicles would be most effective.
7.101 One renewable fuel supplier recommended reviewing the research of New Holland, who play a significant role in investigating and promoting a sustainable future for agriculture including the role of biomethane powered farm vehicles.
7.102 A hydrogen supplier made reference to the projections for hydrogen cars for the period to 2030 by the UKH2Mobility project.
7.103 Finally, a renewable fuel producer believes biomethane can play a significant role in decarbonising the UK HGV sector and expects the deployment of dedicated gas-powered HGVs to increase from 2017 onwards. They have secured a supply of unsupported biomethane that is sufficient to fuel 100-150 dedicated CNG long haul HGVs. They went onto state that they believe the electrification of the HGV sector on a meaningful scale is likely decades away. While the UK’s natural gas pipeline is a world class asset that has already been paid for and is operating with spare capacity.
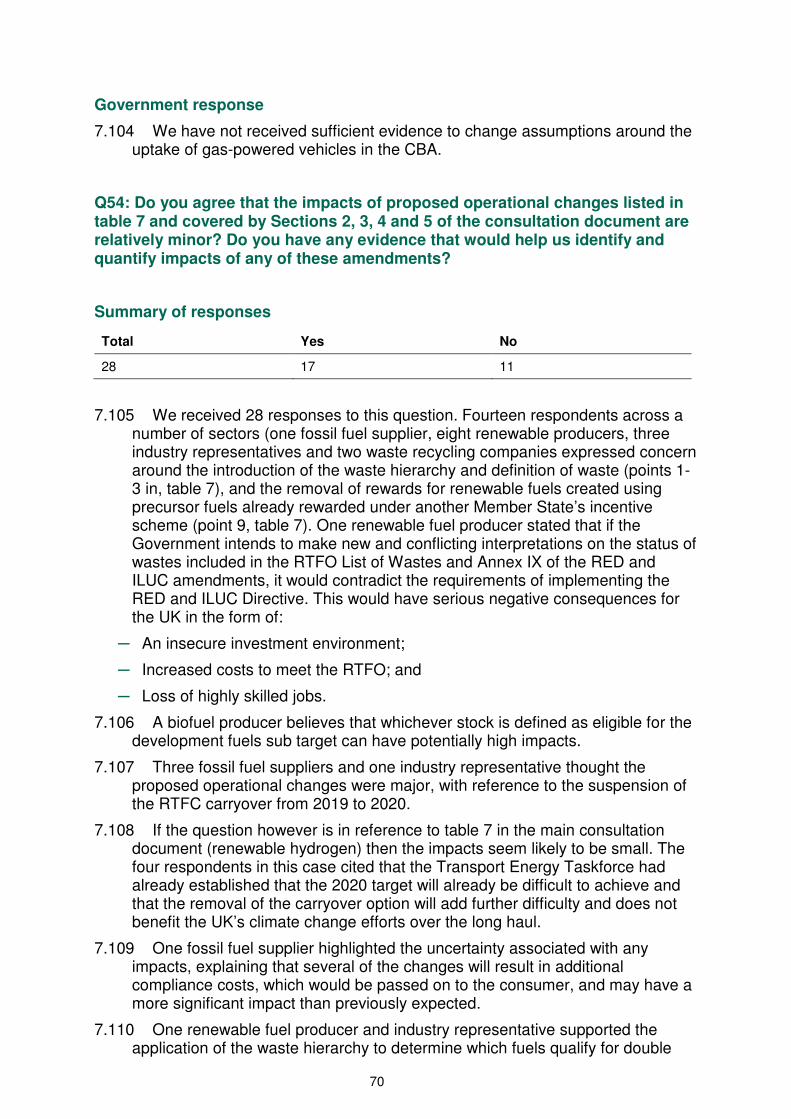
70
Government response
7.104 We have not received sufficient evidence to change assumptions around the uptake of gas-powered vehicles in the CBA.
Q54: Do you agree that the impacts of proposed operational changes listed in table 7 and covered by Sections 2, 3, 4 and 5 of the consultation document are relatively minor? Do you have any evidence that would help us identify and quantify impacts of any of these amendments?
Summary of responses
Total Yes No
28 17 11
7.105 We received 28 responses to this question. Fourteen respondents across a number of sectors (one fossil fuel supplier, eight renewable producers, three industry representatives and two waste recycling companies expressed concern around the introduction of the waste hierarchy and definition of waste (points 1-3 in, table 7), and the removal of rewards for renewable fuels created using precursor fuels already rewarded under another Member State’s incentive scheme (point 9, table 7). One renewable fuel producer stated that if the Government intends to make new and conflicting interpretations on the status of wastes included in the RTFO List of Wastes and Annex IX of the RED and ILUC amendments, it would contradict the requirements of implementing the RED and ILUC Directive. This would have serious negative consequences for the UK in the form of:
─ An insecure investment environment;
─ Increased costs to meet the RTFO; and
─ Loss of highly skilled jobs.
7.106 A biofuel producer believes that whichever stock is defined as eligible for the development fuels sub target can have potentially high impacts.
7.107 Three fossil fuel suppliers and one industry representative thought the proposed operational changes were major, with reference to the suspension of the RTFC carryover from 2019 to 2020.
7.108 If the question however is in reference to table 7 in the main consultation document (renewable hydrogen) then the impacts seem likely to be small. The four respondents in this case cited that the Transport Energy Taskforce had already established that the 2020 target will already be difficult to achieve and that the removal of the carryover option will add further difficulty and does not benefit the UK’s climate change efforts over the long haul.
7.109 One fossil fuel supplier highlighted the uncertainty associated with any impacts, explaining that several of the changes will result in additional compliance costs, which would be passed on to the consumer, and may have a more significant impact than previously expected.
7.110 One renewable fuel producer and industry representative supported the application of the waste hierarchy to determine which fuels qualify for double

71
counting and the new development target. However, they both believed that further clarification will be required when the waste hierarchy test is applied to singled counted materials which do not qualify under the development fuels sub-target. They stated that the reward for all biofuels should be based on energy content, with the industry representative going further to say that for gaseous fuels the level of reward and therefore multiple counting is calculated on an energy basis. Finally, both agreed that support in all third countries should be taken into account as this is a commonly accepted principle which should be preserved and applied to all schemes, not only in the EU but also in all third countries.
Government response
7.111 We have not received sufficient evidence to amend the CBA
Q55: Do you have any evidence on the impact of proposed changes to RTFC carry-over in 2020?
Summary of responses
Total Yes No
22 8 14
7.112 We received twenty-two responses to this question, eight of which were substantive. From those respondents who replied with “yes” there were two common themes when reading through the comments and evidence.
7.113 One industry representative and four fossil fuel suppliers (repeating points made in Question 54) highlighted again the difficulty in achieving the 2020 target, and added that the removal of the carryover option will not benefit the UK’s climate change efforts over the long haul. One of the three fossil fuel suppliers said that the 2020 carryover exemption could negatively disrupt certificate trading and add costs to the consumer. They estimated that over a 3-4 year period (from 2018) more biofuel blending would take place if the carryover were to be permitted into 2020 than if the carryover was not permitted.
7.114 One industry representative and two renewable fuel suppliers (all answered yes), stated that if the carryover remained at 25% and all development fuels are issued with double certificates, then the UK risks losing out on increasing the amount of carbon saved by allowing such a high carry over. They believe that high carryover does not cater for seasonal uncertainties in the biofuels supply chains and biofuel investors would benefit from lower carryover. One renewable fuel supplier and the industry representative suggested that carryover should be reduced to 20% with the other renewable fuel supplier suggesting 10%. All three agreed the carryover should be reviewed for the post 2020 period, depending on the market for development fuels.

72
Government response
7.115 We have not received sufficient evidence to amend the CBA.
Q56: Do you have any additional evidence that you consider relevant to this cost benefit analysis?
Summary of responses
Total Yes No
22 11 11
7.116 We received 22 responses to this question, 11 of which were substantive.
7.117 Five respondents, one industry representative and four fossil fuel suppliers, acknowledged that the RTFO buyout facility had “done its job well”. They expressed concern however that the requirements for targets in the FQD could impact the value of a RTFC. Citing the work done by the Transport Energy Task Force, they believe it is clear that by 2020 suppliers will be short of CO2 credits, therefore, any CO2 credit attached to a RTFC will have a value at around the marginal abatement cost for UERs/buyout. As a result, they claim that the RTFC market may increase significantly above the current level and consumers may be exposed to higher costs than intended.
7.118 This group of respondents offered two solutions:
• CO2 buyout should be reduced more in line with the current market level; and
• The RTFO buyout price, 30 pence per certificate, was intended to be a buyout of a “litre of biofuel” and therefore that fuel has a CO2 credit attached to it. This could be retained at a fixed percentage at a typical average level of say 60-70%. A change to the existing regulation would allow this.
7.119 In addition to this there was a wide range of additional evidence presented by respondents. This includes two consulting firms who raised separate issues around how RTFCs are awarded and the justification for the amount of pounds per tonne of CO2 saved.
7.120 In relation to the award of RTFCs, the consultancy here believes that each RTFC was issued for 100% carbon saved instead of against the volume or weight of fuel generated. For example, if a biodiesel product gives a 70% saving then 1 litre would get 0.7xRTFC or 1.43 litres = 1 x RTFC. The benefits from this they believe would be:
• Anyone buying a certificate would know they all have equal carbon saving status;
• The government would know much more clearly and easily how much carbon was being saved; and
• It would drive biofuel producers to maximise the carbon savings potential of their manufacturing process thus maximising the carbon savings potential.
7.121 The other consultancy questioned why the CBA only looks at the relative costs of options to meet the RED Directive (and the long term UK policy of
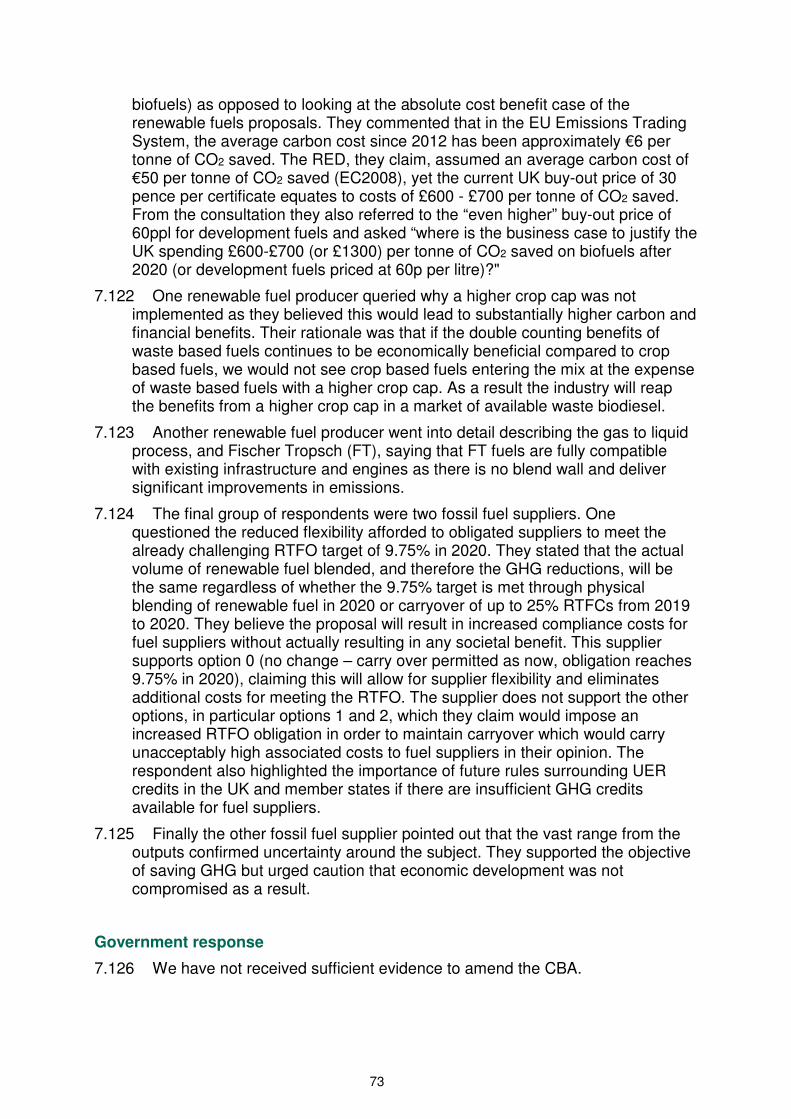
73
biofuels) as opposed to looking at the absolute cost benefit case of the renewable fuels proposals. They commented that in the EU Emissions Trading System, the average carbon cost since 2012 has been approximately €6 per tonne of CO2 saved. The RED, they claim, assumed an average carbon cost of €50 per tonne of CO2 saved (EC2008), yet the current UK buy-out price of 30 pence per certificate equates to costs of £600 - £700 per tonne of CO2 saved. From the consultation they also referred to the “even higher” buy-out price of 60ppl for development fuels and asked “where is the business case to justify the UK spending £600-£700 (or £1300) per tonne of CO2 saved on biofuels after 2020 (or development fuels priced at 60p per litre)?"
7.122 One renewable fuel producer queried why a higher crop cap was not implemented as they believed this would lead to substantially higher carbon and financial benefits. Their rationale was that if the double counting benefits of waste based fuels continues to be economically beneficial compared to crop based fuels, we would not see crop based fuels entering the mix at the expense of waste based fuels with a higher crop cap. As a result the industry will reap the benefits from a higher crop cap in a market of available waste biodiesel.
7.123 Another renewable fuel producer went into detail describing the gas to liquid process, and Fischer Tropsch (FT), saying that FT fuels are fully compatible with existing infrastructure and engines as there is no blend wall and deliver significant improvements in emissions.
7.124 The final group of respondents were two fossil fuel suppliers. One questioned the reduced flexibility afforded to obligated suppliers to meet the already challenging RTFO target of 9.75% in 2020. They stated that the actual volume of renewable fuel blended, and therefore the GHG reductions, will be the same regardless of whether the 9.75% target is met through physical blending of renewable fuel in 2020 or carryover of up to 25% RTFCs from 2019 to 2020. They believe the proposal will result in increased compliance costs for fuel suppliers without actually resulting in any societal benefit. This supplier supports option 0 (no change – carry over permitted as now, obligation reaches 9.75% in 2020), claiming this will allow for supplier flexibility and eliminates additional costs for meeting the RTFO. The supplier does not support the other options, in particular options 1 and 2, which they claim would impose an increased RTFO obligation in order to maintain carryover which would carry unacceptably high associated costs to fuel suppliers in their opinion. The respondent also highlighted the importance of future rules surrounding UER credits in the UK and member states if there are insufficient GHG credits available for fuel suppliers.
7.125 Finally the other fossil fuel supplier pointed out that the vast range from the outputs confirmed uncertainty around the subject. They supported the objective of saving GHG but urged caution that economic development was not compromised as a result.
Government response
7.126 We have not received sufficient evidence to amend the CBA.