cosco intl - 2009 annual results (eng)(chi & eng script ... · results highlights expansion in...
TRANSCRIPT
1
Agenda
Results HighlightsResults Highlights
Market and Business Review
Financial Review
O l k d lOutlook and Development Strategy
Appendix:pp
Corporate Profile
Historical Segment Results (Shipping Services)Historical Segment Results (Shipping Services)
2

Results HighlightsResults HighlightsResults HighlightsResults Highlights

Results Highlights
Achieving Profit Growth in Difficult TimesRevenue: HK$1,630 mn (‐22.4% YOY)
Profit before income tax (PBT): HK$905 mn (+55.4% YOY)Segment PBT in Shipping Services: HK$325 mn (+26.5% YOY)
Profit attributable to the equity holders of the Company:HK$844 mn (+71.8% YOY)HK$844 mn (+71.8% YOY)
If excluding deemed disposal gain and profit contribution from Sino‐Ocean Land, profit attributable to the equity holders would h e bee HK$244 ( 41 9% YOY)have been HK$244 mn (+41.9% YOY)
Basic earnings per share: HK$0.5625 (+69.5% YOY)
Proposed final DPS: 8.4 HK centsProposed final DPS: 8.4 HK centsTogether with interim DPS 1.0 HK cent, total DPS for the year: 9.4 HK cents (+ 27% YOY) *
4*Representing 36% dividend payout ratio in terms of recurrent operating profit.
Results Highlights
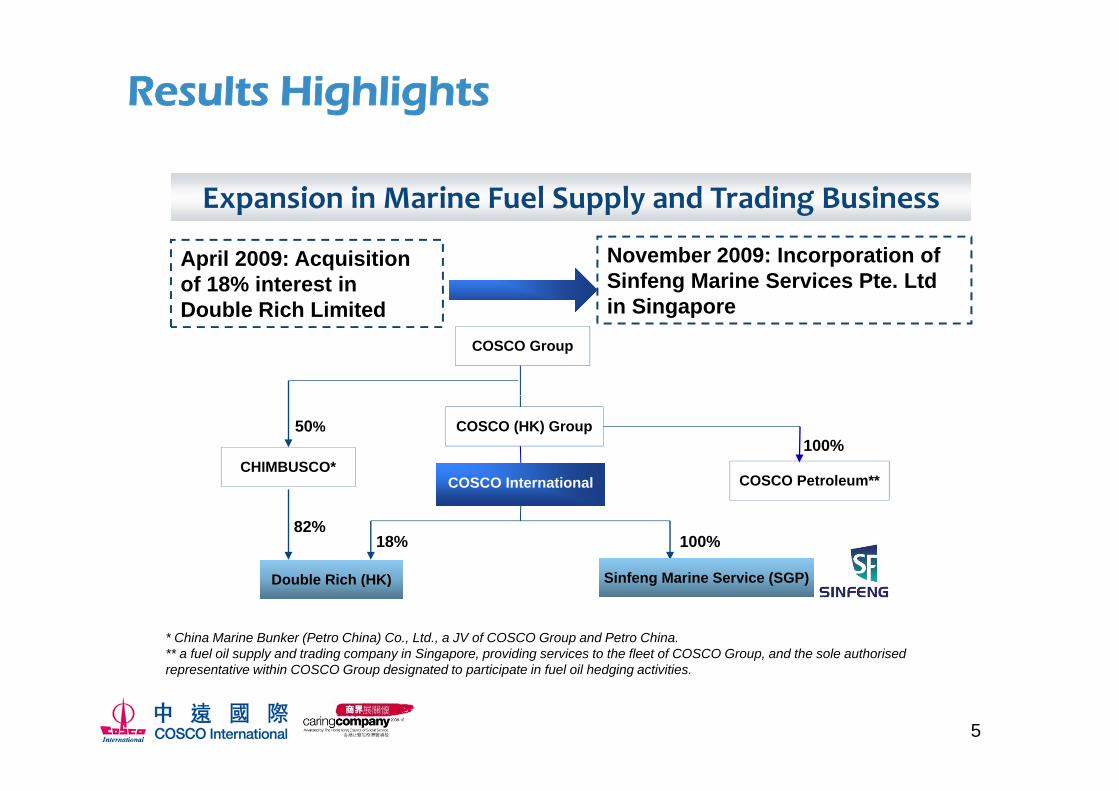
Expansion in Marine Fuel Supply and Trading Business
April 2009: Acquisition of 18% interest in Double Rich Limited
November 2009: Incorporation of Sinfeng Marine Services Pte. Ltd in SingaporeDouble Rich Limited in Singapore
COSCO Group
CHIMBUSCO*
50%
COSCO InternationalCOSCO International COSCO Petroleum**
COSCO (HK) Group 100%
82%
COSCO InternationalCOSCO International
D bl Ri h (HK) Sinfeng Marine Service (SGP)
100%18%
COSCO Petroleum
Double Rich (HK) Sinfeng Marine Service (SGP)
* China Marine Bunker (Petro China) Co., Ltd., a JV of COSCO Group and Petro China.** a fuel oil supply and trading company in Singapore, providing services to the fleet of COSCO Group, and the sole authorised
t ti ithi COSCO G d i t d t ti i t i f l il h d i ti iti
5
representative within COSCO Group designated to participate in fuel oil hedging activities.

Market & Business Market & Business
ReviewReview
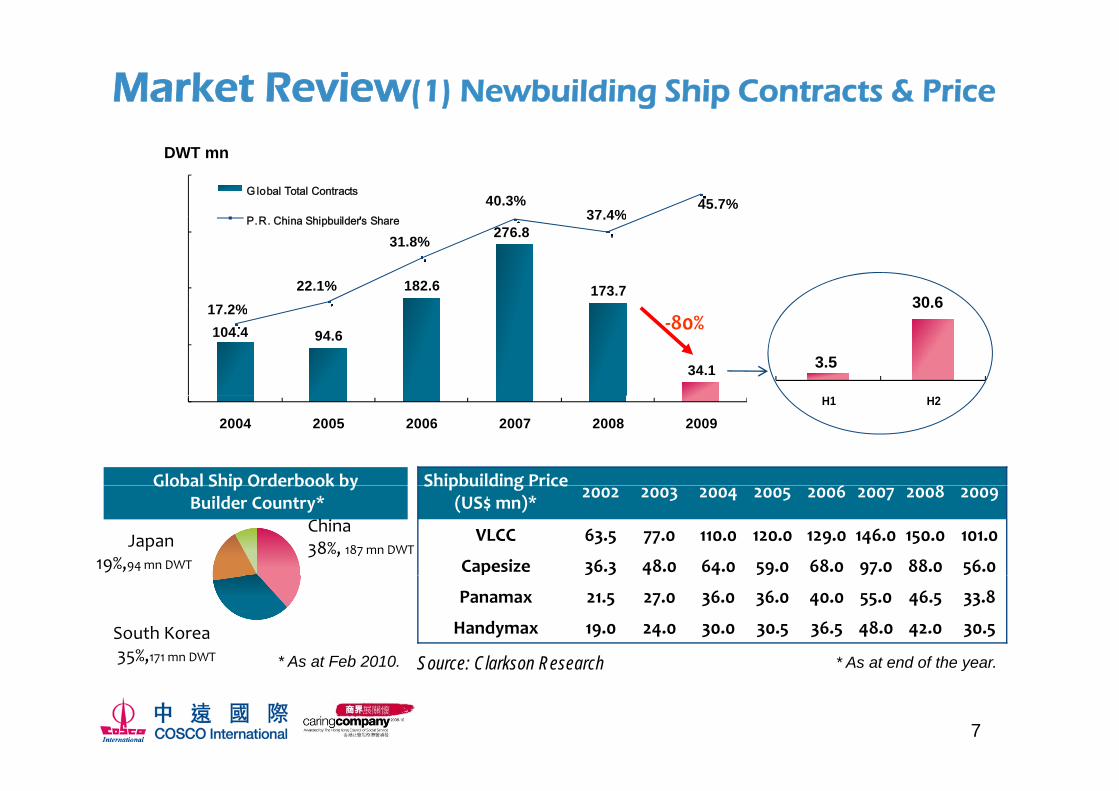
Market Review(1) Newbuilding Ship Contracts & Price
40.3%37 4%
45.7%Global Total Contracts
DWT mn
182.6
276.8
173.717 2%
22.1%
31.8%
37.4%P.R. China Shipbuilder's Share
30.6
104.4 94.6
34.1
17.2%
3.5
30.6‐80%
2004 2005 2006 2007 2008 2009
Shipbuilding Price 6 8
H1 H2
Global Ship Orderbook by Shipbuilding Price(US$ mn)* 2002 2003 2004 2005 2006 2007 2008 2009
VLCC 63.5 77.0 110.0 120.0 129.0 146.0 150.0 101.0
Capesize 36.3 48.0 64.0 59.0 68.0 97.0 88.0 56.0
Global Ship Orderbook byBuilder Country*
China 38%, 187 mn DWTJapan
19%,94mn DWT
Source: Clarkson Research
Panamax 21.5 27.0 36.0 36.0 40.0 55.0 46.5 33.8
Handymax 19.0 24.0 30.0 30.5 36.5 48.0 42.0 30.5
* As at end of the year* As at Feb 2010
South Korea35%,171 mn DWT
7
Source: Clarkson Research As at end of the year. As at Feb 2010.
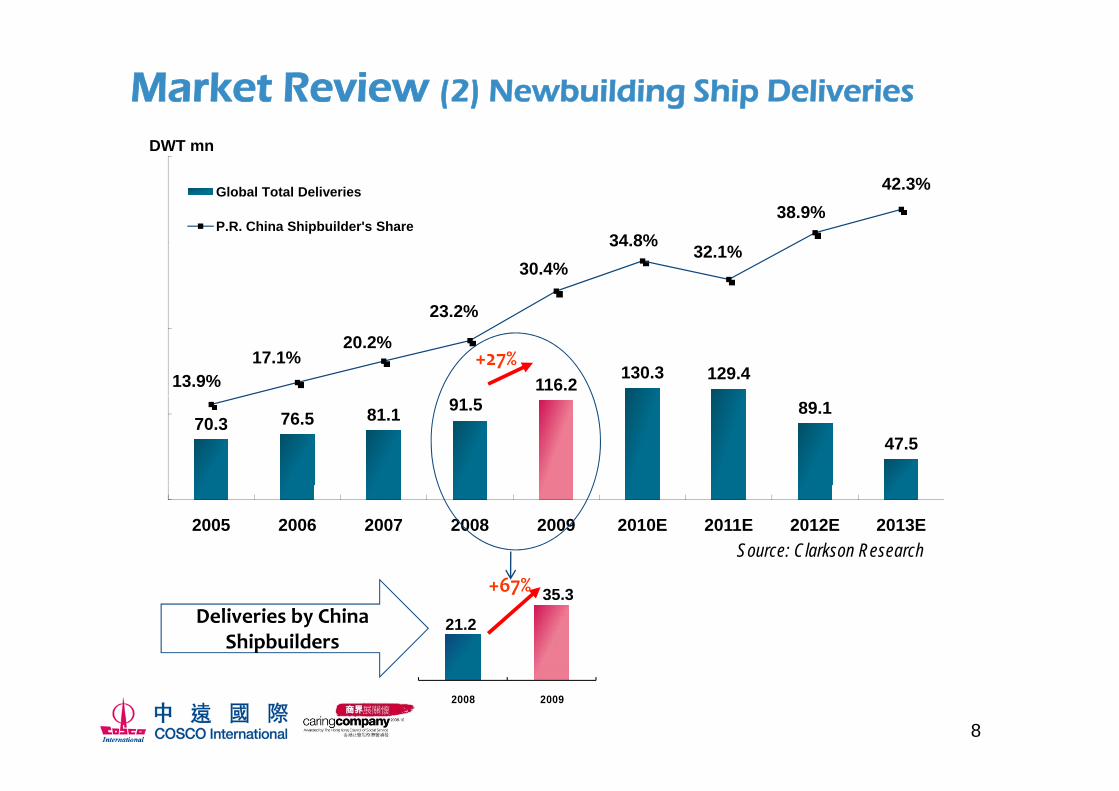
Market Review (2) Newbuilding Ship Deliveries
DWT mn
38.9%42.3%Global Total Deliveries
23 2%
30.4%34.8% 32.1%
38.9%P.R. China Shipbuilder's Share
116.2130.3 129.4 13.9%
17.1%20.2%
23.2%
+27%
70.3 76.5 81.1 91.5 89.1
47.5
Source: Clarkson Research2005 2006 2007 2008 2009 2010E 2011E 2012E 2013E
21.2
35.3+67%Deliveries by China
Shipbuilders
8
2008 2009

Market Review(3) Secondhand ship sales & Price
Gl b l T t l
No. of Vessels
5.10% 6.5% 4.3% 5.7%
17.4%Global Total
P.R. China Buyer's Share
Vessel Type 2008 2009
Bulkers 310 595
1,281 1,490
1,997
1,206 1,262 Tankers 258 166
2005 2006 2007 2008 2009
Others 636 501
Secondhand Ship Price(US$ mn)* 2002 2003 2004 2005 2006 2007 2008 2009
VLCC (5yrs, 300,000dwt) 54.0 70.0 108.0 117.0 118.0 135.0 106.8 77.1
( )
2005 2006 2007 2008 2009
Capesize (5yrs, 170,000dwt) 29.0 44.0 64.5 57.0 81.0 150.0 45.5 53.0
Panamax (5yrs, 73,000dwt) 17.0 28.0 40.0 29.5 45.5 88.5 27.3 33.4
Handymax(3‐5yrs, 52,000dwt) 14.3 20.0 29.0 25.5 40.0 75.0 24.1 27.3
9
Source: Clarkson Research * As at end of the year.
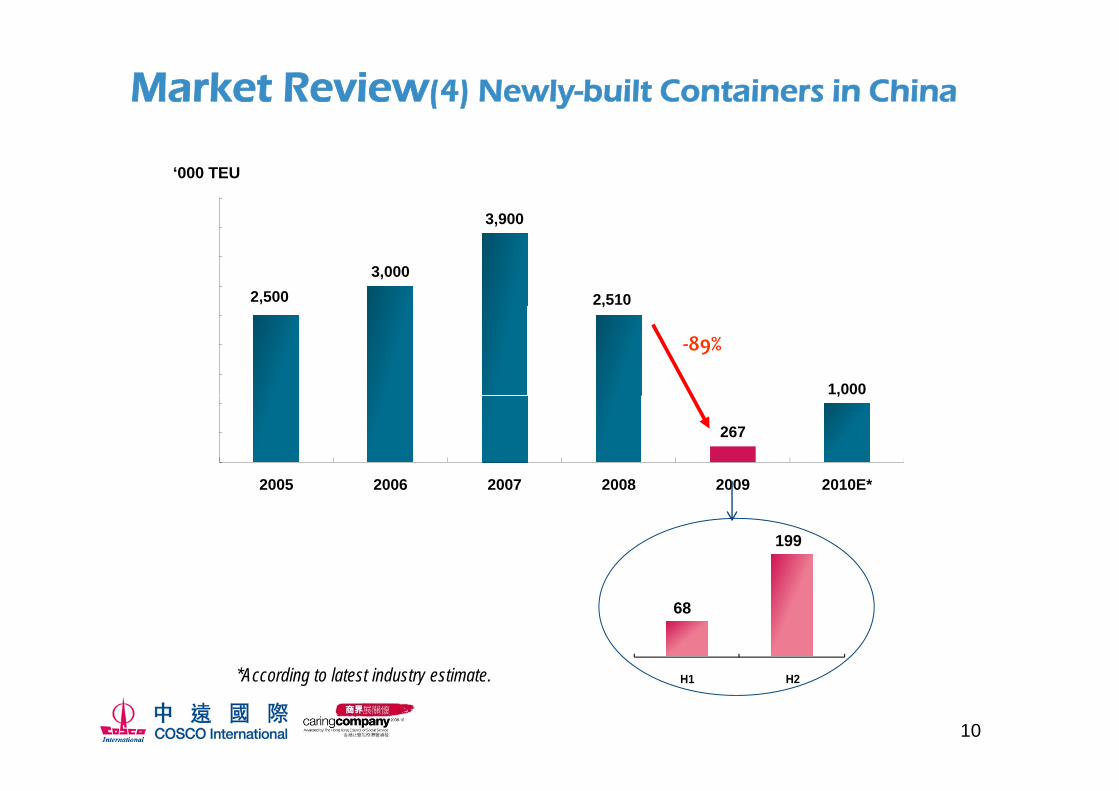
Market Review(4) Newly-built Containers in China
3 900
‘000 TEU
2,500 3,000
3,900
2,510 ,
1,000
‐89%
267
,
2005 2006 2007 2008 2009 2010E*2005 2006 2007 2008 2009 2010E
199
68
10
*According to latest industry estimate. H1 H2
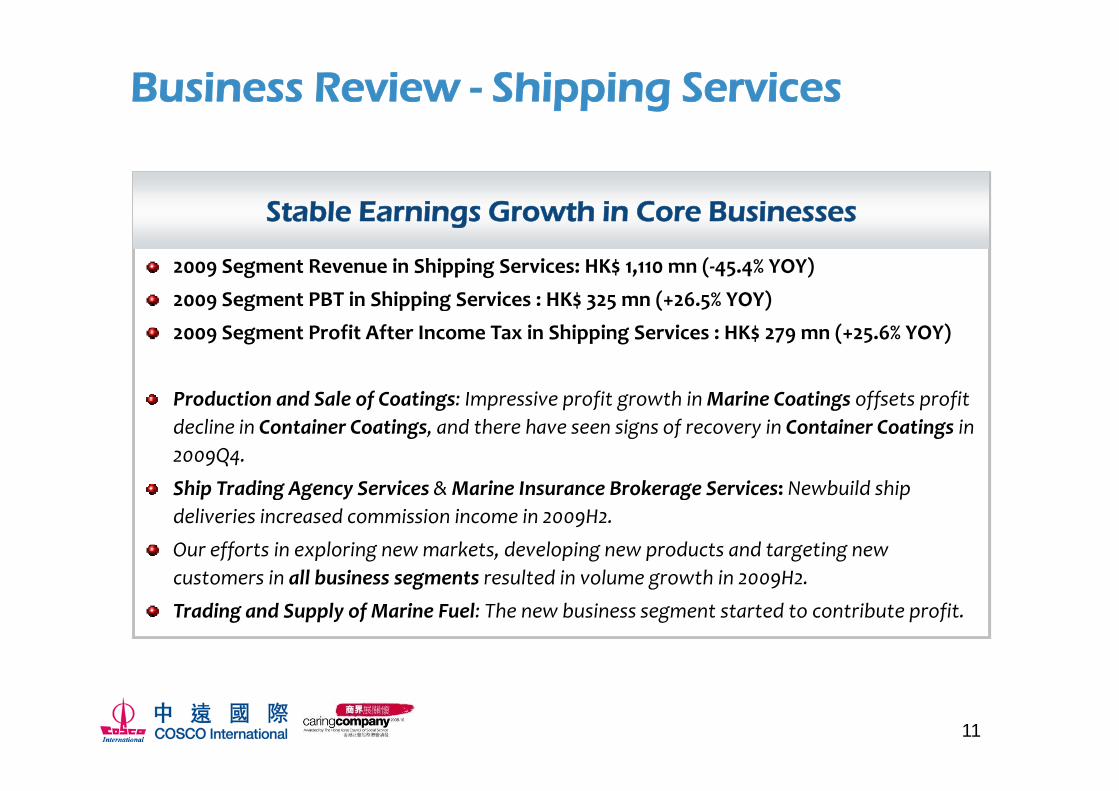
Business Review - Shipping Services
Stable Earnings Growth in Core BusinessesStable Earnings Growth in Core Businesses
2009 Segment Revenue in Shipping Services: HK$ 1,110 mn (‐45.4% YOY)
2009 Segment PBT in Shipping Services : HK$ 325 mn (+26.5% YOY)2009 Segment PBT in Shipping Services : HK$ 325 mn ( 26.5% YOY)
2009 Segment Profit After Income Tax in Shipping Services : HK$ 279 mn (+25.6% YOY)
Production and Sale of Coatings: Impressive profit growth in Marine Coatings offsets profit Production and Sale of Coatings: Impressive profit growth in Marine Coatings offsets profit decline in Container Coatings, and there have seen signs of recovery in Container Coatings in 2009Q4.
Ship Trading Agency Services & Marine Insurance Brokerage Services: Newbuild ship Ship Trading Agency Services & Marine Insurance Brokerage Services: Newbuild ship deliveries increased commission income in 2009H2.
Our efforts in exploring new markets, developing new products and targeting new customers in all business segments resulted in volume growth in 2009H2customers in all business segments resulted in volume growth in 2009H2.
Trading and Supply of Marine Fuel: The new business segment started to contribute profit.
11
Business Review - Shipping Services
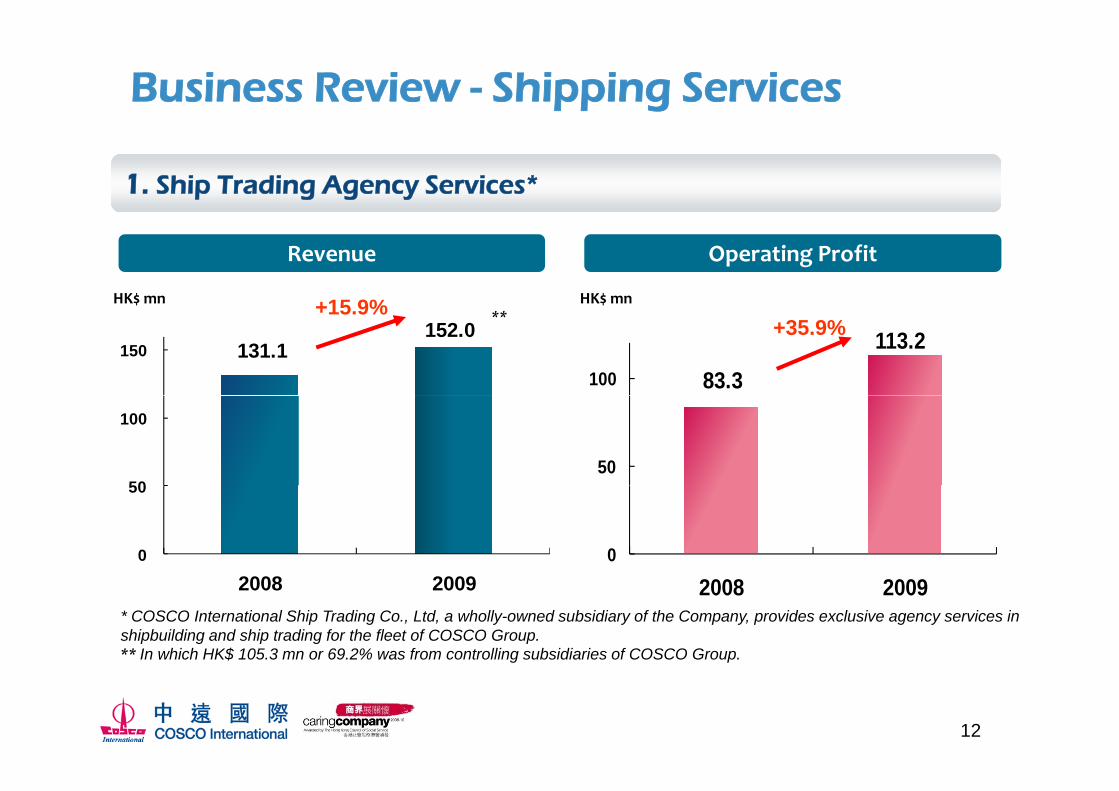
1. Ship Trading Agency Services*
Revenue Operating Profit
+15 9%HK$ mn HK$ mn+15.9% ** +35.9%
83.3113.2
100131.1
152.0 150
5050
100
00
50
* COSCO International Ship Trading Co., Ltd, a wholly-owned subsidiary of the Company, provides exclusive agency services inshipbuilding and ship trading for the fleet of COSCO Group.** In which HK$ 105.3 mn or 69.2% was from controlling subsidiaries of COSCO Group.
2008 20092008 2009
12
Business Review - Shipping Services (cont’d)
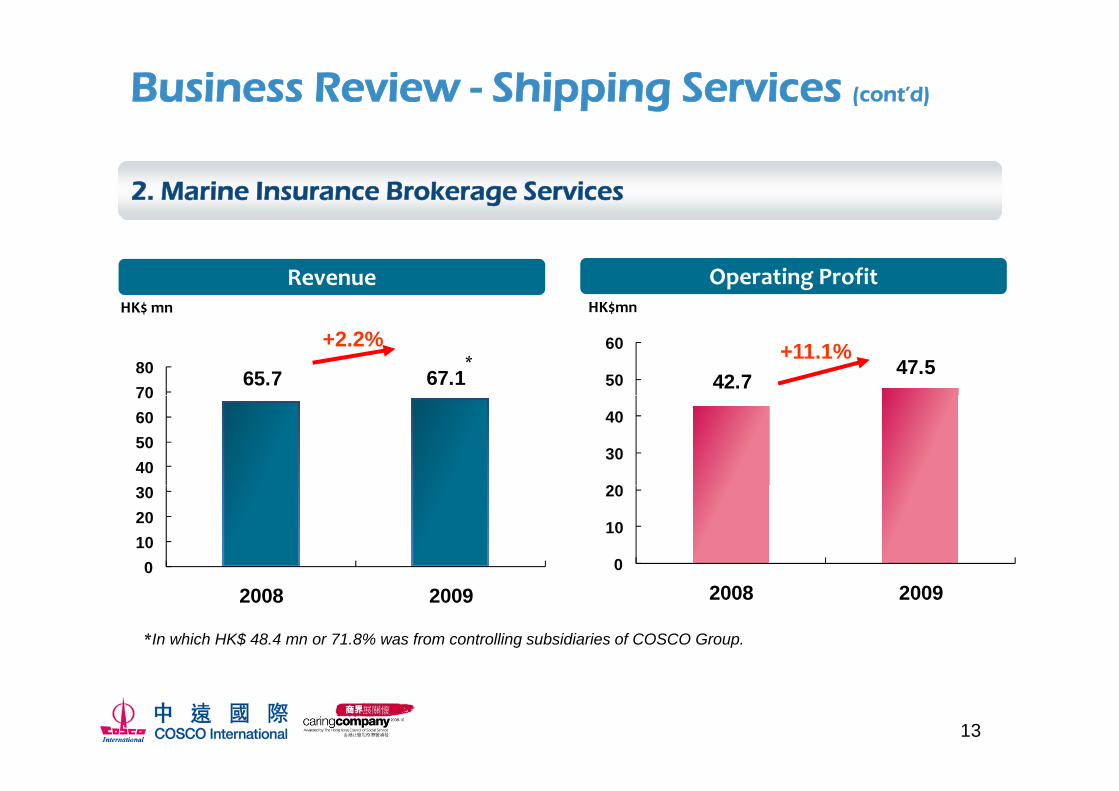
2. Marine Insurance Brokerage Services
HK$ mn HK$mn
Revenue Operating ProfitHK$ mn
+2.2%HK$mn
+11.1%*65.7 67.1
7080
42.747.5
50
60
40506070
20
30
40
0102030
0
10
20
*In which HK$ 48.4 mn or 71.8% was from controlling subsidiaries of COSCO Group.
2008 2009 2008 2009
13
Business Review – Shipping Services (cont’d)
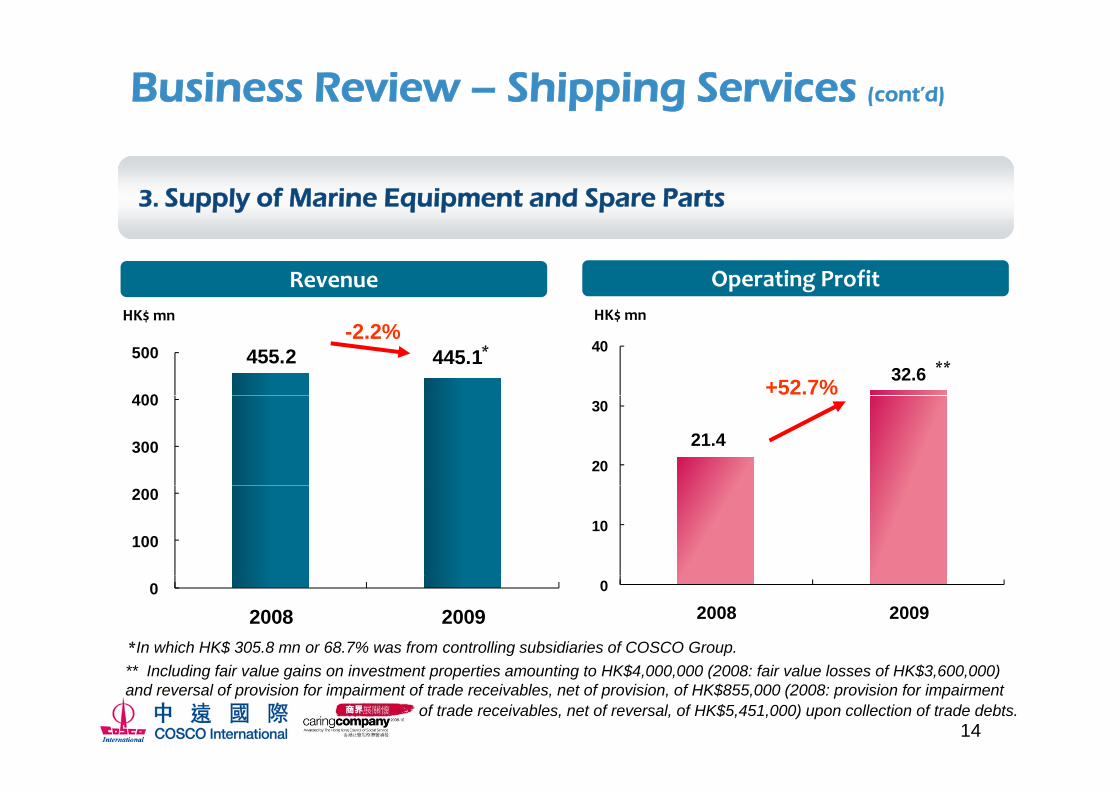
3. Supply of Marine Equipment and Spare Parts
Revenue Operating Profit
+52.7%
HK$ mn HK$ mn
*-2.2%
455.2 445.1
400
500 32.6
40**
300
400
21.420
30
100
200
10
*In which HK$ 305.8 mn or 68.7% was from controlling subsidiaries of COSCO Group.
0
2008 20090
2008 2009
** I l di f i l i i i i HK$4 000 000 (2008 f i l l f HK$3 600 000)
14
** Including fair value gains on investment properties amounting to HK$4,000,000 (2008: fair value losses of HK$3,600,000) and reversal of provision for impairment of trade receivables, net of provision, of HK$855,000 (2008: provision for impairment
of trade receivables, net of reversal, of HK$5,451,000) upon collection of trade debts.
Business Review – Shipping Services (cont’d)
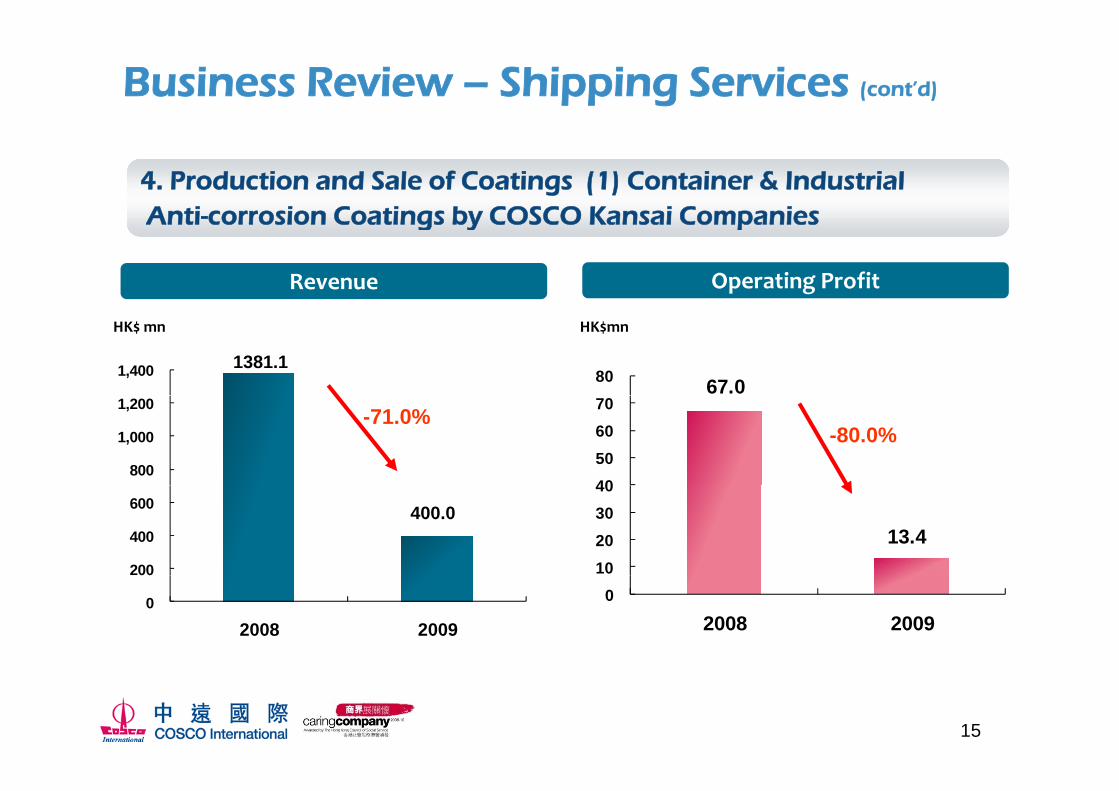
4. Production and Sale of Coatings (1) Container & IndustrialAnti corrosion Coatings by COSCO Kansai CompaniesAnti-corrosion Coatings by COSCO Kansai Companies
Revenue Operating Profit
HK$mnHK$ mn
1381.1 1,400 67.0 80
-80.0%-71.0%
800
1,000
1,200
4050 60 70
400.0
200
400
600
13.4 10 20 30 40
0
00
2008 2009
0
2008 2009
15
Business Review – Shipping Services (cont’d)
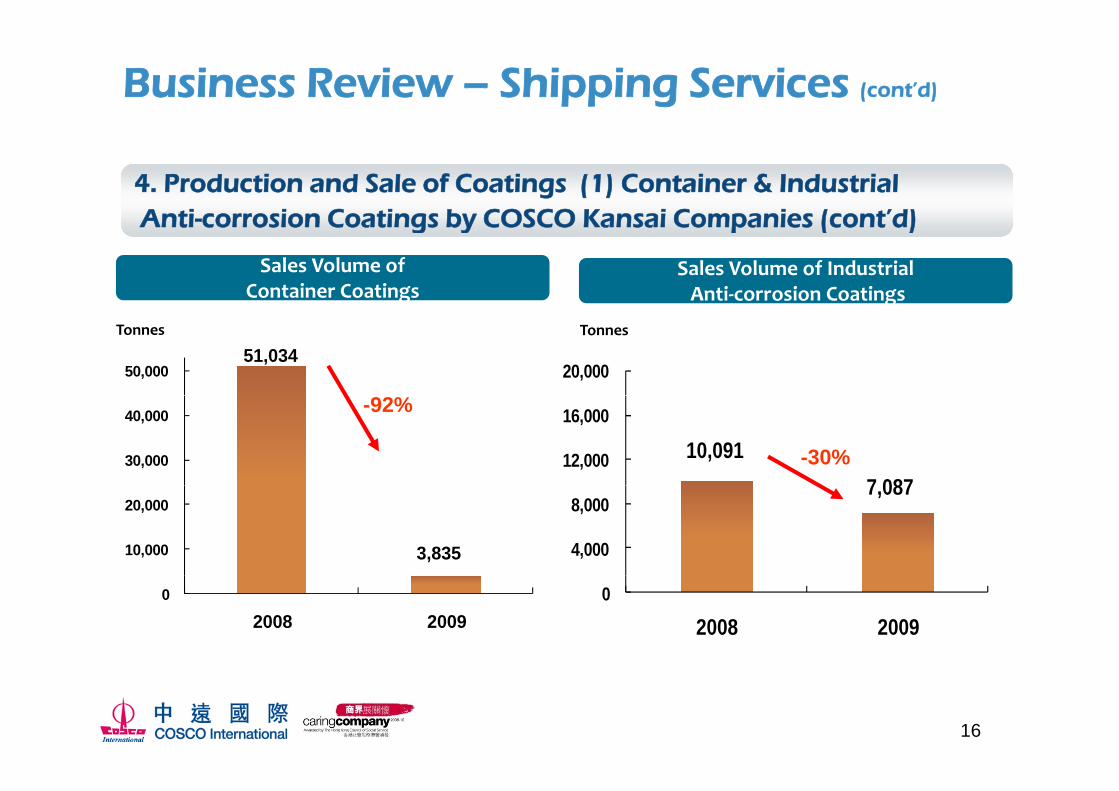
4. Production and Sale of Coatings (1) Container & IndustrialAnti corrosion Coatings by COSCO Kansai Companies (cont’d)Anti-corrosion Coatings by COSCO Kansai Companies (cont d)
Sales Volume ofContainer Coatings
Sales Volume of IndustrialAnti‐corrosion Coatings
51,034 50,000
TonnesTonnes
g
20,000
30,000
40,000 -92%
-30%10,091 7 087
12,000
16,000
3,835 10,000
20,000 7,087
4,000
8,000
0
2008 20090
2008 2009
16
Business Review – Shipping Services (cont’d)
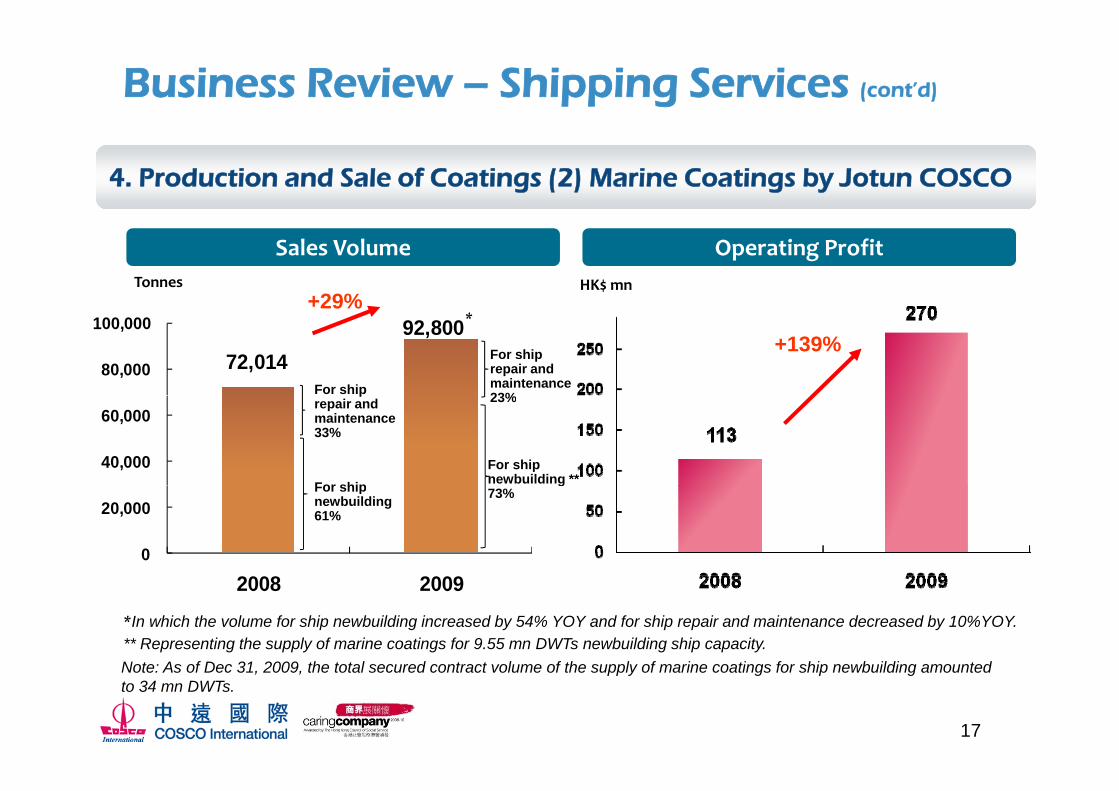
4. Production and Sale of Coatings (2) Marine Coatings by Jotun COSCO
Sales Volume Operating ProfitHK$ mnTonnes
+29%
72,014 92,800
80,000
100,000
For ship repair and maintenance 23%For ship
*+29%
+139%
40,000
60,000
For shipnewbuilding **
23%
For ship
prepair and maintenance 33%
0
20,000
g73%For ship
newbuilding 61%
2008 2009*In which the volume for ship newbuilding increased by 54% YOY and for ship repair and maintenance decreased by 10%YOY.** Representing the supply of marine coatings for 9.55 mn DWTs newbuilding ship capacity.Note: As of Dec 31 2009 the total secured contract volume of the supply of marine coatings for ship newbuilding amounted
17
Note: As of Dec 31, 2009, the total secured contract volume of the supply of marine coatings for ship newbuilding amounted to 34 mn DWTs.
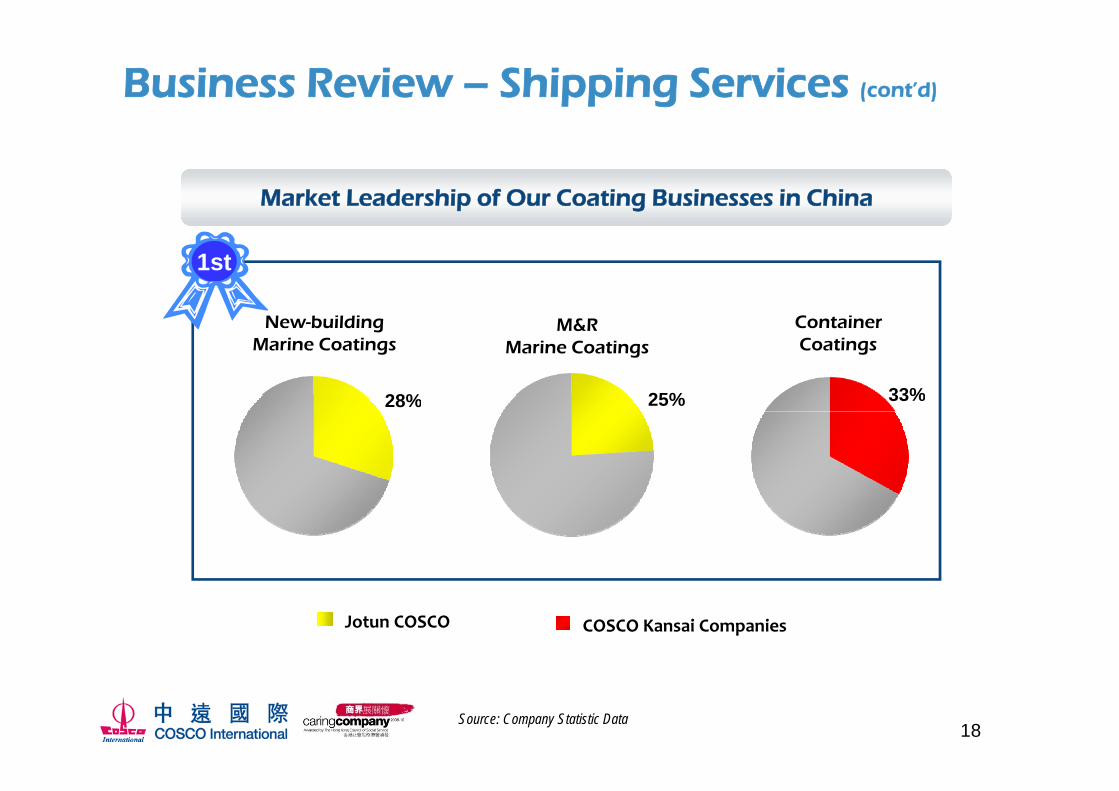
Business Review – Shipping Services (cont’d)
Market Leadership of Our Coating Businesses in China
1st
33%
ContainerCoatings
M&RMarine Coatings
25%28%
New-buildingMarine Coatings
33%25%28%
Jotun COSCO COSCO Kansai Companies
18Source: Company Statistic Data
Business Review – Shipping Services (cont’d)
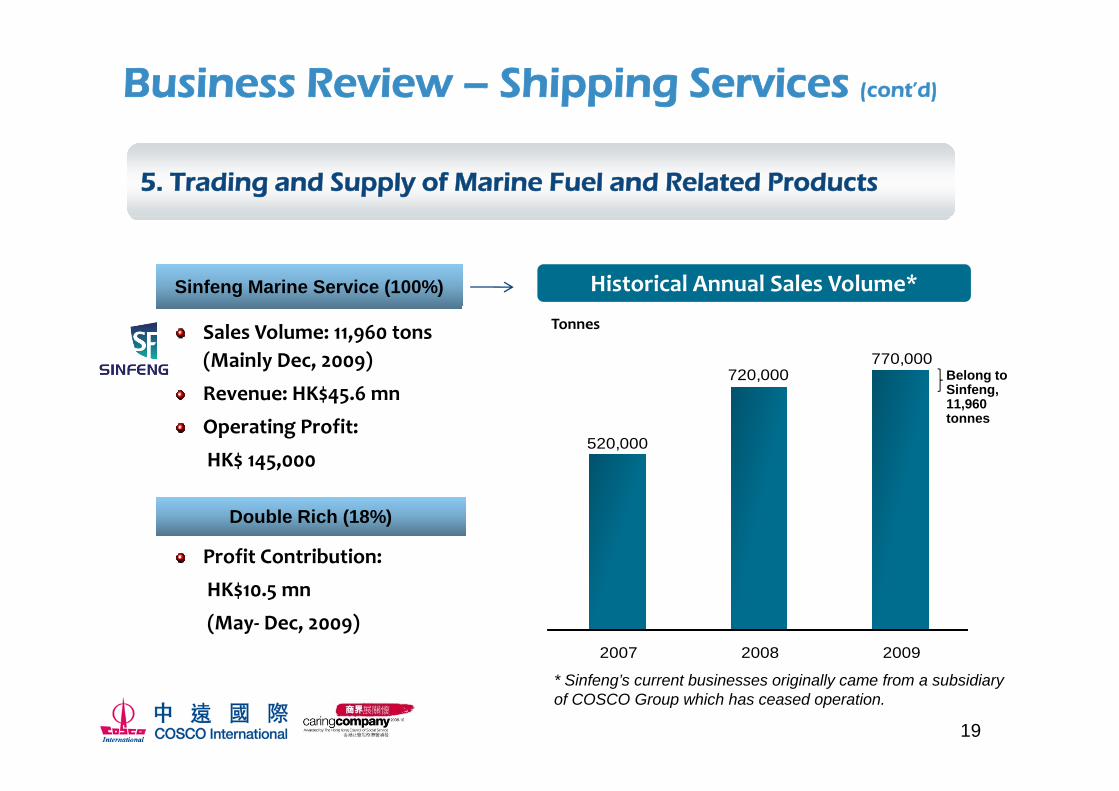
5. Trading and Supply of Marine Fuel and Related Products
Historical Annual Sales Volume*Sinfeng Marine Service (100%)
720,000770,000
Belong to Sinfeng,
Sales Volume: 11,960 tons (Mainly Dec, 2009)
Revenue: HK$45 6 mn
Tonnes
520,000
g,11,960 tonnes
Revenue: HK$45.6 mn
Operating Profit:
HK$ 145,000
Double Rich (18%)
Profit Contribution:
2007 2008 2009
HK$10.5 mn
(May‐ Dec, 2009)
19
* Sinfeng’s current businesses originally came from a subsidiary of COSCO Group which has ceased operation.
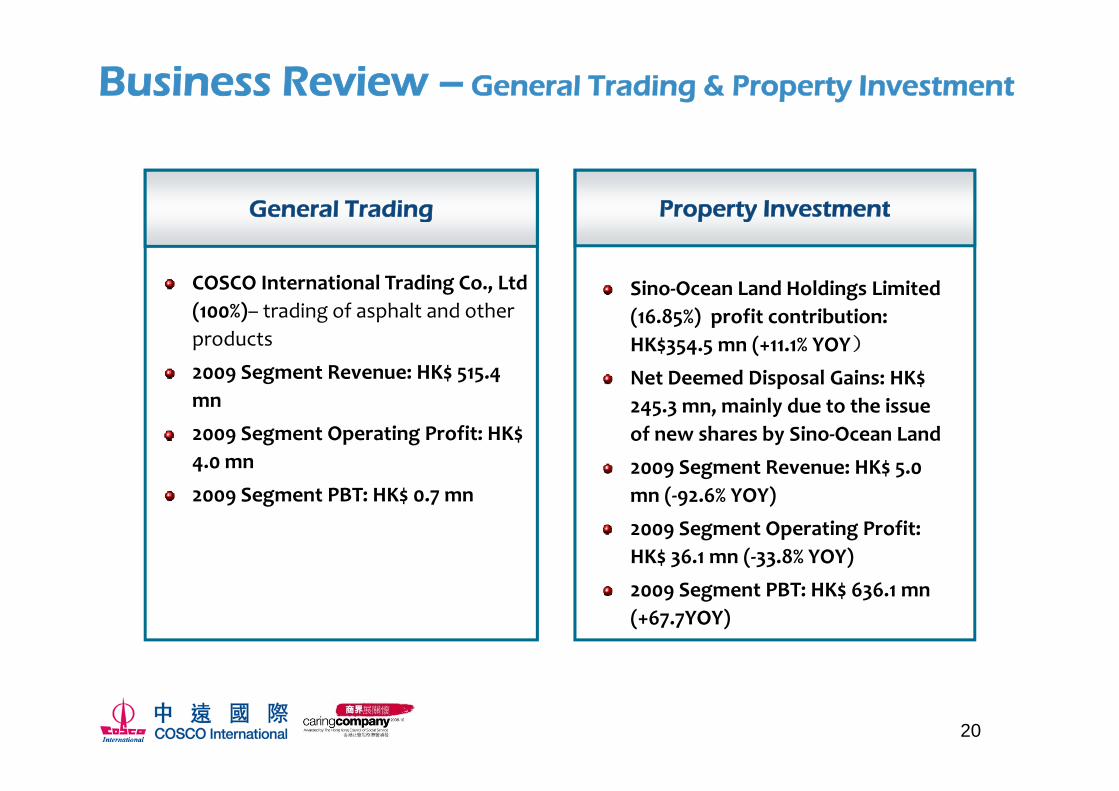
Business Review – General Trading & Property Investment
General Trading Property Investment
COSCO International Trading Co., Ltd ( %) t di f h lt d th
General Trading Property Investment
Sino‐Ocean Land Holdings Limited (100%)– trading of asphalt and other products
2009 Segment Revenue: HK$ 515.4
(16.85%) profit contribution:HK$354.5 mn (+11.1% YOY)
Net Deemed Disposal Gains: HK$ mn
2009 Segment Operating Profit: HK$ 4.0 mn
245.3 mn, mainly due to the issue of new shares by Sino‐Ocean Land
2009 Segment Revenue: HK$ 5.0 2009 Segment PBT: HK$ 0.7 mn mn (‐92.6% YOY)
2009 Segment Operating Profit: HK$ 36.1 mn (‐33.8% YOY)
2009 Segment PBT: HK$ 636.1 mn (+67.7YOY)
20
Revenue
Gross Profit
Profit Margin
EBITDA
Operating Profit
Financial ReviewFinancial ReviewFinancial ReviewFinancial Review
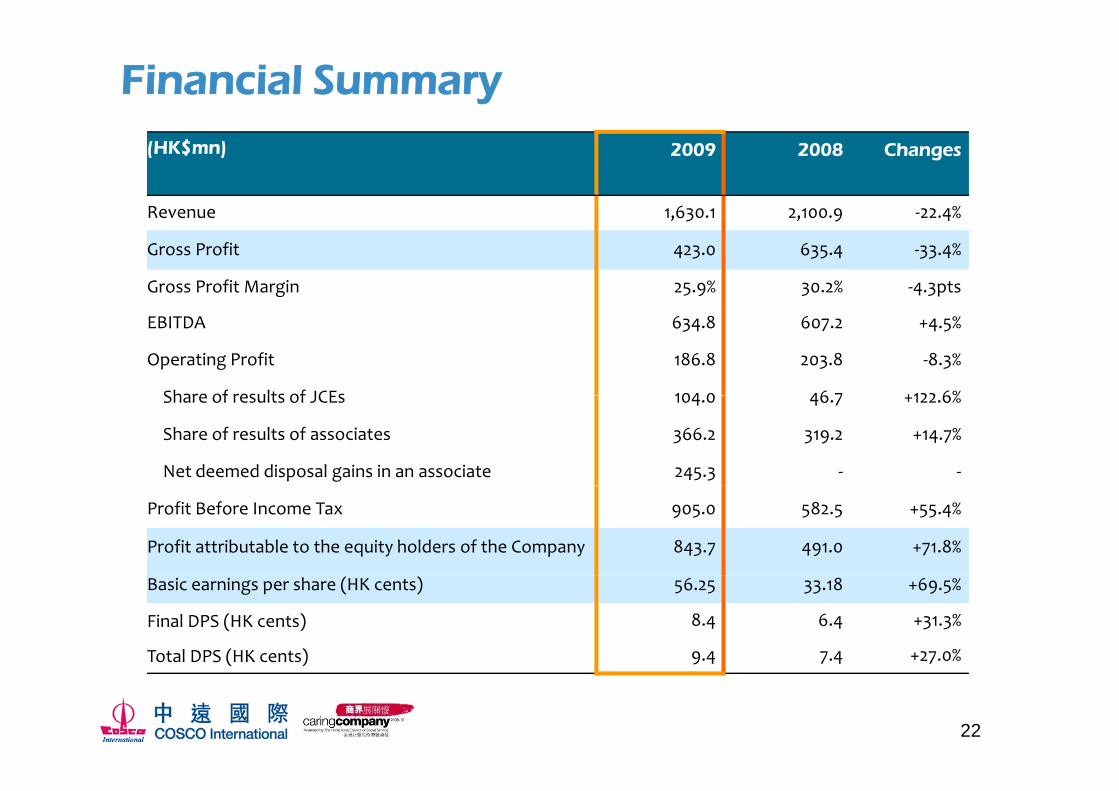
Financial Summary(HK$mn) 2009 2008 Changes
Revenue 1,630.1 2,100.9 ‐22.4%Revenue 1,630.1 2,100.9 22.4%
Gross Profit 423.0 635.4 ‐33.4%
Gross Profit Margin 25.9% 30.2% ‐4.3pts
EBITDA 634.8 607.2 +4.5%
Operating Profit 186.8 203.8 ‐8.3%
Share of results of JCEs 104 0 46 7 +122 6%Share of results of JCEs 104.0 46.7 +122.6%
Share of results of associates 366.2 319.2 +14.7%
Net deemed disposal gains in an associate 245.3 ‐ ‐
Profit Before Income Tax 905.0 582.5 +55.4%
Profit attributable to the equity holders of the Company 843.7 491.0 +71.8%
Basic earnings per share (HK cents) 56.25 33.18 +69.5%
Final DPS (HK cents) 8.4 6.4 +31.3%
Total DPS (HK cents) 9.4 7.4 +27.0%
22
( )
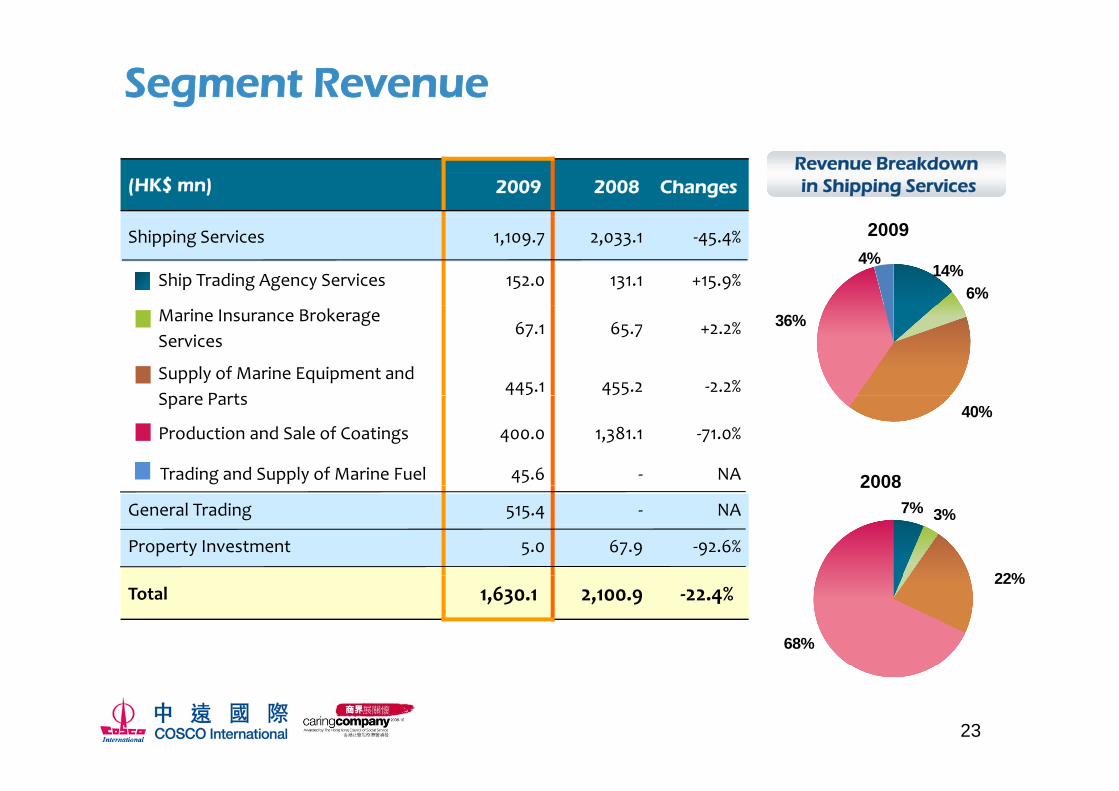
Segment Revenue
Revenue Breakdownin Shipping Services(HK$ mn) 2009 2008 Changes
Shipping Services 1,109.7 2,033.1 ‐45.4%
Ship Trading Agency Services 152.0 131.1 +15.9%
2009
14%6%
4%
Marine Insurance Brokerage Services
67.1 65.7 +2.2%
Supply of Marine Equipment andS P t
445.1 455.2 ‐2.2%
36%
Spare Parts
Production and Sale of Coatings 400.0 1,381.1 ‐71.0%
Trading and Supply of Marine Fuel 45.6 ‐ NA 2008
40%
General Trading 515.4 ‐ NA
Property Investment 5.0 67.9 ‐92.6%
20087% 3%
22%Total 1,630.1 2,100.9 ‐22.4%
22%
68%
23

Segment Profit Before Income Tax
(HK$ mn) 2009 2008 ChangesPBT Breakdown
in Shipping Services
36%
35%
3%Shipping Services 324.7 256.7 +26.5%
Ship Trading Agency Services 116.2 89.3 +30.1%
2009
Marine Insurance Brokerage Services
47.7 43.7 +9.3%
Supply of Marine Equipment andS P t
37.1 25.6 +45.4%15%
11%
Spare Parts
Production and Sale of Coatings 113.1 98.2 +15.2%
Trading and Supply of Marine Fuel 10.7 ‐ NA 2008
35%38%General Trading 0.7 ‐ NA
Property Investment 636.1 379.3 +67.7%
17%10%
Total 905.0 582.5 +55.4%
24
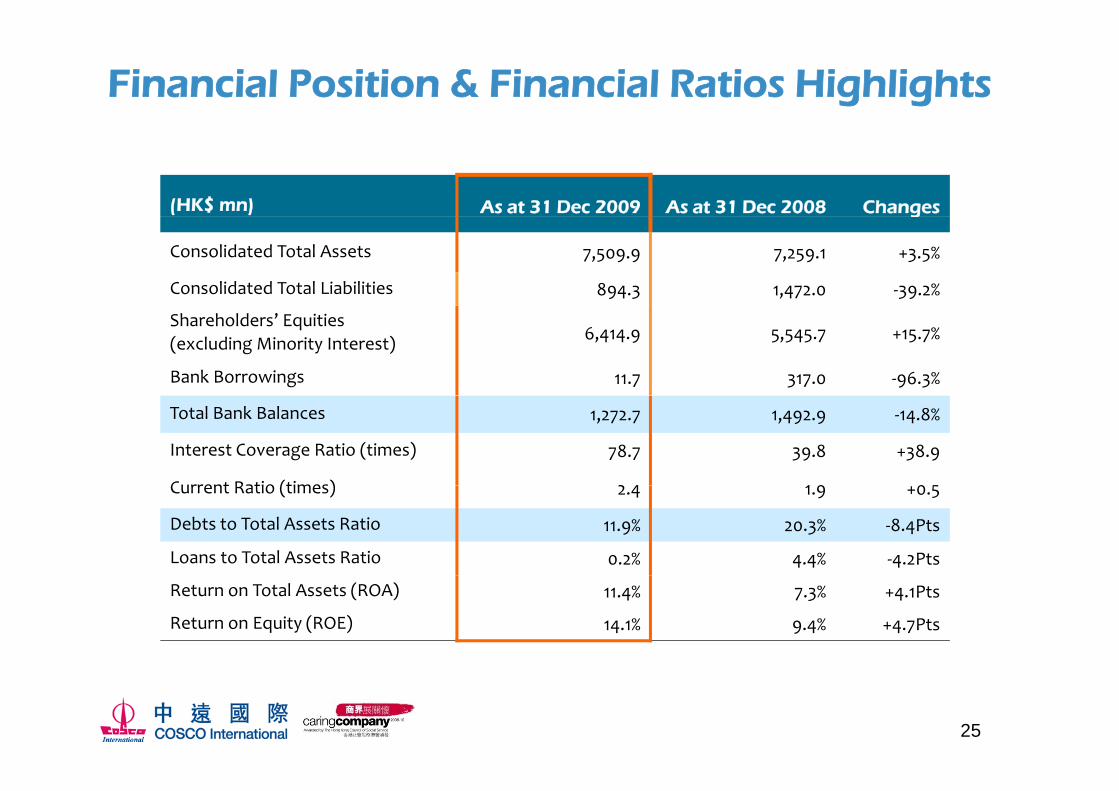
Financial Position & Financial Ratios Highlights
(HK$ mn) As at 31 Dec 2009 As at 31 Dec 2008 Changesg
Consolidated Total Assets 7,509.9 7,259.1 +3.5%
Consolidated Total Liabilities 894.3 1,472.0 ‐39.2%
Shareholders’ Equities(excluding Minority Interest) 6,414.9 5,545.7 +15.7%
Bank Borrowings 11.7 317.0 ‐96.3%
Total Bank Balances 1,272.7 1,492.9 ‐14.8%
Interest Coverage Ratio (times) 78.7 39.8 +38.9
Current Ratio (times) 2 4 1 9 0 5Current Ratio (times) 2.4 1.9 +0.5
Debts to Total Assets Ratio 11.9% 20.3% ‐8.4Pts
Loans to Total Assets Ratio 0.2% 4.4% ‐4.2Pts
Return on Total Assets (ROA) 11.4% 7.3% +4.1Pts
Return on Equity (ROE) 14.1% 9.4% +4.7Pts
25
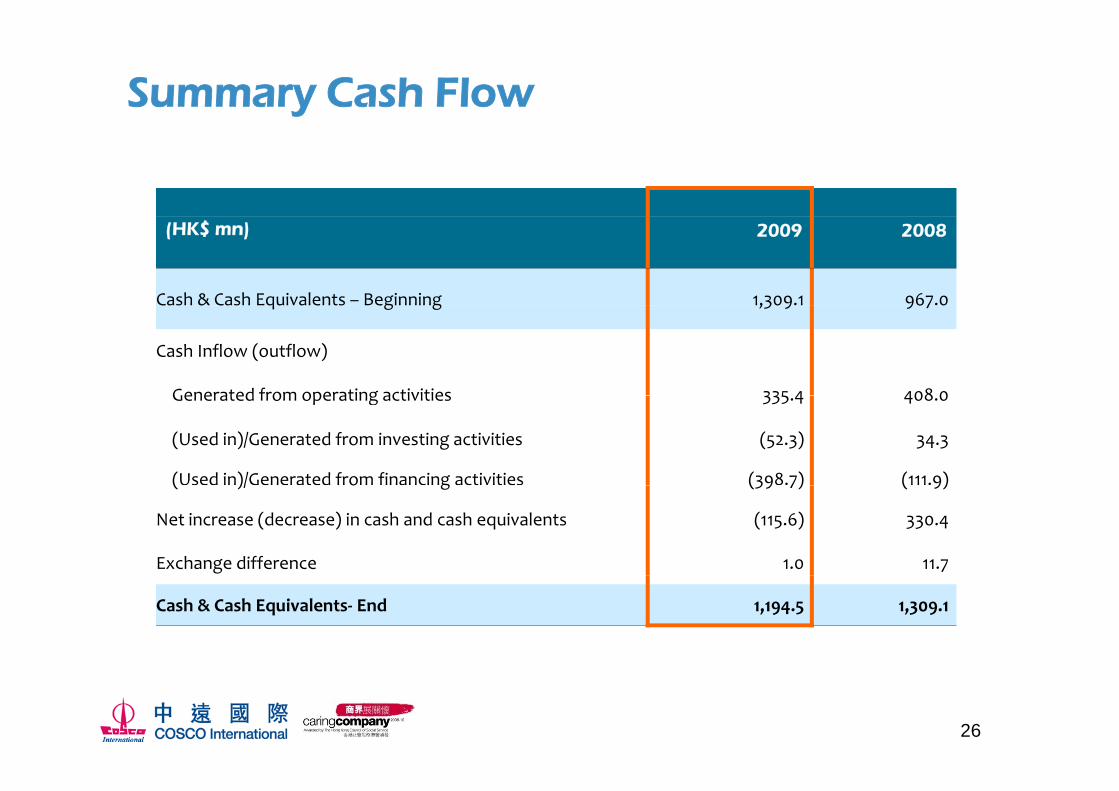
Summary Cash Flow
(HK$ mn) 2009 2008
Cash & Cash Equivalents – Beginning 1,309.1 967.0q g g ,3 9 9 7
Cash Inflow (outflow)
Generated from operating activities 335 4 408 0Generated from operating activities 335.4 408.0
(Used in)/Generated from investing activities (52.3) 34.3
(Used in)/Generated from financing activities (398.7) (111.9)( )/ o g (39 7) ( 9)
Net increase (decrease) in cash and cash equivalents (115.6) 330.4
Exchange difference 1.0 11.7
Cash & Cash Equivalents‐ End 1,194.5 1,309.1
26
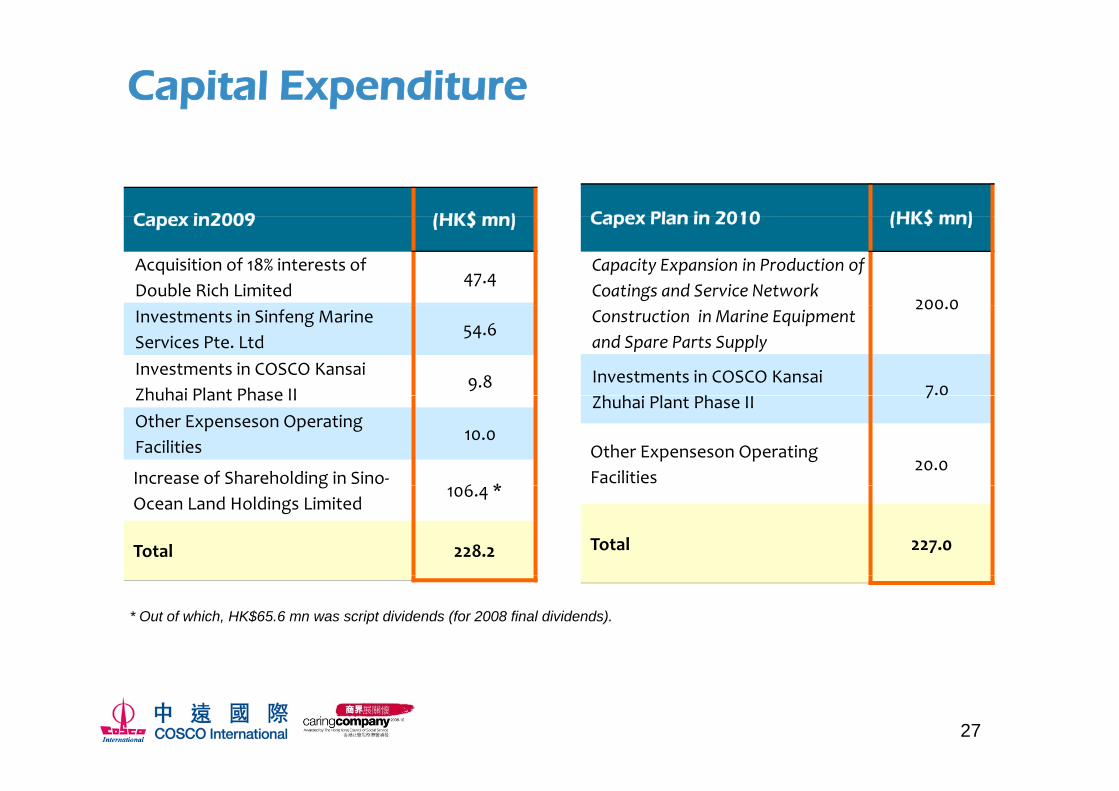
Capital Expenditure
C i 2009 (HK$ ) Capex Plan in 2010 (HK$ mn)Capex in2009 (HK$ mn)
Acquisition of 18% interests ofDouble Rich Limited
47.4
Capex Plan in 2010 (HK$ mn)
Capacity Expansion in Production of Coatings and Service Network
200 0Investments in Sinfeng Marine Services Pte. Ltd
54.6
Investments in COSCO Kansai Zhuhai Plant Phase II
9.8
Construction in Marine Equipment and Spare Parts Supply
200.0
Investments in COSCO Kansai h h l h
7.0Zhuhai Plant Phase IIOther Expenseson Operating Facilities
10.0
Increase of Shareholding in Sino‐6 *
Zhuhai Plant Phase II7
Other Expenseson Operating Facilities
20.0g
Ocean Land Holdings Limited106.4 *
Total 228.2 Total 227.0
* Out of which, HK$65.6 mn was script dividends (for 2008 final dividends).
27
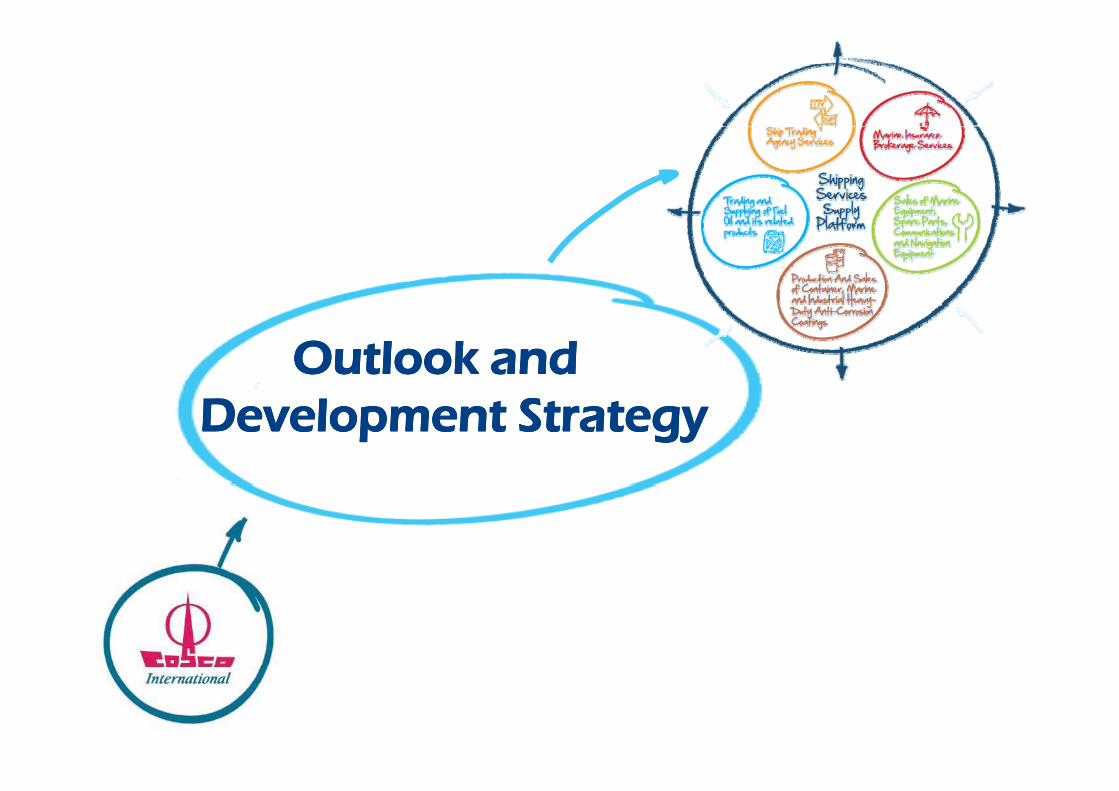
Outlook and Outlook and Development StrategyDevelopment Strategy
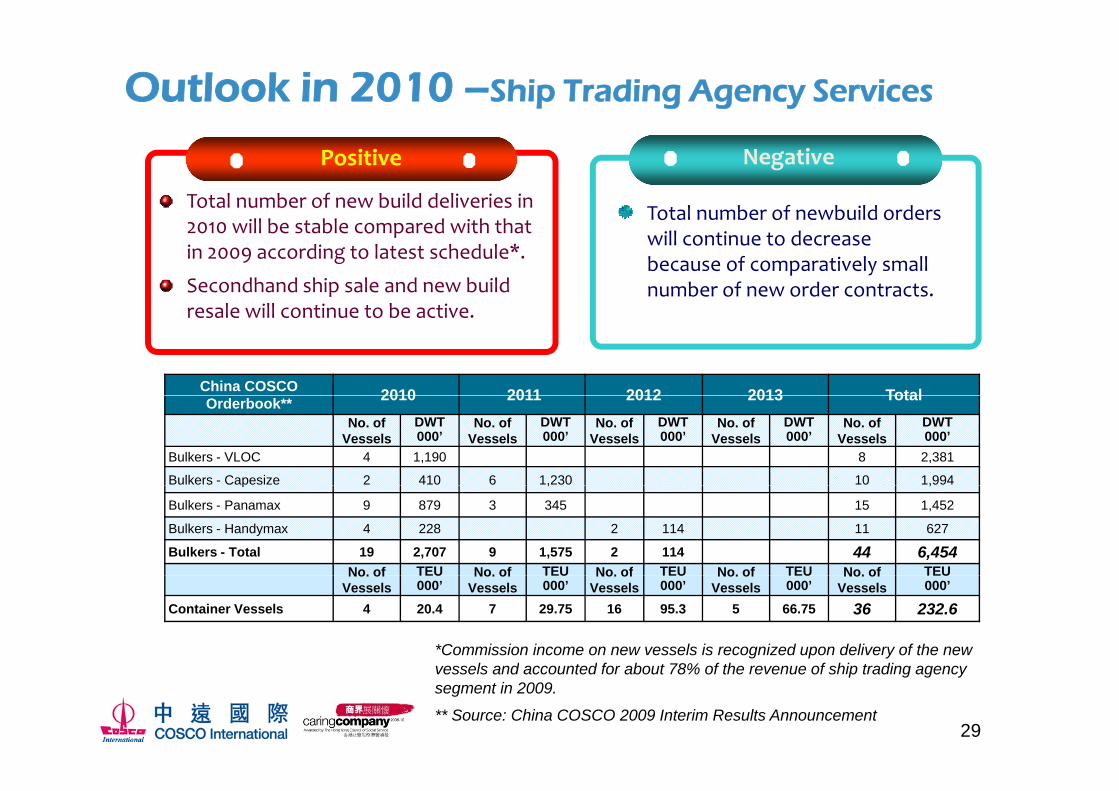
Outlook in 2010 –Ship Trading Agency Services
Total number of new build deliveries in
Positive Negative
Total number of newbuild orders 2010 will be stable compared with that in 2009 according to latest schedule*.
Secondhand ship sale and new build l ill ti t b ti
Total number of newbuild orders will continue to decrease because of comparatively small number of new order contracts.
China COSCO 2010 2011 2012 2013 Total
resale will continue to be active.
Orderbook** 2010 2011 2012 2013 TotalNo. of
VesselsDWT000’
No. ofVessels
DWT000’
No. ofVessels
DWT000’
No. ofVessels
DWT000’
No. ofVessels
DWT000’
Bulkers - VLOC 4 1,190 8 2,381
Bulkers - Capesize 2 410 6 1,230 10 1,994p , ,
Bulkers - Panamax 9 879 3 345 15 1,452
Bulkers - Handymax 4 228 2 114 11 627
Bulkers - Total 19 2,707 9 1,575 2 114 44 6,454No. of TEU No. of TEU No. of TEU No. of TEU No. of TEUNo. of
VesselsTEU000’
No. ofVessels
TEU000’
No. ofVessels
TEU000’
No. ofVessels
TEU000’
No. ofVessels
TEU000’
Container Vessels 4 20.4 7 29.75 16 95.3 5 66.75 36 232.6
*Commission income on new vessels is recognized upon delivery of the newl d t d f b t 78% f th f hi t di
29
vessels and accounted for about 78% of the revenue of ship trading agency segment in 2009.
** Source: China COSCO 2009 Interim Results Announcement
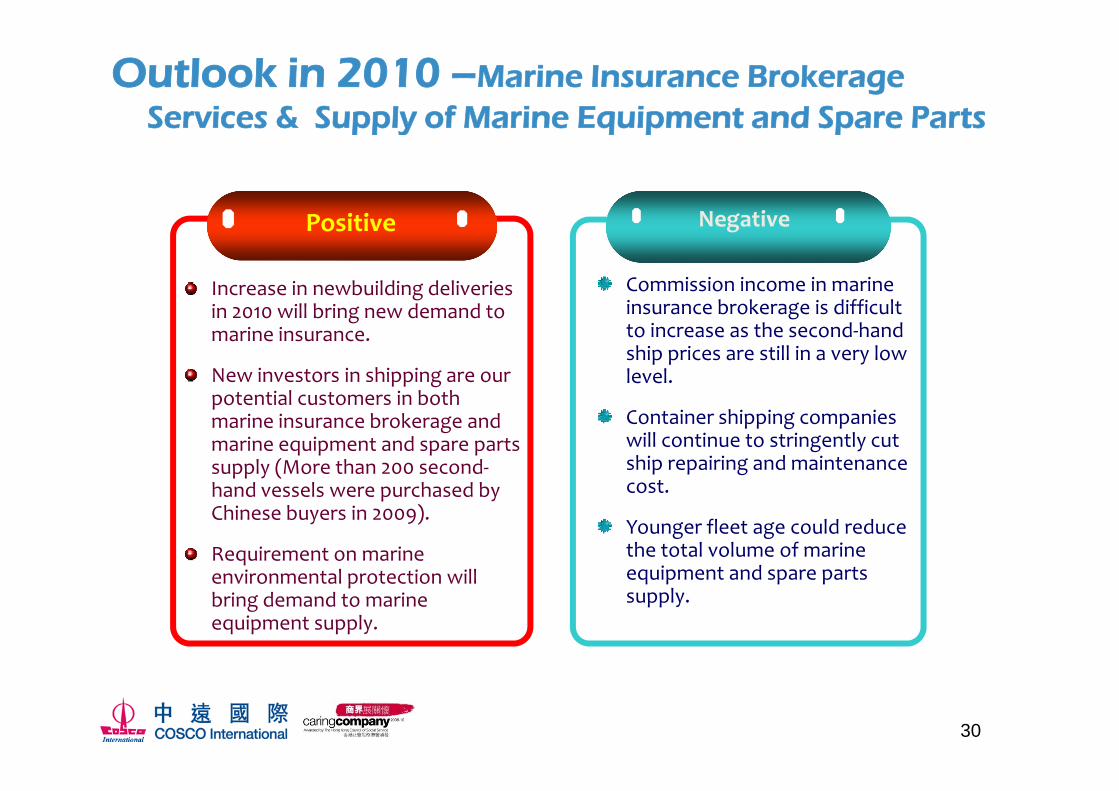
Outlook in 2010 –Marine Insurance Brokerage Services & Supply of Marine Equipment and Spare Parts
NegativeP iti
Services & Supply of Marine Equipment and Spare Parts
Increase in newbuilding deliveries i ill b i d d t
Negative
Commission income in marine insurance brokerage is difficult
Positive
in 2010 will bring new demand to marine insurance.
New investors in shipping are our potential customers in both
insurance brokerage is difficult to increase as the second‐hand ship prices are still in a very low level.
potential customers in both marine insurance brokerage and marine equipment and spare parts supply (More than 200 second‐h d l h d b
Container shipping companies will continue to stringently cut ship repairing and maintenance costhand vessels were purchased by
Chinese buyers in 2009).
Requirement on marine environmental protection will
cost.
Younger fleet age could reduce the total volume of marine equipment and spare parts environmental protection will
bring demand to marine equipment supply.
equipment and spare parts supply.
30
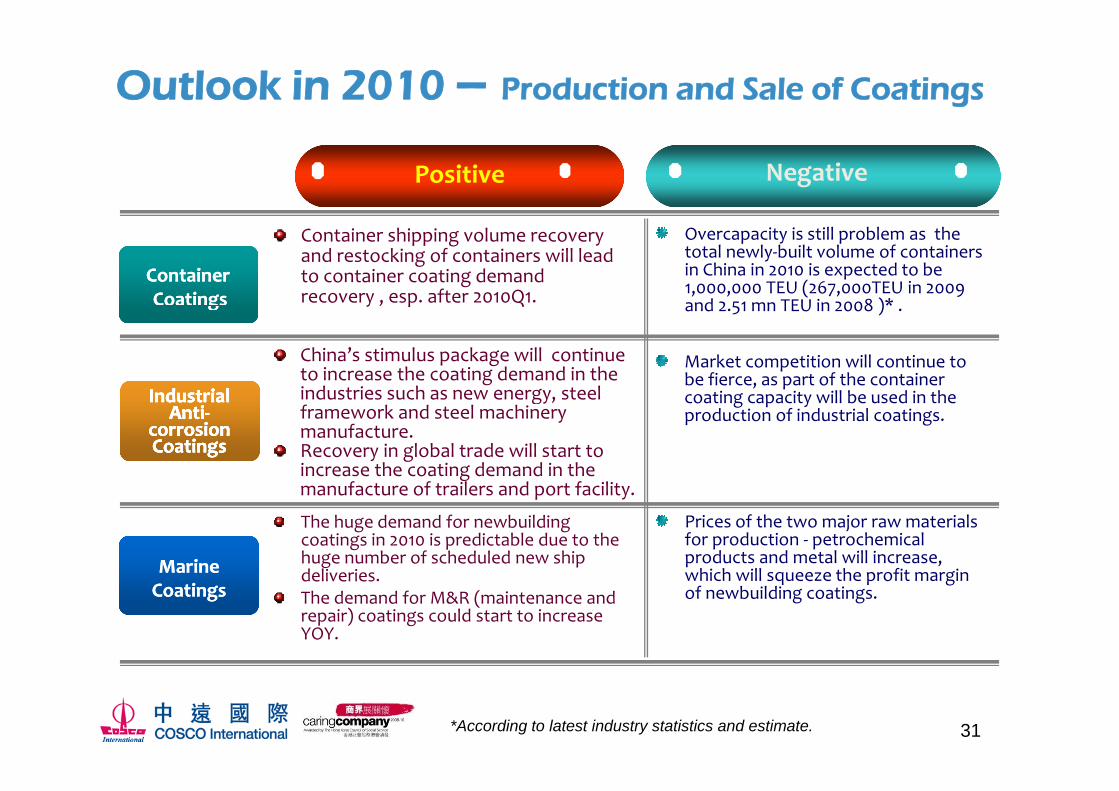
Outlook in 2010 – Production and Sale of Coatings
Positive Negative
ContainerContainerCoatingsCoatings
Container shipping volume recovery and restocking of containers will lead to container coating demand recovery , esp. after 2010Q1.
Overcapacity is still problem as the total newly‐built volume of containers in China in 2010 is expected to be 1,000,000 TEU (267,000TEU in 2009 and 2 51 mn TEU in 2008 )*
Industrial Industrial Industrial Industrial
gg y , p Q and 2.51 mn TEU in 2008 ) .
China’s stimulus package will continue to increase the coating demand in the industries such as new energy steel
Market competition will continue to be fierce, as part of the container coating capacity will be used in the Industrial Industrial
AntiAnti‐‐corrosion corrosion CoatingsCoatings
Industrial Industrial AntiAnti‐‐
corrosion corrosion CoatingsCoatings
industries such as new energy, steel framework and steel machinery manufacture.Recovery in global trade will start to increase the coating demand in the
f t f t il d t f ilit
coating capacity will be used in the production of industrial coatings.
Marine Marine
manufacture of trailers and port facility.
The huge demand for newbuilding coatings in 2010 is predictable due to the huge number of scheduled new ship deliveries
Prices of the two major raw materials for production ‐ petrochemicalproducts and metal will increase, which will squeeze the profit margin
CoatingsCoatingsdeliveries.The demand for M&R (maintenance and repair) coatings could start to increase YOY.
which will squeeze the profit margin of newbuilding coatings.
31*According to latest industry statistics and estimate.
Strategies in 2010
Actively seek development opportunities including newinvestment or M&A in core businessinvestment or M&A in core business
Explore new value‐added services to increase profit driversl g l h ialong value chain
Maintain close relationship with key customers and be well‐prepared to capture market recovery
Increase customer base by targeting new Chinese investorsin shipping
Expand service network for better geographical presenceg g
Increase synergies between different business units
32
Thank you!IR Team ContactMs. Yang Ling Mr. Wilson LoTel: 852 2809 7810 Tel: 852 2809 7800E il l@ i tl E il l @ i tlEmail: [email protected] Email: [email protected]
33
Corporate ProfileCorporate ProfileAppendixAppendix
Corporate ProfileCorporate ProfileHistorical Segment Results Historical Segment Results
(Shipping Services)(Shipping Services)(Shipping Services)(Shipping Services)
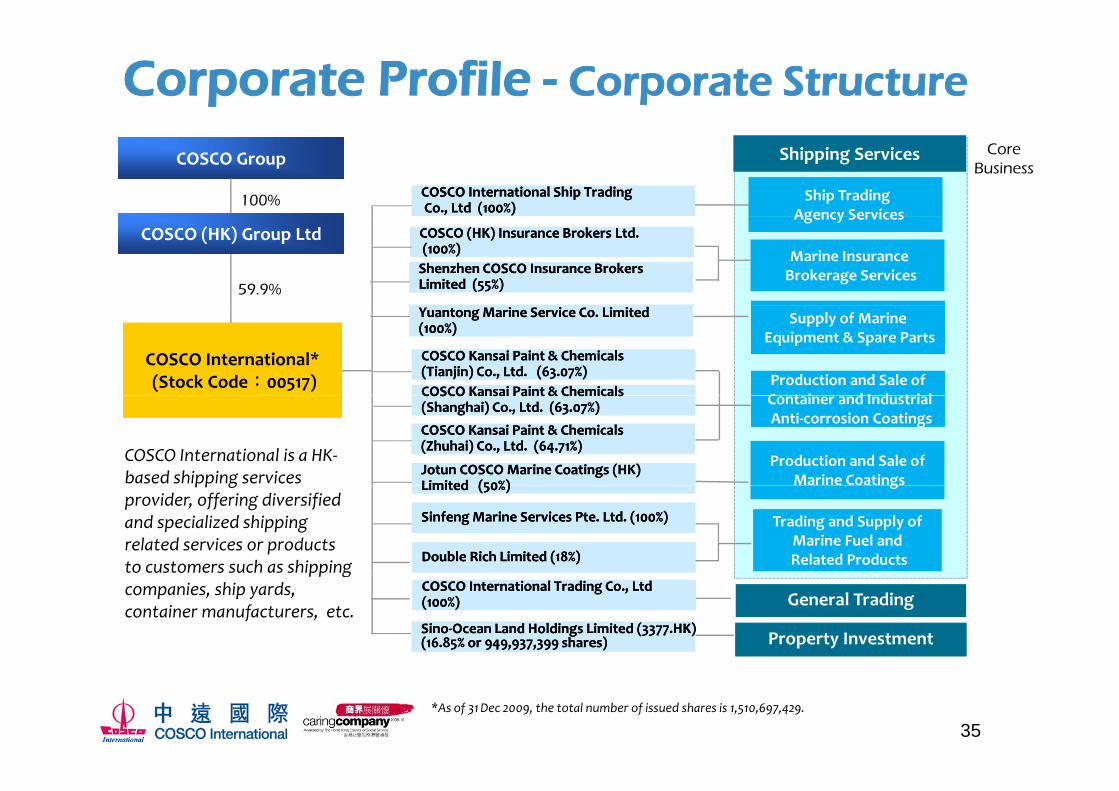
Corporate Profile - Corporate Structure
COSCO GroupCOSCO Group
100%
CoreBusiness
Shipping Services
COSCO International Ship TradingCOSCO International Ship TradingCo., Ltd (100%)Co., Ltd (100%)
Ship TradingAgency Services
59.9%
COSCO (HK) Group LtdCOSCO (HK) Group Ltd COSCO (HK) Insurance Brokers Ltd.COSCO (HK) Insurance Brokers Ltd.(100%)(100%)Shenzhen COSCO Insurance Brokers Shenzhen COSCO Insurance Brokers Limited (55%)Limited (55%)
Marine InsuranceBrokerage Services
Agency Services
COSCO International*(Stock Code:00517)COSCO International*(Stock Code:00517)
Supply of Marine Equipment & Spare Parts
YuantongYuantongMarine Service Co. Limited Marine Service Co. Limited (100%) (100%)
COSCO Kansai Paint & Chemicals COSCO Kansai Paint & Chemicals (Tianjin) Co., Ltd. (63.07%)(Tianjin) Co., Ltd. (63.07%)COSCO Kansai Paint & Chemicals COSCO Kansai Paint & Chemicals
Production and Sale of C t i d I d t i l
COSCO International is a HK‐based shipping services
COSCO Kansai Paint & Chemicals COSCO Kansai Paint & Chemicals (Shanghai) Co., Ltd. (63.07%)(Shanghai) Co., Ltd. (63.07%)
JotunJotun COSCO Marine Coatings (HK) COSCO Marine Coatings (HK) Limited Limited (50%)(50%)
COSCO Kansai Paint & Chemicals COSCO Kansai Paint & Chemicals ((ZhuhaiZhuhai) Co., Ltd. (64.71%)) Co., Ltd. (64.71%)
Production and Sale of Marine Coatings
Container and IndustrialAnti‐corrosion Coatings
pp gprovider, offering diversified and specialized shipping related services or products to customers such as shipping
Limited Limited (50%)(50%)
SinfengSinfengMarine Services Marine Services Pte.Pte. Ltd. (100Ltd. (100%%) )
g
Double Rich Limited (18Double Rich Limited (18%%) )
Trading and Supply of Marine Fuel and Related Productspp g
companies, ship yards, container manufacturers, etc.
Property Investment
COSCO International Trading Co., Ltd COSCO International Trading Co., Ltd ((100100%)%)
SinoSino‐‐Ocean Land Holdings LimitedOcean Land Holdings Limited (3377.HK)(3377.HK)(16.85% or 949,937,399 shares)(16.85% or 949,937,399 shares)
General Trading
35*As of 31Dec 2009, the total number of issued shares is 1,510,697,429.
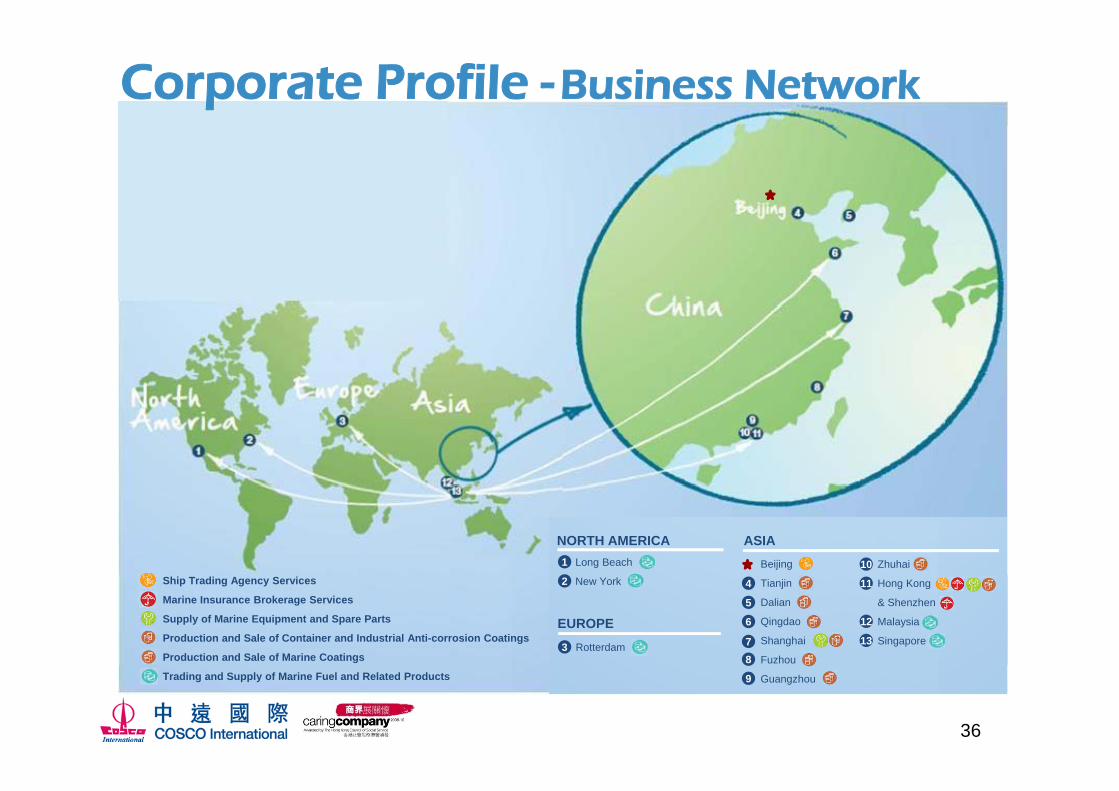
Corporate Profile - Business Network
Long Beach Beijing Zhuhai 1 10
NORTH AMERICA ASIA
Ship Trading Agency Services
Marine Insurance Brokerage Services
Supply of Marine Equipment and Spare Parts
Production and Sale of Container and Industrial Anti-corrosion Coatings
Production and Sale of Marine Coatings
New York
Rotterdam
Tianjin
Dalian
Qingdao
Shanghai
Fuzhou
Hong Kong
& Shenzhen
Malaysia
Singapore
2
3
4
5
6
78
11
12
13EUROPE
36
Trading and Supply of Marine Fuel and Related Products Guangzhou 9
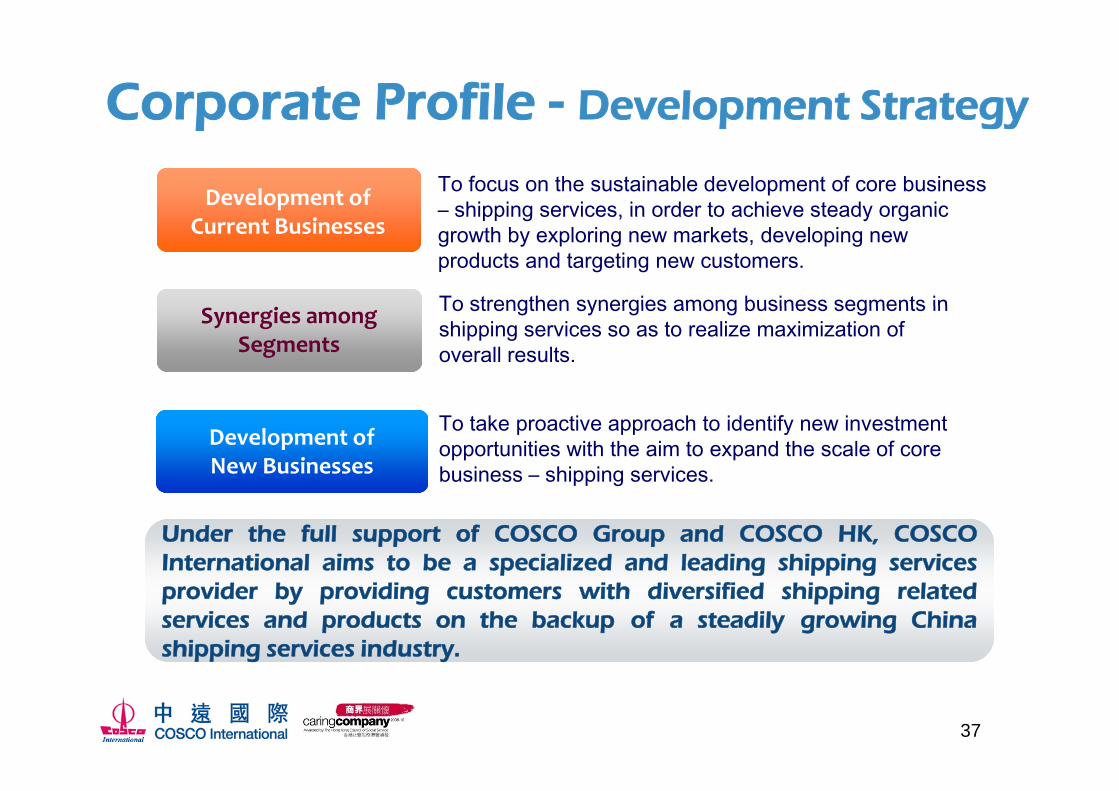
Corporate Profile - Development Strategy
Development of To focus on the sustainable development of core business – shipping services, in order to achieve steady organic
p p gy
Current Businessesshipping services, in order to achieve steady organic
growth by exploring new markets, developing new products and targeting new customers.
To strengthen synergies among business segments inSynergies among Segments
To strengthen synergies among business segments in shipping services so as to realize maximization of overall results.
Development ofNew Businesses
To take proactive approach to identify new investment opportunities with the aim to expand the scale of core business – shipping services.pp g
Under the full support of COSCO Group and COSCO HK, COSCOInternational aims to be a specialized and leading shipping servicesp g pp gprovider by providing customers with diversified shipping relatedservices and products on the backup of a steadily growing Chinashipping services industry.
37
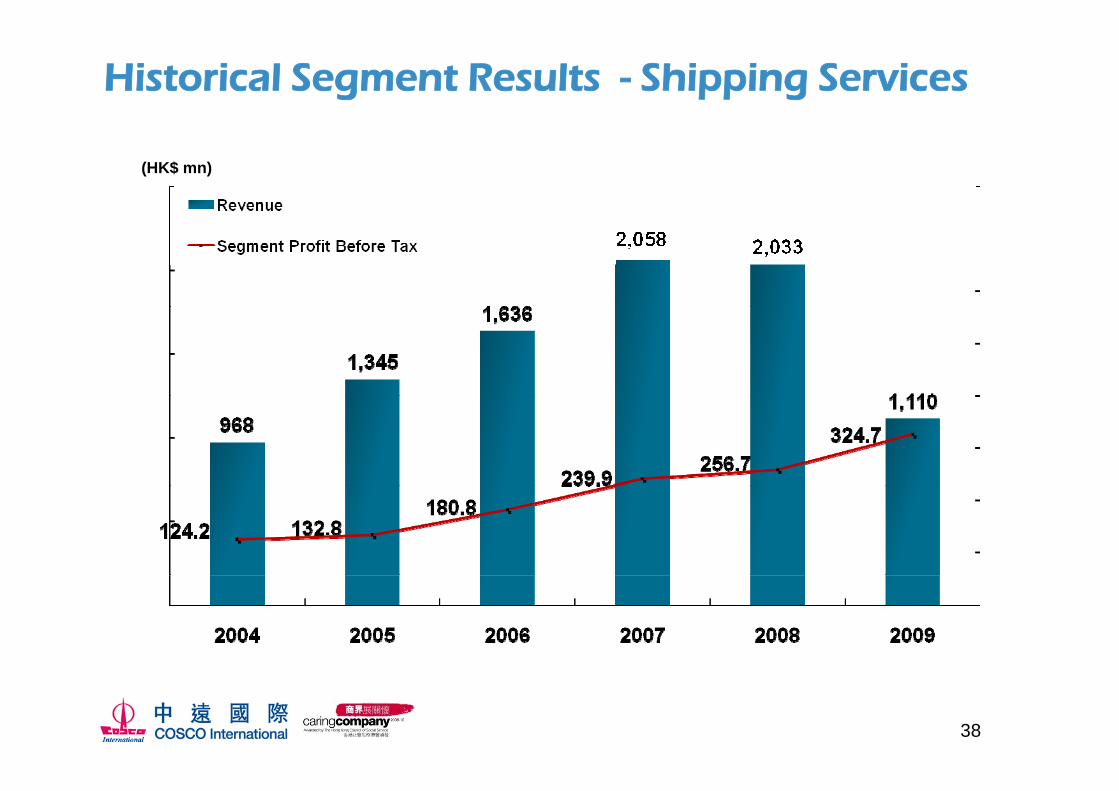
Historical Segment Results - Shipping Services
(HK$ mn)
38
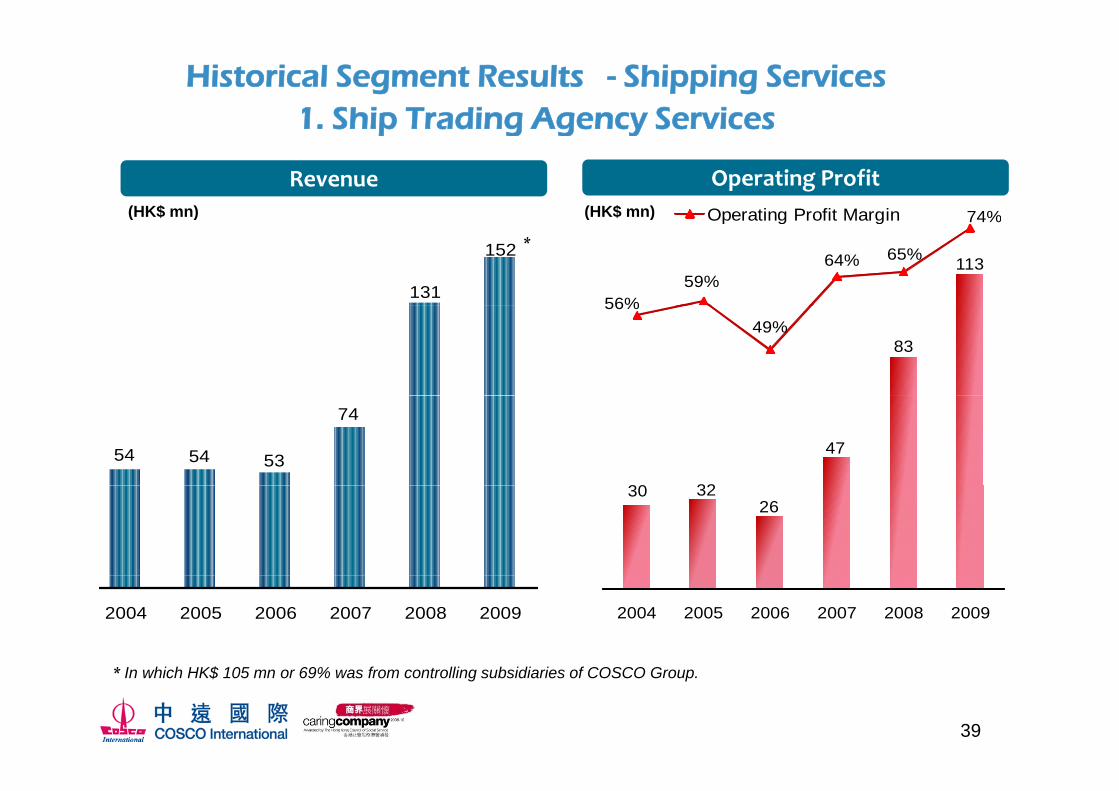
Historical Segment Results - Shipping Services 1. Ship Trading Agency Services1. Ship Trading Agency Services
(HK$ mn) (HK$ mn)
Revenue Operating Profit
74%Operating Profit Margin
131
152
(HK$ mn)
*
(HK$ mn)
113
56%59%
64% 65%
74%Operating Profit Margin
83
56%49%
54 54 53
74
32
47
30 3226
30
2004 2005 2006 2007 2008 2009 2004 2005 2006 2007 2008 2009
39
* In which HK$ 105 mn or 69% was from controlling subsidiaries of COSCO Group.
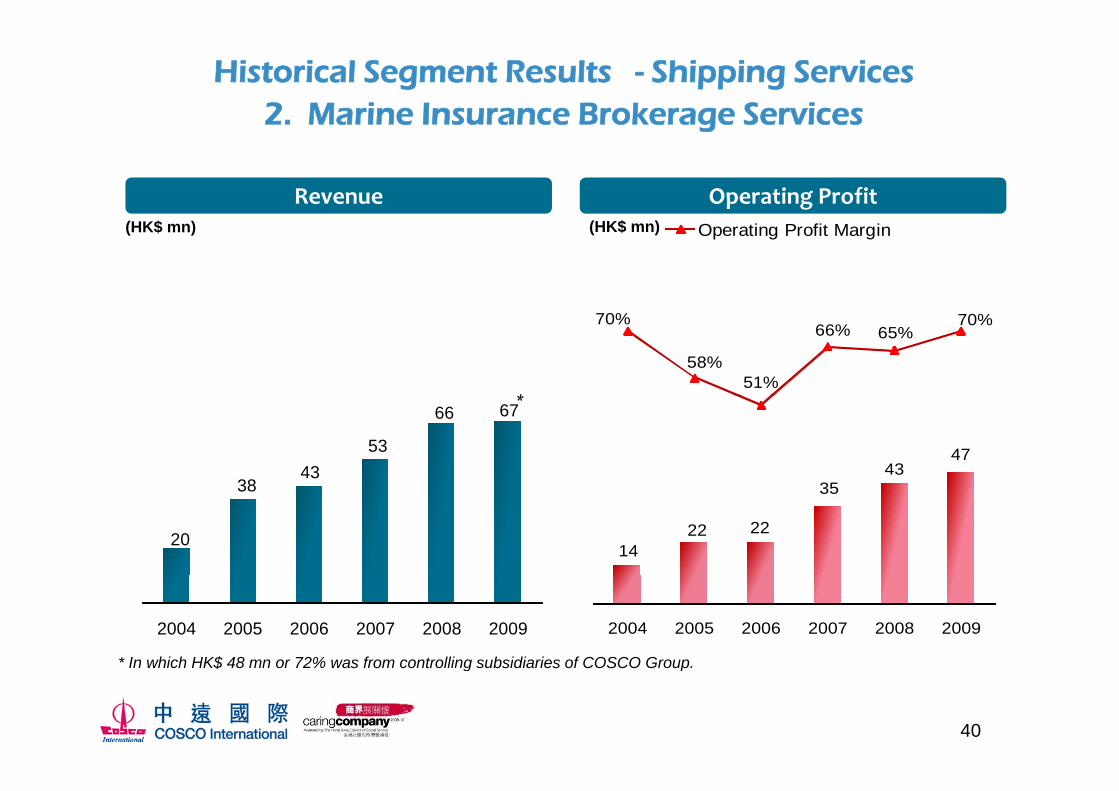
Historical Segment Results - Shipping Services 2. Marine Insurance Brokerage Servicesg
Revenue Operating Profit(HK$ mn) (HK$ mn) Operating Profit Margin
*
70%
58%51%
66% 65%70%
3843
53
66 67*
3543
47
20
38
22 22
35
14
2004 2005 2006 2007 2008 2009
* In which HK$ 48 mn or 72% was from controlling subsidiaries of COSCO Group
2004 2005 2006 2007 2008 2009
40
In which HK$ 48 mn or 72% was from controlling subsidiaries of COSCO Group.
Historical Segment Results – Shipping Services 3. Supply of Marine Equipment and Spare Parts
(HK$ mn) (HK$ mn)
Revenue Operating Profit
Operating Profit Margin
350 351
455 445( $ )
* ( $ )
9%8%
312351
3122
28 21
33
7%
5%
7%
22 21
2004 2005 2006 2007 2008 20092004 2005 2006 2007 2008 2009
* In which HK$ 306 mn or 69% was from controlling subsidiaries of COSCO Group.
41

Historical Segment Results – Shipping Services 4. Production & Sale of Coatings (1) Container Coatings &
Industrial Anti-corrosion Coatings*
Revenue Operating Profit
1 228
1,580
1,381
(HK$ mn) (HK$ mn)Operating Profit Margin
894 903
1,228 9%8%
7%
400**
98 103
6780
5%5%
3%400 42
13
* By COSCO Kansai Companies (63.07%-64.71% owned subsidiaries).** In which HK$ 48 mn or 12% was from controlling subsidiaries and associated companies of COSCO Group.
2004 2005 2006 2007 2008 2009 2004 2005 2006 2007 2008 2009
42
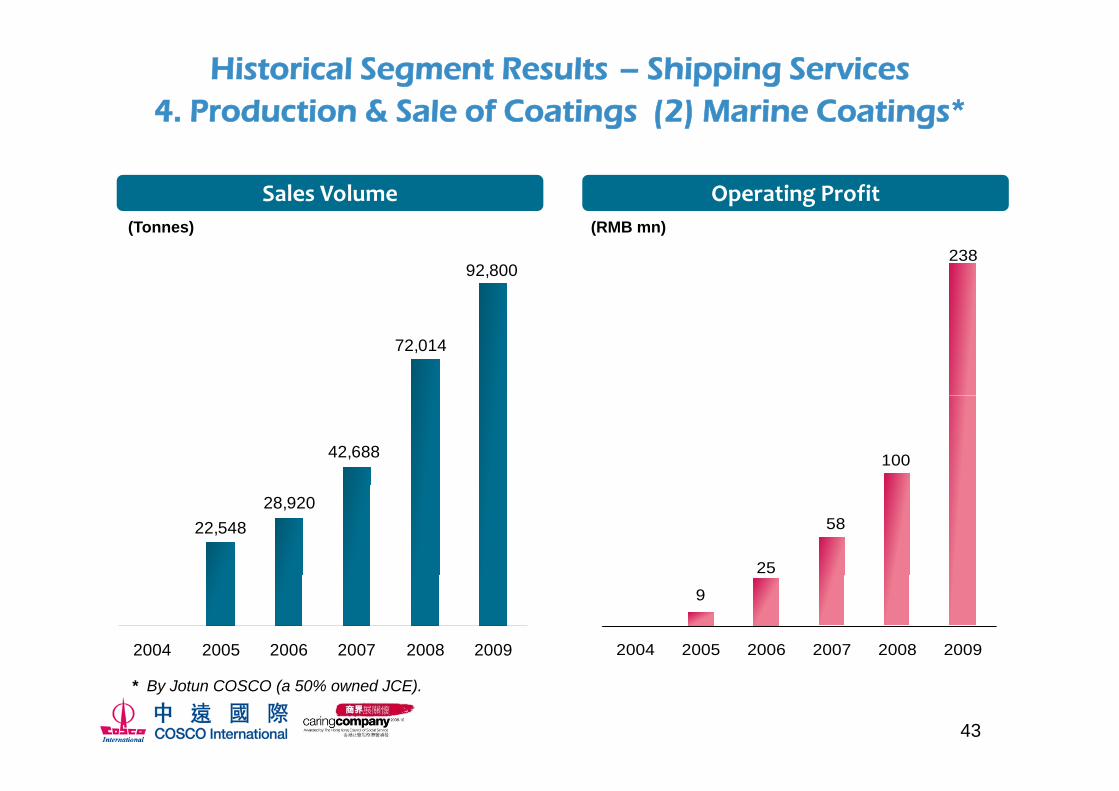
Historical Segment Results – Shipping Services 4. Production & Sale of Coatings (2) Marine Coatings*g ( ) g
Sales Volume Operating Profit
23892,800
(Tonnes) (RMB mn)
72,014
10042,688
25
58 22,54828,920
9
2004 2005 2006 2007 2008 20092004 2005 2006 2007 2008 2009
43
* By Jotun COSCO (a 50% owned JCE).
Disclaimer
This presentation contains certain forward‐looking statements with respect to thefinancial condition, results of operations and business of COSCO International and, pcertain plans and prospects of the management of COSCO International.
Such forward‐looking statements involve known and unknown risks, uncertaintiesand other factors which may cause the actual result or performance of COSCOInternational to be materially different from any future results or performanceexpressed or implied by such forward looking statements. Such forward‐ lookingstatements are based on numerous assumptions regarding COSCO International’spresent and future business strategies and the political and economic environmentin which COSCO International will operate in the future.
The representations, analysis and advice made by COSCO International in thispresentation shall not be construed as recommendations for buying or sellingshares of COSCO International COSCO International shall not be responsible forshares of COSCO International. COSCO International shall not be responsible forany action or non‐action made according to the contents of this presentation.
44