corruption and its implications for the economic...
TRANSCRIPT
1
CORRUPTION AND ITS IMPLICATIONS FOR THE ECONOMIC DEVELOPMENT OF THE MERCOSUR
NATIONS: AN ECONOMETRIC APPROACH
Submitted by
Tariq Spalding Raza Northwestern University
Mathematical Methods in the Social Sciences Senior Thesis
Advisor: Professor Mark Witte May 2005
2
ABSTRACT
This thesis conducts an in-depth examination of corruption in the Mercosur nations and its implications for economic development by using an econometric approach. This type of investigation combines relevant aspects of mathematics, economics, and statistics to develop an econometric model explaining the impact of corruption on the economic development of the four Mercosur nations - Brazil, Argentina, Uruguay, and Paraguay. This field of investigation regarding the impact of corruption on economic development has only recently attracted a significant amount of academic and investigational interest due to the recently developed methodologies for measuring corruption. The output of such research has important implications for policy formation at national and international levels, as well as for multinational firms operating in environments where corruption often influences governmental and business relations. This study focuses on the impact of corruption in the Mercosur nations. Due to the many variables that can influence the level of corruption in a nation and its impact on the economy, the study develops a microeconomic model that investigates the impact of corruption on individual firms. This research yields an econometric model that demonstrates the impact of corruption on the growth rate of firms operating in an environment characterized by different levels of corruption. We take up the computer industry for the purpose of this study and investigate the different sectors of this industry into more detail. To understand the phenomenon further and analyze the results obtained from the econometric model in greater detail, we conducted survey questionnaires and structured interviews to determine the responses and perceptions of firms and managerial agents in the Mercosur nations to corrupt practices among bureaucrats.
3
ACKNOWLEDGMENTS
This thesis was developed under the guidance of several professors who have provided invaluable commercial and academic contacts to assist in the project. Special gratitude goes to Professor Mark Witte, my advisor for this MMSS senior thesis. His exceptional suggestions and guidance have made this work possible. This research was also made possible due to Northwestern’s financial support, as the University has funded my travel to the Mercosur nations during the summer of 2004 and Winter Break of 2005. For this I am grateful to both Dean Mary Finn for her kindness in providing my summer research grant, and to Professor Josef Barton and The Undergraduate Research Grants Committee for providing me a year research grant for this project. I am also indebted to Professor Rosa Matzkin who has provided research contacts at the Universidad de San Andrés and Universidad Torcuato di Tella, both in Argentina. Through Professor Matzkin, I have established contact with Professor Ernesto Schargrodsky, a noted expert in corruption. Professor Schargrodsky specializes in the collection of data on corruption through survey questionnaires and interviews; his excellent suggestions on the methodology of this thesis and his thoughtful suggestions on the design of the survey questionnaire and structured interviews’ questions were extremely important for the accuracy of the results and for the high rate of response from the surveys’ respondents. Also, I would like to express my gratitude to all the professors in the MMSS program, and in particular to Professor William Rogerson for giving me the opportunity to participate in this rewarding program.
I dedicate this work to the memory of my mom, Yula, who was a great woman. Her assistance continuously strengthened my confidence in my abilities and desire for knowledge through the infinite process of learning. Also, special thanks are owed to my family, in particular my dad, Raza, my grandma, Tita, my brother, Zafar, and close friends, Geert and Olga Van Koeverden, Ibrahim, Zebeda, and Faruk Kanamia, whose continuous support was essential for the completion of both this thesis and my studies at Northwestern. This work could not have been completed without the support of many other people from Brazil, Paraguay, Uruguay, and Argentina. Too numerous to specifically list here, they range from professors who provided important guidance and critique of the methodology to managers from firms in various industry sectors whose willingness and patience to answer the survey questionnaires and structured interview questions were essential.
4
TABLE OF CONTENTS
Abstract ........................................................................................................................... 2 List of Tables and Figures ........................................................................................ 6 Chapter 1: Introduction ............................................................................................ 8
1.1 Introduction .......................................................................................................... 8 1.2 Structure of the Thesis ..................................................................................... 10
Chapter 2: Literature Review................................................................................ 13
2.1 Corruption and its Impact on Economic Growth ...................................... 13 2.2 Corruption Indices ............................................................................................ 18 2.3 Research Gap: Statement of the Problem ................................................... 23
Chapter 3: Framework for the Study ................................................................. 25
3.1 Research Questions and Research Framework.......................................... 25 3.2 Hypothesis........................................................................................................... 26 3.3 Theoretical Constructs ..................................................................................... 27 3.4 Industry Sector Selection ................................................................................ 32
Chapter 4: Research Design ................................................................................... 35
4.1 Operationalizing Variables for the Test Instruments ............................... 35 4.1.1 Economic Growth of Firms ............................................................................. 36 4.1.2 The Level of Corruption .................................................................................. 37
4.2 Pilot Study........................................................................................................... 42 4.3 Identification of the Sample Population...................................................... 44 4.4 Sample Selection Process and Data Collection ......................................... 46 4.5 Data Analysis Plan............................................................................................ 54
Chapter 5: Data Analysis, Results & Discussion ............................................ 59
5.1 Sample Description........................................................................................... 59 5.2 Reliability of Scale Measures ........................................................................ 60 5.3 Factor Analysis .................................................................................................. 61 5.4 Testing for Heteroscedasticity ....................................................................... 63 5.5 Testing for Endogeneity .................................................................................. 67 5.6 Testing for Spatial Autocorrelation .............................................................. 69 5.7 Hypothesis Testing ........................................................................................... 71
5.7.1 ROI and Level of Corruption........................................................................... 71 5.7.2: The Rent Seeking Behavior and Industry Sectors .......................................... 73
5
5.7.3: Differences in Rent Seeking Behavior across Nations and Rate of Growth of Firms ......................................................................................................................... 77 5.7.4: The Overall Model.......................................................................................... 79
5.8 Analysis of Structured Interviews................................................................. 82 5.8.1 Sample Description.......................................................................................... 82 5.8.2 Competitive Disadvantage Because of Rent Seeking Behavior of Bureaucrats................................................................................................................................... 83 5.8.3 Corruption Level in Computer Industry .......................................................... 84 5.8.4 Changes in Corruption Level ........................................................................... 84 5.8.5 Analysis of Open Ended Questions ................................................................. 86
5.9 Discussion ........................................................................................................... 89 Chapter 6: Implications, Limitations, and Future Research Directions 93
6.1 Contribution and Implications ....................................................................... 93 6.2 Limitations .......................................................................................................... 94 6.3 Future Research Directions ............................................................................ 96 6.4 Conclusion .......................................................................................................... 97
References..................................................................................................................... 99 Appendices
Appendix 1: Transparency International Corruption Perceptions Index (CPI) 2003................................................................................................................ 104 Appendix 2: CPI and EMI Irregular Payments Comparison, Sample Data..................................................................................................................................... 107 Appendix A: Methodology ................................................................................. 108
A.1 Development of Questionnaire ........................................................................ 108 A.2 Interview Data.................................................................................................. 110 A.3 External Data.................................................................................................... 113 A.4 Data Collection Methodology.......................................................................... 113 A.5 Data Collection in the Mercosur Nations......................................................... 114 A.6 Pilot Study Analysis......................................................................................... 115 A.7: Data Collection through the Internet............................................................... 123
Appendix B: Correlations Between all variables ........................................... 128 Appendix C: Questionnaire................................................................................. 129
6
LIST OF TABLES: Table 4.1: Mercosur Nation GDP ..................................................................................... 52
Table 5.1: Distribution of respondents across the nations ................................................ 59
Table 5.2: Distribution of respondents across the seven sectors of computer industry.... 60
Table 5.3 Mean and Standard Deviation of ROI of Firms in Four Mercosur Nations ..... 60
Table 5.4 Mean and Standard Deviation of ROI of Firms in Different Industry Sectors. 60
Table 5.5 Reliability of scale measures ............................................................................ 61
Table 5.6: Inter-item correlations ..................................................................................... 61
Table 5.7: Factor Analysis ................................................................................................ 62
Table 5.8: Test for Heteroscedasticity .............................................................................. 65
Table 5.9: Test for Endogeneity........................................................................................ 68
Table 5.10: Mean Value of Residuals............................................................................... 70
Table 5.11: Regression Analysis of ROI as Dependent Variable and Corruption Level as
Independent Variable ........................................................................................................ 72
Table 5.12: ANOVA with Corruption Level as dependent variable and Industry Sector as
independent variable ......................................................................................................... 74
Table 5.13: Regression with Corruption Level as dependent variable and Industry Sector
as independent variable..................................................................................................... 75
Table 5.14: ANOVA to assess the differences in Rent Seeking Behavior ....................... 77
Table 5.15: Regression with Corruption Level as dependent variable and Country as
independent variable ......................................................................................................... 78
Table 5.16: Overall Model with ROI as dependent variable and Corruption Level,
Country, and Industry Sector as independent variables.................................................... 80
Table 5.17: Distribution of interviewees across the nations ............................................. 82
Table 5.18: Distribution of respondents across the seven sectors of computer industry.. 82
Table A.1: Industry Data................................................................................................. 119
Table A.2: Respondents from the Mercosur Nations...................................................... 119
Table A.3: ROI and Respondents ................................................................................... 119
Table A.4: Correlations between different variables ...................................................... 120
Table A.5: Factor Analysis ............................................................................................. 121
7
Table A.6: Regression Analysis with ROI as dependent variable and Corruption Level as
independent variable ....................................................................................................... 122
Table B.1: Correlation between different variables............................................................... 128
LIST OF FIGURES:
Fig. 1 Research Framework .............................................................................................. 26 Fig. 2: Demand Supply for Rents ..................................................................................... 30
8
Chapter 1
INTRODUCTION
1.1 Introduction
Corruption generally defines a transaction where individuals bound by a
principle-agent agreement take advantage of their position by selling a third-party
property rights that do not belong to them (Colombatto, 2001). In the context of
governmental corruption, the principle-agent agreement is between the government and
the official in the bureaucracy. This bureaucracy is bound by the agreement to conduct a
particular function for the citizens of the nation on behalf of the government. When
bureaucrats use the power of their position to increase or reduce costs for some at the
expense of others, they violate the implicit agreement with the government to render
services fairly and impartially. Thus, the bureaucrat who receives an “inducement” to
perform a service extracts wealth from the payer of the bribe without producing value
equivalent to the extracted wealth.
From an economic perspective, corruption is generally accounted for in the rent-
seeking theory, which was originated with Tulloch (1980). Rent-seeking occurs when a
government, firm, or individual expends resources to bring about an uncompensated
transfer of goods or services from another entity. Although the rent-seeking theory is
primarily concerned with the way that firms or individuals seek changes in public policy
to benefit them at the expense of others, this theory also applies to corrupt practices.
These practices, such as bribery, confer benefits on the corrupt official at the expense of
the firm or individual supporting the corrupt practice. They do so by paying the bribe.
9
Essentially, the corrupt official receives a transfer of wealth with compensation neither to
the firm nor to the individual transferring the wealth.
The rent-seeking approach to corruption does not attempt to assign a moral status
to the act; instead, it views corruption as an economic function that influences the transfer
of goods and services by raising costs and creating artificial market barriers. The
approach also views the action or non-action of the government in permitting the
corruption to flourish as a policy position intended to benefit a small group, such as
bureaucrats who profit from the rent seeking activity.
A market economy generally consists of a system of interactions where
individuals acquire and communicate information about scarcity through a pricing
mechanism that allows for the private determination of the best method to allocate
resources. Market disturbances can occur due to a plethora of factors, governmental
policy and technological changes, that induce price changes. These alterations encourage
individuals to act in a manner that does not fully reflect the way that they would allocate
resources if the disturbance were absent. In this context, bureaucratic corruption operates
as a market disturbance. It induces market participants to act in a manner that fails to
reflect their perception of the most efficient manner to allocate resources. In effect, A
portion of the market price is directed towards a corrupt bureaucrat; as a result, the cost
for all market participants increases and a percentage of the cost is misallocated.
10
Despite the prevalent recognition that corruption has a negative impact on
economic growth, some significant difficulties remain in many nations in rooting out
corruption. These obstacles exist due to the difficulties that individuals and single firms
encounter when attempting to resist corrupt practices in an environment where corruption
is endemic. This is due to strategic complementarities, which are situations where if one
agent engages in either a corrupt or non-corrupt practice, other agents receive incentives
to engage in similar practices. For example, if a bureaucrat operates in an environment
where his peers and superiors are likely to be corrupt, then it is unprofitable for the
bureaucrat to resist engaging in corruption (Mauro, 1995). Such individuals often justify
their corruption as being a form of efficiency.
1.2 Structure of the Thesis
Given this background of corruption, such as the rent-seeking behavior of
bureaucrats, this thesis will investigate the impact of rent-seeking behavior of bureaucrats
on the economic development of the nation. For the investigation, we chose the computer
industry in the four Mercosur nations. We study the seven sectors of this industry:
Software, Computer Manufacturing, Computer Supply, Semiconductor Manufacturing,
Networking or other services, Peripheral Manufacturing, and others. The thesis is laid out
in six chapters. The second chapter provides a review of existing literature. It summarizes
the key findings of research on corruption and its impact on economic development. The
culmination of this chapter is the identified research gap.
The third chapter covers the study’s framework, identification of key variables
and constructs, and the research hypotheses. In this framework, we show the relationships
11
that we are going to study. Identification of key variables and constructs is important to
establish the relationships. Development of research hypotheses is the last part of this
chapter that will help us to perform the appropriate statistical tests and analyze the
results.
Chapter four describes the methodology and provides details on methodology in
terms of sample size, sampling procedure, measuring instruments used, data collection
method, and the data analysis plan. In this chapter, we describe in detail how we chose
the sample size and its minimum requirement. Then, we move onto our sampling
procedure best to suit our requirements and constraints. To measure the variables
identified in the previous chapter, we next developed our measurement instrument.
Continuing the same chapter, we presented our data analysis plan in which we provide
details on statistical tests used for analysis.
The fifth chapter presents the data analysis. We first provide the analysis of
results obtained from the econometric model. We also show our further investigation and
support/reject our findings from the earlier part by the outcome of analysis of structured
interviews conducted for the said purpose. At the end of this chapter, we discuss our
results and generate insights.
The final chapter deals with the contribution and implications where we discuss
interesting insights generated as the output of this research and implications for
12
academicians and practitioners, including policy makers. Finally, in this chapter we
discuss limitations of this research and directions for future research to enhance the field.
13
Chapter 2
LITERATURE REVIEW
This chapter is broadly divided into three sections. In the first, we take up
literature on corruption and its impact on the economic growth. In second section, we
look at measurement of corruption and related problems. The last section deals with
summarizing the literature and identification of the research gap.
2.1 Corruption and its Impact on Economic Growth
The review of related literature provided an overview of the research regarding
corruption and its impact on economic growth. In the most part, the available research on
the issue of corruption has generally adopted a macroeconomic approach, examining
corruption in terms of GDP, its impact on foreign direct investment, and its affect on the
allocation of resources on a national level. In addition, the literature can be broadly
grouped into quantitative and qualitative analysis of the impact of corruption. The
primary issue involved with the quantitative research approaches has been the means
used to operationalize the somewhat subjective variable of corruption. The qualitative
studies focused on identifying and raising the issues. Thus, based on the review of related
literature, theoretical frameworks and models are proposed.
Extensive literature examined corruption from the perspective of rent-seeking
behavior, which is the opportunity for an individual or a group to obtain income that
exceeds the income normally available in a perfectly competitive market. Kahn and Jomo
(2000) examined the impact of government-created rents on the development of Asian
14
economies; this differs from rents due to corruption because the government officially or
unofficially sanctions the rent. The impact of official government rent and the unofficial
rents due to corruption on economic growth is variable, as some types of rents are not
invariably harmful to the economy. Hutchcroft (1997) supports this argument; the study
found no simple or direct correlation between corruption and the economic growth of a
developing country. The way that privileges and rents are distributed in the economy
form four independent variables that determine the corruptive impact on the dependent
variable of economic growth. In situations where corruption does not prevent
development, the economy could grow despite the corrupt environment.
Antwi and Adams (2003) found that when a governmental agency diverts
resources from outside sources intended for urban renewal projects through high salaries
and privileges for administrators, very few funds reach their intended use. This model
corresponds with that of Hutchcroft’s model by establishing conditions where corruption
impedes economic development. Mbaku (1999) concluded that political and institutional
structures in African nations foster rent-seeking behavior by placing a large number of
restrictions on ordinary economic activities. A complex regulatory system creates a
strong tendency for bureaucrats to take advantage of their positions by seeking gratuities
for performing routine services; this leads to endemic and institutionalized corruption.
Colombatto (2004) examined corruption as a breach of contract between a
principal and an agent; the ethics of the corruption is contingent on the underlying terms
of the contract. In the context of government, the bureaucrat is bound by the implied
15
contract associated with the position and breaches the contract through the sale of
administrative functions that should be freely granted.
Corruption in the private sphere is self-limiting, because competitive forces
eventually force the corrupt practices to end. Corruption in the public sphere, however, is
subject only to the structural limitations placed on governmental activities.
Easterly’s assessment indicated corruption’s effect on economic growth varies
both in different countries and within a nation over time, as variable factors determine the
impact (Easterly, 2001). The two decentralized and centralized models of corruption
suggest that the way in which corrupt institutions operate in a society is a strong factor
for determining corruption’s economic impact. In the decentralized model, the impact of
corruption on economic growth appears to be more focused and reduces the overall level
of incentives for individuals to engage in economic activity. This accounts for some of
the differences in the impact of corruption among various nations.
Research of Fisman and Gatti (2004) appears to support Easterly’s position. Their
research suggests that decentralized governments are more corrupt because spending
decisions are made at the local level, with less oversight of local officials by the central
government. De Soto contends that when a government imposes excessive regulations, it
reduces the rate of economic growth by raising the costs associated with business (De
Soto, 2002). This creates a widespread disincentive for firms to engage in business, and
economic growth reduces.
16
Dixit’s position suggests that some degree of corruption is inevitable in all
economic systems due to the system’s size (Dixit, 2003). In this model, self-enforced
honesty functions only in small economic systems where there are penalties in the form
of loss of trading relationships as the price for dishonesty. As the economic system
expands in size, only structural factors such as oversight of bureaucratic operations can
reduce the general propensity towards dishonesty. In nations lacking institutions
necessary to replace self-governance of honesty with oversight, corruption will likelier be
a significant factor in economic activity. To some degree, this position conforms to that
of McCarthy and Hagan (2001); they argue that corruption arises from a misapplied
investment in human capital. Once a corrupt system is in place within an economy, it
tends to provide an ongoing investment in criminal social capital. From this perspective,
the system encourages individuals to be corrupt and trains them in the techniques
necessary for successful use of corrupt practices. As such, the society becomes immune
to the judgments of corruption, with the practices accepted as the norm.
Mauro (1995) conducted one of the early empirical investigations of corruption
and economic growth in nations by using the Business International measure of
corruption, which has subsequently been incorporated into the Economist Intelligence
Unit (Coalition Report, 2000). Due to the high potential of variables impacting economic
growth, other than corruption, the study also incorporated nine other measures of the
macroeconomic environment, including political and labor stability. A correlation
between corruption and low economic growth exists. A difficulty with this study,
however, was the methodology used to quantify the variables that determined the
17
outcome. Because it depended on the quantification of variables through the surveys
conducted by Business International, the process was not identical for all countries.
Business International used various data sources and methods for each nation to
determine the level of corruption and other factors such as the amount of red tape and the
transparency of government operations. Nonetheless, the study represents a reasonable
effort to quantify and operationalize macroeconomic variables prior to the development
of more definitive and concise methods of examining corruption and its effect on an
economy. An important finding is that a more homogenous society is less likely to
experience corruption; it will instead have a more efficient bureaucracy than a society
characterized by many ethnic and linguistic groups.
Mauro based a qualitative assessment of how corruption affects the economy on
the findings of his empirical research (Coalition Report, 2000). Corruption is more likely
to occur when the government creates barriers to economic activity that can produce
excessive profits such as market entry barriers. Individuals collecting the high profits are
willing to protect their position by bribing government officials. Corruption will likely
occur when bureaucrats are poorly paid and thus become corrupt to maintain an adequate
standard of living. The payments made to corrupt officials operate as an indirect tax,
which reduces incentives to engage in economic activity and reduces profitability. This
raises the transaction costs and encourages a lower investment rate due to the lower levels
of return. It further distorts the revenues available to the government; this reduces the
ability of the government to engage in development and infrastructure enhancement.
18
Rosenberg (2003) provided qualitative discussion of the factors contributing to a
corrupt environment and suggests that the debate on corruption is focusing on the best
methods to reduce or eliminate corruption rather than on corruption’s causes. Corruption
is endemic and can be found in all nations. Larger governments, however, tend to be less
corrupt, for they have more resources at their disposal and a greater ability to oversee the
bureaucrats’ activities.
A potential proxy for corruption is the type of investor protection statutes in a
nation and the degree that they are enforced (La Porta et al, 1998). The general outcome
of weak protections for investors is to marginalize the small investor; the ownership of
public corporations is concentrated in the hands of a few politically well-connected
individuals who can obtain protections from the legal system. Of the Mercosur nations,
only Brazil had relatively good protections for investors, which suggests that the
ownership of corporations in the other three Mercosur nations is concentrated in the
hands of a relatively few individuals. This creates an incentive for these individuals to
protect their position through corrupt practices and a disincentive for the marginal
investor to seek ownership in public corporations. A relatively low level of enforcement
of investor protection laws exist in the Mercosur nations, thus reducing the amount of
foreign direct investment occurring in these nations.
2.2 Corruption Indices
Empirical research into corruption highly depends on the measure used to
quantify a nation’s corruption. Such quantification is necessary for establishing the value
19
of the key independent variable of the study, which is the level of corruption in a specific
environment. Corruption, however, is a generic term that describes a collection of
variables, which are identified as corrupt practices. As a result, there can be some degree
of difference in the various methods used to measure corruption that have been developed
from the types of variables included as the foundational data for the measure.
Additionally, there are differences in how data is collected and weighted to form the
measure. To a large degree, the differences in the way the measure of corruption is
constructed can impact a replication of the findings of a study due to the potential for
substantially different values assigned to the independent variable of corruption.
The only existing global index for the measurement of corruption that provides
comprehensive data in a unified manner is the index developed by Transparency
International. Formed in 1993, the organization’s objective is to reduce global corruption
by publicizing corrupt practices. In 1997, the organization began publishing the
Corruption Perceptions Index (CPI), which ranks countries according to the degree that
business, outside observers, public officials, and politicians perceive corruption. The CPI
is based on a survey of senior managers in a large number of nations; it solicits
information such as the frequency of bribery, the perception of corruption in civil service,
and the amount of red tape encountered in dealing with the bureaucracy. The CPI is a
composite index, as it makes use of both the survey data and the assessments of countries
by independent analysts (Lambsdorff, 2002). It also uses additional different sources such
as the World Bank business Environment Survey and Economic Intelligence Unit Data.
A deficiency in the methodology for the development of the index is variability in the
20
nature of the composite sources in successive years, which undermines comparability. In
addition, the number of sources used in the composite index for each country is variable
(See Appendix 1). Despite its shortcomings, however, the CPI is currently the best tool
available to measure corruption.
The black market activity index, which is a sub-index of Economic Freedom
Index (EFI), can also potentially be used to measure corruption. The EFI includes a
component that determines the level of “irregular payments” occurring in a nation’s
economy on a scale of 0-10, with 10 representing a high level of irregular payments. This
component of the EFI functionally measures the level of black market activity present in
an economy; this activity acts as a proxy measure for corruption. The irregular payments
component of the EFI, however, is not available for all nations. The only source for the
irregular payments data is the Global Competitiveness Report by the World Economic
Forum (2003 Annual, 12).
Researchers examining corruption have also used proxy measures for corruption
drawn from the indices prepared by the Economic Intelligence Unit (EIU). This private
firm sells business and economic information. The EIU makes indices on 56 risk factors
available on various nations and creates a composite score for the overall risk represented
by the country. In addition, the risk factors include a number of specific risks such as
political stability and risk of terrorism. One of the risk factors measured is corruption,
which is based on the analysts’ perception of the level of corruption in the nation. All risk
factors including corruption are rated on a scale of 0-10. Some of the additional risk
21
factors such as the efficiency of the legal system have also been used as proxy measures
for corruption.
A regional corruption index to monitor the nations of Eastern Europe that is
known as the Corruption Monitoring System (CMS) has been developed (Coalition
Report, 2000). The development of this index uses a similar methodology to the CPI in
that it heavily relies on surveys conducted among managers in both the target nations and
independent analyst opinions. The output of the index, however, is significantly different
from the output of the CPI; it ranks each nation in specific areas of corrupt practices
rather than giving an overall ranking for the nation. In effect, this index is actually four
separate indices that measure attitudes towards corruption, the prevalence of corrupt
practices, and an assessment of the scope of corruption and corruption-related
expectations. Each nation in the region is assigned a score from one to ten in each of the
four major index areas, but the rankings of the nations, with respect to each other as well
as an overall ranking, is not given (Coalition Report, 2000). This difference in output
between the CPI and the CMS makes it difficult to compare the two systems in a
meaningful manner.
Due to the substantial differences in the way corruption information is gathered
and quantified in the various measures or indices of corruption, an analysis of the
deviation occurring between measurements is difficult. The CPI is the only index that
presents corruption information in a coherent and unified manner. The EIU data on
corruption is embedded in reports regarding the risk factors in various countries; it does
22
not provide relative rankings of the nations. As a result, the data must be extracted from
the reports manually. In addition, it is not presented in a format that provides for
comparability. Similarly, the CMS does not provide unified data that enables a precise
comparison with the EPI.
In general, corruption research increasingly relies on the use of the CPI as the
primary measurement for corruption’s existence in a specific nation. The use of
researcher-developed measures for corruption raises the issue of comparability and
replication of the study findings when another type of measurement system is used.
While the EIU was often used as a basis for obtaining standardized measures of past
corruption, the development of the CPI has functionally reduced the inherent difficulties
with the EIU’s scattered presentation of corruption data. This is apparent from the
complex method that Mauro used in his 1995 study of corruption, which relied on the
EIU as the primary source of information to quantify corruption (Mauro, 1995). As a
result, the CPI represents the most precise measurement of corruption in the present; its
use supports the ability of other researchers to replicate the findings of a study.
Wilhelm (2002) conducted a study to validate the CPI as an appropriate measure
of corruption, which is a research area not yet examined. This study attempted to
determine whether there was correlation between the CPI and two EFI sub-indices of
irregular payments, which was a proxy for black market activity, and unnecessary
restrictions on business activity. The findings of the study indicated a significant
correlation between the three measures. In addition, the study determined that there was a

23
highly significant correlation between the CPI and real domestic gross product per capita.
This finding further suggests that the CPI is the most valid measure for corruption that is
currently available.
2.3 Research Gap: Statement of the Problem
The above literature review on corruption and its impact on economic growth
suggests that the research focuses mostly on how corruption affects economic growth at
the macroeconomic level. None of the studies reviewed looked at the impact of
corruption at the microeconomic level. The research studies took up different regions of
the world such as Africa and Asia; however, we found no study covering the Mercosur
nations.
In the Mercosur nations, the relatively high levels of corruption can adversely
affect the growth rate of individual firms, as the GDP growth encounters a negative
impact. Due to the rent-seeking behavior of bureaucrats, most of whom seek to maximize
the size of their wealth, firms involved in highly regulated industry sectors with good
prospects for future growth are more likely to have to pay a higher bribe to officials than
firms in non-regulated industry sectors with poor prospects for future growth.
Additionally, similarly situated firms in Mercosur nations with higher CPI’s, such as
Paraguay and Argentina, are more likely to pay higher levels of bribes than firms in
nations with lower CPI such as Uruguay and Brazil. The problem lies in developing an
appropriate measure for dishonesty suitable for use on a microeconomic scale to
determine if this corruption would affect individual firms’ growth rates.
24
We also highlighted the difficulties in measuring the corruption. The research
lacks a generic approach to measure the corruption. The field is void of reliable and valid
scales to operationalize the corruption as a construct. With this, we set forth for the
research and try to fill the identified gaps. The next section deals with research questions,
the framework for the study, and the hypotheses.
25
Chapter 3
FRAMEWORK FOR THE STUDY
3.1 Research Questions and Research Framework
The following points emerged out of the literature review.
I. The impact of corruption is well researched in the literature; however, all the
studies are focused at the macroeconomic level. None of the studies reviewed
looked at the impact of corruption on economic growth at the microeconomic
level, such as the firm level.
II. We found studies covering different regions of the world, but none covering the
impact of corruption on the economic growth of the Mercosur nations.
III. We also highlighted the shortcomings of different indices of corruption. During
the literature review, we learned that the field is void of reliable and valid scales
to measure the corruption.
This study was designed to answer the following research questions:
1. Does the rent-seeking behavior of bureaucrats have a negative impact on
the growth rate of firms?
2. Are there differences in the perceptions of rent-seeking behavior of
bureaucrats among firms in Mercosur nations in different industry sectors?
26
Country
Industry
Level of Corruption
ROI
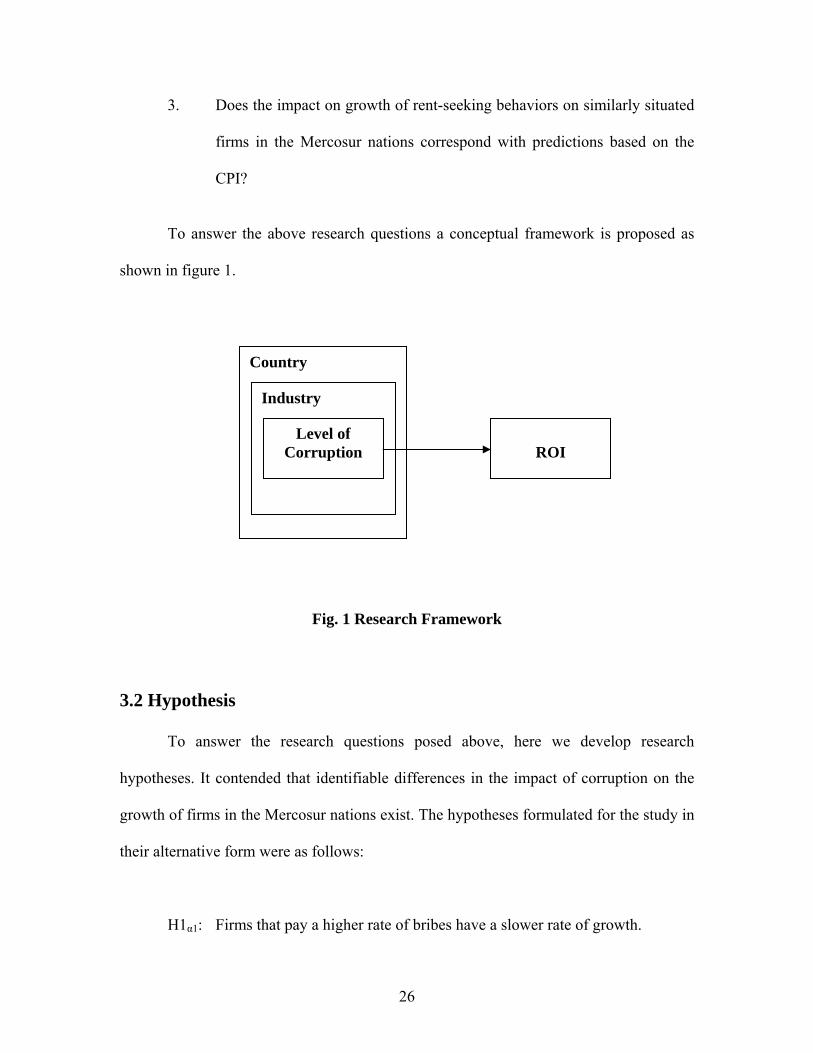
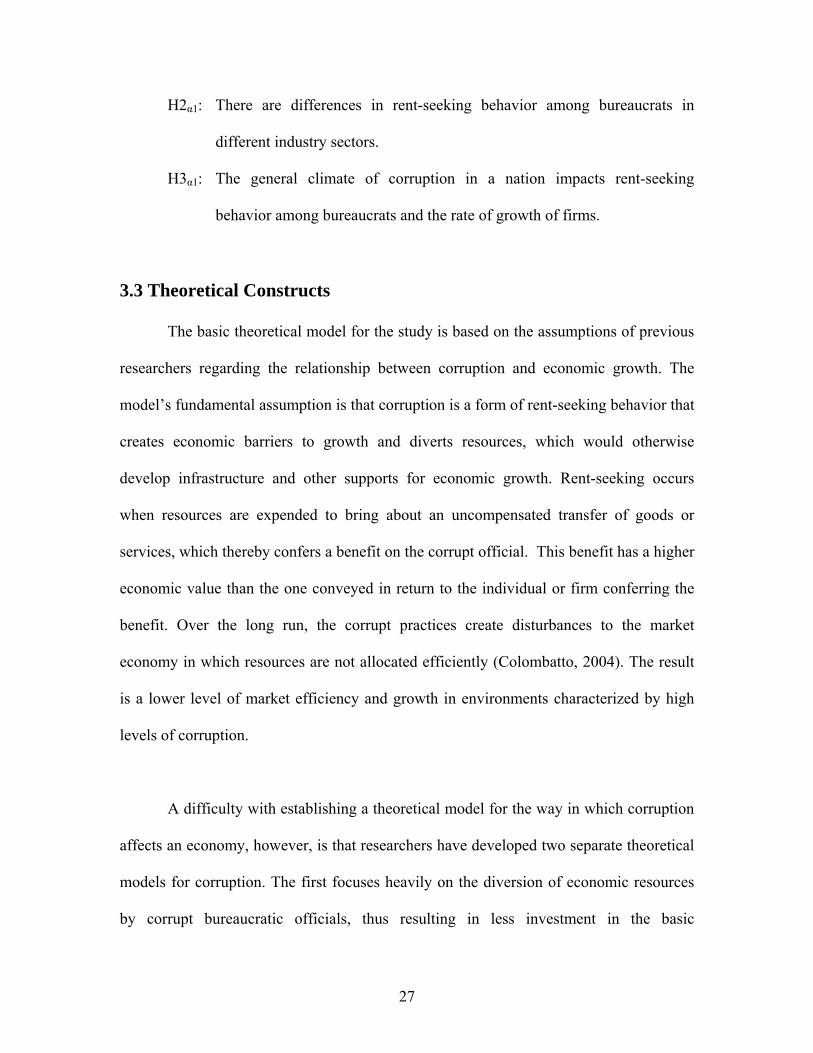
3. Does the impact on growth of rent-seeking behaviors on similarly situated
firms in the Mercosur nations correspond with predictions based on the
CPI?
To answer the above research questions a conceptual framework is proposed as
shown in figure 1.
Fig. 1 Research Framework
3.2 Hypothesis
To answer the research questions posed above, here we develop research
hypotheses. It contended that identifiable differences in the impact of corruption on the
growth of firms in the Mercosur nations exist. The hypotheses formulated for the study in
their alternative form were as follows:
H1α1: Firms that pay a higher rate of bribes have a slower rate of growth.
27
H2α1: There are differences in rent-seeking behavior among bureaucrats in
different industry sectors.
H3α1: The general climate of corruption in a nation impacts rent-seeking
behavior among bureaucrats and the rate of growth of firms.
3.3 Theoretical Constructs
The basic theoretical model for the study is based on the assumptions of previous
researchers regarding the relationship between corruption and economic growth. The
model’s fundamental assumption is that corruption is a form of rent-seeking behavior that
creates economic barriers to growth and diverts resources, which would otherwise
develop infrastructure and other supports for economic growth. Rent-seeking occurs
when resources are expended to bring about an uncompensated transfer of goods or
services, which thereby confers a benefit on the corrupt official. This benefit has a higher
economic value than the one conveyed in return to the individual or firm conferring the
benefit. Over the long run, the corrupt practices create disturbances to the market
economy in which resources are not allocated efficiently (Colombatto, 2004). The result
is a lower level of market efficiency and growth in environments characterized by high
levels of corruption.
A difficulty with establishing a theoretical model for the way in which corruption
affects an economy, however, is that researchers have developed two separate theoretical
models for corruption. The first focuses heavily on the diversion of economic resources
by corrupt bureaucratic officials, thus resulting in less investment in the basic
28
infrastructure necessary for economic growth. This theoretical position assumes that the
diversion of resources leads to a lower marginal product of capital. In effect, the model
proposes that corruption’s actual economic impact relates to the quantity of resources
diverted by corrupt practices (Mauro, 1995).
This diversion model presumes that the government is the primary agent that
controls the economic distribution of goods and services and the degree of investment
that will occur to foster future economic growth. It further presumes that equilibrium will
be established between the ability of the corrupt bureaucrats to extract rents and the
willingness and the ability of the economic agents to pay rents. The level that such
equilibrium occurs is contingent on a number of factors - the degree of governmental
control over the economy, the population’s acceptance of the status quo, and the benefits
that the population perceives from the operation of the economic and political system—
that cannot be precisely measured and is often psychological in nature. As a result, the
model is flexible enough to accommodate the apparent differences in the level of
corruption occurring in various nations as well as the differences in corruption’s impact
on economic growth.
The second type of model often used to support research into corruption focuses
on the restrictions that exist on rent seeking behavior. It assumes that human nature is
such that corruption inherently occurs within all markets. It also assumes that markets
tend to create different types of barriers to corrupt practices; government-created barriers
exist when the markets are large and complex, such as the ones that exist in a national
29
market environment. As a result, the government can create either strong or weak barriers
to corruption; both depend on a variety of political, cultural, and social factors. At the
same time, the model also presumes that there are negative economic and political
consequences to the existence of corruption, with the governmental management of
barriers to corruption contingent on the degree of the market’s tolerance for corrupt
practices. In effect, political risk increases significantly when the level of corruption
exceeds the tolerance of the market.
Equilibrium occurs when the desire of the bureaucrat to collect rent is balanced
with the negative political reaction to the consequences of the inequitable transfer of
wealth. It is expressed as ∑=
=N
i
irr1
in which r is the bribe rate, which is the sum of the
individual decisions of politicians’ determinations of how high a bribe rate ir will be
imposed on the economy. A destabilizing event occurs when the government imposes
increased restrictions on corruption, which theoretically reduce the bribe rate until a new
equilibrium point is reached. Such an event can also occur when the government loosens
restrictions on the bribe rate, causing the equilibrium point to rise. Both actions on the
part of the government have transaction costs, the extent and impact of which are based
on the specific circumstances of the political and market environment. This government
intervention model suggests that corruption is an endogenous variable in an economy
(Coupet, 2003).
In both models, the actions of the government are critical in determining the level
of corruption. At the same time, such actions are contingent on a wide variety of social,
30
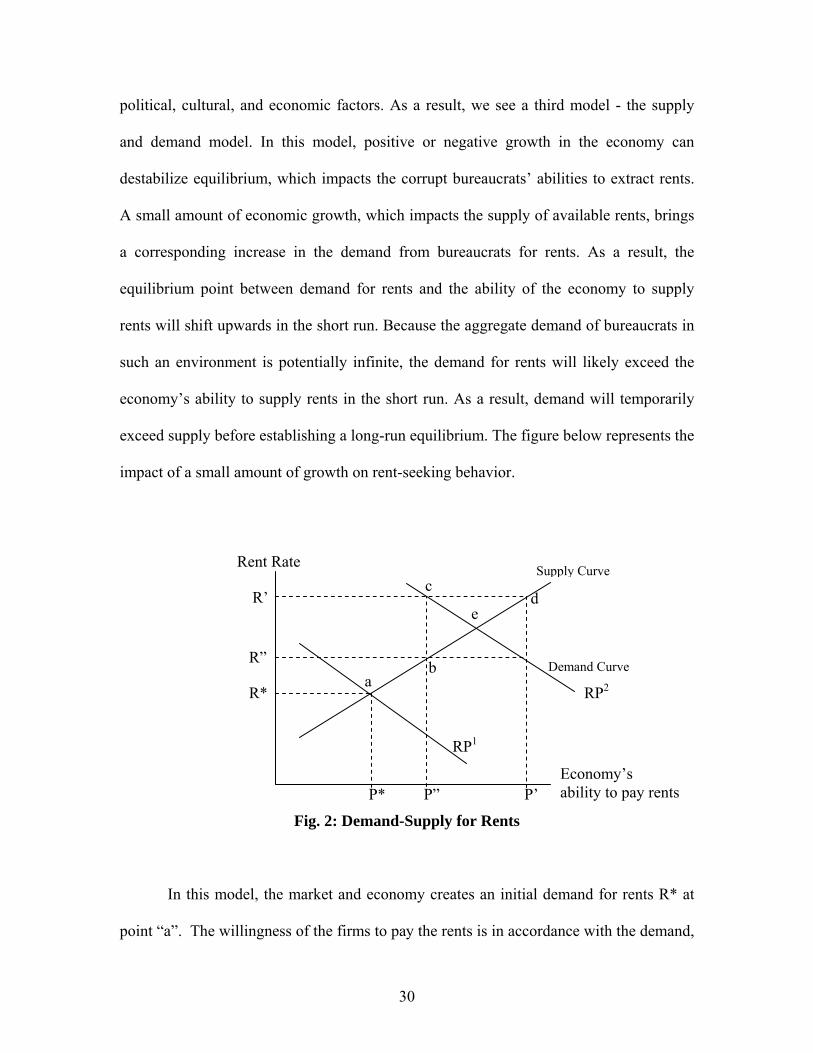
political, cultural, and economic factors. As a result, we see a third model - the supply
and demand model. In this model, positive or negative growth in the economy can
destabilize equilibrium, which impacts the corrupt bureaucrats’ abilities to extract rents.
A small amount of economic growth, which impacts the supply of available rents, brings
a corresponding increase in the demand from bureaucrats for rents. As a result, the
equilibrium point between demand for rents and the ability of the economy to supply
rents will shift upwards in the short run. Because the aggregate demand of bureaucrats in
such an environment is potentially infinite, the demand for rents will likely exceed the
economy’s ability to supply rents in the short run. As a result, demand will temporarily
exceed supply before establishing a long-run equilibrium. The figure below represents the
impact of a small amount of growth on rent-seeking behavior.
Fig. 2: Demand-Supply for Rents
In this model, the market and economy creates an initial demand for rents R* at
point “a”. The willingness of the firms to pay the rents is in accordance with the demand,
Demand Curve
Rent Rate Supply Curve
RP2
dc
e
b
RP1
P’P”P*
R*
R”
R’
a
Economy’s ability to pay rents
31
which establishes an initial equilibrium. This equilibrium is based on the economy’s
ability to absorb the rent demand. With economic expansion, however, rent-seeking
activity also increases moving to R”, which establishes a short-run equilibrium at point
“b”. Encouraged by this increase in ability to collect rent, the demand increases to R’,
thus establishing a new short-run equilibrium at point “c”. The ability of the economy to
pay rents, however, becomes fixed at point P”. When bureaucrats demand rents beyond
this level, the rent-paying firm experiences negative growth and can potentially refuse to
pay the rent or can exit the market to avoid the rent costs. As a result, there is a surplus of
rent demand that the economy cannot absorb at point “d”. To eliminate the surplus in
demand, rent-seeking behavior abates sufficiently to establish equilibrium between the
economy’s ability for paying the rents and the rent-seeking behavior (King and Handa,
2003). As a result, the economy functions to place some degree of limitation on the rent-
seeking behavior of bureaucrats. In this model, there is real GDP growth only when its
growth rate exceeds the level of increased rent demand. At the same time, the need for
the economy to expand faster than the rate of consumption due to corrupt practices
operates as a disincentive for growth.
From a microeconomic perspective, the individual firm considering a project,
which will result in earnings growth, has to add the additional cost of corruption to the
project. This effectively increases the hurdle rate necessary for the project to achieve
profitability. To be considered viable, the project must provide sufficient future cash
flows to justify both capital investment and also the forecasted costs of corruption. The
32
aggregate decisions occurring on the microeconomic level consequently affect the
economy as a whole.
After considering the theoretical models often used in corruption research, the
supply and demand model coupled with the governmental intervention model offer the
best means to describe the impact of corruption on the economy. The resource diversion
model appears to be more suited to closed or quasi-closed economies where governments
possess a high degree of control over resource allocation. In contrast, governmental
interventions, or the lack of such interventions, can impact the rent demand. At the same
time, normal market forces can operate to impact the supply and demand for rents. As a
result, a synthesis of both the government intervention and the supply and demand
models is necessary to effectively describe corruption’s effects.
3.4 Industry Sector Selection
The criteria for selecting an industry sector for the purposes of this study was to
choose one that was substantially present in all four of the Mercosur nations; it consisted
of regulated and unregulated sectors and was large enough to contain a number of varied
sized firms. The criteria enabled the selected industry to represent the economy as a
whole; the data obtained regarding the sector will indicate the economic impact of
corruption. A large number of industry sectors were considered. The natural resources
and transportation sectors fit some of the criteria, yet are heavily regulated in some
Mercosur nations. Other industries - durable and consumer goods manufacturing - are not
33
well-developed in the two smaller Mercosur nations, Uruguay and Paraguay. The
agricultural and textile industries are subject to a high degree of government protection.
Based on the criteria and the consideration of alternative industries, the study
focused on the computer hardware and software industry sector. This industry is broad
enough to have participants in all four of the Mercosur nations. A large number of small
and medium sized firms competing for local and export market shares compose the
software segment of the industry sector. This is largely due to the low capital intensity
required for software development, which primarily depends on knowledge assets rather
than industrial infrastructure.
Additionally, the software segment consists of both indigenous firms and
subsidiaries of multinational firms. This segment of the industry is not regulated in the
Mercosur nations. A small number of firms that produce completed computers and
peripheral products characterize the computer manufacturing segment of the industry.
These firms are essentially assemblers of component parts, with a supply chain composed
of a large number of smaller firms competing with each other to sell components to the
larger firms. This segment of the industry is partially regulated through various
protections that foster the development of an indigenous computer production industry in
the region. The regulations focus on limiting competition by creating barriers for new
market entrants, particularly for competitors that are foreign subsidiaries. The industry
sector also includes semiconductor manufacturers and providers of networking systems
34
and services. This segment is less developed in the four Mercosur nations and largely
involves subsidiaries of multinational firms with significant expertise in this area.
This chapter provided the research questions, hypothesized relationships, and the
context of the problem. It was proposed that the firms that pay higher bribes have slower
rate of growth. As we study the Mercosur nations, it was proposed that there exists
differences in rent-seeking behavior of bureaucrats at the national and the industry sector
level.
35
Chapter 4
RESEARCH DESIGN
This chapter describes the research design used to test the conceptual research
framework. Here we describe the operationalization of variables, sample selection
process, data collection method, and data analysis plan adopted for testing the hypotheses
proposed.
The goal of a formal research design, which is a road map for conducting
research, is to test the proposed hypotheses or answer the research questions. It provides
answers for the following questions: What techniques will be used to gather data? What
kind of sampling will be used? How will time and cost constraints be dealt? (Cooper and
Emory, 1995); What kind of analysis methods will be adopted to test the proposed
hypotheses? Accordingly, “A research design thus ensures that the study (a) will be
relevant to the problem and (b) will use economical procedures.” (Churchill, 1994)
4.1 Operationalizing Variables for the Test Instruments
The test instruments (see Appendix A for details) for this study consisted of a
survey questionnaire and a structured interview. Both were administered to a sample
population of managers in the Mercosur nations to determine their perceptions of
corruption and its impact on the firms’ growth. As both were based on the literature
review to date and the study’s theoretical assumptions, the test instruments gauged the
microeconomic effects of corruption. There will be some emphasis on the role that
36
corruption plays in the managerial decision-making process with respect to resource
allocation and project hurdle rates. The research design has a microeconomic focus,
although some macroeconomic factors may be considered in the development of the test
instrument.
4.1.1 Economic Growth of Firms
Based on the theoretical construct established for this study, the dependent
variable is the economic growth of specific firms in the Mercosur nations. The dependent
variable is the variable that is most easily measured in the context of this study; it will be
quantified as return on assets (ROA), or similarly, as return on investment (ROI). As a
measure of an organization’s productivity, it is determined by dividing the net earnings of
the organization by the total assets. This can be expressed as a percentage. The
theoretical premise behind the use of ROA to operationalize this variable is that the rate
of ROA growth over a period of time will be higher for firms not dealing with corrupt
practices. It is further based on the assumption that bribes or other types of rents paid by
the organization are masked in the operating expenses of the firm; consequently, the net
earnings of the firm and ROA are reduced.
The selection of the ROA as the means to operationalize the dependent variable
has an inherent difficulty, as other variables can impact the economic growth of specific
firms; intangible factors such as business goals and human resources management are
included. This difficulty is present with all possible measures of a firm’s economic
growth, which is the result of the interaction of a large number of quantitative and
37
qualitative factors. The strategy used to minimize the impact of this difficulty on the
study’s findings will be to aggregate the firms by industry sector and nationality. The
assumption behind the use of this strategy is an aggregate of firms within an industry
segment will behave in a group manner; the individual variations between firms will
cancel themselves, thus creating a representative average. This strategy will also support
one of the research questions that investigate the possible differences in the perceptions
and impact of corruption on different industry segments within the same Mercosur
nation.
4.1.2 The Level of Corruption
A large number of potential variables can indicate the level of corruption in the
environment and can be characterized as rent-seeking behaviors. These include, but are
not limited, to (1) the prevalence of direct payment of cash bribes to public officials to
obtain government services; (2) the direct payment of non-cash benefits to public
officials for the same purpose; (3) barriers to commerce in the form of licenses and
permits granted only to some individuals and firms; (4) the prevalence of cronyism in
either the distribution of governmental benefits or in the granting of licenses and permits;
(5) and direct competition by government owned entities in some industry sectors.
Previous researchers have used different means – such as determining the level of red-
tape encountered in an economy - to operationalize these concepts (Mauro, 1995).
Another method is examining the percentage of bribe rent-seekers in the
governmental apparatus (Coupet, 2003). No standard methodology exists that is used for
38
operationalizing the concepts associated with corruption, which provides a wide degree
of latitude for the present research.
An important independent variable involves the number and amount of the bribes
necessary for the firm to pay as a condition of conducting business in the specific
environment. The number of bribes provides an indication whether corruption is either
centralized or decentralized in the national economy. A larger number of bribes suggest
that corruption is decentralized and, therefore, endemic to the economy; thus, corruption
becomes more difficult to control. A smaller number of bribes suggest that corruption is
both centralized and also controlled by few public officials. The phraseology used in the
test instrument will avoid the use of the word “bribe” to reduce the possibility that
respondents will not be candid due to a feared perception in admitting to wrongdoing
(See Appendix C, Questions 2 and 3).
The variables were based on a four-tiered ordinal scale, which indicated
agreement or disagreement with a stated premise. This methodology used closed-end
questions that facilitated coding of the responses and the ability of the research to
produce inferential statistical comparisons. The questions asked respondents if they
strongly agreed, simply agreed, simply disagreed, or strongly disagreed with a statement.
An additional benefit to the use of this method for gathering data in the area of corruption
was that it did not directly ask the individual respondents whether they participated in the
corrupt practice; instead, it focuses on whether they have observed corrupt practices. This
39
was intended to further increase candor by disassociating the respondent from the
corruption.
The amount of the bribe that the firm must pay as a condition of doing business in
the corrupt environment can theoretically impact the firm’s level of investment. In
practice, a high amount of bribe payments functions as a significant additional operating
cost that does not produce value to the firm. Due to the higher operating costs, individual
projects must produce a higher rate or return or hurdle rate in to be economically viable.
As a result, projects that do not produce value for the firm are generally not pursued,
which limits the firm’s growth. Because the perception of the bribe’s magnitude is a
relative concept contingent on the firm’s’ size and the economic advantage perceived of
particular transactions, the survey questionnaire will not directly inquire to the
respondents’ perception of the magnitude of the bribe-taking. Instead, it will examine
whether the amount of bribes demanded by bureaucrats functions as a factor in the
decision making process. This is essentially a proxy measure for the number of bribes
that the firm pays, which avoids the difficulties associated with obtaining a candid
response.
Question 4 of the survey questionnaire elicited information regarding the impact
of bribes on projects undertaken by the firm (See Appendix C, Question 4). The question
is worded such that it is equally applicable to both large and small firms. It also assumes
that bureaucrats’ rent-seeking behaviors will be commensurate with the position of the
firm; the bribe-taker increase or decrease the amount demanded in accordance with the
40
financial position of the firm. As a result, larger firms will be subject to higher demands
in terms of the amount; however, the impact on the decision to continue with a project
will be relatively the same as in the case of smaller firms with less demand.
Question 5 of the survey questionnaire was intended to elicit information
regarding the degree that a response to rent-seeking behavior is entrenched in corporate
culture (See Appendix C, Question 5). The theoretical assumption is that in corrupt
environments, the firm adopts a planning position where the payment of bribes or other
types of gratuities is a normal cost of doing business and is fully integrated into the
project planning phase.
Question 6 of the survey questionnaire elicited information regarding the
perceived importance of the payment of bribes to the competitive positioning of the firm
(See Appendix C, Question 6). In a corrupt environment, we see a strong potential for
firms or individuals, who are well-connected politically and willing to bribe officials, that
will obtain an unfair competitive advantage over rival firms. To some degree, this relates
to the extent of corruption in the general environment. Theoretically, in a corruption-free
open market economy, competitive advantage depends on firm-specific factors such as
core competencies and the ability to deploy those competencies in the market. In a
corrupt environment, however, the corruption becomes an additional factor in
determining competitive advantage. In effect, it can erect an artificial barrier to market
entry for firms unwilling to meet the required price for doing business in a corrupt
environment.
41
The survey questionnaire also contained a question for determining if the
respondents perceived that corruption hampered their ability to fully engage in trade with
other Mercosur nations, which is the intent of the Mercosur trading arrangement (See
Appendix C, Question 7). Although the Mercosur nations have a trading agreement that
ostensibly removes barriers to commerce, the potential exists for officials in the various
member nations to extract rents from firms or individuals from other Mercosur nations.
This is done as a condition of doing business in the bureaucrat’s home nation. In theory,
the bureaucrat collecting the bribe faces a lower degree of political risk because the
payment originates outside the country; therefore, it does not directly affect the local
constituency. At the same time, a requirement to pay bribes both in the home country and
in other nations can undermine the benefits of the Mercosur agreement to the firm by
increasing its costs. As a result, the perception that the level of corruption in other
Mercosur nations is high enough to impede trade could potentially reduce the firm’s
growth rate.
The survey questionnaire directly inquired if there was a perceived difference in
the amounts of bribes charged in both the home nation and other Mercosur nations (See
Appendix C, Question 8). The purpose of this question was to determine the perceived
level of the barrier to trade presented by corruption. The theoretical assumption is that a
relatively high perception of corruption in another nation, when compared to the home
nation, will result in less trade and a lower growth rate for the firm. In addition, if the
level of corruption is perceived as lower in another Mercosur nation when compared to

42
the home country, then a firm could potentially shift resources to that nation to take
advantage of lower business cost.
4.2 Pilot Study
A pilot study (see Appendix A for details) was conducted on the data collected
during the course of the summer of 2004 in the Mercosur nations. The purpose of the
pilot study was to determine if the survey test instrument produced predictive and reliable
information. By their nature, pilot studies involve a relatively small population; the
population is not necessarily representative of the larger study population. The purpose of
the pilot study is to examine the reliability and validity of the test instrument and not to
produce findings that may be generalized to the larger population. The data obtained
during the pilot study, however, was incorporated into the study due to the determination
following the pilot study that the survey questionnaire test instrument was suitable for
gathering data and was also reasonably predictive.
The data collection process for the pilot study that involved chain referrals and a
high level of in-person contact with mangers in the computer industry produced 72
completed survey test questionnaires. Because the survey questionnaire uses closed-
ended questions, it provides a natural structure for the coding frame of the data. Various
frames were developed for the pilot test based on the internal data provided by the survey
questionnaire; this included frames based on the nation of origin of the respondents and
frames based on the segment of the computer industry of the respondents. Because of the
small number of respondents in the pilot study, certain segments of the industry were
43
underrepresented and were not used for this initial stage of analysis. There were sufficient
numbers to conduct an analysis based on the four Mercosur nations, although there were
relatively few respondents from Uruguay and Paraguay as expected. The external data,
which was necessary to support the analysis, was the change in ROI of the firms with
managers participating in the study, with the information necessary to determine ROI
obtained from public sources. The data was further analyzed to establish a three-year
average percentage change in ROI.
Data analysis was accomplished by regression analysis on the coding frame based
on total results; it was not performed on the coding frame based on national differences
due to the relatively small numbers of respondents from Uruguay and Paraguay. The
findings of the initial regression analysis for the pilot study tended to support the
hypothesis of the study - higher levels of corruption as determined by managers’
perceptions of the level of corruption tends to depress the financial performance of firms.
This suggested that the survey questionnaire would be predictive and would be suitable
for use in the larger study.
The pilot test also revealed a potential difficulty with serial correlation in the
sample methodology; the errors could be correlated across nations contemporaneously.
This results in errors in county i at time t appearing to be correlated to errors in country
j at time t , with the errors tending to be the result of the interdependence of the
countries. This is particularly the case in the situation of the Mercosur nations that tend to
have a higher degree of interdependence than nations that are not geographically,
44
culturally, and economically linked. Errors also tend to be heteroscedastic, as they have
differing variances across different nations. This can produce higher values for some
variables that tend to be less restricted in the national political, social, and economic
system. The impact of the heteroscedastic effect can come from the various scales of the
national economies; larger economies such as Brazil have the potential to have a number
of significant differences in factors such as unemployment rates when compared to the
nations with smaller economies.
4.3 Identification of the Sample Population
The summer research of 2004 conducted in the Mercosur nations enabled the
development of a clearer definition of the sample population. The study focuses on
managers in the various segments of the computer industry in the four Mercosur nations.
An ideal sample population would include a balanced number of representatives from
each of the four nations, from the firms in the various segments of the computer industry,
and from firms of variable size. A large number of respondents are necessary to
accomplish this. A sample size, which is too small, is not sufficiently representative; a
sample that is too large wastes time and resources without achieving a significantly
greater level of accuracy. For the present study, the basis of determining the optimal size
of the sample population is a confidence level of 95% with a confidence interval of 5.
These parameters indicate that the findings of the study are likely to be within 5 units
95% of the time. A population of unknown size characterized the study because it is not
possible to determine with any accuracy the total size of the computer industry in the
Mercosur nations.
45
The Central Limit Theorem forms the basis for determining the size of a sampling
to achieve the intended confidence interval and confidence level when the total size of the
population is unknown. This theorem contends that the repeated sampling of a population
produces an average of the tested attribute representing the population as a whole. In this
approach, the values obtained by the sampling are distributed around the true value in a
range of plus or minus 5 intervals 95% of the time. The formula for determining the
sample size is( )2SE
pqn = ; n is the sample size, p is the proportion of the population
possessing the attribute, q is p−1 , and SE is the standard error. At the 95% confidence
level and the confidence interval of 5, the SE is .05/1.96 = .02551. The confidence
interval is expressed in the form of a hundredth decimal and is the numerator; the 95%
confidence is a constant of 1.96 and is the denominator. This produces an estimate of the
standard error that will be found with a sampling using this confidence level and
confidence interval. In the case of the current research, the proportion of the population
possessing the outcome attribute is unknown. In these types of situations, we select p at
.5, because we assume equal numbers of the population possess the attribute and do not
possess the attribute. This is the method used with large populations, such as the
population in the current study in which there is an equal chance that a respondent will or
will not possess the attribute. These assumptions result in the following substitutions:
( )( ) ( )
384000651./25.
02551./5.15. 2
2
==
−=
=
nnn
SEpqn
46
This indicates that the optimal sample size for the study is 384. While an increase
in confidence level or a decrease in confidence interval would produce greater accuracy
in results, it would increase the size of the sampling to a level beyond the budgetary and
time constraints of the present study. Establishing this number for the size of the sample
provides guidelines for the amount of data gathering activity that has to occur on a
regular basis to achieve the desired sampling size by the conclusion of the data gathering
phase of the study.
4.4 Sample Selection Process and Data Collection
While the original sampling strategy was envisioned as a fully random process in
which every member of the total population had an equal and independent chance of
being included in the sample population, difficulties with accessing the study population
resulted in a modification of the sampling strategy. During the course of the summer
research, it became apparent that access to the sample population by an outsider to the
industry would be difficult, particularly in consideration of the sensitive nature of the
study focusing on corruption in the business environment. This led to the development of
a chain referral sampling strategy where respondents, who had become members of the
sample population, identified members of the total population. This type of referral
network diminished the independence of the sampling by encouraging members of
population to participate based on the recommendation of the individual or organization
providing the referral. This approach to sampling also increased the possibility that self-
selection bias skews the findings. Self-selection bias under these circumstances operates
by selecting a larger group of respondents who are members of a particular organization
47
such as the software association used as basis for referral in Argentina. Additionally, it
tends to select a group of respondents with a relationship with a firm or an organization
making the referral and excluding respondents lacking a relationship. The potential for
various types of biases was addressed through the development of a variation in the
sampling strategy. This resulted in some of the sampling conducted through a random
process that identified members of the industry and randomly sought participation in the
study.
The developed random sampling strategy, focused on establishing email contact
with firms in the computer industry in the Mercosur nations. These firms were recognized
by internet searches that identified firms with websites and identified portals providing
links to computer firms in the targeted geographic area. An email introduction, which
explained the nature of the study and asked for the participation of managers in filling out
the survey questionnaire, approached the managers in these firms. In cases where the
website listed the direct email addresses of managers at the firm, the introductory
information was addressed directly to the individual managers. Also, another random
strategy adopted, was to contact either by telephone or by mail firms identified through
physical business directories, which were collected for each Mercosur nation during the
summer of 2004 and winter break of 2005, when the researcher traveled to the Mercosur
nations. These processes increased the degree of randomization of the sampling process
by obtaining a significant number of responses not based on the referral method.
48
The random internet sampling strategy, however, had its own set of issues that
could potentially introduce bias into the sampling process. Because the firms were
identified based on websites, the sampling strategy excluded those firms that did not
maintain a website. Due to the nature of the computer industry in which participating
firms leverage technology and view a website as a condition of doing business, this risk
was not deemed significant. Not all firms that maintain websites are easily found by
internet search engines, however, with newer websites and those using flash technology
often excluded from search results. Additionally, the quality of the search engine findings
is contingent on the terms used for the search, which could result in the introduction of
researcher bias into the selection process. This occurs when the researchers pre-conceived
concepts regarding the methods to conduct a search to identify the sample population
results in the selection of only a certain type of firm that has characteristics that conform
to the researcher’s concepts. These factors suggest a significant possibility that some
firms would have been overlooked in the selection process.
In the initial execution of this strategy during the course of the research, the
sectors of computer supply and networking were not well represented. This was initially
attributed to the nature of the search parameters used on the internet. This fact proved to
be right after an alteration of the search parameters, produced a significant increase in the
representation of these sectors. Note that the computer supply segment of the industry
was also poorly represented during the pilot study. However, the researcher chose, at that
time, to decide its viability as a category for the industry after the conclusion of the data-
gathering period. Based on the success obtained after the alteration of the search
49
parameters described above, the researcher concluded that not necessary to eliminate
these sectors as a category for the industry.
Another potential limitation in the use of random solicitation via the internet is the
tendency of recipients of unsolicited email to delete the email without reading it or to
assume that the contents of the email are in some way deceptive. The strategy adopted to
minimize the impact of these possibilities was contacting the non-respondent firms by
telephone and regular mail to introduce the study through another communications
medium. In the majority of cases, the website also contained either the telephone number
or the address of the firm, thus supporting the use of an alternative means of contact. The
general strategy was to approach firms that do not respond to email solicitation by regular
mail approximately 10 days after the initial email contact. Telephone contact with these
firms occurred during the winter break of 2005 when the researcher traveled to the
Mercosur nations.
The general data collection strategy for individuals who have agreed to participate
in the study either as the result of a referral or a random solicitation by email was to send
the survey questionnaire by email immediately upon receiving the respondent’s
agreement to participate. If the completed survey questionnaire was not returned within a
week of dispatch, a follow-up reminder email was sent. There were a small percentage of
individuals that agreed to participate in the study but did not return completed survey
questionnaires even after the follow-up reminder. Given the feasibility of each case at the
50
time, those individuals were contacted either by telephone or by mail during the winter
break.
While the email random solicitation process was highly effective in the initial
weeks after implementation in increasing the number of respondents, it eventually
became evident that the method was producing a diminishing rate of returns. This was
due to the finite number of firms that could be identified through the methodology and
the relatively high rate of non-response to the solicitation request. The sole reliance on
this method would create some uncertainty in the ability to reach the optimal number of
participants in the study. This led to a resumption of the referral method of solicitation
with individuals returning completed survey questionnaires asked to provide referrals to
managers from other firms. They were also asked if their names could be mentioned in
the solicitation materials as the referring party. The resumption of the use of the referral
method to identify potential participants increased the rate of agreement to participation.
Based on this experience with diminishing rates of return, a significant number of
individuals were randomly contacted by means of unsolicited email did not read the
email or did not respond due to concerns regarding the legitimacy of the study. When the
referral method was used, the mention of the referring party in the solicitation materials
helped to establish credibility for the study. In the coding process, a notation indicating
whether the completed survey questionnaire was the result of a referral or random direct
solicitation was developed. This will allow the identification of the percentages of the
two types of data in the final analysis. There is no guarantee, however, that data identified

51
as obtained from random solicitation was not subject to indirect referral through
communication between respondents that the researcher was not aware.
Despite the inherent flaws in the sample selection strategies, the referral and
random internet selection methods were considered the best means to approach the study
population in order to obtain a viable sample. The random selection aspects of the
internet identification process offset the deficiency in the referral method of dependency
on an industry group with existing relationships. The referral method functioned as an
alternative method to identify respondents, offsetting some of the deficiencies in the
internet selection method of overlooking segments of the total population. Due to these
considerations, the sampling error that remained in the study is considered minimal and
the lowest possible level considering the difficulties associated with data collection in an
international environment.
An additional issue in the sampling strategy is the disproportionate size of the
computer industry in Brazil and Argentina when compared to Uruguay and Paraguay. In
the pilot study, only 18% of the respondents were from Paraguay and Uruguay, despite an
effort during the summer research period to collect data specifically from these two
nations. This raised the possibility that the members of the sample population from these
two nations were not representative, and that pooling of the data would result in the
perceptions of corruption in Brazil and Argentina controlling the outcome of the study. It
further suggested at the time that too high a representation from Uruguay and Paraguay
could disproportionately influence the findings from the two larger nations. However,

52
this issue was resolved after selecting a sampling strategy specifically designed to deal
with the issue of disproportionate geographic representation in the sampling.
A sampling strategy considered for dealing with the issue of disproportionate
geographic representation in the sampling involved sampling from the four Mercosur
nations in proportion to the relative size of the nation’s GDP. Table 5 presents the total
GDP of the Mercosur nations and the relative contribution of each member nation in
percentage terms.
Table 4.1: Mercosur Nation GDP
Brazil Paraguay Uruguay Argentina GDP Total 500 7.7 11.2 432 950.9 52.6% 0.8% 1.2% 45.4%
While this sampling strategy would support the pooled analysis of the data in
order to provide representative findings for the Mercosur nations as a whole, the number
of respondents from Paraguay and Uruguay should be relatively small. As a result, the
sampling would not produce enough data to support statistical significance for the
findings from these two nations when considered separately from the findings for the
Mercosur nations as a whole.
The sampling strategy that dealt with this problem focused on the use of
disproportionate stratified sampling, which involved drawing a disproportionate number
of samples from Paraguay and Uruguay when compared to the samples from Brazil and
53
Argentina. This allowed for a statistically meaningful evaluation of data when Paraguay
and Uruguay are considered separately. Nonetheless, disproportionate stratified samples
tend to have standard errors that are less precise than proportionate stratified samples of
the same population. When compared to simple random samples, disproportionate
stratified samples can be either more or less precise, depending on the factors that
influence the error in the various strata. A greater degree of precision tends to occur when
the means of the variable of interest are heterogeneous in the strata. As such, this
sampling method presumes that the means of the strata will be heterogeneous, and the
data produced by the method will not be compromised by an inappropriate sampling
strategy.
The sampling strategy was time consuming, although many aspects of the process
were automated. Each of the firms, which were solicited for participation in the study,
had to be individually identified and recorded in a master file to prevent duplication of
solicitation. The solicitation materials were pro forma, but they were somewhat modified
to be specific to the firm or manager being approached. Regular mail subsequently
contacted firms that did not respond to the email solicitation. A record was made of the
date that the solicitation materials are sent. When an individual agreed to participate, the
survey questionnaire was automatically sent with the date of emailing noted. If the
completed survey questionnaire was not returned within the estimated period, the
reminder was automatically sent. A final list of individuals who had agreed to participate,
yet had not completed the survey questionnaire, was prepared at the end of the fall
quarter of 2004 to support contact by the researcher during the winter break of 2005.
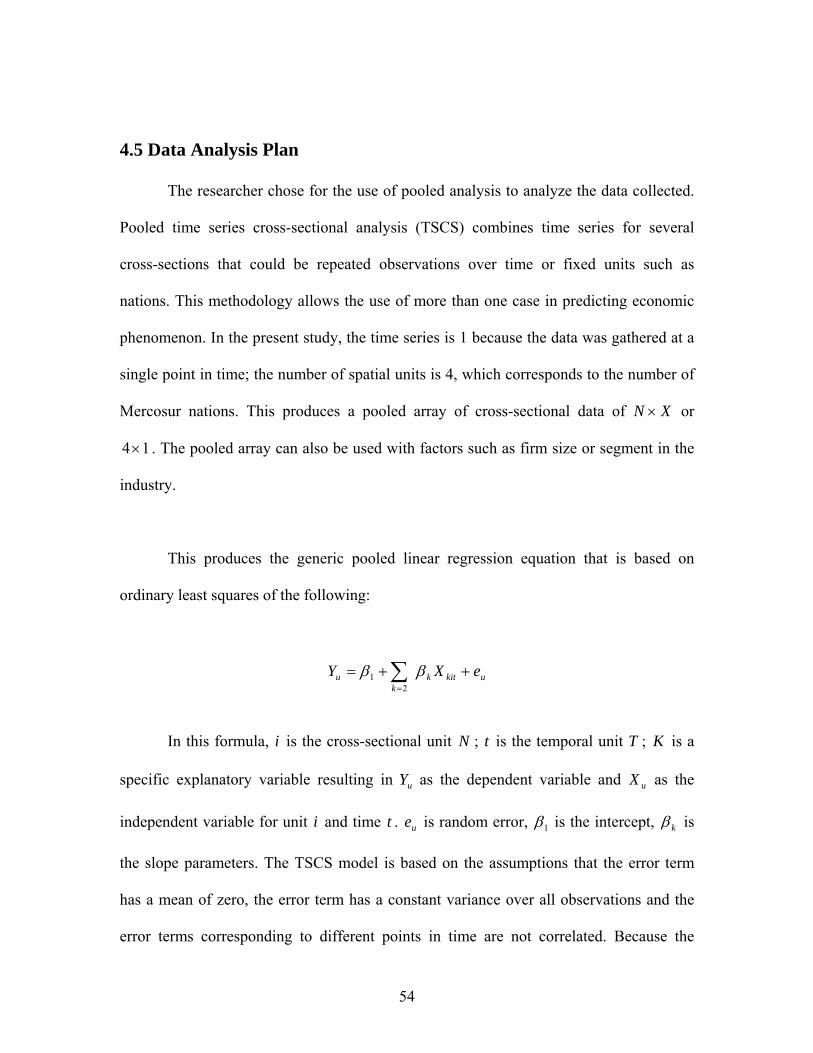
54
4.5 Data Analysis Plan
The researcher chose for the use of pooled analysis to analyze the data collected.
Pooled time series cross-sectional analysis (TSCS) combines time series for several
cross-sections that could be repeated observations over time or fixed units such as
nations. This methodology allows the use of more than one case in predicting economic
phenomenon. In the present study, the time series is 1 because the data was gathered at a
single point in time; the number of spatial units is 4, which corresponds to the number of
Mercosur nations. This produces a pooled array of cross-sectional data of XN × or
14× . The pooled array can also be used with factors such as firm size or segment in the
industry.
This produces the generic pooled linear regression equation that is based on
ordinary least squares of the following:
ukitkk
u eXY ++= ∑=
ββ2
1
In this formula, i is the cross-sectional unit N ; t is the temporal unit T ; K is a
specific explanatory variable resulting in uY as the dependent variable and uX as the
independent variable for unit i and time t . ue is random error, 1β is the intercept, kβ is
the slope parameters. The TSCS model is based on the assumptions that the error term
has a mean of zero, the error term has a constant variance over all observations and the
error terms corresponding to different points in time are not correlated. Because the
55
observations are taken at a single point of time in this study, the third assumption does
not apply. The error term functional measures the accuracy of the ordinary least squares
method. If the standard error is small, then all of the sample estimates based on the
sample size tend to be similar and considered representative of the population. If the error
term is large, however, the statistics fail to represent the population.
For the ordinary least squares method to produce optimal results, the errors must
be homoscedastic and independent of each other. This requirement indicates that the
TSCS approach could violate the standard assumptions of the ordinary least squares
method, when there is significant heteroscedasticity due to inherent factors in the
econometric model or the data collection process. In effect, the error terms would violate
the basic assumptions that they have a constant variance over all observations, and that
they have a mean of zero. Thus, when errors are heteroscedastic, they have differing
variances across different nations, which can produce higher values for some variables
that tend to be less restricted in the national political, social, and economic system. An
example of the heteroscedastic effect comes from the scale of the national economy in
Brazil when compared to Paraguay, with factors such as the flows of workers in and out
of employment tending to be higher in nations with large and diverse economies.
Furthermore, errors can be correlated across nations contemporaneously. This results in
errors in country i at time t appearing to correlate to errors in country j at time t , with
the errors tending to be the result of the interdependence of the countries. This is
particularly the case in the situation of the Mercosur nations that tend to have a higher
56
degree of interdependence than nations that are not geographically, culturally, and
economically linked.
When there is a heteroscedastic situation, the standard errors of the estimates are
biased because they do not have a mean of zero and a constant variance over all
observations. As a result, the usual t statistics, F statistics, and other outputs of the
ordinary least squares method does not produce a meaningful basis to develop inferences.
This issue can be resolved using tests for heteroscedasticity that provide a better estimate
of the error occurring at different locations or points in time. Typically, tests of
heteroscedasticity should test the null hypothesis regarding equal variance against some
specific alternative heteroscedasticity specification. The Breusch-Pagan test determines
any linear forms of heteroscedasticity. This test is based on a regression model
exy += β' where ( ) ( )tzfeVar '2 γσ == . The test of the null hypothesis occurs at
0=γ for arbitrary smooth functions f . Some concern remains, however, that the
Breusch-Pagan test is asymptotically equivalent to a certain F test and may not be a
viable indication of actual linear heteroscedasticity. For the purposes of the present study,
however, the Breusch-Pagan test provides adequate parameters to determine linear
heteroscedasticity. The White Test determines if there are non-linearities by using
squares and cross products of all of the x’s. This is based on the use of a
heteroscedasticity consistent covariance matrix estimator that permits asymptotically
correct inference on β when there is heteroscedasticity of an unknown form. The White
test is generally viable; however, in some situations it can be significantly biased with
finite samples; the level of bias decreases as the sample size increases.
57
A potential solution to this issue is to create an estimate of the variance-
covariance matrix of the errors rather than attempt to identify the matrix, which is
generally designated by Ω . This provides a coefficient estimator β . This approach deals
with error complications by specifying a model for heteroscedasticity and a model for
contemporaneous correlation. This heteroscedasticity correction is in the form of ( )2iteE
and the contemporaneous correlation is in the form of ( )jtit eeE . In some situations, the
error process has a large number of parameters, which results in estimates of standard
errors to understate their actual level of variability. Some debate regarding the
appropriateness of this method for organizing econometric data exists, but it remains
widely used despite the potential of standard error inflation that can result in a flawed
determination of significance.
We generally refer to the corrected standard error as a robust standard error. The
robust standard errors have asymptotic justifications; therefore, they are not valid for
small sample sizes. Additionally, the robust standard error cannot cope with situations
where the number of outliers exceeds the ability of the estimation method to compensate.
The robust standard error becomes increasingly unreliable as heteroscedasticity increases.
Due to the magnitude of this study, the size of the sample should not present a great
difficulty for an accurate computation of the robust standard error. The number of outliers
will likely not be beyond the capacity of a traditional heteroscedasticity method - the
Breusch-Pagan test - to identify and compensate.
58
The number of coding possibilities in the present study creates a difficulty with
developing a more accurate method of the analysis of the data and for the determination
of heteroscedasticity. Coding is based on the structure of the survey questionnaire; as a
result, it is possible to code the responses of the sample population in accordance with the
respondent’s nation or origin and segment of the computer industry from data
endogenous to the survey questionnaire. Coding the data based on size of the firm and
ROI from data exogenous to the survey questionnaire is possible. These coding
possibilities are spatial and not temporal factors, which establishes a situation in which
the number of spatial factors N are greater than the number of temporal factors T, or
TN > . Thus, we can have an event where there is cross-sectional dominance, where
there are more spatial than temporal units.
The model used for analysis may suffer from heteroscedasticity due to country-
and-industry effects. To test the validity of this assumption, a preliminary test of
significance will determine the level of equality of the coefficients. The outcome of this
test will be the basis for the decision to pool. The question, which will be addressed by
this process, is whether to estimate the models separately for different cross-section units
or to estimate the model by pooling the entire data set. The TSCS analysis represents the
combined average partial effect for time and space, yet does not yield information
regarding the relative contribution of the two dimensions to its value. In the study’s
context, it does not address whether the variation, if any, is due to cross-country
differences or cross-industry sector differences.
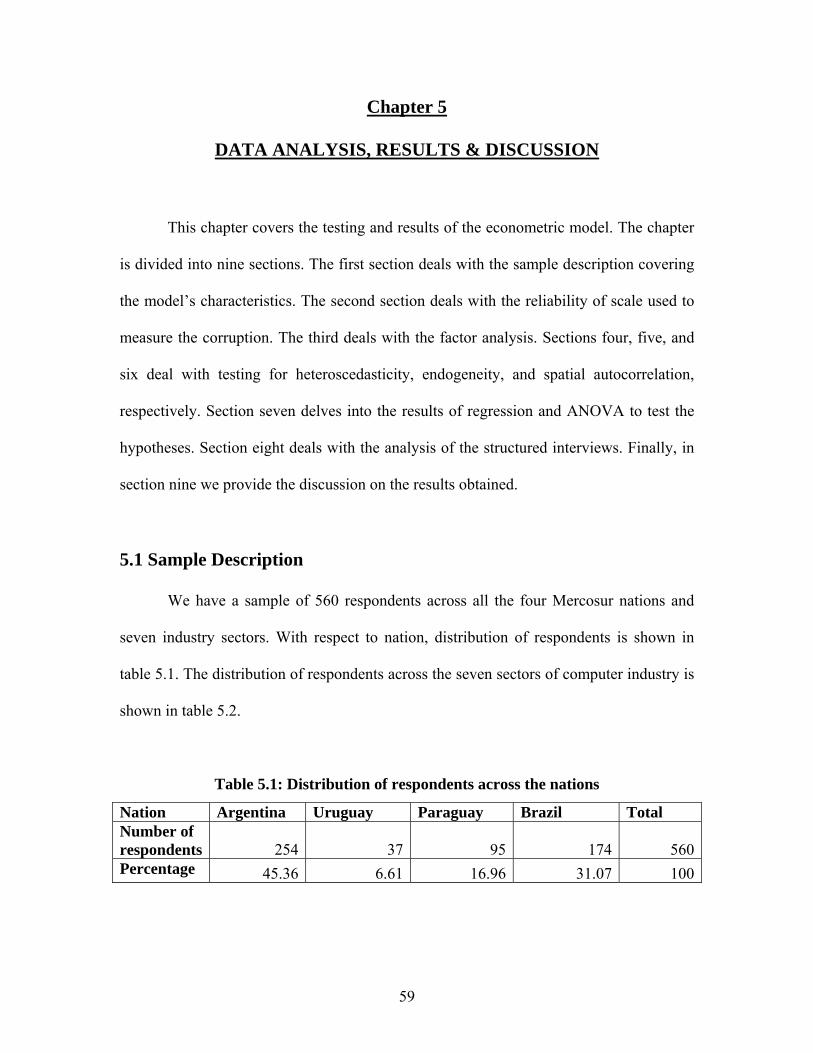
59
Chapter 5
DATA ANALYSIS, RESULTS & DISCUSSION
This chapter covers the testing and results of the econometric model. The chapter
is divided into nine sections. The first section deals with the sample description covering
the model’s characteristics. The second section deals with the reliability of scale used to
measure the corruption. The third deals with the factor analysis. Sections four, five, and
six deal with testing for heteroscedasticity, endogeneity, and spatial autocorrelation,
respectively. Section seven delves into the results of regression and ANOVA to test the
hypotheses. Section eight deals with the analysis of the structured interviews. Finally, in
section nine we provide the discussion on the results obtained.
5.1 Sample Description
We have a sample of 560 respondents across all the four Mercosur nations and
seven industry sectors. With respect to nation, distribution of respondents is shown in
table 5.1. The distribution of respondents across the seven sectors of computer industry is
shown in table 5.2.
Table 5.1: Distribution of respondents across the nations
Nation Argentina Uruguay Paraguay Brazil Total Number of respondents 254 37 95 174 560Percentage 45.36 6.61 16.96 31.07 100

60
Table 5.2: Distribution of respondents across the seven sectors of computer industry
Industry Sector Software Comp_man Com_supp Semc_man Networking Peripherals Others
Total
Number of respondents 82 72 90 83 74 75 84 560Percentage 14.64 12.86 16.07 14.82 13.21 13.39 15.00 100
ROI is the dependent variable in this study; we try to analyze the impact of the
corruption level on the economic growth, including the ROI of the firms in Mercosur
nations for the computer industry. Tables 5.3 and 5.4 show the mean and standard
deviation of ROI of firms in the four Mercosur nations and in the seven industry sectors.
Table 5.3 Mean and Standard Deviation of ROI of Firms in Four Mercosur Nations
Paraguay Argentina Brazil Uruguay Mean -3.60 1.00 5.25 9.09 Std. Dev. 2.18 4.65 3.70 0.88
Table 5.4 Mean and Standard Deviation of ROI of Firms in Different Industry Sectors
Software Comp_man Com_supp Semc_man Networking Peripherals Others Mean 2.18 2.62 2.07 2.16 2.03 1.71 1.78Std. Dev. 5.53 5.33 5.23 5.08 4.84 5.26 5.38
5.2 Reliability of Scale Measures
The scale used to measure the level of corruption is tested for the reliability
analysis using Cronbach’s alpha. Cronbach’s alpha is a model of internal consistency,
based on average inter-item correlation. The Cronbach’s alpha should be greater than
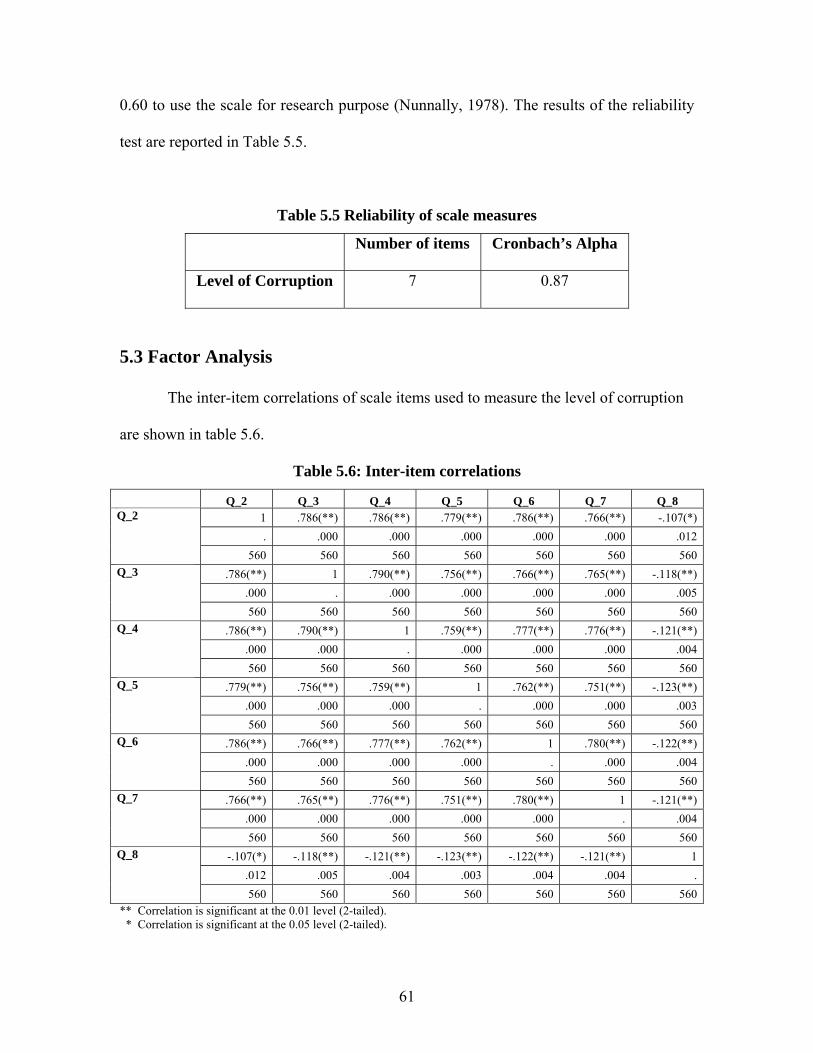
61
0.60 to use the scale for research purpose (Nunnally, 1978). The results of the reliability
test are reported in Table 5.5.
Table 5.5 Reliability of scale measures
Number of items Cronbach’s Alpha
Level of Corruption 7 0.87
5.3 Factor Analysis
The inter-item correlations of scale items used to measure the level of corruption
are shown in table 5.6.
Table 5.6: Inter-item correlations
Q_2 Q_3 Q_4 Q_5 Q_6 Q_7 Q_8 1 .786(**) .786(**) .779(**) .786(**) .766(**) -.107(*). .000 .000 .000 .000 .000 .012
Q_2
560 560 560 560 560 560 560.786(**) 1 .790(**) .756(**) .766(**) .765(**) -.118(**)
.000 . .000 .000 .000 .000 .005
Q_3
560 560 560 560 560 560 560.786(**) .790(**) 1 .759(**) .777(**) .776(**) -.121(**)
.000 .000 . .000 .000 .000 .004
Q_4
560 560 560 560 560 560 560.779(**) .756(**) .759(**) 1 .762(**) .751(**) -.123(**)
.000 .000 .000 . .000 .000 .003
Q_5
560 560 560 560 560 560 560.786(**) .766(**) .777(**) .762(**) 1 .780(**) -.122(**)
.000 .000 .000 .000 . .000 .004
Q_6
560 560 560 560 560 560 560.766(**) .765(**) .776(**) .751(**) .780(**) 1 -.121(**)
.000 .000 .000 .000 .000 . .004
Q_7
560 560 560 560 560 560 560-.107(*) -.118(**) -.121(**) -.123(**) -.122(**) -.121(**) 1
.012 .005 .004 .003 .004 .004 .
Q_8
560 560 560 560 560 560 560** Correlation is significant at the 0.01 level (2-tailed). * Correlation is significant at the 0.05 level (2-tailed).
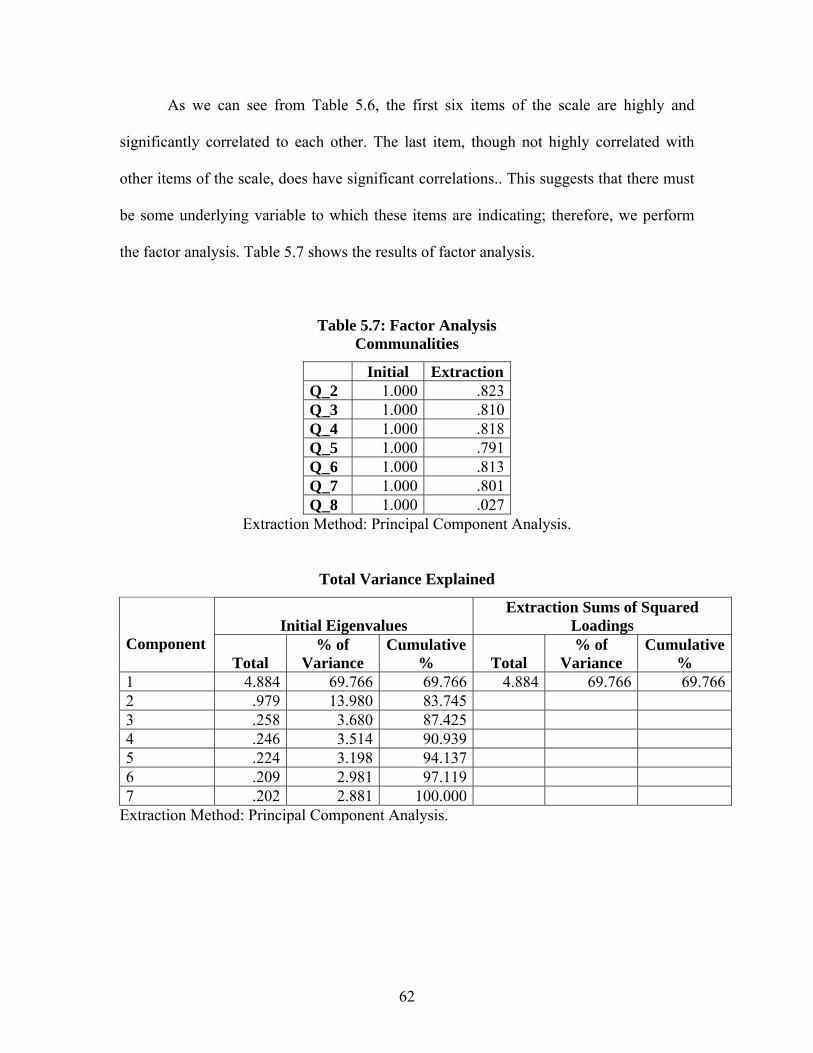
62
As we can see from Table 5.6, the first six items of the scale are highly and
significantly correlated to each other. The last item, though not highly correlated with
other items of the scale, does have significant correlations.. This suggests that there must
be some underlying variable to which these items are indicating; therefore, we perform
the factor analysis. Table 5.7 shows the results of factor analysis.
Table 5.7: Factor Analysis Communalities
Initial ExtractionQ_2 1.000 .823Q_3 1.000 .810Q_4 1.000 .818Q_5 1.000 .791Q_6 1.000 .813Q_7 1.000 .801Q_8 1.000 .027
Extraction Method: Principal Component Analysis.
Total Variance Explained
Initial Eigenvalues Extraction Sums of Squared
Loadings Component Total
% of Variance
Cumulative % Total
% of Variance
Cumulative %
1 4.884 69.766 69.766 4.884 69.766 69.7662 .979 13.980 83.745 3 .258 3.680 87.425 4 .246 3.514 90.939 5 .224 3.198 94.137 6 .209 2.981 97.119 7 .202 2.881 100.000
Extraction Method: Principal Component Analysis.
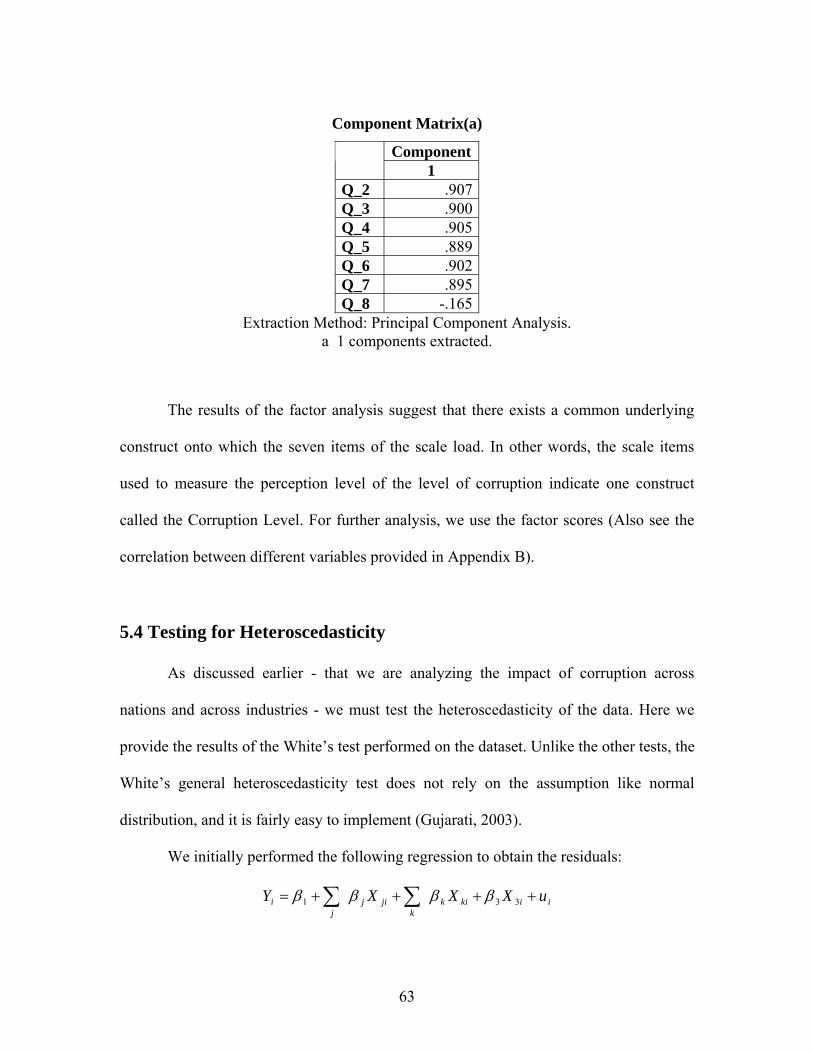
63
Component Matrix(a)
Component 1 Q_2 .907Q_3 .900Q_4 .905Q_5 .889Q_6 .902Q_7 .895Q_8 -.165
Extraction Method: Principal Component Analysis. a 1 components extracted.
The results of the factor analysis suggest that there exists a common underlying
construct onto which the seven items of the scale load. In other words, the scale items
used to measure the perception level of the level of corruption indicate one construct
called the Corruption Level. For further analysis, we use the factor scores (Also see the
correlation between different variables provided in Appendix B).
5.4 Testing for Heteroscedasticity
As discussed earlier - that we are analyzing the impact of corruption across
nations and across industries - we must test the heteroscedasticity of the data. Here we
provide the results of the White’s test performed on the dataset. Unlike the other tests, the
White’s general heteroscedasticity test does not rely on the assumption like normal
distribution, and it is fairly easy to implement (Gujarati, 2003).
We initially performed the following regression to obtain the residuals:
iikikk
jijj
i uXXXY ++++= ∑∑ 331 ββββ
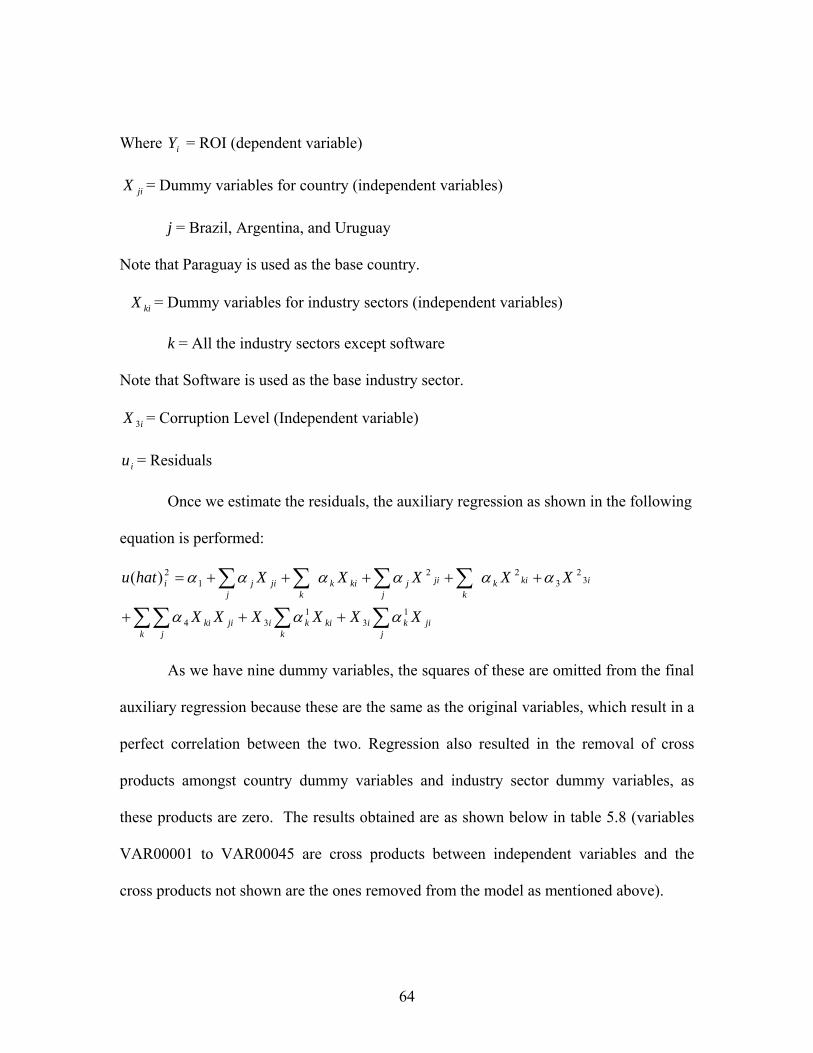
64
Where iY = ROI (dependent variable)
jiX = Dummy variables for country (independent variables)
j = Brazil, Argentina, and Uruguay
Note that Paraguay is used as the base country.
kiX = Dummy variables for industry sectors (independent variables)
k = All the industry sectors except software
Note that Software is used as the base industry sector.
iX 3 = Corruption Level (Independent variable)
iu = Residuals
Once we estimate the residuals, the auxiliary regression as shown in the following
equation is performed:
∑∑∑∑
∑∑∑∑+++
+++++=
jjiki
kkiki
k jjiki
ikikk
jij
jkikk
jij
ji
XXXXXX
XXXXXhatu
13
134
32
322
12)(
ααα
αααααα
As we have nine dummy variables, the squares of these are omitted from the final
auxiliary regression because these are the same as the original variables, which result in a
perfect correlation between the two. Regression also resulted in the removal of cross
products amongst country dummy variables and industry sector dummy variables, as
these products are zero. The results obtained are as shown below in table 5.8 (variables
VAR00001 to VAR00045 are cross products between independent variables and the
cross products not shown are the ones removed from the model as mentioned above).
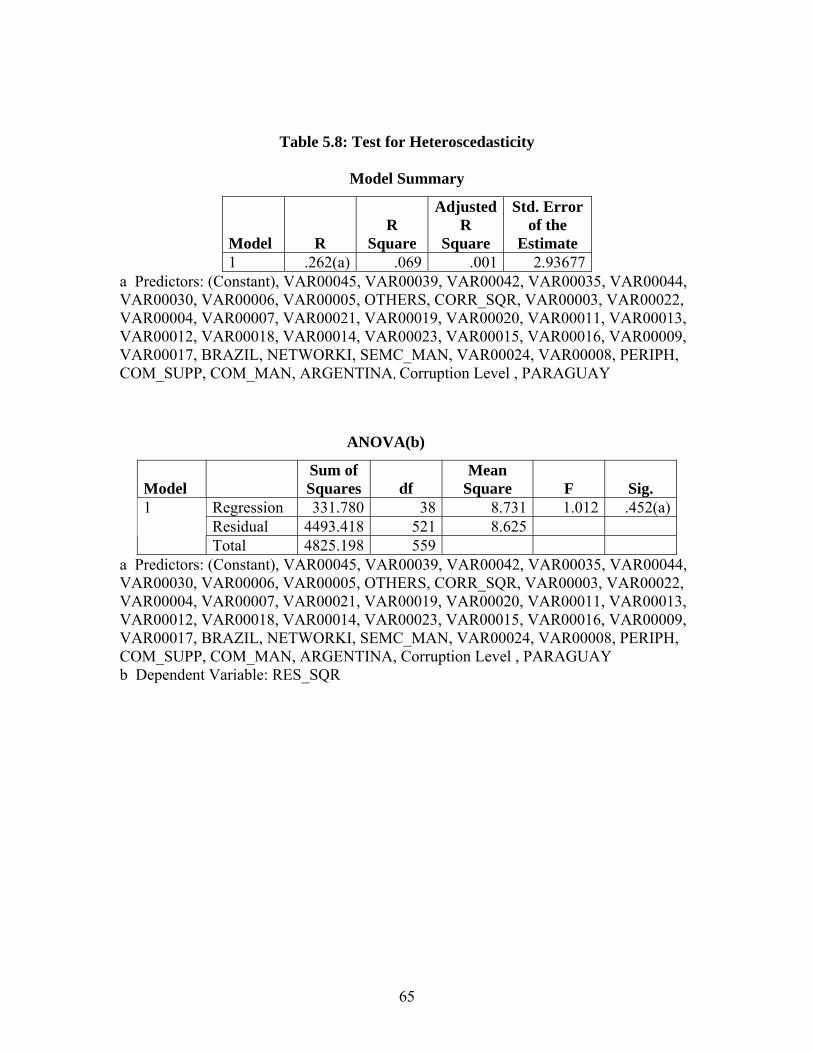
65
Table 5.8: Test for Heteroscedasticity
Model Summary
Model R R
Square
Adjusted R
Square
Std. Error of the
Estimate 1 .262(a) .069 .001 2.93677
a Predictors: (Constant), VAR00045, VAR00039, VAR00042, VAR00035, VAR00044, VAR00030, VAR00006, VAR00005, OTHERS, CORR_SQR, VAR00003, VAR00022, VAR00004, VAR00007, VAR00021, VAR00019, VAR00020, VAR00011, VAR00013, VAR00012, VAR00018, VAR00014, VAR00023, VAR00015, VAR00016, VAR00009, VAR00017, BRAZIL, NETWORKI, SEMC_MAN, VAR00024, VAR00008, PERIPH, COM_SUPP, COM_MAN, ARGENTINA, Corruption Level , PARAGUAY
ANOVA(b)
Model Sum of Squares df
Mean Square F Sig.
Regression 331.780 38 8.731 1.012 .452(a)Residual 4493.418 521 8.625
1 Total 4825.198 559
a Predictors: (Constant), VAR00045, VAR00039, VAR00042, VAR00035, VAR00044, VAR00030, VAR00006, VAR00005, OTHERS, CORR_SQR, VAR00003, VAR00022, VAR00004, VAR00007, VAR00021, VAR00019, VAR00020, VAR00011, VAR00013, VAR00012, VAR00018, VAR00014, VAR00023, VAR00015, VAR00016, VAR00009, VAR00017, BRAZIL, NETWORKI, SEMC_MAN, VAR00024, VAR00008, PERIPH, COM_SUPP, COM_MAN, ARGENTINA, Corruption Level , PARAGUAY b Dependent Variable: RES_SQR
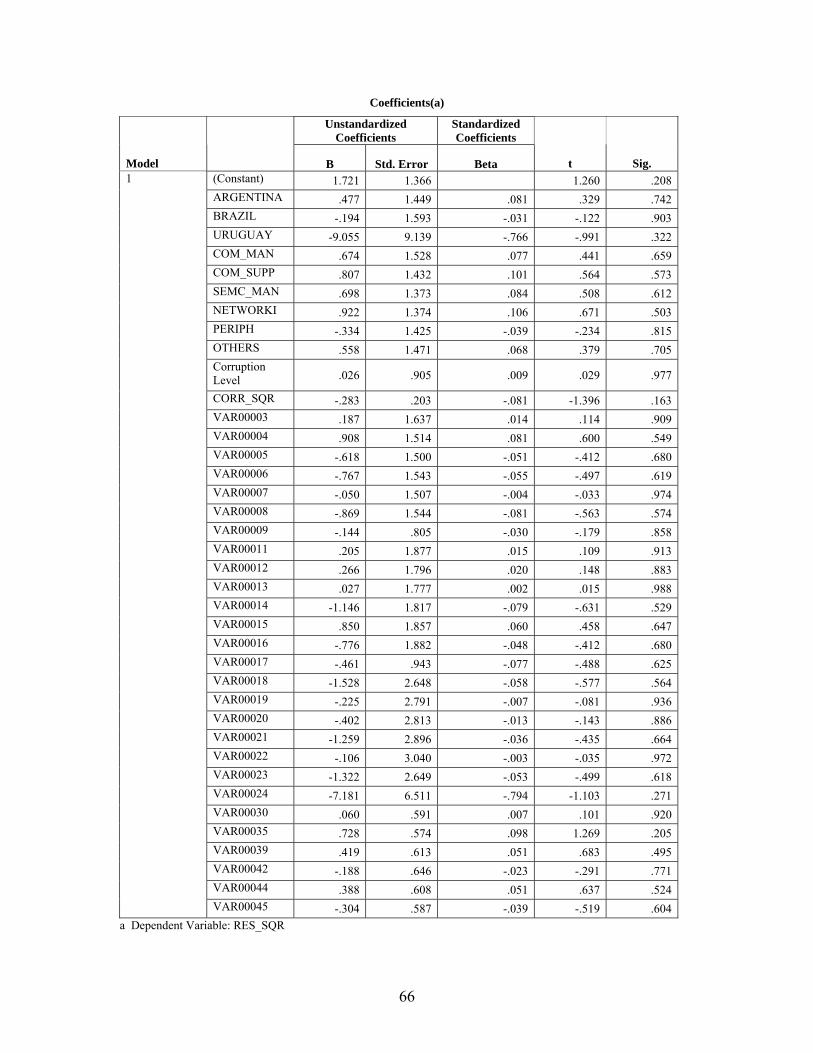
66
Coefficients(a)
Unstandardized Coefficients
Standardized Coefficients
Model B Std. Error Beta t Sig. (Constant) 1.721 1.366 1.260 .208ARGENTINA .477 1.449 .081 .329 .742BRAZIL -.194 1.593 -.031 -.122 .903URUGUAY -9.055 9.139 -.766 -.991 .322COM_MAN .674 1.528 .077 .441 .659COM_SUPP .807 1.432 .101 .564 .573SEMC_MAN .698 1.373 .084 .508 .612NETWORKI .922 1.374 .106 .671 .503PERIPH -.334 1.425 -.039 -.234 .815OTHERS .558 1.471 .068 .379 .705Corruption Level .026 .905 .009 .029 .977
CORR_SQR -.283 .203 -.081 -1.396 .163VAR00003 .187 1.637 .014 .114 .909VAR00004 .908 1.514 .081 .600 .549VAR00005 -.618 1.500 -.051 -.412 .680VAR00006 -.767 1.543 -.055 -.497 .619VAR00007 -.050 1.507 -.004 -.033 .974VAR00008 -.869 1.544 -.081 -.563 .574VAR00009 -.144 .805 -.030 -.179 .858VAR00011 .205 1.877 .015 .109 .913VAR00012 .266 1.796 .020 .148 .883VAR00013 .027 1.777 .002 .015 .988VAR00014 -1.146 1.817 -.079 -.631 .529VAR00015 .850 1.857 .060 .458 .647VAR00016 -.776 1.882 -.048 -.412 .680VAR00017 -.461 .943 -.077 -.488 .625VAR00018 -1.528 2.648 -.058 -.577 .564VAR00019 -.225 2.791 -.007 -.081 .936VAR00020 -.402 2.813 -.013 -.143 .886VAR00021 -1.259 2.896 -.036 -.435 .664VAR00022 -.106 3.040 -.003 -.035 .972VAR00023 -1.322 2.649 -.053 -.499 .618VAR00024 -7.181 6.511 -.794 -1.103 .271VAR00030 .060 .591 .007 .101 .920VAR00035 .728 .574 .098 1.269 .205VAR00039 .419 .613 .051 .683 .495VAR00042 -.188 .646 -.023 -.291 .771VAR00044 .388 .608 .051 .637 .524
1
VAR00045 -.304 .587 -.039 -.519 .604a Dependent Variable: RES_SQR
67
According to White’s test under the null hypothesis that there is no
heteroscedasticity, the sample size times the R2 obtained from the auxiliary regression
asymptotically follows the chi-square distribution with degrees of freedom equal to the
number of regressors in the auxiliary regression. In this case, we have R2 = 0.069 and
degrees of freedom are 38; therefore, n* R2 = 560*0.069 = 38.64. The 5% critical chi-
square value for 38 degree of freedoms is 53.38 and at 10% it is 49.51. Also, none of the
coefficients of the variables in auxiliary regression are significant. We conclude that there
is no heteroscedasticity, and we can safely pool the data for further analysis.
5.5 Testing for Endogeneity
To test the endogeneity we first run the following regression:
ikikk
jijj
i uXXZ +++= ∑∑ δδδ1
Where iZ = Corruption Level (dependent variable)
jiX = Dummy variables for country (independent variables)
j = Brazil, Argentina, and Uruguay
Note that Paraguay is used as the base country.
kiX = Dummy variables for industry sectors (independent variables)
k = All the industry sectors except software
Note that Software is used as the base industry sector.
iu = Residuals
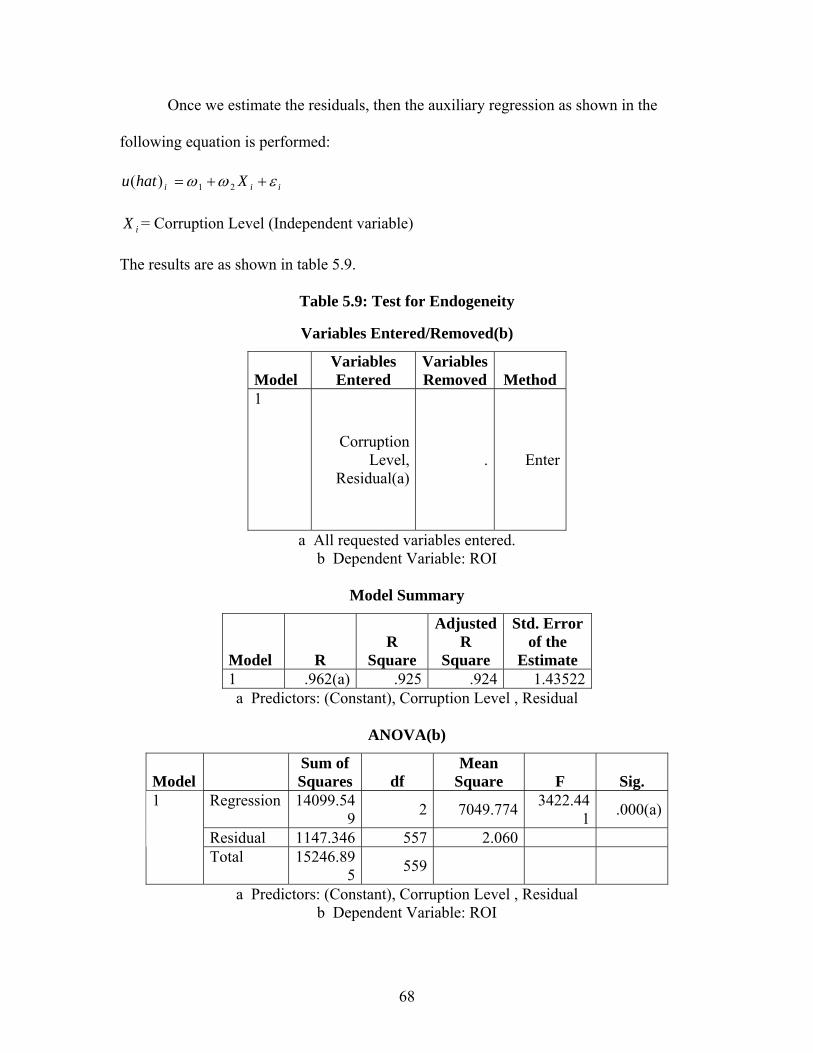
68
Once we estimate the residuals, then the auxiliary regression as shown in the
following equation is performed:
iii Xhatu εωω ++= 21)(
iX = Corruption Level (Independent variable)
The results are as shown in table 5.9.
Table 5.9: Test for Endogeneity
Variables Entered/Removed(b)
Model Variables Entered
Variables Removed Method
1
Corruption Level,
Residual(a). Enter
a All requested variables entered. b Dependent Variable: ROI
Model Summary
Model R R
Square
Adjusted R
Square
Std. Error of the
Estimate 1 .962(a) .925 .924 1.43522 a Predictors: (Constant), Corruption Level , Residual
ANOVA(b)
Model Sum of Squares df
Mean Square F Sig.
Regression 14099.549 2 7049.774 3422.44
1 .000(a)
Residual 1147.346 557 2.060
1
Total 15246.895 559
a Predictors: (Constant), Corruption Level , Residual b Dependent Variable: ROI
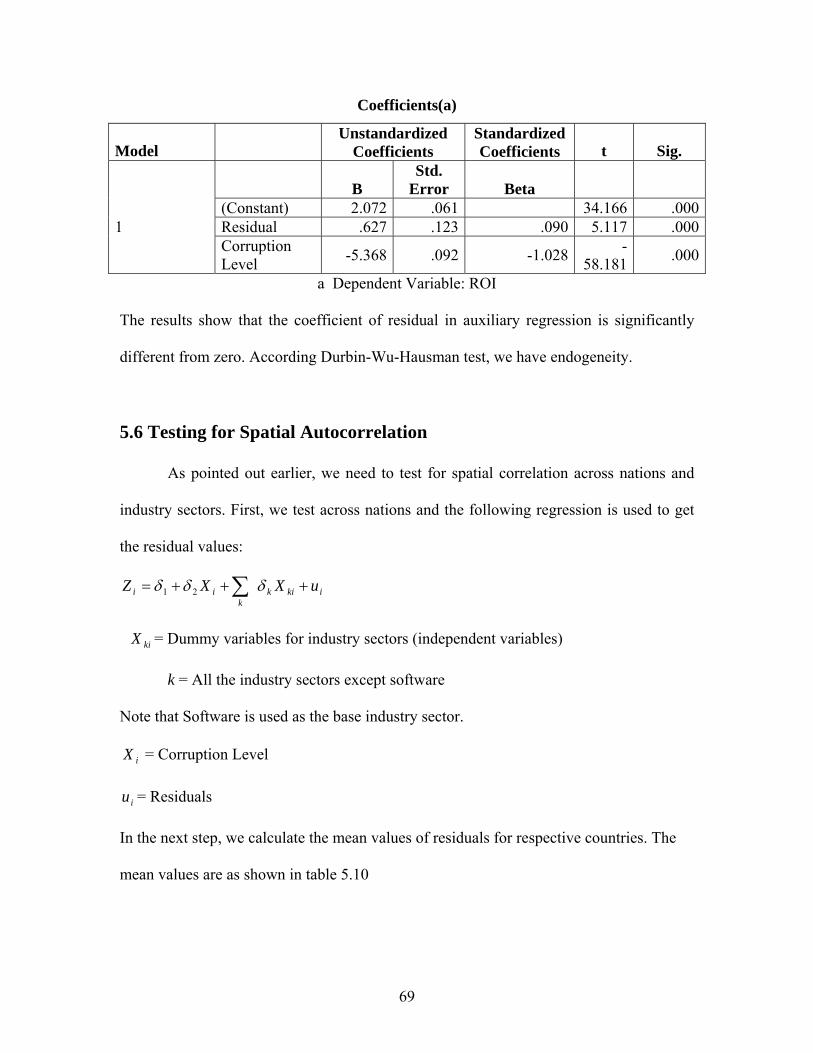
69
Coefficients(a)
Model Unstandardized
Coefficients Standardized Coefficients t Sig.
B Std.
Error Beta (Constant) 2.072 .061 34.166 .000Residual .627 .123 .090 5.117 .000
1
Corruption Level -5.368 .092 -1.028 -
58.181 .000
a Dependent Variable: ROI The results show that the coefficient of residual in auxiliary regression is significantly
different from zero. According Durbin-Wu-Hausman test, we have endogeneity.
5.6 Testing for Spatial Autocorrelation
As pointed out earlier, we need to test for spatial correlation across nations and
industry sectors. First, we test across nations and the following regression is used to get
the residual values:
ikikk
ii uXXZ +++= ∑ δδδ 21
kiX = Dummy variables for industry sectors (independent variables)
k = All the industry sectors except software
Note that Software is used as the base industry sector.
iX = Corruption Level
iu = Residuals
In the next step, we calculate the mean values of residuals for respective countries. The
mean values are as shown in table 5.10
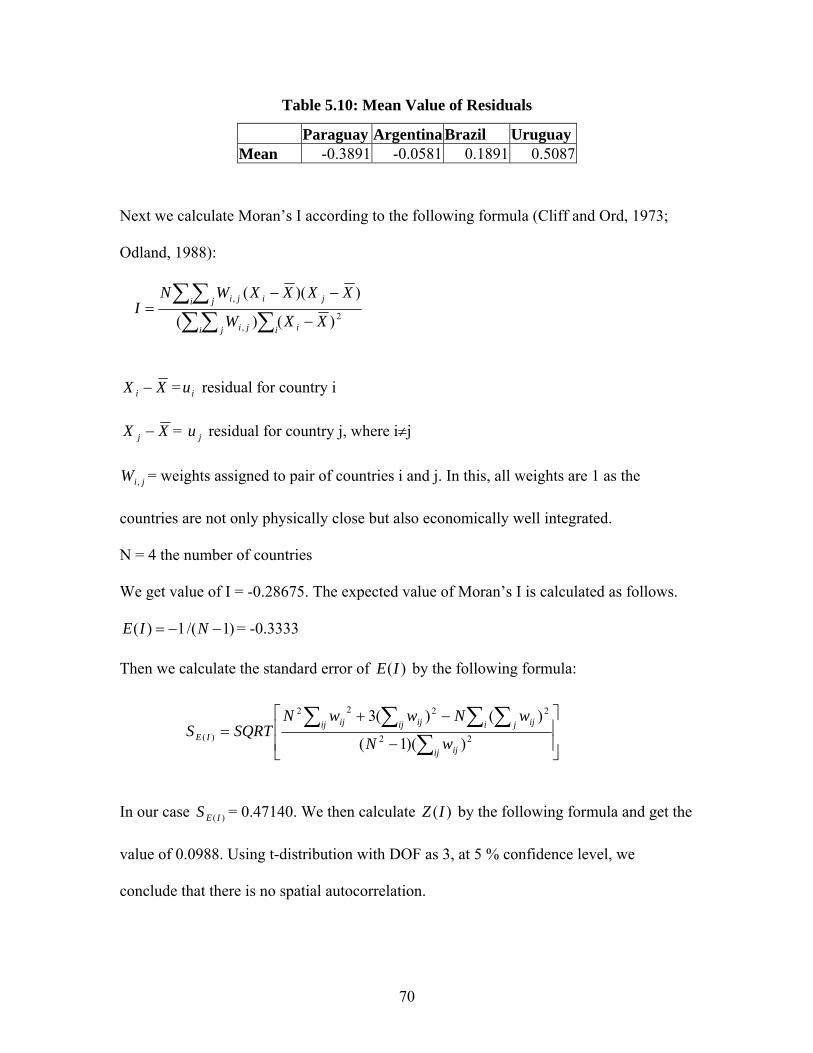
70
Table 5.10: Mean Value of Residuals
Paraguay Argentina Brazil Uruguay Mean -0.3891 -0.0581 0.1891 0.5087
Next we calculate Moran’s I according to the following formula (Cliff and Ord, 1973;
Odland, 1988):
XX i − = iu residual for country i
XX j − = ju residual for country j, where i≠j
jiW , = weights assigned to pair of countries i and j. In this, all weights are 1 as the
countries are not only physically close but also economically well integrated.
N = 4 the number of countries
We get value of I = -0.28675. The expected value of Moran’s I is calculated as follows.
)1/(1)( −−= NIE = -0.3333
Then we calculate the standard error of )(IE by the following formula:
In our case )( IES = 0.47140. We then calculate )(IZ by the following formula and get the
value of 0.0988. Using t-distribution with DOF as 3, at 5 % confidence level, we
conclude that there is no spatial autocorrelation.
∑∑ ∑∑∑
−
−−=
i j i iji
i j jiji
XXW
XXXXWNI 2
,
,
)()(
))((
⎥⎥
⎦
⎤
⎢⎢
⎣
⎡
−
−+=
∑∑ ∑ ∑ ∑
ij ij
ij ij i j ijijijIE wN
wNwwNSQRTS 22
2222
)( ))(1(
)()(3
71
Now we test for the spatial autocorrelation for industry variables. For this we use the
following regression to find the residuals:
ijijj
ii uXXZ +++= ∑ δδδ 21
jiX = Dummy variables for country (independent variables)
j = All the countries except Paraguay
Note that Paraguay is used as the base country.
iX = Corruption Level
iu = Residuals
We found that the mean values for residuals are zero for all industry sectors;
therefore, we need not test further and can safely say that there is no spatial
autocorrelation across industry sectors.
5.7 Hypothesis Testing
5.7.1 ROI and Level of Corruption
H1α1: Firms that pay a higher rate of bribes have a slower rate of growth.
To the test the relationship between the rate of bribes - level of corruption - and
rate of growth of firms, we performed a regression with ROI as the dependent variable
and the construct called Corruption Level as identified in factor analysis. The results are
shown in tables 5.11.
)(
)()(IESIEIIZ −
=
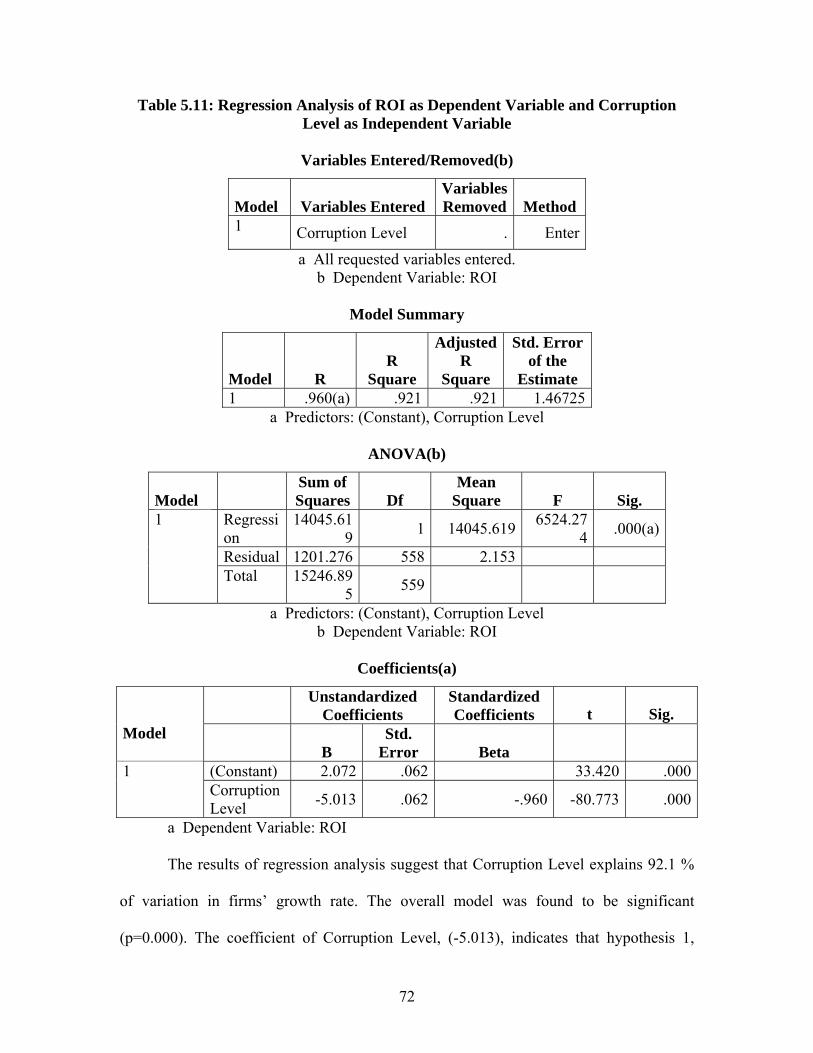
72
Table 5.11: Regression Analysis of ROI as Dependent Variable and Corruption Level as Independent Variable
Variables Entered/Removed(b)
Model Variables Entered Variables Removed Method
1 Corruption Level . Enter
a All requested variables entered. b Dependent Variable: ROI
Model Summary
Model R R
Square
Adjusted R
Square
Std. Error of the
Estimate 1 .960(a) .921 .921 1.46725
a Predictors: (Constant), Corruption Level
ANOVA(b)
Model Sum of Squares Df
Mean Square F Sig.
Regression
14045.619 1 14045.619 6524.27
4 .000(a)
Residual 1201.276 558 2.153
1
Total 15246.895 559
a Predictors: (Constant), Corruption Level b Dependent Variable: ROI
Coefficients(a)
Unstandardized
Coefficients Standardized Coefficients t Sig.
Model B
Std. Error Beta
(Constant) 2.072 .062 33.420 .0001 Corruption
Level -5.013 .062 -.960 -80.773 .000
a Dependent Variable: ROI
The results of regression analysis suggest that Corruption Level explains 92.1 %
of variation in firms’ growth rate. The overall model was found to be significant
(p=0.000). The coefficient of Corruption Level, (-5.013), indicates that hypothesis 1,
73
which states that firms that pay higher rate of bribes have slower rate of growth, is
supported.
5.7.2: The Rent Seeking Behavior and Industry Sectors
H2α1: There are differences in rent-seeking behavior among bureaucrats in different
industry sectors.
To assess the relationship between the industry sector and rent-seeking behavior
of bureaucrats, we first performed ANOVA with Corruption Level as the independent
variable and industry sector as the dependent variable. The results are shown in table
5.12.
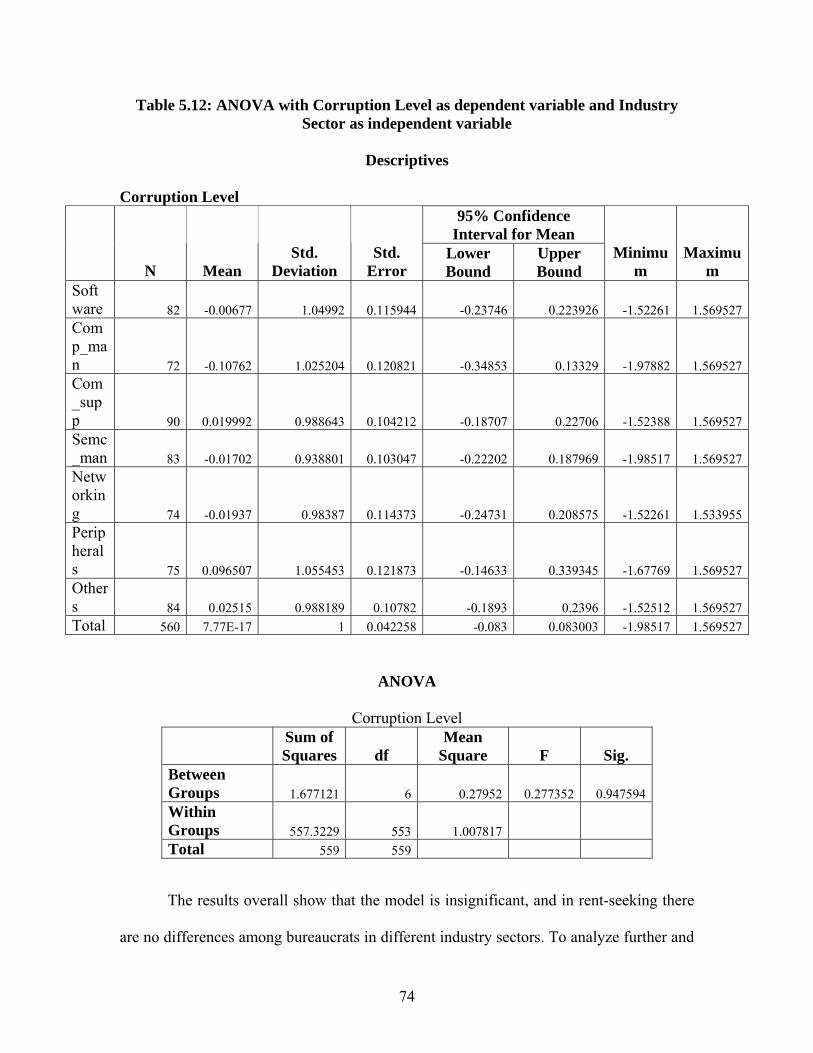
74
Table 5.12: ANOVA with Corruption Level as dependent variable and Industry Sector as independent variable
Descriptives
Corruption Level
95% Confidence Interval for Mean
N Mean Std.
Deviation Std.
Error Lower Bound
Upper Bound
Minimum
Maximum
Software 82 -0.00677 1.04992 0.115944 -0.23746 0.223926 -1.52261 1.569527Comp_man 72 -0.10762 1.025204 0.120821 -0.34853 0.13329 -1.97882 1.569527Com_supp 90 0.019992 0.988643 0.104212 -0.18707 0.22706 -1.52388 1.569527Semc_man 83 -0.01702 0.938801 0.103047 -0.22202 0.187969 -1.98517 1.569527Networking 74 -0.01937 0.98387 0.114373 -0.24731 0.208575 -1.52261 1.533955Peripherals 75 0.096507 1.055453 0.121873 -0.14633 0.339345 -1.67769 1.569527Others 84 0.02515 0.988189 0.10782 -0.1893 0.2396 -1.52512 1.569527Total 560 7.77E-17 1 0.042258 -0.083 0.083003 -1.98517 1.569527
ANOVA
Corruption Level
Sum of Squares df
Mean Square F Sig.
Between Groups 1.677121 6 0.27952 0.277352 0.947594 Within Groups 557.3229 553 1.007817 Total 559 559
The results overall show that the model is insignificant, and in rent-seeking there
are no differences among bureaucrats in different industry sectors. To analyze further and
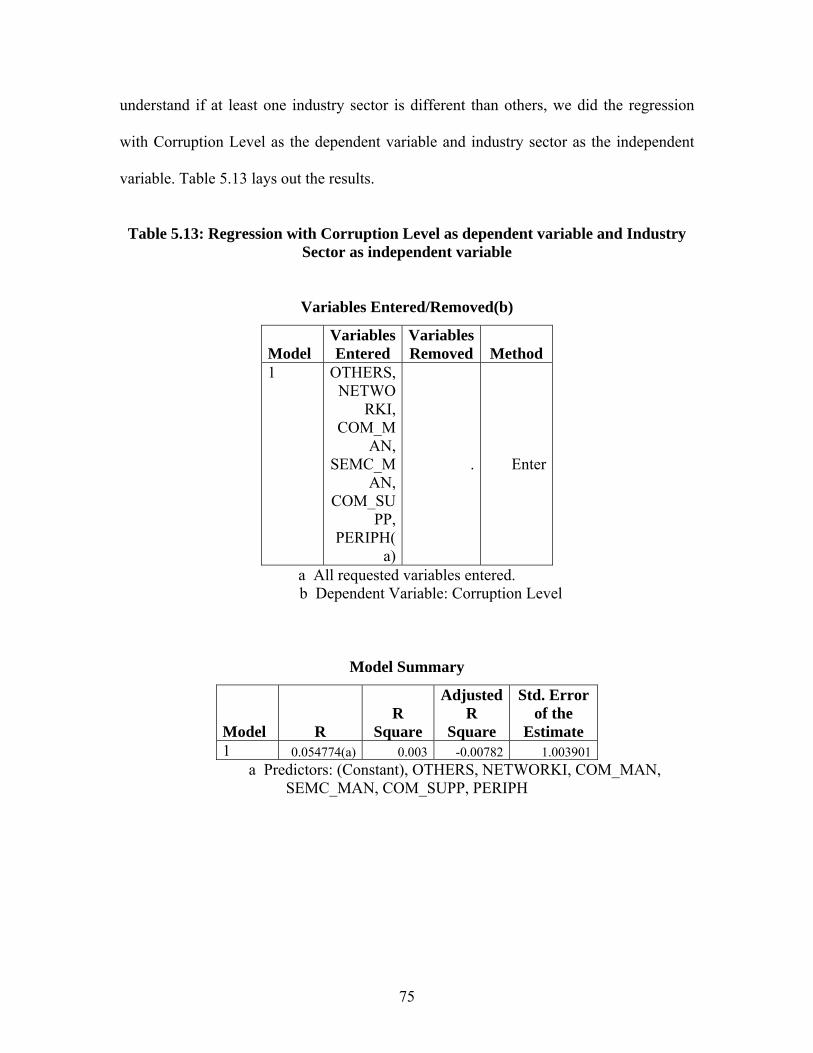
75
understand if at least one industry sector is different than others, we did the regression
with Corruption Level as the dependent variable and industry sector as the independent
variable. Table 5.13 lays out the results.
Table 5.13: Regression with Corruption Level as dependent variable and Industry
Sector as independent variable
Variables Entered/Removed(b)
Model Variables Entered
Variables Removed Method
1 OTHERS, NETWO
RKI, COM_M
AN, SEMC_M
AN, COM_SU
PP, PERIPH(
a)
. Enter
a All requested variables entered. b Dependent Variable: Corruption Level
Model Summary
Model R R
Square
Adjusted R
Square
Std. Error of the
Estimate 1 0.054774(a) 0.003 -0.00782 1.003901
a Predictors: (Constant), OTHERS, NETWORKI, COM_MAN, SEMC_MAN, COM_SUPP, PERIPH
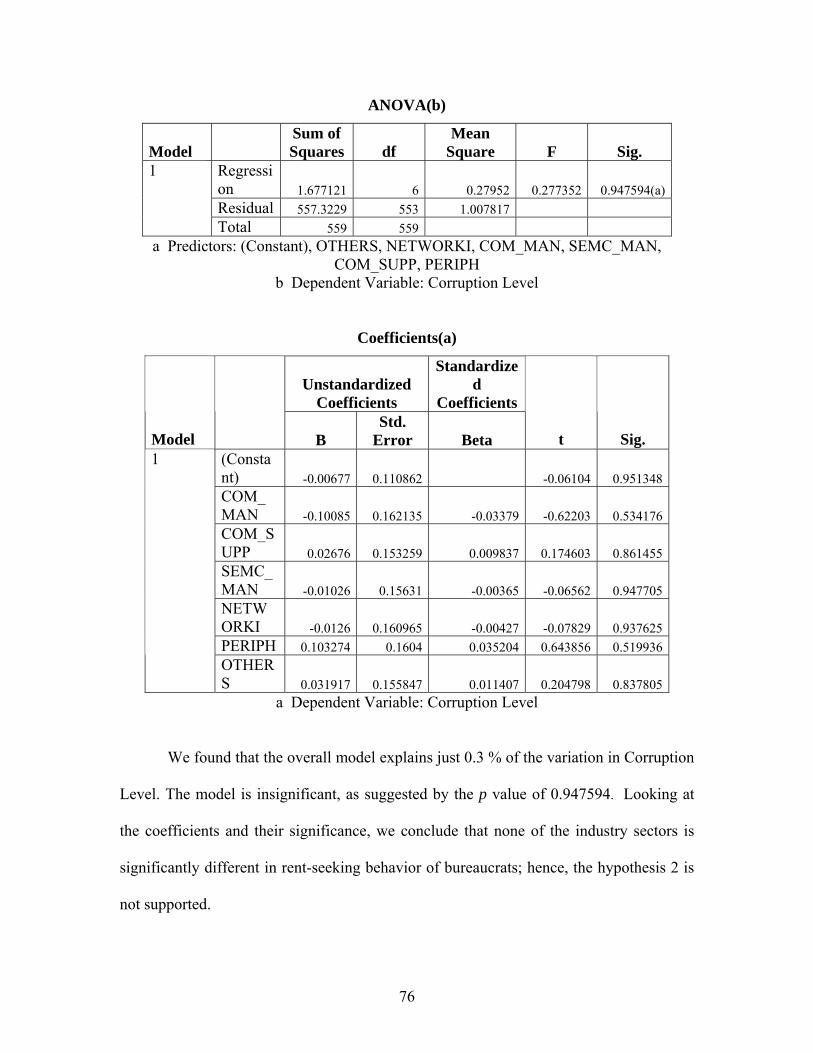
76
ANOVA(b)
Model Sum of Squares df
Mean Square F Sig.
Regression 1.677121 6 0.27952 0.277352 0.947594(a)Residual 557.3229 553 1.007817
1
Total 559 559 a Predictors: (Constant), OTHERS, NETWORKI, COM_MAN, SEMC_MAN,
COM_SUPP, PERIPH b Dependent Variable: Corruption Level
Coefficients(a)
Unstandardized Coefficients
Standardized
Coefficients
Model B Std.
Error Beta t Sig. (Constant) -0.00677 0.110862 -0.06104 0.951348COM_MAN -0.10085 0.162135 -0.03379 -0.62203 0.534176COM_SUPP 0.02676 0.153259 0.009837 0.174603 0.861455SEMC_MAN -0.01026 0.15631 -0.00365 -0.06562 0.947705NETWORKI -0.0126 0.160965 -0.00427 -0.07829 0.937625PERIPH 0.103274 0.1604 0.035204 0.643856 0.519936
1
OTHERS 0.031917 0.155847 0.011407 0.204798 0.837805
a Dependent Variable: Corruption Level
We found that the overall model explains just 0.3 % of the variation in Corruption
Level. The model is insignificant, as suggested by the p value of 0.947594. Looking at
the coefficients and their significance, we conclude that none of the industry sectors is
significantly different in rent-seeking behavior of bureaucrats; hence, the hypothesis 2 is
not supported.
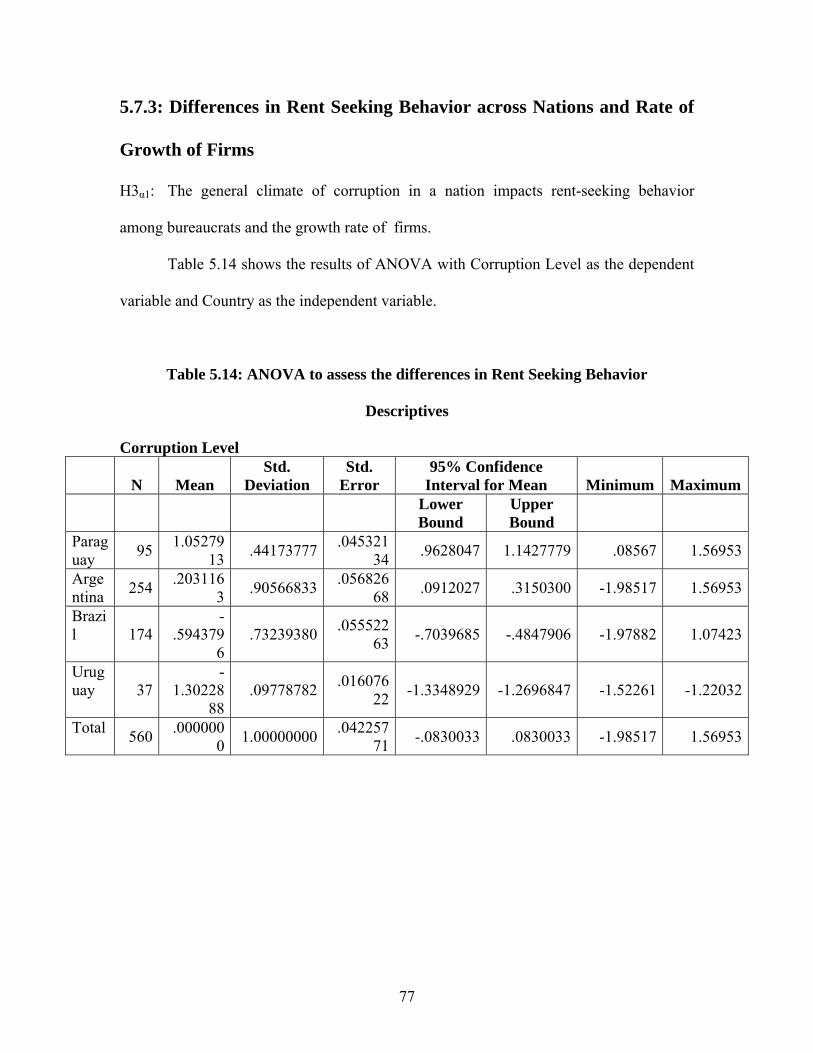
77
5.7.3: Differences in Rent Seeking Behavior across Nations and Rate of
Growth of Firms
H3α1: The general climate of corruption in a nation impacts rent-seeking behavior
among bureaucrats and the growth rate of firms.
Table 5.14 shows the results of ANOVA with Corruption Level as the dependent
variable and Country as the independent variable.
Table 5.14: ANOVA to assess the differences in Rent Seeking Behavior
Descriptives Corruption Level
N Mean Std.
Deviation Std.
Error 95% Confidence
Interval for Mean Minimum Maximum
Lower Bound
Upper Bound
Paraguay 95 1.05279
13 .44173777 .04532134 .9628047 1.1427779 .08567 1.56953
Argentina 254 .203116
3 .90566833 .05682668 .0912027 .3150300 -1.98517 1.56953
Brazil 174
-.594379
6 .73239380 .055522
63 -.7039685 -.4847906 -1.97882 1.07423
Uruguay 37
-1.30228
88 .09778782 .016076
22 -1.3348929 -1.2696847 -1.52261 -1.22032
Total 560 .0000000 1.00000000 .042257
71 -.0830033 .0830033 -1.98517 1.56953

78
ANOVA
Corruption Level
Sum of Squares Df
Mean Square F Sig.
Between Groups 239.997 3 79.999 139.432 .000
Within Groups 319.003 556 .574
Total 559.000 559
The results of ANOVA support the hypothesis 3 that there exist differences
in rent-seeking behavior among bureaucrats in different nations (p=0.000). To take it
further, we performed a regression analysis to Corruption Level as the dependent variable
and country as the independent variable. For this purpose, Uruguay is taken as the base
country. The results of the regression analysis are shown in table 5.15.
Table 5.15: Regression with Corruption Level as dependent variable and Country
as independent variable
Variables Entered/Removed(b)
Model Variables Entered Variables Removed Method
1 URUGUAY, ARGENTINA, BRAZIL(a) . Enter
a All requested variables entered. b Dependent Variable: Corruption Level
Model Summary
Model R R
Square
Adjusted R
Square
Std. Error of the
Estimate 1 .655(a) .429 .426 .75746107
a Predictors: (Constant), URUGUAY, ARGENTINA, BRAZIL
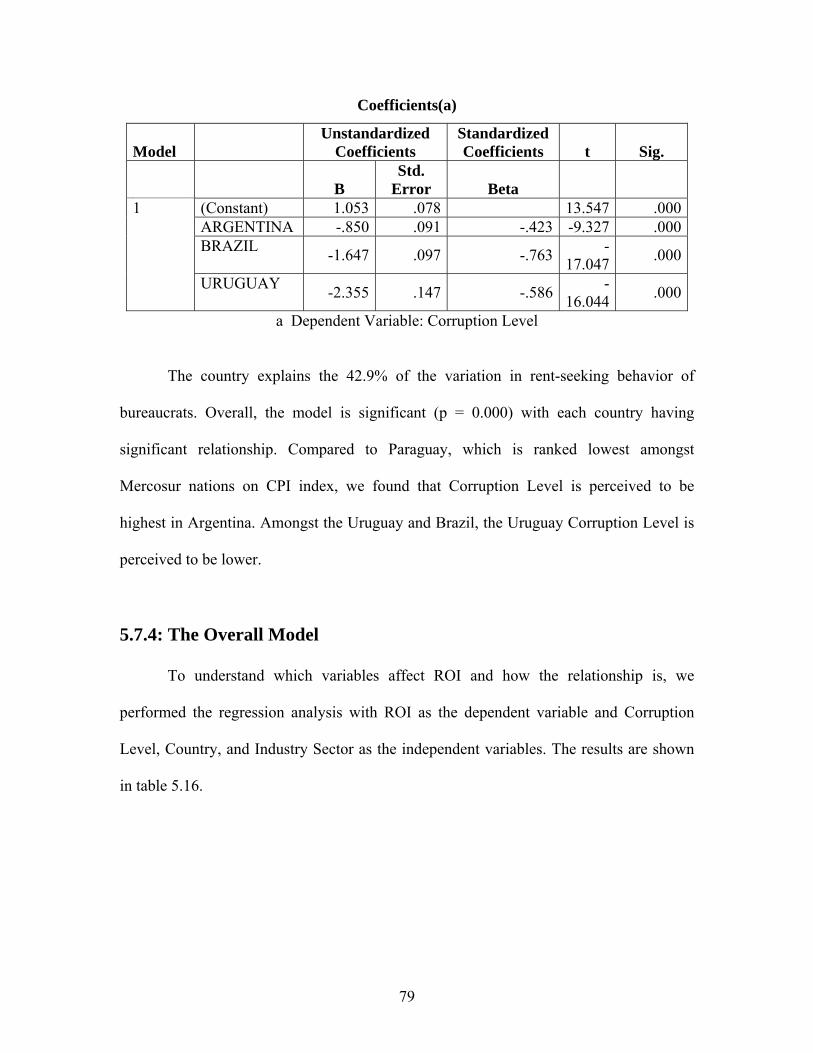
79
Coefficients(a)
Model Unstandardized
Coefficients Standardized Coefficients t Sig.
B Std.
Error Beta (Constant) 1.053 .078 13.547 .000ARGENTINA -.850 .091 -.423 -9.327 .000BRAZIL -1.647 .097 -.763 -
17.047 .000
1
URUGUAY -2.355 .147 -.586 -16.044 .000
a Dependent Variable: Corruption Level
The country explains the 42.9% of the variation in rent-seeking behavior of
bureaucrats. Overall, the model is significant (p = 0.000) with each country having
significant relationship. Compared to Paraguay, which is ranked lowest amongst
Mercosur nations on CPI index, we found that Corruption Level is perceived to be
highest in Argentina. Amongst the Uruguay and Brazil, the Uruguay Corruption Level is
perceived to be lower.
5.7.4: The Overall Model
To understand which variables affect ROI and how the relationship is, we
performed the regression analysis with ROI as the dependent variable and Corruption
Level, Country, and Industry Sector as the independent variables. The results are shown
in table 5.16.

80
Table 5.16: Overall Model with ROI as dependent variable and Corruption Level, Country, and Industry Sector as independent variables
Variables Entered/Removed(b)
Model Variables Entered
Variables Removed Method
1 OTHERS, Corruption Level , NETWO
RKI, COM_M
AN, BRAZIL,
SEMC_MAN,
COM_SUPP,
URUGUAY,
PERIPH, ARGENT
INA(a)
. Enter
a All requested variables entered. b Dependent Variable: ROI
Model Summary
Model R R
Square
Adjusted R
Square
Std. Error of the
Estimate 1 .962(a) .925 .924 1.44110
a Predictors: (Constant), OTHERS, Corruption Level , NETWORKI, COM_MAN, BRAZIL, SEMC_MAN, COM_SUPP, URUGUAY, PERIPH, ARGENTINA

81
ANOVA(b)
Model Sum of Squares Df
Mean Square F Sig.
Regression
14106.742 10 1410.674 679.260 .000(a)
Residual 1140.153 549 2.077
1
Total 15246.895 559
a Predictors: (Constant), OTHERS, Corruption Level , NETWORKI, COM_MAN, BRAZIL, SEMC_MAN, COM_SUPP, URUGUAY, PERIPH, ARGENTINA
b Dependent Variable: ROI
Coefficients(a)
Model Unstandardized
Coefficients Standardized Coefficients t Sig.
B Std.
Error Beta (Constant) 1.429783 0.233695 6.118159 .000COM_MAN -0.09189 0.233207 -0.00589 -0.39402 .694
COM_SUPP 0.028655 0.220157 0.002017 0.130156 .896
SEMC_MAN -0.00238 0.22532 -0.00016 -0.01058 .992
NETWORKI -0.11126 0.233172 -0.00722 -0.47717 .633
PERIPH 0.087352 0.230905 0.005702 0.378305 .705OTHERS -0.23259 0.224065 -0.01592 -1.03806 .300ARGENTINA 0.577531 0.189016 0.055102 3.055455 .002
BRAZIL 1.039265 0.228656 0.092174 4.545105 .000URUGUAY 1.557871 0.34059 0.074165 4.574034 .000
1
Corruption Level -4.74127 0.080936 -0.90784 -58.5804 .000
a Dependent Variable: ROI The overall model explains 92.4 % of the variation in ROI. We also found that the
model is significant (p = 0.00). The Corruption Level and Country variables have a
significant relationship with ROI. Higher coefficients of Uruguay and Brazil suggest that
ROI of firms in these countries are higher. This is the case because we found that the
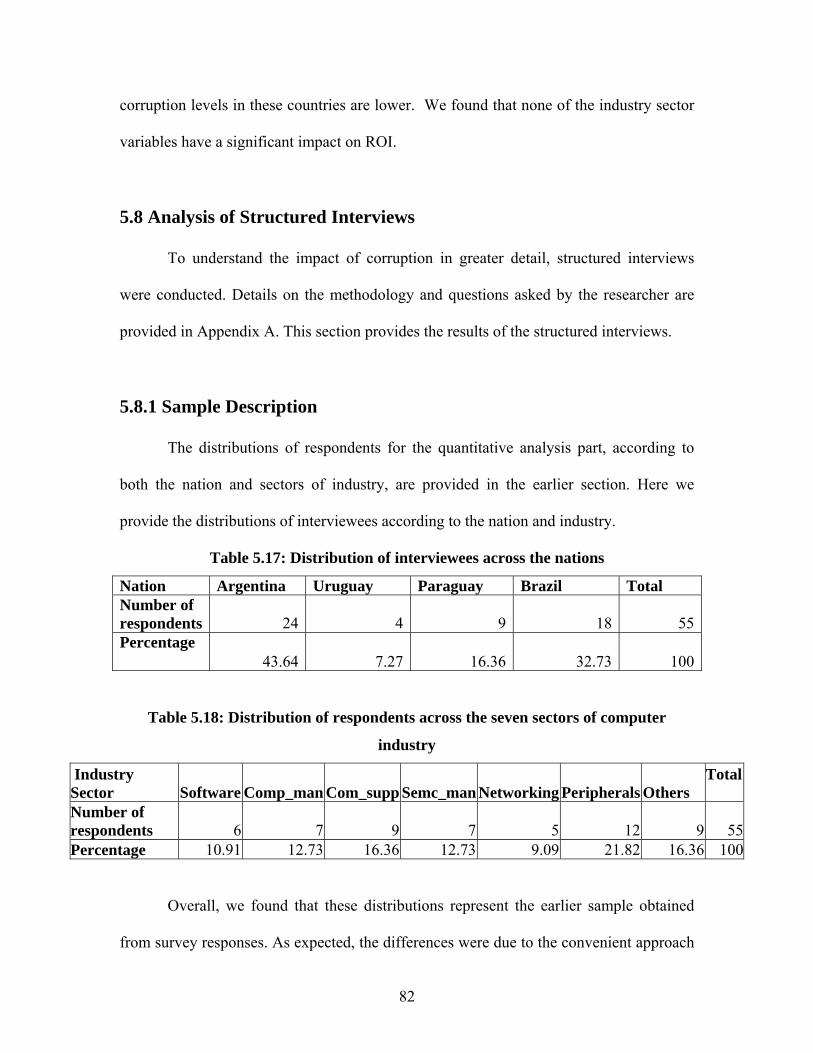
82
corruption levels in these countries are lower. We found that none of the industry sector
variables have a significant impact on ROI.
5.8 Analysis of Structured Interviews
To understand the impact of corruption in greater detail, structured interviews
were conducted. Details on the methodology and questions asked by the researcher are
provided in Appendix A. This section provides the results of the structured interviews.
5.8.1 Sample Description
The distributions of respondents for the quantitative analysis part, according to
both the nation and sectors of industry, are provided in the earlier section. Here we
provide the distributions of interviewees according to the nation and industry.
Table 5.17: Distribution of interviewees across the nations
Nation Argentina Uruguay Paraguay Brazil Total Number of respondents 24 4 9 18 55Percentage
43.64 7.27 16.36 32.73 100
Table 5.18: Distribution of respondents across the seven sectors of computer
industry
Industry Sector Software Comp_man Com_supp Semc_man Networking Peripherals Others
Total
Number of respondents 6 7 9 7 5 12 9 55Percentage 10.91 12.73 16.36 12.73 9.09 21.82 16.36 100
Overall, we found that these distributions represent the earlier sample obtained
from survey responses. As expected, the differences were due to the convenient approach
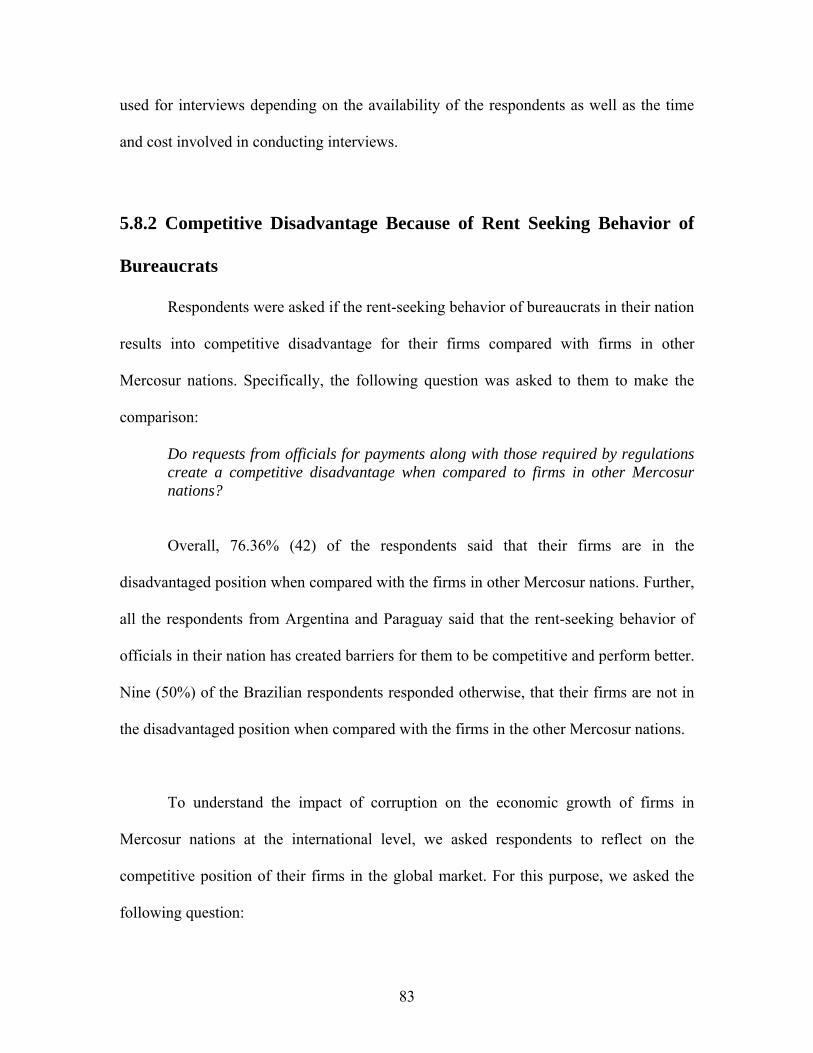
83
used for interviews depending on the availability of the respondents as well as the time
and cost involved in conducting interviews.
5.8.2 Competitive Disadvantage Because of Rent Seeking Behavior of
Bureaucrats
Respondents were asked if the rent-seeking behavior of bureaucrats in their nation
results into competitive disadvantage for their firms compared with firms in other
Mercosur nations. Specifically, the following question was asked to them to make the
comparison:
Do requests from officials for payments along with those required by regulations create a competitive disadvantage when compared to firms in other Mercosur nations?
Overall, 76.36% (42) of the respondents said that their firms are in the
disadvantaged position when compared with the firms in other Mercosur nations. Further,
all the respondents from Argentina and Paraguay said that the rent-seeking behavior of
officials in their nation has created barriers for them to be competitive and perform better.
Nine (50%) of the Brazilian respondents responded otherwise, that their firms are not in
the disadvantaged position when compared with the firms in the other Mercosur nations.
To understand the impact of corruption on the economic growth of firms in
Mercosur nations at the international level, we asked respondents to reflect on the
competitive position of their firms in the global market. For this purpose, we asked the
following question:
84
Do requests from officials for payments along with those required by regulations create a competitive disadvantage in the global market?
Pooled across nations, 23.63% (13) of the respondents feel that the rent-seeking
behavior of the bureaucrats did not hamper competitive position of their firms in the
global market is. All the respondents (4) from Uruguay said that at the international level,
their firms’ competitive position is unaffected by corruption in their country. Rest 9
(16.36%) are from Brazil who said that the competitive position of their firm is not
disadvantaged due to corruption in their country.
5.8.3 Corruption Level in Computer Industry
We asked the following question to understand whether respondents recognize
that rent-seeking in their industry is different from other industries.
Do you perceive requests from officials for payments along with those required by regulations as more or less than in other industries?
We found that little over 75% (76.36%) of the respondents feel that rent-seeking
behavior of the bureaucrats in their industry is more than the other industries. All the
respondents in Computer Supply, Peripherals, Networking, and Computer Manufacturing
sectors said that the corruption in their industry is more than the corruption in other
industries.
5.8.4 Changes in Corruption Level
To understand the changes in rent-seeking behavior of officials over the period of
time, we asked two questions:
85
Do you perceive requests from officials for payments along with those required by regulations as increasing, decreasing, or about the same as in the past?
Do you think that requests from officials for payments in addition to those required by regulations as more, less, or about the same in your country when compared to other Mercosur nations?
The first question refers to how respondents see the change in corruption over the
period of time for their industry. 60% (33 of 55) of the respondents felt that the
corruption in their industry has increased over the period of time; 30.9% said that the
corruption level is about the same as in the past, and the rest said it has decreased. All the
respondents from Paraguay said that the corruption in their industry has increased. With
respect to industry sector, five respondents from software sector said that corruption has
decreased in their industry.
When asked to compare with other nations, respondents from Paraguay (9) said
that the rent-seeking behavior of bureaucrats in their nation has changed for the worse.
Interesting enough, respondents from Uruguay said that the rent-seeking behavior of
bureaucrats in their nation has changed positively when compared to other Mercosur
nations.
To a large degree, the closed-ended questions were intended to elicit information
that could corroborate the data gathered through the survey test instrument. At the same
time, these inquiries should create a wider perspective regarding subjective factors such
as competitive advantage. In general, the closed-ended questions were anticipated to
86
produce a ‘yes or no’ response. The interviewees, however, were not discouraged from
elaborating on their response.
5.8.5 Analysis of Open Ended Questions
To understand the issues involved in corruption, we asked respondents four open
ended questions. The responses were transcribed and common emergent themes were
identified for each one of them. Here we provide the analysis of responses to open ended
questions.
Considering the various areas of operation - building construction, employment, importing or exporting - of your industry’s firm, in what area is a request from an official for payments other than those required by regulations most likely to occur?
The above question was asked to respondents so that they can reflect upon areas
of operations where they are facing the problem of corruption the most. The intention
was not to rank the areas of operations but to get the idea on problems faced by firms. In
addition, respondents were free to quote any other area of operations apart from
mentioned in the question in which they are facing hurdles.
More than 90% of the respondents said that there is a prevalent and widespread
corruption in the field of land acquisition to build new facilities. In the same activity,
getting clearances for new facilities firms need to pay bribes to officials so that the work
goes on smoothly. Same number of respondents also raised the issue of number of
clearances required and different stages of projects at which they need to approach
officials for clearances. Interestingly, they suggested that there should be one window
87
clearance scheme. Few of the respondents said that there should be more transparency
from the government side to deal with expansion of the existing facilities or build new
facilities.
Next, little over 85% of the respondents from computer manufacturing, computer
supply, semiconductor manufacturing and peripherals said that they face problems in
importing and exporting goods. To get these activities done smoothly, quite often, they
have to pay bribes to officials.
Do you believe that government policies and officials support your industry by removing barriers to commerce?
To understand the problems faced by firms when dealing in regional (Mercosur)
and international markets, we asked the question as stated above. Respondents were free
to quote any particular nations name in which they are facing problems and suggest any
changes or improvements.
Business executives felt that they are not able to exploit the trade agreements
among Mercosur nations. Especially, firms in Uruguay and Brazil complained that while
dealing with officials in Paraguay they have to pay bribes to officials. However, they are
very happy when dealing in countries outside Mercosur region. Quite a few of them
suggested that the countries in Mercosur region should take care that the trade
agreements must be implemented strictly. The primary theme that came out is the fact
88
that to compete in the international market all the countries in Mercosur region should
stand together.
To investigate the perceptions of respondents on how government should deal
with corruption, we asked them to suggest any changes and improvements. Specifically
we asked the following question:
Do you believe that your industry would be more prosperous if government operations
were more closely supervised or regulated?
All the respondents said that the government should closely supervise the officials
more closely and be transparent on the corruption cases. They suggested that corruption
cases against officials should be made public so that other officials learn from them.
Interestingly, 80% of the respondents said that the supervision or regulations are
not the ultimate solutions as these may increase burden on officials and firms both. Also,
they fear that officials may find ways and means to extract rents. Rather, sweeping
changes are required to deal with the issue of corruption and increase the efficiency of
government setup. Some of them suggested policies like staff rotation and
implementation of E-governance.
The next question was to understand the awareness of corruption in the industry.
Are you aware of any experiences of other firms resulting in the firm suffering economic harm from requests from officials for payments in addition to those required by regulations?
89
Very likely, we found that all the respondents were aware of the corrupt dealings
in which the other firms were forced/unforced. However, 40% respondents from said that
such dealing by other firms were unforced. Thus, they raised the issue that firms should
be strict in dealing with corrupt officials. They believe that if all firms in industry stand
together then corruption can be wiped out totally.
Finally, 95% of the respondents felt that nothing less that sustained campaign
against corruption will help them to wipe it and achieve desired economic growth.
5.9 Discussion
The purpose of this thesis was to conduct an in-depth examination of corruption
in the Mercosur nations and its implications for economic development using an
econometric approach. In the process, we measured the perceived level of corruption in
four nations and seven industry sectors. Our methodology enabled us to combine relevant
aspects of mathematics, economics, and statistics in an effort to develop an econometric
model explaining the impact of corruption on the economic development of the four
Mercosur nations - Brazil, Argentina, Uruguay, and Paraguay.
As pointed out in the literature review section of the thesis, the various corruption
indices suffer from different lacunae. In this research, we developed an index called
“Corruption Level.” The index consists of events of corruption, number of such events,
difficulty in completing projects due to such events, including the delays and payments
90
made to officials in project planning, competitive position of firms due to payment/non-
payment to officials, and difficulty in taking advantages of trading arrangements with
other Mercosur nations due to corruption in other Mercosur nations. This index was
developed through rigorous statistical analysis. Our results showed that the reliability of
the scale of the index is very well above the accepted level. We also made sure that the
scale items for the index and the index, as a whole is valid.
We proposed that the firms operating in the environment characterized by high
level of corruption should have slower rate of growth. Our result indicates that the higher
the Corruption Level measured by the index, the lower is the growth rate of firms. There
are a number of studies showing how corruption affects the growth rate of the GDP, level
of investments, and allocation of resources. Their approach and conclusions are at the
macroeconomic level. However, many other factors influence the GDP, level of
investments, and allocation of resources. We took this path of research to the next level
and showed that all these effects come from the micro level. In the micro level context,
such as at the firm level studies, our results are similar to the results of Gaviria (2002)
and suggest that the impact of corruption is significant at the firm level also.
While investigating the firm level effects, we proposed that within an industry
there are no differences in rent seeking behavior across different sectors of the industry.
For this purpose, we took up the computer industry and considered seven different sectors
of the industry. In many developing nations software, semiconductor manufacturing, and
computer manufacturing firms are doing excellent contributions to the economy. Firms in
these sectors are having direct and indirect effects on the economic growth rate.
91
Additionally, our aim helped us to control for business environments. For example, the
business environment for a software firm can be significantly different from the firm in
computer manufacturing or computer supply or peripherals sector of the industry. The
results indicate that there are no differences in rent-seeking behavior of bureaucrats in
different industry sectors. However, the analysis of close-ended questions indicates that
the corruption in computer industry is more than the corruption in other industries.
These results on corruption in computer industry could be because of the
centralized decision making in the government. Decisions regarding different sectors of
the industry are taken by one central office.
Next, we proposed that there are differences in rent-seeking behavior of
bureaucrats across nations and these differences affect the growth rate of firms. We
analyzed this in two stages. First we investigated the differences across nations and then
tested the overall model to how the growth rate of firms get affected.
We found that significant differences exist in rent-seeking behavior of bureaucrats
across nations. Specifically, we found Uruguay to be the least corrupt followed by Brazil,
Argentina, and Paraguay. Our results are similar to the CPI index, which rates Paraguay
to be the most corrupt followed by Argentina, Brazil, and Uruguay. Interestingly, we
found that little over three-quarters of the respondents from structured interviews felt that
the corruption level in their country is creating competitive disadvantage when compared
with other Mercosur nations. When comparing the results from the structured interviews
92
with the results of the statistical analysis we found, once again, that respondents from
Paraguay feel that corruption in their country is more than in other Mercosur nations.
These results, again, are comparable to available corruption indices.
While investigating the impact of differences in rent-seeking behavior across
nations on growth rate ROI, we found that this effect is significant. Our overall model
shows that if a firm is situated in Uruguay then it is more likely to have higher growth
rate as compared to the firms located in other Mercosur nations. On the other end, if a
firm is located in Paraguay then it is more likely to have lowest growth when compared
with firms in other Mercosur nations. Firms in Brazil and Argentina lie in between these
two extremes of the continuum.
In terms of the global competitiveness of the firms, our results suggest that the
firms in Mercosur nations are at disadvantaged position due to corruption in the region.
To understand the issues involved we need to look at regional factors. Treisman (2000)
and Gaviria (2002) pointed out probable causes of corruption. These causes come from
the three domains: Political environment, Rules and Regulations, and Historical and
Cultural factors.
In this chapter, we dwelt upon the discussion of the results. Finally, we move onto
the last chapter on implications, limitations, and future research directions.
93
Chapter 6
IMPLICATIONS, LIMITATIONS, AND FUTURE RESEARCH
DIRECTIONS
6.1 Contribution and Implications
Measuring corruption in itself is a difficult task. Various corruption indices are
available. However, we demonstrated the problems associated with these indices. In this
study, we developed an index to measure the level of corruption. This index is based on
rigorous statistical analysis, which showed the reliability of index. We also showed the
validity of index. This has an interesting contribution for managers and academicians.
Most of the corruption indices are at the generic level. The index developed in this study
is useful for managers to understand the level of corruption in their own industry. Based
on the output of this, they can take actions in the interest of their firm and industry as a
whole. Academicians can use this survey to measure the level of corruption at the
industry or firm level. As pointed out by our results, we must understand the firm level
impact of corruption. The index developed in this study will be very useful in future
research studies.
Almost all the researchers investigated the impact of corruption at the
macroeconomic level in terms of GDP growth rate, level of investments, and distribution
of resources. Our study departs from the traditional way of research done on the impact
of corruption. We hypothesized that corruption do have significant impact at the firm
level. Our results showed that the corruption level impacts rate of growth of firms. This
94
proves a very important point highlighted in this research that firms should be aware of
level of corruption in their industry and corruption impacts their competitive position
adversely in national and international markets. The research also suggests that there is
no change in the perception of corruption in the Mercosur region and level of corruption
in the region is hampering the growth rate of firms. Hence, there is a need to understand
the causes of corruption.
The output of this research has important implications for policy formation at
national and international levels, as well as for multinational firms operating in
environments where corruption often influences governmental and business relations. As
our results show that corruption is persistent in the region. Therefore, as rightly found by
McAdam and Rummel (2004), anti-corruption campaigns must be sustained to be
effective. Although we did not find differences in the rent-seeking approach of
bureaucrats across industry sectors, respondents said that the corruption in their industry
is higher than in other industries. Government can ensure that officials be posted on the
rotation basis so that the level and frequency of bribes come down. On the other hand,
government can make the system transparent by starting in E-governance initiatives.
Research has proved that making the system transparent reduces the corruption.
6.2 Limitations
As every research work has its limitations, the results of this study should also be
interpreted in light of several limitations, with some of the limitations providing
opportunities to pursue further work in the field.
95
This study adopted a cross-sectional data collection method even though the
corruption level in a country might change from time to time. The cost and time
limitations left no choice with the researcher but to adopt a cross-sectional data collection
method.
The generalizability of the study findings is also an issue as we have collected
data from the computer industry only. In future, to understand the issues involved in
corruption in Mercosur nations, the data should be collected across industries.
We have used perceptual measures for measuring corruption. Such ratings are
subjective; therefore, it is interesting to investigate the patterns they show. However,
these perceptual measures are highly susceptible to quirks and biases of the respondents.
Another limitation of this study is the endogeneity of variables; therefore, we
recommend that the interpretation results should be considered in the light of this
limitation. We suggest alternative methods in the future research directions to overcome
this limitation.
The need to obtain ROI from data sources exogenous to the test instrument
created a limitation to the study based on the exclusion of firms privately owned and
firms publicly owned but did not have readily available information regarding earnings or
assets. This limitation affects the representative nature of the data; only firms large
enough to have public records regarding their financial position are included in the study.
96
As a result, micro-capital firms that may be in the start-up phase of business operations
were functionally excluded from the study. This likely created a variable impact on the
data from the different Mercosur nations, with some nations potentially having a business
climate favoring public ownership and disclosure of financial information, while other
nations favor private ownership.
Another limitation in the study is the multiplicity of factors that can affect ROI
other than corruption. The computer industry is relatively volatile; the development and
deployment of new technologies in an environment characterized by rapid change drives
this volatile nature. As a result, an innovative product or service delivery method can
increase ROI even in a corrupt environment. Conversely, poor business management
could result in a lower ROI even in a less corrupt environment. The study is based on the
assumption that in a large sampling, these additional variables will likely cancel each
other out through an indirect averaging process. Based on this assumption, no attempt
was made to include an instrumental variable in the model to account for these factors.
6.3 Future Research Directions
We have not gone on to investigate the causes of corruption. There is an urgent
need to understand and investigate why corruption is persistent in the Mercosur region.
We suggest that future research should investigate the causes of corruption in detail. For
example, future research should inculcate the political environment, rules and
regulations, and historical and cultural differences
97
Future studies should include the time series collection of data on the perception
of corruption. This will help identify the changes in corruption level in a country or
industry. The output of this type of research will provide insightful view on causes and
consequences of corruption. When completed, the governments and businesses will be in
right position to take up the appropriate actions to weed out the corruption.
Further, there is a need to investigate the issues involved in firm characteristics.
This field of research will progress further if the researchers are able to identify which
firms are more susceptible to corruption. For example, which of the firm’s characteristics
like size, history, and customer base make firm indulge into corrupt practices.
In our research, we used the perceptions of business people. We recommend that
future research should include perceptions of government officials also. However, note
that for this purpose, we need to develop a separate scale and the methodology involved
would be very different from the methodologies used in existing studies.
To overcome the problem of endogeneity, we suggest that future research work
should use path analysis approach or structural equations modeling framework.
6.4 Conclusion
Research on the impact of corruption on economic growth focused on
macroeconomic level. None of the studies investigated the firm level effect. To fill this
void, we proposed that corruption does have significant effect on growth rate of firms.
98
Our results showed that the level of corruption in a nation adversely affects the growth
rate of firms. We also demonstrated that the firms are at disadvantaged position due to the
corruption in their nation and industry; hence, there is a need on firms’ part to make the
anti-corruption efforts sustained to weed out the corruption.
Our results showed that there are no differences in rent-seeking behavior of
bureaucrats across industry sectors. However, we also found that the corruption in the
computer industry is higher than other industries. This compels that the future research
should investigate, one the impact of firm characteristics and two, the business
environment of the industry. The results of our study indicate that there are significant
differences in rent-seeking behavior of bureaucrats across nations, which impact the
growth rate of ROI. The analysis of structured interviews indicates to a very limited
extent the changes in corruption levels over the period of time. To deal with the menace
of corruption, we need to work on identifying the causes of corruption.
99
REFERENCES
2003 Annual Report. Economic Freedom Network. Retrieved online April 27, 2004:
http://www.freetheworld.com/2003/1EFW2003ch1.pdf.
Antwi, Adarkway and John Adams (2003). Rent-Seeking Behavior And Its Economic
Costs In Urban Land Transformations in Accra, Ghana. Urban Studies, 40(10),
2083-2098.
Assane, Dieto and Abbas Grammy (2003). Institutional Framework And Economic
Development: International Evidence. Applied Economics. 35(17), 1811-1817.
Burgeut, Roberto and Yeon-Koo Che (2004). Competitive Procurement With Corruption.
Rand Journal of Economics, 35(1), 50-69.
Churchill, G.A. (1994), Marketing Research Methodological Foundations 6th ed. Dryden.
Cliff, A. D. and Ord, J.K, (1973). “Spatial Auto Correlation”. Sage Publications, London.
Colombatto, Enrico (2001). Discretionary Power, Rent-Seeking, and Corruption, ICER
Working Paper, Retrieved online April 1, 2004
http://www.icer.it/docs/wp2001/EC24-01.pdf.
Cooper, D.R. and Emory, C.W. (1995). Business Research Methods. 5th Edition, Irwin.
Corruption: Causes, Consequences and Agenda For Further Research (1998). Finance &
Development 35(1), 11-13.
Corruption Monitoring System. Coalition 2000. Retrieved online April 27, 2004:
http://www.online.bg/coalition2000/eng/monitor.htm#2.
Coupet, Ernst (2003). Investment and Corruption: A Look At Causality. Journal of
Academy of Business And Environment. 1(2), 34-43.
100
De Soto, Hernando (2002). The Other Path: The Economic Answer to Terrorism. New
York: Basic Books.
Di Tella, Rafael and Ernesto Schargrodsky (2003). The Role of Wages and Auditing
During a Crackdown On Corruption in the City of Buenos Aires. Journal of Law
and Economics 65, 269-292.
Dixit, Avinash (2003). Trade Expansion and Contract Enforcement. Journal of Political
Economy 111,(6), 1293-1317.
Easterly, William (2001). The Elusive Quest For Growth. Cambridge MA: MIT Press
Fisman, Raymond and Roberta Gatti (1999). Decentralization and Corruption: Evidence
Across Countries. The World Bank. Retrieved online April 19, 2004:
documents/fisman.pdf.http://www.worldbank.org/wbi/publicfinance/documents/fi
sman.pdf.
Fletcher, Stanley (1999). Preparing For The 1999 WTO Agricultural Round. American
Journal of Agricultural Economics 81(5), 1157-1168.
Galenternick, Mery (2003). Mighty-ducks: How A University Project Nurtured by
Government Funding and Protection Sparked Brazil’s High-Tech Industry. Latin
Trade 11 (7), 57-58.
Ganuza, Jose-Juan and Esther Hauk (2004). Economic Integration and Corruption: The
Corrupt Soul of the European Union. Universitat Pompeu Fabra. Retrieved online
November 1. 2004: http://www.anti-corr.ru/an_plc/CEU.pdf.
Gaviria, Alejandro (2002). Assessing the effects of corruption and crime on firm
performance: evidence from Latin America. Emerging Markets Review 3, 245-
268.
101
Geddes, Richard (1997). Ownership, Regulation and Managerial Monitoring In The
Electric Utility Industry. Journal of Law and Economics 40(1), 261-288.
Goodman, Joshua (2004). Uruguay Massala: Software Jobs Of The Future Are Going to
End Up Somewhere. Latin Trade, 12 (1), 28-2.
Gray, Cheryl W. and Kaufmann, Daniel (1998). Corruption and Development. Finance &
Development, March.
Gujarati, D. (2003). Basic Econometrics. 4th edition. McGraw-Hill.
Hutchcroft, Paul D (1997). The Politics of Privilege: Assessing the Impact of Rents,
Corruption and Clientelism on Third World Development.” Political Studies
45(3), 639-668.
Kahn, Mushtaqh and K.S. Jomo, Eds (2000). Rents, Rent-Seeking And Economic
Development in Asia: Theory and Evidence. Cambridge: Cambridge University
Press.
Kaufman, Daniel and Shang Wei (1999). Does Grease Money Speed Up The Wheels of
Commerce? Policy Research Paper 2254, World Bank. Retrieved online May 18,
2004: http://www.worldbank.org/wbi/governance/pdf/grease.pdf.
King, Damien and S. Handa (2003). The Welfare Effects of Balance of Payments
Reform: A Macro-Micro Simulation Of the Cost of Rent-Seeking. Journal of
Development Studies 39(3), 101-127.
La Porta, Rafael, Florencio Lopez-de-Silanes, Andrei Shleifer and Robert W. Vishney
(1998). Law and Finance. Journal of Political Economy 106(1), 1113-1155.
102
Lambsdorff, Johann (2002). Framework Document 2002: Background Paper To the 2002
Corruption Perception Index. Transparency International. Retrieved online April
27, 2004: http://www.transparency.org/cpi/2002/dnld/cpi2002.methodology.pdf.
Mauro, Paolo (1995). Corruption and Growth. Quarterly Journal of Economics 110(3),
681-712.
“The Persistence of Corruption and Slow Economic Growth.” IMF Working Paper
WP/02/213, November 2002. Retrieved online May 3, 2004:
http://www.imf.org/external/pubs/ft/wp/2002/wp02213.pdf.
Mbaku, John (1999). The Relevance of the State in African Development. Journal of
Asian and African Studies 34(3), 298-331.
McAdam, Peter and Rummel, Ole, (2004). Corruption: a non-parametric analysis.
Journal of Economic Studies 31(6), 509-523.
McCarthy, B. and J. Hagan (2001). When Crime Pays: Capital, Competence, and
Criminal Success. Social Forces 79(3), 1035-1061.
Murphy, Kevin, Andrei Shleifer and Robert W. Vishny (1993). Why Is Rent-Seeking So
Costly to Growth? The American Economic Review 83(2), 409-414.
Nunnally, J.C. (1978). Psychometric Theory, 2nd edition, New York: McGraw-Hill
Publishing Company.
Odland, John. (1988). Spatial Autocorrelation. Sage Publications, Newbury Park.
Piracy in Paraguay. AdTI Issue Brief No. 173, July 1999. Retrieves online May 25, 2004:
http://www.adti.net/Piracy_in_Paraguay.html.
Rosenberg, Tina (2003), “The Taint of the Greased Palm” The New York Times, Vol. 28.
103
Safavian, Michael, Douglas Graham and Claudio Gonzalez-Vega (2001). Corruption and
Microenterprises in Russia. World Development 29(7), 1215-1229.
Shleifer, Andrei and Robert W. Vishny (1993). Corruption. The Quarterly Journal of
Economics 108(3), 599-617.
Treisman, Daniel, (2000). The causes of corruption: a cross-national study. Journal of
Public Economics, 27, 399–457.
Tulloch, G, (1980). Efficient Rent Seeking, in J. M. Buchanan, R. D. Tollison and G
Tulloch (Eds), 87-112, Toward a Theory of the Rent Seeking Society, College
Station, Texas A&M University Press.
Wilhelm, Paul G (2002). International validation of the Corruption Perceptions Index.
Journal of Business Ethics 35(13), 177-189.
Velasco, Pablo (2001). The Mineral Industries of Paraguay and Uruguay. U.S. Geological
Survey Minerals Yearbook. Retrieved online May 18, 2004:
http://minerals.usgs.gov/minerals/pubs/country/2001/pamyb01.pdf.
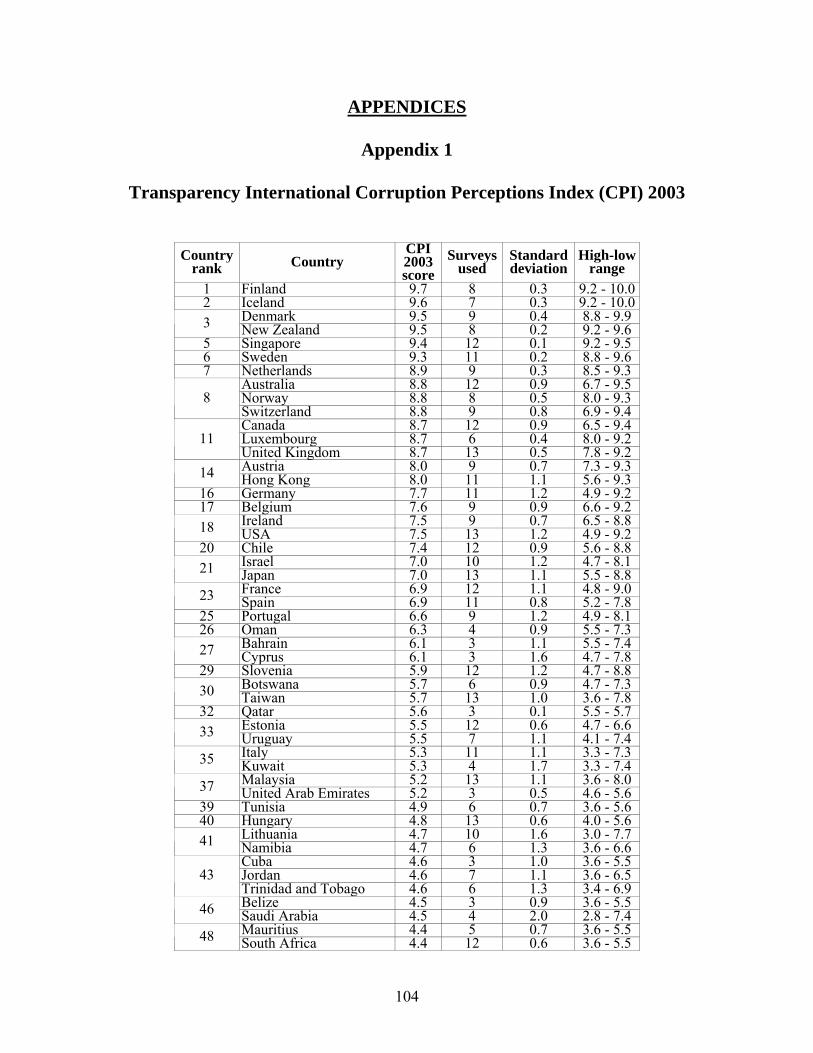
104
APPENDICES
Appendix 1
Transparency International Corruption Perceptions Index (CPI) 2003
Country
rank Country CPI 2003 score
Surveysused
Standard deviation
High-low range
1 Finland 9.7 8 0.3 9.2 - 10.0 2 Iceland 9.6 7 0.3 9.2 - 10.0
Denmark 9.5 9 0.4 8.8 - 9.9 3 New Zealand 9.5 8 0.2 9.2 - 9.6 5 Singapore 9.4 12 0.1 9.2 - 9.5 6 Sweden 9.3 11 0.2 8.8 - 9.6 7 Netherlands 8.9 9 0.3 8.5 - 9.3
Australia 8.8 12 0.9 6.7 - 9.5 Norway 8.8 8 0.5 8.0 - 9.3 8 Switzerland 8.8 9 0.8 6.9 - 9.4 Canada 8.7 12 0.9 6.5 - 9.4 Luxembourg 8.7 6 0.4 8.0 - 9.2 11 United Kingdom 8.7 13 0.5 7.8 - 9.2 Austria 8.0 9 0.7 7.3 - 9.3 14 Hong Kong 8.0 11 1.1 5.6 - 9.3
16 Germany 7.7 11 1.2 4.9 - 9.2 17 Belgium 7.6 9 0.9 6.6 - 9.2
Ireland 7.5 9 0.7 6.5 - 8.8 18 USA 7.5 13 1.2 4.9 - 9.2 20 Chile 7.4 12 0.9 5.6 - 8.8
Israel 7.0 10 1.2 4.7 - 8.1 21 Japan 7.0 13 1.1 5.5 - 8.8 France 6.9 12 1.1 4.8 - 9.0 23 Spain 6.9 11 0.8 5.2 - 7.8
25 Portugal 6.6 9 1.2 4.9 - 8.1 26 Oman 6.3 4 0.9 5.5 - 7.3
Bahrain 6.1 3 1.1 5.5 - 7.4 27 Cyprus 6.1 3 1.6 4.7 - 7.8 29 Slovenia 5.9 12 1.2 4.7 - 8.8
Botswana 5.7 6 0.9 4.7 - 7.3 30 Taiwan 5.7 13 1.0 3.6 - 7.8 32 Qatar 5.6 3 0.1 5.5 - 5.7
Estonia 5.5 12 0.6 4.7 - 6.6 33 Uruguay 5.5 7 1.1 4.1 - 7.4 Italy 5.3 11 1.1 3.3 - 7.3 35 Kuwait 5.3 4 1.7 3.3 - 7.4 Malaysia 5.2 13 1.1 3.6 - 8.0 37 United Arab Emirates 5.2 3 0.5 4.6 - 5.6
39 Tunisia 4.9 6 0.7 3.6 - 5.6 40 Hungary 4.8 13 0.6 4.0 - 5.6
Lithuania 4.7 10 1.6 3.0 - 7.7 41 Namibia 4.7 6 1.3 3.6 - 6.6 Cuba 4.6 3 1.0 3.6 - 5.5 Jordan 4.6 7 1.1 3.6 - 6.5 43 Trinidad and Tobago 4.6 6 1.3 3.4 - 6.9 Belize 4.5 3 0.9 3.6 - 5.5 46 Saudi Arabia 4.5 4 2.0 2.8 - 7.4 Mauritius 4.4 5 0.7 3.6 - 5.5 48 South Africa 4.4 12 0.6 3.6 - 5.5
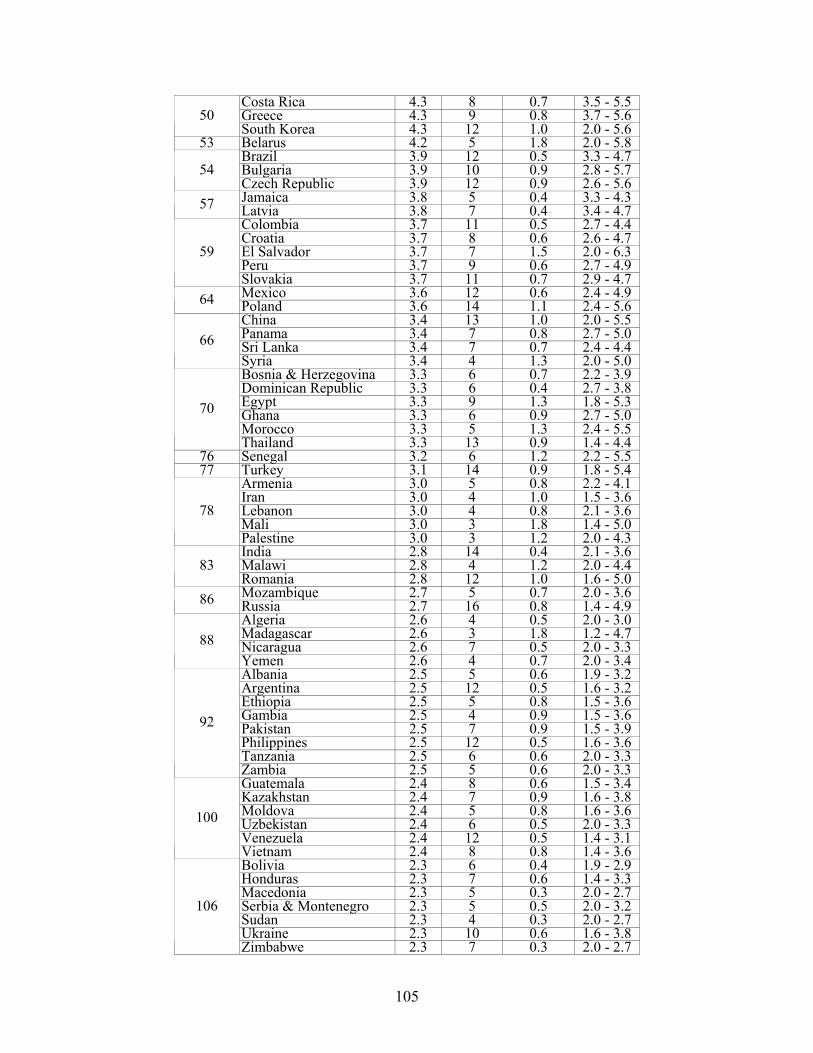
105
Costa Rica 4.3 8 0.7 3.5 - 5.5 Greece 4.3 9 0.8 3.7 - 5.6 50 South Korea 4.3 12 1.0 2.0 - 5.6
53 Belarus 4.2 5 1.8 2.0 - 5.8 Brazil 3.9 12 0.5 3.3 - 4.7 Bulgaria 3.9 10 0.9 2.8 - 5.7 54 Czech Republic 3.9 12 0.9 2.6 - 5.6 Jamaica 3.8 5 0.4 3.3 - 4.3 57 Latvia 3.8 7 0.4 3.4 - 4.7 Colombia 3.7 11 0.5 2.7 - 4.4 Croatia 3.7 8 0.6 2.6 - 4.7 El Salvador 3.7 7 1.5 2.0 - 6.3 Peru 3.7 9 0.6 2.7 - 4.9
59
Slovakia 3.7 11 0.7 2.9 - 4.7 Mexico 3.6 12 0.6 2.4 - 4.9 64 Poland 3.6 14 1.1 2.4 - 5.6 China 3.4 13 1.0 2.0 - 5.5 Panama 3.4 7 0.8 2.7 - 5.0 Sri Lanka 3.4 7 0.7 2.4 - 4.4 66 Syria 3.4 4 1.3 2.0 - 5.0 Bosnia & Herzegovina 3.3 6 0.7 2.2 - 3.9 Dominican Republic 3.3 6 0.4 2.7 - 3.8 Egypt 3.3 9 1.3 1.8 - 5.3 Ghana 3.3 6 0.9 2.7 - 5.0 Morocco 3.3 5 1.3 2.4 - 5.5
70
Thailand 3.3 13 0.9 1.4 - 4.4 76 Senegal 3.2 6 1.2 2.2 - 5.5 77 Turkey 3.1 14 0.9 1.8 - 5.4
Armenia 3.0 5 0.8 2.2 - 4.1 Iran 3.0 4 1.0 1.5 - 3.6 Lebanon 3.0 4 0.8 2.1 - 3.6 Mali 3.0 3 1.8 1.4 - 5.0
78
Palestine 3.0 3 1.2 2.0 - 4.3 India 2.8 14 0.4 2.1 - 3.6 Malawi 2.8 4 1.2 2.0 - 4.4 83 Romania 2.8 12 1.0 1.6 - 5.0 Mozambique 2.7 5 0.7 2.0 - 3.6 86 Russia 2.7 16 0.8 1.4 - 4.9 Algeria 2.6 4 0.5 2.0 - 3.0 Madagascar 2.6 3 1.8 1.2 - 4.7 Nicaragua 2.6 7 0.5 2.0 - 3.3 88 Yemen 2.6 4 0.7 2.0 - 3.4 Albania 2.5 5 0.6 1.9 - 3.2 Argentina 2.5 12 0.5 1.6 - 3.2 Ethiopia 2.5 5 0.8 1.5 - 3.6 Gambia 2.5 4 0.9 1.5 - 3.6 Pakistan 2.5 7 0.9 1.5 - 3.9 Philippines 2.5 12 0.5 1.6 - 3.6 Tanzania 2.5 6 0.6 2.0 - 3.3
92
Zambia 2.5 5 0.6 2.0 - 3.3 Guatemala 2.4 8 0.6 1.5 - 3.4 Kazakhstan 2.4 7 0.9 1.6 - 3.8 Moldova 2.4 5 0.8 1.6 - 3.6 Uzbekistan 2.4 6 0.5 2.0 - 3.3 Venezuela 2.4 12 0.5 1.4 - 3.1
100
Vietnam 2.4 8 0.8 1.4 - 3.6 Bolivia 2.3 6 0.4 1.9 - 2.9 Honduras 2.3 7 0.6 1.4 - 3.3 Macedonia 2.3 5 0.3 2.0 - 2.7 Serbia & Montenegro 2.3 5 0.5 2.0 - 3.2 Sudan 2.3 4 0.3 2.0 - 2.7 Ukraine 2.3 10 0.6 1.6 - 3.8
106
Zimbabwe 2.3 7 0.3 2.0 - 2.7
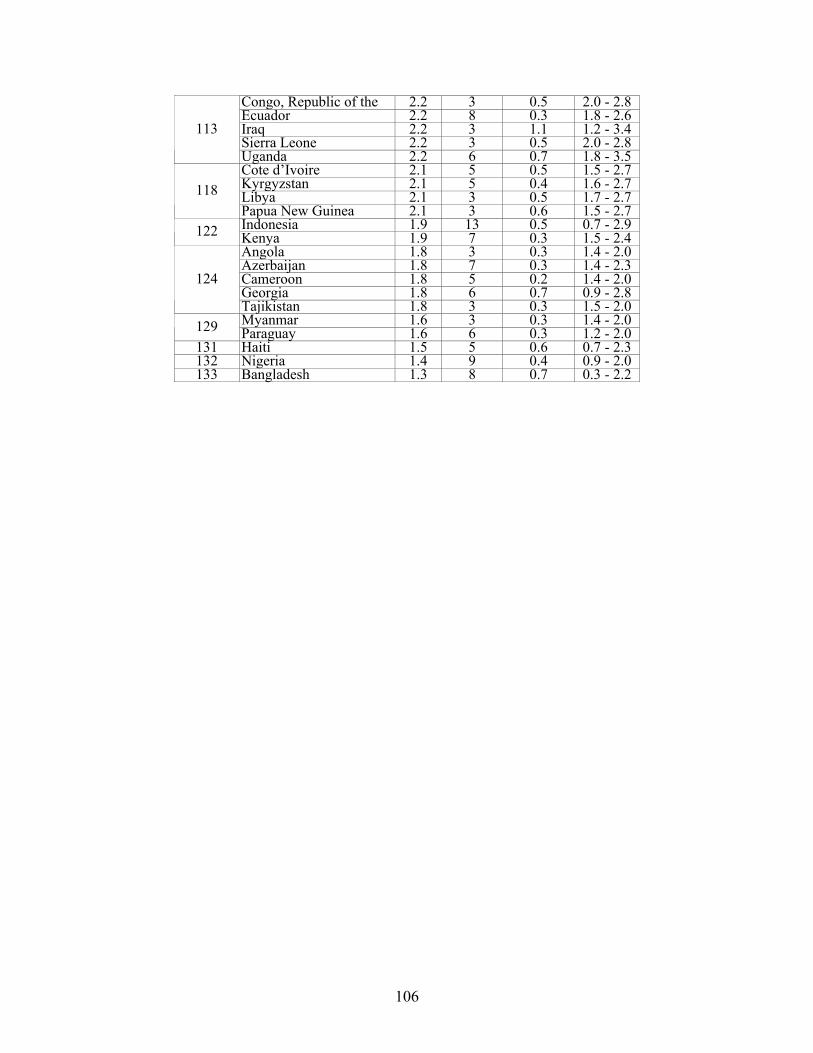
106
Congo, Republic of the 2.2 3 0.5 2.0 - 2.8 Ecuador 2.2 8 0.3 1.8 - 2.6 Iraq 2.2 3 1.1 1.2 - 3.4 Sierra Leone 2.2 3 0.5 2.0 - 2.8
113
Uganda 2.2 6 0.7 1.8 - 3.5 Cote d’Ivoire 2.1 5 0.5 1.5 - 2.7 Kyrgyzstan 2.1 5 0.4 1.6 - 2.7 Libya 2.1 3 0.5 1.7 - 2.7 118 Papua New Guinea 2.1 3 0.6 1.5 - 2.7 Indonesia 1.9 13 0.5 0.7 - 2.9 122 Kenya 1.9 7 0.3 1.5 - 2.4 Angola 1.8 3 0.3 1.4 - 2.0 Azerbaijan 1.8 7 0.3 1.4 - 2.3 Cameroon 1.8 5 0.2 1.4 - 2.0 Georgia 1.8 6 0.7 0.9 - 2.8
124
Tajikistan 1.8 3 0.3 1.5 - 2.0 Myanmar 1.6 3 0.3 1.4 - 2.0 129 Paraguay 1.6 6 0.3 1.2 - 2.0
131 Haiti 1.5 5 0.6 0.7 - 2.3 132 Nigeria 1.4 9 0.4 0.9 - 2.0 133 Bangladesh 1.3 8 0.7 0.3 - 2.2
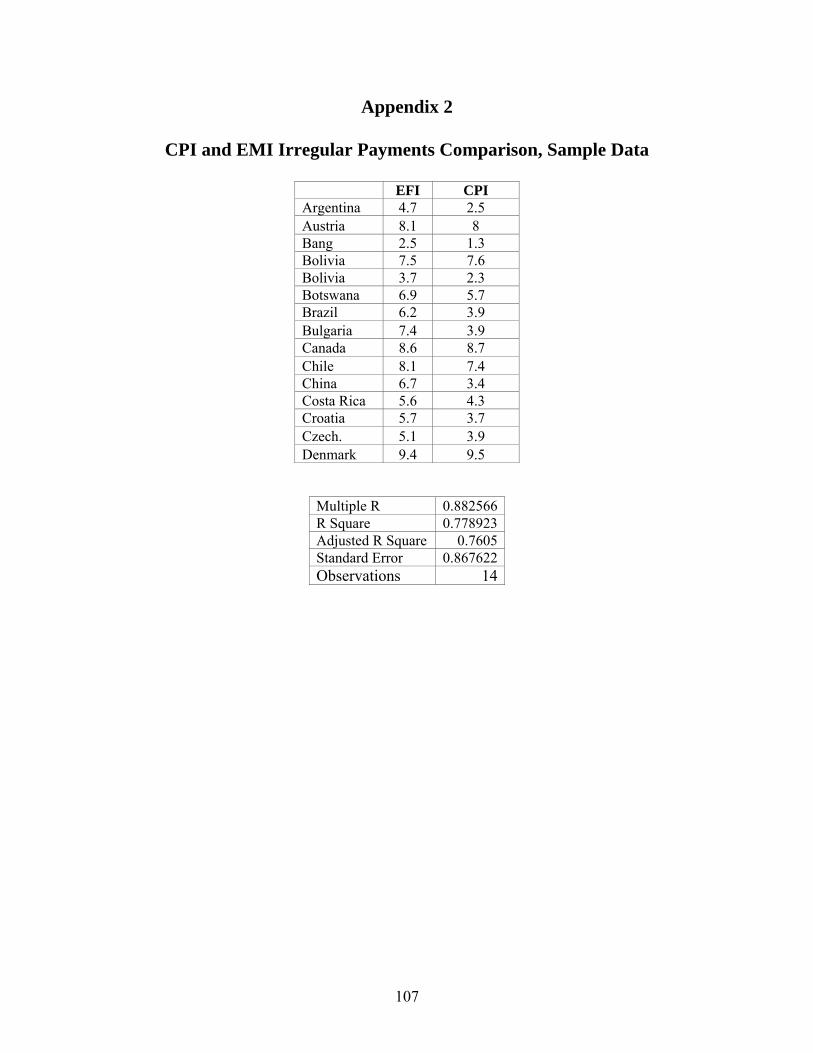
107
Appendix 2
CPI and EMI Irregular Payments Comparison, Sample Data
EFI CPI Argentina 4.7 2.5 Austria 8.1 8 Bang 2.5 1.3 Bolivia 7.5 7.6 Bolivia 3.7 2.3 Botswana 6.9 5.7 Brazil 6.2 3.9 Bulgaria 7.4 3.9 Canada 8.6 8.7 Chile 8.1 7.4 China 6.7 3.4 Costa Rica 5.6 4.3 Croatia 5.7 3.7 Czech. 5.1 3.9 Denmark 9.4 9.5
Multiple R 0.882566R Square 0.778923Adjusted R Square 0.7605Standard Error 0.867622Observations 14
108
Appendix A
Methodology
A.1 Development of Questionnaire
The test instrument for this study is in the form of a survey questionnaire
functioning to operationalize the variables under study. The questionnaire was developed
based on a literature review, which revealed the methodologies used by previous
researchers as well as the techniques used to operationalize the concepts associated with
corruption when investigating both macroeconomic and microeconomic phenomenon.
The study’s dependent variable is the return on investment (ROI) of the firms with
participating managers. The independent variables consist of the perceptions of the
various managers participating in the study of the level of existing corruption and its
impact on the operations of the firm. Because the study focuses on the computer industry
in the Mercosur, certain concepts and constructs within the survey questionnaire are
specific to the Mercosur nations.
Face validity of the survey questionnaire was determined by means of peer
review, indicating that the constructs were understandable. Because of the multi-lingual
context of this study, the process of establishing face validity occurred in English,
Spanish, and Portuguese. Native speakers of all three languages established face validity.
Peer review by academics involved in the areas of economics and sociology established
content and construct validity. A pilot test of the survey questionnaire conducted in the
summer of 2004 in the Mercosur nations established criterion validity.
109
Diachronic and synchronic reliability for the survey questionnaire were estimated
to be relatively low due to the nature of the study, which focuses on a single industry in a
relatively short time interval that can be viewed as a discrete moment in time. Diachronic
reliability refers to the stability of observations over time. Because the perceptions
regarding the impact of corruption on a firm in a microeconomic context are subject to a
large number of variables not directly measured by the test instrument, the perception of
corruption by an individual or a group of individuals in the same industry sector will
likely reflect the conditions of corruption at the moment. As a result, a test-and-retest
methodology, in which there is a significant amount of time between the testing, is likely
to produce differing results. This suggests that the data produced by the administration of
the test instrument will likely reflect perceptions at a given moment in time. Although we
assumed that synchronic reliability would be low due to sample’s size, it is likely to be
higher than diachronic reliability.
Synchronic reliability refers to the similarity of observations within the same time
frame. The research examined the perceptions of corruption in an industry sector; the
respondents were assumed to be similarly situated with respect to participation in the
industry though dissimilarly situated with respect to both their segment of the industry
and their home country of operations. The research also examined the same phenomenon
in the form of perceptions of corruption in the industry regardless of the specific position
of the respondent in the industry or the geographic location of the respondent.
110
A.2 Interview Data
The researcher, in person, conducted interviews of managers in the computer
industry in the Mercosur nations during the summer of 2004. The purpose of the
interviews was to gather additional data regarding corruption not revealed in the survey
questionnaire. It used a structured interview approach using closed-ended questions for
the majority of the interview process to minimize bias due to interaction between the
interviewer and interviewee. The closed-ended questions were useful for determining
frequencies, intensities of perceptions, and degrees of involvement. The interview
process also used open-ended questions at the end of the interview to obtain additional
information that may have been overlooked by the research in developing the closed-
ended questions.
The open-ended questions were thus intended to elicit additional information from
interviewees that supported a more in-depth analysis of the findings produced by more
quantitative types of research methods. In effect, the responses from open-ended
questions provided background information regarding the more subjective aspects of
perceptions towards corruption and its impact on the economic process in a broad
cultural, political, and business context. Open-ended questions are useful for exploratory
research that elicits information regarding positions regarding subjective issues such as
corruption. Additionally, the responses produced by open-ended questions can provide
some degree of guidance for the direction of future research by identifying factors not yet
considered in the design of formal research.
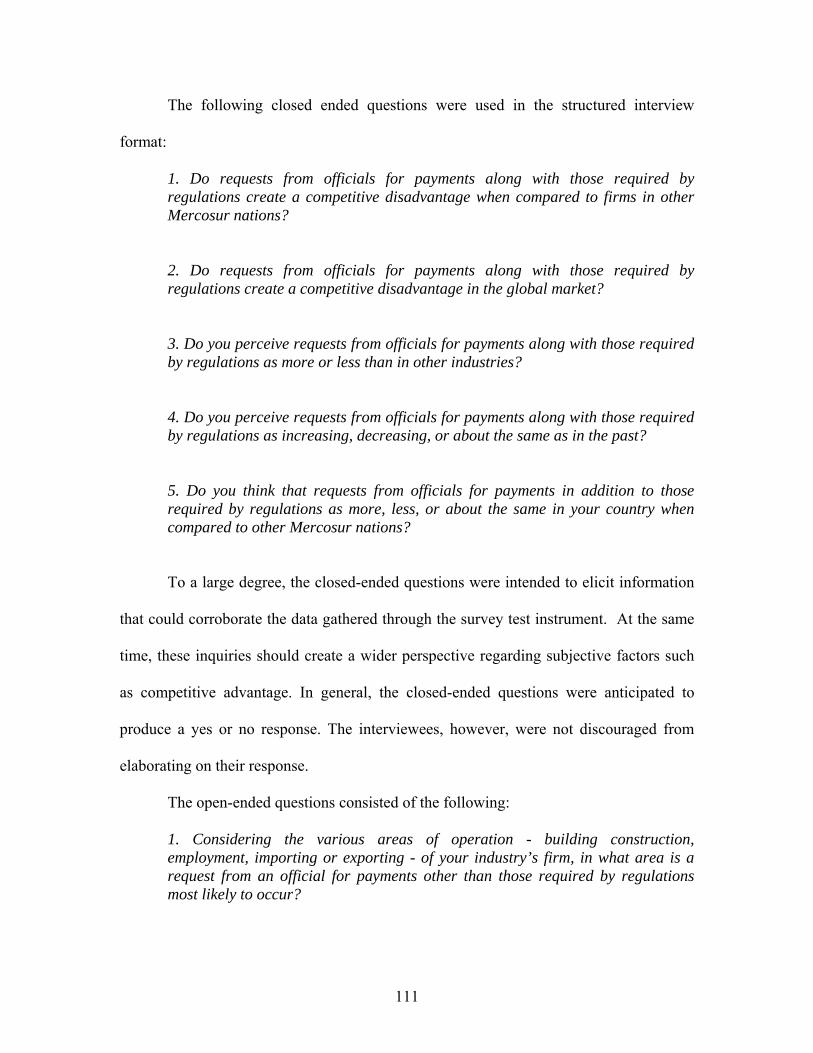
111
The following closed ended questions were used in the structured interview
format:
1. Do requests from officials for payments along with those required by regulations create a competitive disadvantage when compared to firms in other Mercosur nations?
2. Do requests from officials for payments along with those required by regulations create a competitive disadvantage in the global market?
3. Do you perceive requests from officials for payments along with those required by regulations as more or less than in other industries?
4. Do you perceive requests from officials for payments along with those required by regulations as increasing, decreasing, or about the same as in the past?
5. Do you think that requests from officials for payments in addition to those required by regulations as more, less, or about the same in your country when compared to other Mercosur nations?
To a large degree, the closed-ended questions were intended to elicit information
that could corroborate the data gathered through the survey test instrument. At the same
time, these inquiries should create a wider perspective regarding subjective factors such
as competitive advantage. In general, the closed-ended questions were anticipated to
produce a yes or no response. The interviewees, however, were not discouraged from
elaborating on their response.
The open-ended questions consisted of the following:
1. Considering the various areas of operation - building construction, employment, importing or exporting - of your industry’s firm, in what area is a request from an official for payments other than those required by regulations most likely to occur?
112
2. Do you believe that government policies and officials support your industry by removing barriers to commerce?
3. Do you believe that your industry would be more prosperous if government operations were more closely supervised or regulated?
4. Are you aware of any experiences of other firms resulting in the firm suffering economic harm from requests from officials for payments in addition to those required by regulations?
The following interview methodology called for recording each interview for
verification and transcription of the findings. In the closed-end portion of the interview,
the interviewer did not attempt to interact with the interviewee to either encourage or
discourage elaboration on the responses. In the open-ended portion of the interview, the
interviewer asked follow-up questions, the nature of which depends on the interviewees’
initial responses. The objective for the open-ended portion of this process was to elicit as
much information as the interviewee was willing to give regarding the issue of
corruption, even if the response strayed from the question’s intent.
The sampling methodology used for the interview was the random stratified
method. In this method, the entire population will be fit into mutually exclusive
subgroups or strata; the interviewees were selected at random from each stratum. The
strata used was based on the segments of the industry to obtain some degree of
representative sampling from each of the general segments with the objective of
maximizing the heterogeneity of the sample. In addition, there was some degree of
stratification based on the geographic location of the firm, because the researcher had
access only to a few geographic locations in the Mercosur nations. As a result, the
113
geographic stratification represented a limitation in the methodology used in the study;
the results of the interview process were qualified according to the actual geographic
stratification. Although it would be ideal to include only those individuals in the sample
population for the interview process that have completed the survey test instrument to
facilitate comparison between the survey and interview results, the interview process had
incorporated some individuals who did not complete the survey test instrument. To some
degree, this could provide broader qualitative information regarding perceptions of the
interviewees.
A.3 External Data
Because the study is designed to correlate the actual performance of firms in the
computer industry with the perceptions of corruption of the managers of firms, the data
collection procedure required access to external data regarding the performance of the
firm. This created an inherent limitation in the data-gathering process, as only managers
from firms with publicly available financial information could be included in the study.
This selection criterion excluded private firms that did not make such information
available. It also required some degree of pre-screening of respondents to insure that they
were employed by a firm that made the information available.
A.4 Data Collection Methodology
Because the study requires a relatively large number of respondents from a single
industry to meet the objectives for confidence and reliability, three separate data
collection methodologies were developed. The first methodology involved data collection
114
in person in the Mercosur nations during the Summer of 2004 and involved a chain
referral approach. The second data collection methodology was used in the Fall of 2004
and involved the use of email solicitation of participants from the computer industry in
the Mercosur nations. This methodology is viable due to the nature of the computer
industry, where virtually all firms have an internet presence, and managers are
accustomed to using email and the internet for communications. The third methodology
involved contacting either by telephone or by mail firms identified through physical
business directories, which were collected for each Mercosur nation during the summer
of 2004 and winter break of 2005, when the researcher traveled to the Mercosur nations.
While each of these methodologies have limitations in the sampling techniques that can
introduce error into the findings, they were deemed to be the most appropriate for use
with the inherent constraints of data collection from international sources over a widely
disbursed geographic area.
A.5 Data Collection in the Mercosur Nations
Because of the sensitive nature of the subject matter of the study that involved
investigation into corruption, initial contact was made with academics and industry
groups in the Mercosur nations to establish credibility in the industry. The general
procedure was to contact a key individual in various universities, ministries and industry
associations, explain the nature of the study, and solicit their assistance in obtaining
referrals. In addition, several senior managers from computer related firms in Brazil were
approached directly. Although this process was relatively time consuming, it resulted in
115
the study obtaining referrals to individuals in the computer industry who agreed to
participate in the study.
Because of the use of chain referral method of sampling, the ideal of achieving
proportionate random sampling of the study population was not achieved for the data
collected in the study’s initial phase. There was also a significant possibility that the
independence of the sampling would be compromised due to peer pressure placed on
respondents urging them to participate in the study. The primary concerns at this point in
the study was establishing sufficient contacts within the computer industry to support an
effective data gathering process. Additionally, an adequate number of respondents were
needed to conduct a pilot test to ensure that the survey questionnaire was predictive of the
concepts that it intended to measure. The chain referral method was necessary for an
outsider to the industry to access the sample population, given the sensitive nature of the
subject under study. Thus, the data gathered for the pilot test had a diminished level of
independence.
An additional limitation of this method of sampling is the strong likelihood that
some firms and individuals would be overlooked due to their lack of association with the
referring entity. The likely result is the exclusion of a significant portion of the sample
population from the sample; as a result, this can have a negative impact on the confidence
level of the study.
A.6 Pilot Study Analysis
The initial weeks of the field research period involved conducting the pilot study
to verify that the survey questionnaire test instrument was predictive and whether any
116
modifications of the test instrument would be necessary for the study’s main portion. The
pilot study was a critical component of the research, verifying that the data collection
methods were feasible and that the data could be used in the study’s econometric model.
The data used in the pilot test was gathered during the summer research period from the
administration of the survey questionnaires to 72 respondents in the Mercosur nations.
The outcome of the pilot study indicated that the survey questionnaire was predictive;
modifications would not be necessary prior to the dissemination of the questionnaire to
respondents for the study’s main portion. It further established that the data produced by
the survey questionnaire could function as a proxy measure for the impact of corruption
on the activities of individual firms and establish the independent variables of the study.
Finally, the pilot test established a correlation between the independent variables and the
dependent variable of return on assets (ROI), which was data collected from sources
exogenous to the survey questionnaire. Computation of ROI is the net income of the firm
divided by the total assets of the firm.
A concern during the initial phase of the data collection period was the possibility
of self-selection bias, which occurs when a relatively small number of possible
respondents participate in a survey type of study. This tends to skew the findings towards
the perspective of those individuals who choose to participate in a study, which may not
reflect the whole population. This is a non-sampling type of error that can occur for a
variety of reasons, including the perception of the respondents that their anonymity
would not be preserved in the research process. The response rate during the pilot study
phase of the research was relatively high at 79%. This reduced the level of concern
117
regarding the impact of self-selection bias on the findings. This indicated that there was
no need to alter the methods used to solicit participation in the study, including the
content of the solicitation letter that would be sent to perspective respondents in the
future via the internet.
The high percentage of respondents willing to participate in the study also
demonstrated that the method used to sample the population was viable, as it would likely
produce a sufficient number of participants to support a study conducted on a larger
scale. Email solicited 38 of the respondents in the pilot study by using a description of the
study and mentioning that the researcher was referred to the potential respondent by a
trade association or other manager that supported the aims and objectives of the study. At
this stage of the data gathering process, the primary concern was obtaining a sufficient
number of respondents to support a large-scale study. Issues such as the bias that can
occur using a chain referral method of solicitation were believed to be minimal due to the
intent to use a random solicitation process based on the internet listings of firms in the
computer industry.
The pilot study focused on establishing the criterion validity of the survey
questionnaire before deemed suitable for dissemination to a wider sample population. A
prerequisite for establishing criterion validity was determining reliability, which is the
extent to which the measure yields consistent results when applied repeatedly. Face
validity and content validity were established prior to the survey instrument’s gathering
the data for the pilot study. The design of the survey questionnaire was both postdictive
118
and concurrent - it asked respondents to provide information regarding their perceptions
and experiences that occurred in the past and their perceptions and experiences at the
current time. Criterion validity in this research was relatively important due to the
development of variations from the preexisting measures used by other researchers to
quantify the subjective concept of corruption and perceptions of the level of corruption.
In this study, the predictor variables were the responses to the various questions
contained in the survey questionnaire regarding perceptions of corruption and the
criterion variable was ROI.
To accomplish the regression analysis, the raw data produced by the survey
questionnaire had to be coded; this provided an opportunity to develop the coding frame
to be used for the study’s main part. The coding frame was based on the structure of the
survey questionnaire that provided structure in terms of the segment of the computer
industry of the respondent and the pre-coded nature of the questions asked of the
respondent. Exogenous information supporting the coding was the nation of origin of the
respondent and the ROI. As a result, the data produced during the pilot study could be
coded in terms of the industry segment and the nation of origin to determine whether
these variables produced any difference in outcome. During the coding process, an
unanticipated difficulty arose due to few respondents from the semiconductor, computer
supply, and other categories established to identify the segment of the computer industry.
As a result, the pilot study analysis did not include industry segment analysis, confining
itself to overall analysis and analysis by nation of the respondents. Table A.1 shows the
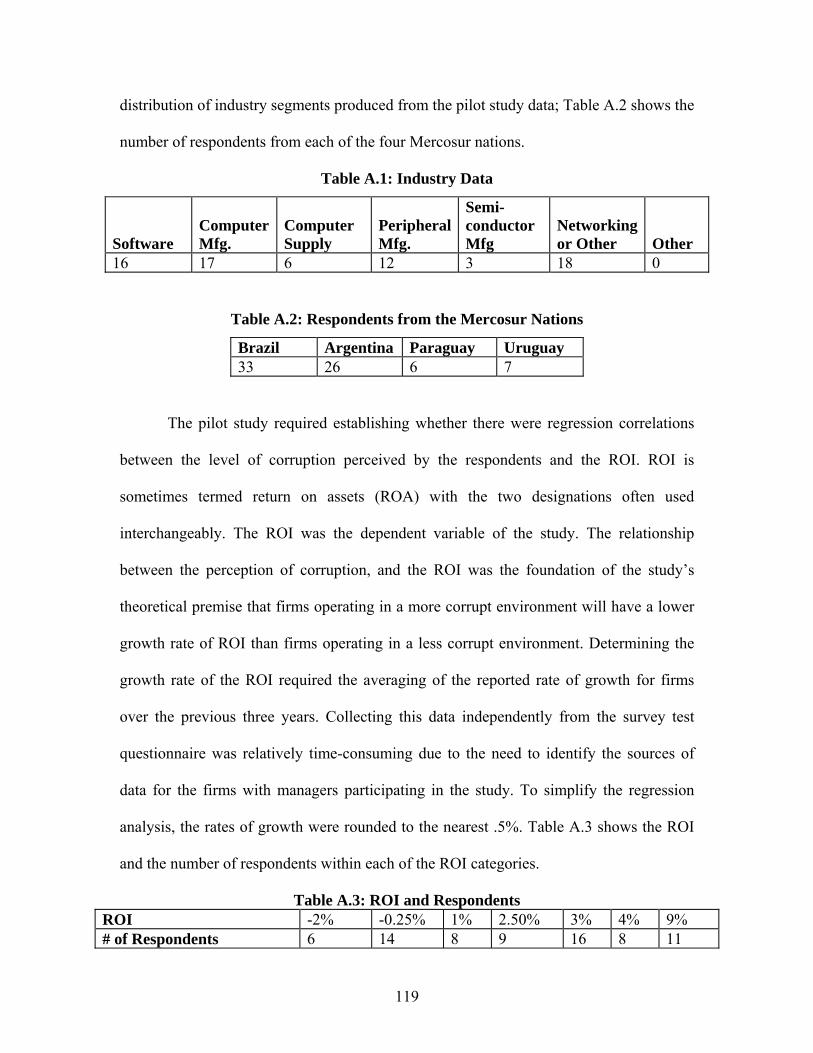
119
distribution of industry segments produced from the pilot study data; Table A.2 shows the
number of respondents from each of the four Mercosur nations.
Table A.1: Industry Data
Software Computer Mfg.
Computer Supply
Peripheral Mfg.
Semi-conductor Mfg
Networking or Other Other
16 17 6 12 3 18 0
Table A.2: Respondents from the Mercosur Nations
Brazil Argentina Paraguay Uruguay 33 26 6 7
The pilot study required establishing whether there were regression correlations
between the level of corruption perceived by the respondents and the ROI. ROI is
sometimes termed return on assets (ROA) with the two designations often used
interchangeably. The ROI was the dependent variable of the study. The relationship
between the perception of corruption, and the ROI was the foundation of the study’s
theoretical premise that firms operating in a more corrupt environment will have a lower
growth rate of ROI than firms operating in a less corrupt environment. Determining the
growth rate of the ROI required the averaging of the reported rate of growth for firms
over the previous three years. Collecting this data independently from the survey test
questionnaire was relatively time-consuming due to the need to identify the sources of
data for the firms with managers participating in the study. To simplify the regression
analysis, the rates of growth were rounded to the nearest .5%. Table A.3 shows the ROI
and the number of respondents within each of the ROI categories.
Table A.3: ROI and Respondents ROI -2% -0.25% 1% 2.50% 3% 4% 9% # of Respondents 6 14 8 9 16 8 11
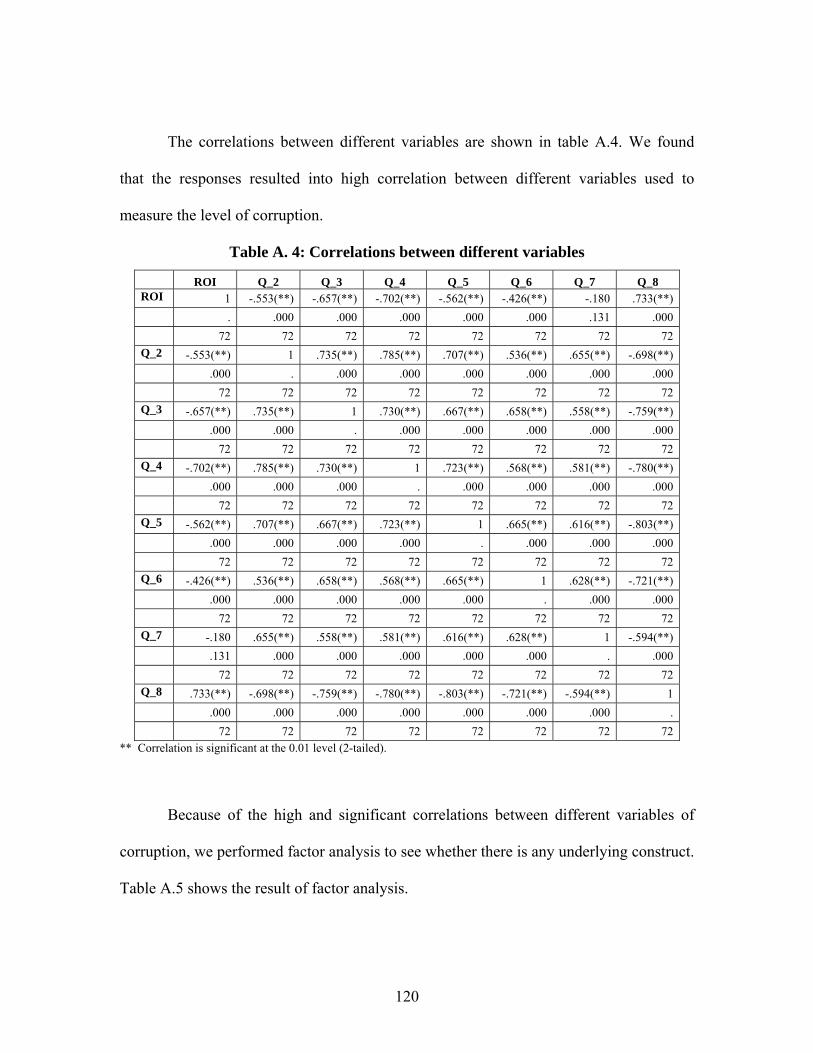
120
The correlations between different variables are shown in table A.4. We found
that the responses resulted into high correlation between different variables used to
measure the level of corruption.
Table A. 4: Correlations between different variables
ROI Q_2 Q_3 Q_4 Q_5 Q_6 Q_7 Q_8 ROI 1 -.553(**) -.657(**) -.702(**) -.562(**) -.426(**) -.180 .733(**) . .000 .000 .000 .000 .000 .131 .000 72 72 72 72 72 72 72 72Q_2 -.553(**) 1 .735(**) .785(**) .707(**) .536(**) .655(**) -.698(**) .000 . .000 .000 .000 .000 .000 .000 72 72 72 72 72 72 72 72Q_3 -.657(**) .735(**) 1 .730(**) .667(**) .658(**) .558(**) -.759(**) .000 .000 . .000 .000 .000 .000 .000 72 72 72 72 72 72 72 72Q_4 -.702(**) .785(**) .730(**) 1 .723(**) .568(**) .581(**) -.780(**) .000 .000 .000 . .000 .000 .000 .000 72 72 72 72 72 72 72 72Q_5 -.562(**) .707(**) .667(**) .723(**) 1 .665(**) .616(**) -.803(**) .000 .000 .000 .000 . .000 .000 .000 72 72 72 72 72 72 72 72Q_6 -.426(**) .536(**) .658(**) .568(**) .665(**) 1 .628(**) -.721(**) .000 .000 .000 .000 .000 . .000 .000 72 72 72 72 72 72 72 72Q_7 -.180 .655(**) .558(**) .581(**) .616(**) .628(**) 1 -.594(**) .131 .000 .000 .000 .000 .000 . .000 72 72 72 72 72 72 72 72Q_8 .733(**) -.698(**) -.759(**) -.780(**) -.803(**) -.721(**) -.594(**) 1 .000 .000 .000 .000 .000 .000 .000 . 72 72 72 72 72 72 72 72
** Correlation is significant at the 0.01 level (2-tailed).
Because of the high and significant correlations between different variables of
corruption, we performed factor analysis to see whether there is any underlying construct.
Table A.5 shows the result of factor analysis.
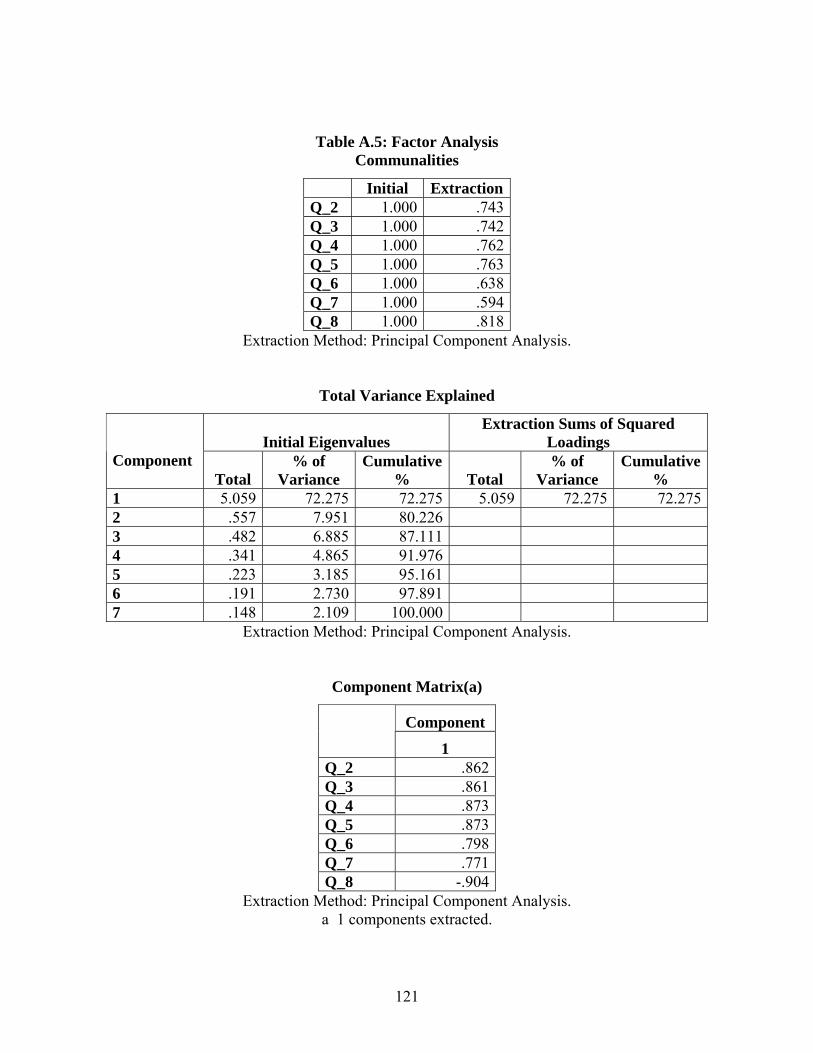
121
Table A.5: Factor Analysis Communalities
Initial ExtractionQ_2 1.000 .743Q_3 1.000 .742Q_4 1.000 .762Q_5 1.000 .763Q_6 1.000 .638Q_7 1.000 .594Q_8 1.000 .818
Extraction Method: Principal Component Analysis.
Total Variance Explained
Initial Eigenvalues Extraction Sums of Squared
Loadings Component Total
% of Variance
Cumulative % Total
% of Variance
Cumulative %
1 5.059 72.275 72.275 5.059 72.275 72.2752 .557 7.951 80.226 3 .482 6.885 87.111 4 .341 4.865 91.976 5 .223 3.185 95.161 6 .191 2.730 97.891 7 .148 2.109 100.000
Extraction Method: Principal Component Analysis.
Component Matrix(a)
Component 1 Q_2 .862Q_3 .861Q_4 .873Q_5 .873Q_6 .798Q_7 .771Q_8 -.904
Extraction Method: Principal Component Analysis. a 1 components extracted.
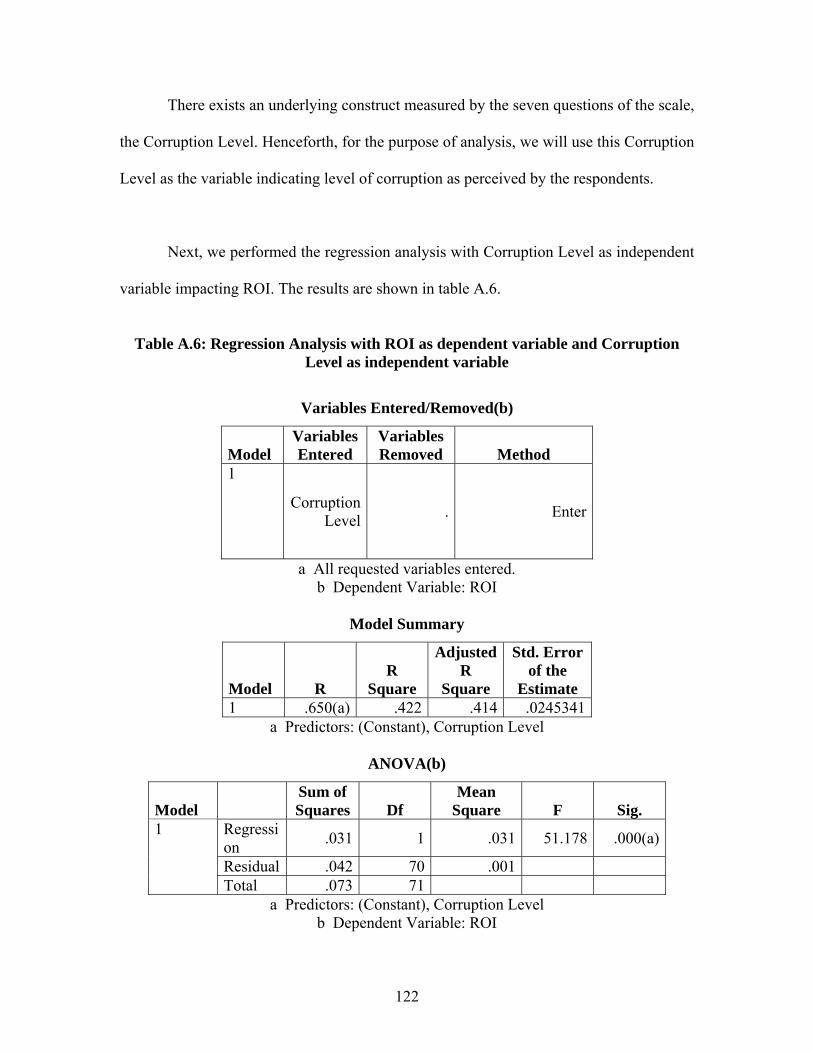
122
There exists an underlying construct measured by the seven questions of the scale,
the Corruption Level. Henceforth, for the purpose of analysis, we will use this Corruption
Level as the variable indicating level of corruption as perceived by the respondents.
Next, we performed the regression analysis with Corruption Level as independent
variable impacting ROI. The results are shown in table A.6.
Table A.6: Regression Analysis with ROI as dependent variable and Corruption
Level as independent variable
Variables Entered/Removed(b)
Model Variables Entered
Variables Removed Method
1
Corruption Level . Enter
a All requested variables entered. b Dependent Variable: ROI
Model Summary
Model R R
Square
Adjusted R
Square
Std. Error of the
Estimate 1 .650(a) .422 .414 .0245341
a Predictors: (Constant), Corruption Level
ANOVA(b)
Model Sum of Squares Df
Mean Square F Sig.
Regression .031 1 .031 51.178 .000(a)
Residual .042 70 .001
1
Total .073 71 a Predictors: (Constant), Corruption Level
b Dependent Variable: ROI
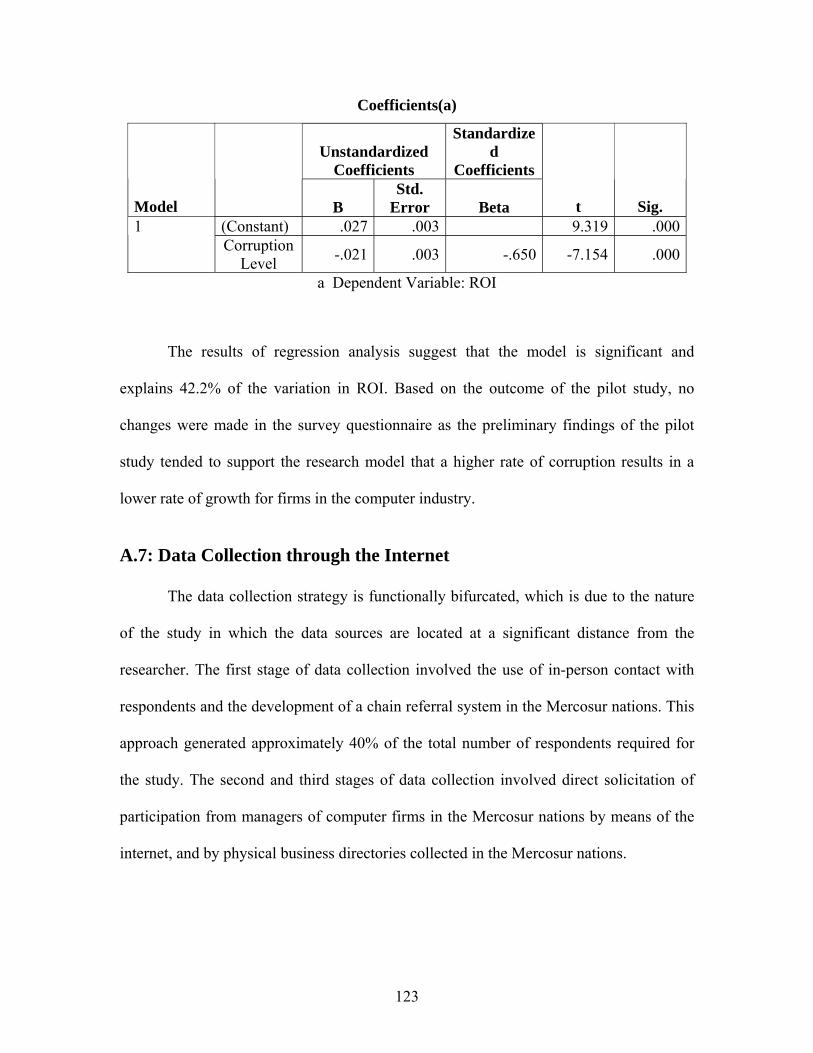
123
Coefficients(a)
Unstandardized Coefficients
Standardized
Coefficients
Model B Std.
Error Beta t Sig. (Constant) .027 .003 9.319 .0001 Corruption
Level -.021 .003 -.650 -7.154 .000
a Dependent Variable: ROI
The results of regression analysis suggest that the model is significant and
explains 42.2% of the variation in ROI. Based on the outcome of the pilot study, no
changes were made in the survey questionnaire as the preliminary findings of the pilot
study tended to support the research model that a higher rate of corruption results in a
lower rate of growth for firms in the computer industry.
A.7: Data Collection through the Internet
The data collection strategy is functionally bifurcated, which is due to the nature
of the study in which the data sources are located at a significant distance from the
researcher. The first stage of data collection involved the use of in-person contact with
respondents and the development of a chain referral system in the Mercosur nations. This
approach generated approximately 40% of the total number of respondents required for
the study. The second and third stages of data collection involved direct solicitation of
participation from managers of computer firms in the Mercosur nations by means of the
internet, and by physical business directories collected in the Mercosur nations.
124
The internet data collection strategy was intended to introduce a greater degree of
randomness into the data collection process to reduce the impact of a lack of
independence in the sampling obtained by means of referrals. The members of the study
population were identified based on online business directories, internet listings, and
other internet-based advertising or promotional sites. Another way to introduce a greater
degree of randomness into the data collection process to reduce the impact of a lack of
independence in the sampling obtained by means of referrals, involved contacting either
by telephone or by mail firms identified through physical business directories. These
business directories were collected for each Mercosur nation during the summer of 2004
and winter break of 2005, when the researcher traveled to the Mercosur nations. Because
of the nature of the study that required access to public information regarding the
financial performance of the firm, identifying the firms also required a determination of
sources of information regarding financial performance. Firms identified from the various
data sources that lacked such information were excluded from participating.
Following identification of the firms and their email addresses, members of the
firm were contacted directly to solicit participation. This strategy was successful in
attracting a relatively high response rate from the individuals solicited for participation in
the study. The high response rate may have been due to the nature of the study, with
considerable interest among managers in the Mercosur nations regarding the impact of
corruption on business operations. Another factor influencing the high response rate was
the identification of the study in the subject line of the email solicitation as an academic
and confidential need for data on the industry. This was necessary to reduce the
125
possibility that the members of the study population did not delete the solicitation before
reading it.
The content of the solicitation email followed the same fundamental structure as
the solicitation procedure for respondents using mail or other means. It contained a cover
letter explaining the purpose of the study, its value for academic research, its value to the
specific industry under study, and an assurance of confidentiality. It also contained
information regarding various individuals and trade associations that support the study to
establish credibility. The solicitation also briefly outlined the expectations from the
respondent regarding filling out and returning by email the relatively short survey
questionnaires. The email solicitations were sent to the sample population in Spanish or
Portuguese in accordance with the country in which the respondent was located. The
introductory materials also noted that the study was based in the United States.
The data collection methodology for the email solicitation called for the
distribution of the survey questionnaire to the individuals who agreed to participate in the
study shortly after receiving consent. A short time frame between receiving consent to
participate and the distribution of the survey questionnaire was deemed important for
insuring that the respondents did not forget that they agreed to participate in the study.
The data collection plan allowed ten days for the return of the completed questionnaire,
and a follow-up email was sent to non-respondents to remind them to fill out the
questionnaire. A second questionnaire was sent to the non-respondents along with the
reminder in the event that they had deleted the original transmission of the questionnaire.
126
The process of solicitation of the firms and mangers to participate in the study
was time consuming during the initial preparation of materials, but various computer
programs could automate the process. The solicitation materials were automatically
customized for the specific respondent, which involved the insertion of a name and
address. The process of tracking incoming completed questionnaires, matching the
questionnaires with the firm’s financial data, and the generation of reminders for the
respondents that failed to fill out the survey questionnaires was also automated. The
manual processes were limited to the entry of data into the various coding frames upon
the return of a completed survey questionnaire. This automation of processes helped to
realize the significant advantages of the internet data collection methodology due to its
rapid speed and relatively low cost.
The sampling strategy was required to compensate for the disproportionate size of
the computer industry in Brazil and Argentina when compared to Paraguay and Uruguay.
Because of this disproportionate size, a random sampling of the study population would
produce overall findings more likely to reflect the conditions and perceptions in the two
larger nations, which would dominate the total data. The strategy adopted to compensate
for this issue was the use of the disproportionate stratified sampling method that draws a
disproportionate number of samples from certain strata when compared to other strata.
When the total number of responses exceeded the minimum number necessary to support
the desired confidence interval and level, the random selection process used to select the
127
samples for the study contained a factor to create a disproportionate representation from
the two smaller Mercosur nations.
The use of the bifurcated data collection process that used both chain referrals and
random selection via the internet also compensated for the sampling difficulty associated
with collection of data via the internet of firms without a website or email capacity. This
problem represented an inherent structural flaw in the methodology, where members of
the sample population that could not be reached through the internet would be excluded
from the study. Because the study involved the computer industry, however, this
structural flaw was likely to have had minimal impact on the data collection process.
Nonetheless, the use of the chain referral method for some of collection of data could
potentially access members of the study population lacking access to internet resources.
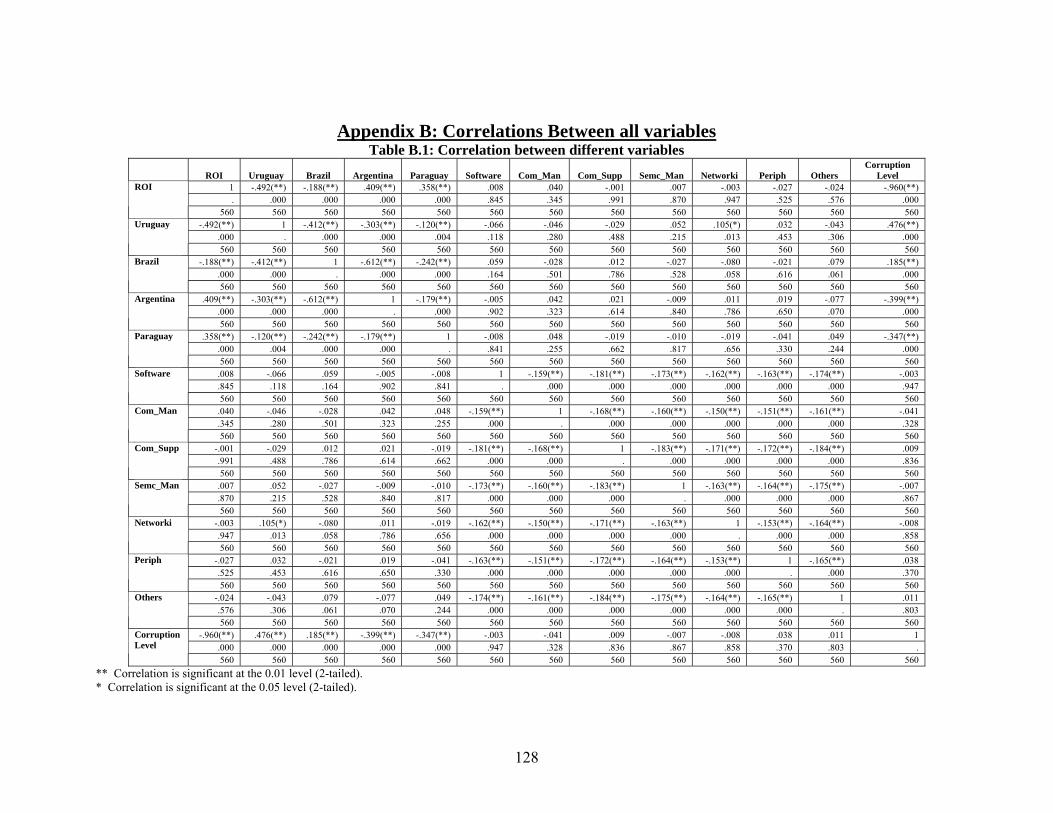
128
Appendix B: Correlations Between all variables Table B.1: Correlation between different variables
ROI Uruguay Brazil Argentina Paraguay Software Com_Man Com_Supp Semc_Man Networki Periph Others Corruption
Level 1 -.492(**) -.188(**) .409(**) .358(**) .008 .040 -.001 .007 -.003 -.027 -.024 -.960(**) . .000 .000 .000 .000 .845 .345 .991 .870 .947 .525 .576 .000
ROI 560 560 560 560 560 560 560 560 560 560 560 560 560
-.492(**) 1 -.412(**) -.303(**) -.120(**) -.066 -.046 -.029 .052 .105(*) .032 -.043 .476(**) .000 . .000 .000 .004 .118 .280 .488 .215 .013 .453 .306 .000
Uruguay 560 560 560 560 560 560 560 560 560 560 560 560 560
-.188(**) -.412(**) 1 -.612(**) -.242(**) .059 -.028 .012 -.027 -.080 -.021 .079 .185(**) .000 .000 . .000 .000 .164 .501 .786 .528 .058 .616 .061 .000
Brazil 560 560 560 560 560 560 560 560 560 560 560 560 560
.409(**) -.303(**) -.612(**) 1 -.179(**) -.005 .042 .021 -.009 .011 .019 -.077 -.399(**) .000 .000 .000 . .000 .902 .323 .614 .840 .786 .650 .070 .000
Argentina 560 560 560 560 560 560 560 560 560 560 560 560 560
.358(**) -.120(**) -.242(**) -.179(**) 1 -.008 .048 -.019 -.010 -.019 -.041 .049 -.347(**) .000 .004 .000 .000 . .841 .255 .662 .817 .656 .330 .244 .000
Paraguay 560 560 560 560 560 560 560 560 560 560 560 560 560
.008 -.066 .059 -.005 -.008 1 -.159(**) -.181(**) -.173(**) -.162(**) -.163(**) -.174(**) -.003
.845 .118 .164 .902 .841 . .000 .000 .000 .000 .000 .000 .947 Software 560 560 560 560 560 560 560 560 560 560 560 560 560
.040 -.046 -.028 .042 .048 -.159(**) 1 -.168(**) -.160(**) -.150(**) -.151(**) -.161(**) -.041
.345 .280 .501 .323 .255 .000 . .000 .000 .000 .000 .000 .328 Com_Man 560 560 560 560 560 560 560 560 560 560 560 560 560
-.001 -.029 .012 .021 -.019 -.181(**) -.168(**) 1 -.183(**) -.171(**) -.172(**) -.184(**) .009 .991 .488 .786 .614 .662 .000 .000 . .000 .000 .000 .000 .836
Com_Supp 560 560 560 560 560 560 560 560 560 560 560 560 560
.007 .052 -.027 -.009 -.010 -.173(**) -.160(**) -.183(**) 1 -.163(**) -.164(**) -.175(**) -.007
.870 .215 .528 .840 .817 .000 .000 .000 . .000 .000 .000 .867 Semc_Man 560 560 560 560 560 560 560 560 560 560 560 560 560
-.003 .105(*) -.080 .011 -.019 -.162(**) -.150(**) -.171(**) -.163(**) 1 -.153(**) -.164(**) -.008 .947 .013 .058 .786 .656 .000 .000 .000 .000 . .000 .000 .858
Networki 560 560 560 560 560 560 560 560 560 560 560 560 560
-.027 .032 -.021 .019 -.041 -.163(**) -.151(**) -.172(**) -.164(**) -.153(**) 1 -.165(**) .038 .525 .453 .616 .650 .330 .000 .000 .000 .000 .000 . .000 .370
Periph 560 560 560 560 560 560 560 560 560 560 560 560 560
-.024 -.043 .079 -.077 .049 -.174(**) -.161(**) -.184(**) -.175(**) -.164(**) -.165(**) 1 .011 .576 .306 .061 .070 .244 .000 .000 .000 .000 .000 .000 . .803
Others 560 560 560 560 560 560 560 560 560 560 560 560 560
-.960(**) .476(**) .185(**) -.399(**) -.347(**) -.003 -.041 .009 -.007 -.008 .038 .011 1 .000 .000 .000 .000 .000 .947 .328 .836 .867 .858 .370 .803 .
Corruption Level 560 560 560 560 560 560 560 560 560 560 560 560 560
** Correlation is significant at the 0.01 level (2-tailed). * Correlation is significant at the 0.05 level (2-tailed).
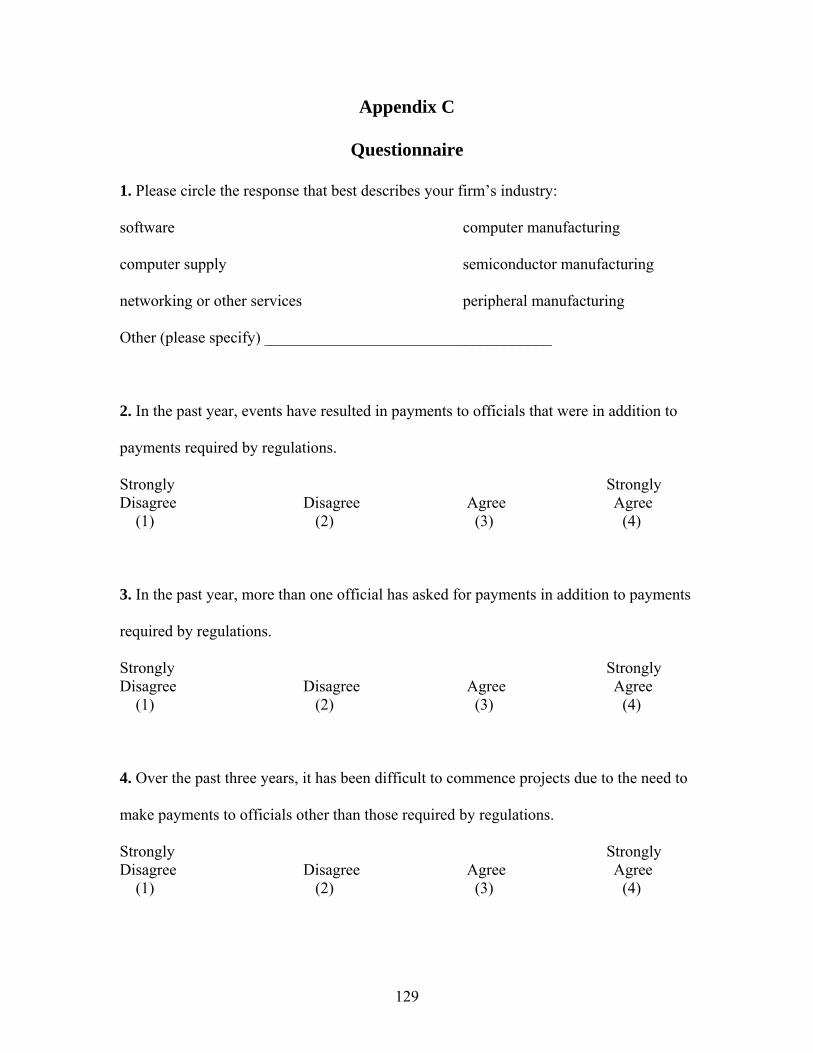
129
Appendix C
Questionnaire
1. Please circle the response that best describes your firm’s industry:
software computer manufacturing
computer supply semiconductor manufacturing
networking or other services peripheral manufacturing
Other (please specify) ____________________________________
2. In the past year, events have resulted in payments to officials that were in addition to
payments required by regulations.
Strongly Strongly Disagree Disagree Agree Agree (1) (2) (3) (4)
3. In the past year, more than one official has asked for payments in addition to payments
required by regulations.
Strongly Strongly Disagree Disagree Agree Agree (1) (2) (3) (4)
4. Over the past three years, it has been difficult to commence projects due to the need to
make payments to officials other than those required by regulations.
Strongly Strongly Disagree Disagree Agree Agree (1) (2) (3) (4)
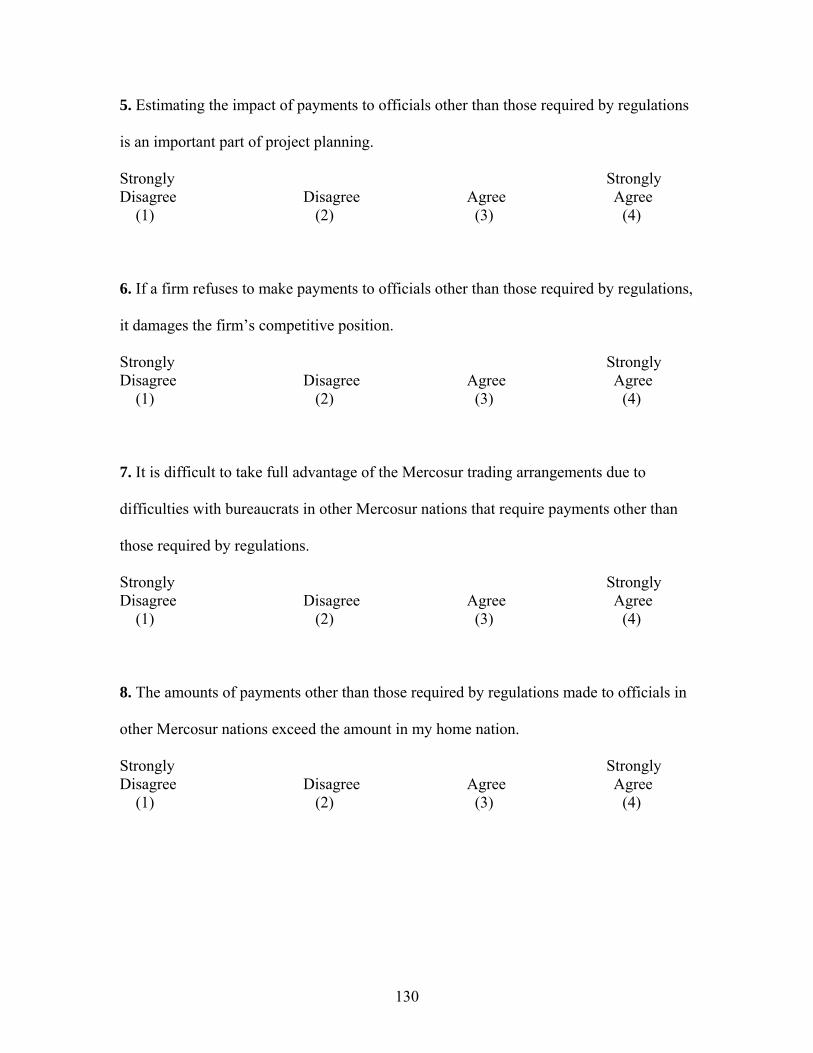
130
5. Estimating the impact of payments to officials other than those required by regulations
is an important part of project planning.
Strongly Strongly Disagree Disagree Agree Agree (1) (2) (3) (4)
6. If a firm refuses to make payments to officials other than those required by regulations,
it damages the firm’s competitive position.
Strongly Strongly Disagree Disagree Agree Agree (1) (2) (3) (4)
7. It is difficult to take full advantage of the Mercosur trading arrangements due to
difficulties with bureaucrats in other Mercosur nations that require payments other than
those required by regulations.
Strongly Strongly Disagree Disagree Agree Agree (1) (2) (3) (4)
8. The amounts of payments other than those required by regulations made to officials in
other Mercosur nations exceed the amount in my home nation.
Strongly Strongly Disagree Disagree Agree Agree (1) (2) (3) (4)