correspondence - the national medical journal of...
TRANSCRIPT
THE NATIONAL MEDICAL JOURNAL OF INDIA
CorrespondenceVOL. 12, NO.6, 1999 297
Caesarean section deliveries on the risein Kerala
It is indeed a matter of concern that delivery bycaesarean section (CS) is reported to be around45% in urban Chennai.' In Kerala, with an institu-tional delivery rate of 95.2% in 1994, the CS ratesare also repnrted to be high and over the years thishas been increasing. In 1987, a study' in ruralKerala showed that the CS rate was 11.9%. Theproportion of CS in government hospitals was12.6% and in private hospitals 16.5%. In the lowsocio-economic status (SES) group, the propor-tion was 9.3% and in the high SES group 19.3%.This is in contrast to the findings in a study fromChennai city where they did not find any variationbetween different SES groups.'
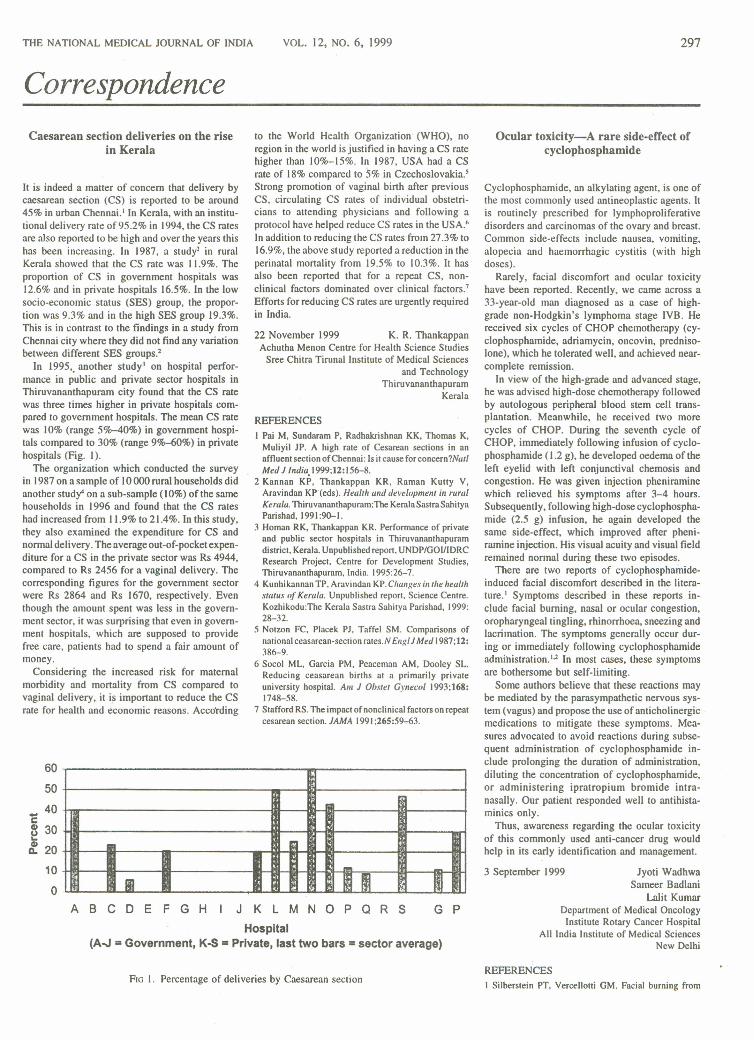
In 1995" another study" on hospital perfor-mance in public and private sector hospitals inThiruvananthapuram city found that the CS ratewas three times higher in private hospitals com-pared to government hospitals. The mean CS ratewas 10% (range 5%-40%) in government hospi-tals compared to 30% (range 9~0%) in privatehospitals (Fig. I).
The organization which conducted the surveyin 1987 on a sample of 10000 rural households didanother study" on a sub-sample (10%) of the samehouseholds in 1996 and found that the CS rateshad increased from 11.9% to 21.4%. In this study,they also examined the expenditure for CS andnormal delivery. The average out-of-pocket expen-diture for a CS in the private sector was Rs 4944,compared to Rs 2456 for a vaginal delivery. Thecorresponding figures for the government sectorwere Rs 2864 and Rs 1670, respectively. Eventhough the amount spent was less in the govern-ment sector, it was surprising that even in govern-ment hospitals, which are supposed to providefree care, patients had to spend a fair amount ofmoney.
Considering the increased risk for maternalmorbidity and mortality from CS compared tovaginal delivery, it is important to reduce the CSrate for health and economic reasons. According
605040
Ce 30~ 20
10
o
to the World Health Organization' (WHO), noregion in the world is justified in having a CS ratehigher than 10%-15%. In 1987, USA had a CSrate of 18% compared to 5% in Czechoslovakia.'Strong promotion of vaginal birth after previousCS, circulating CS rates of individual obstetri-cians to attending physicians and following aprotocol have helped reduce CS rates in the USA .•In addition to reducing the CS rates from 27.3% to16.9%, the above study reported a reduction in theperinatal mortality from 19.5% to 10.3%. It hasalso been reported that for a repeat CS, non-clinical factors dominated over clinical factors.'Efforts for reducing CS rates are urgently requiredin India.
22 November 1999 K. R. ThankappanAchutha Menon Centre for Health Science Studies
Sree Chitra Tirunal Institute of Medical Sciencesand Technology
ThiruvananthapuramKerala
REFERENCESI Pai M, Sundaram P, Radhakrishnan KK, Thomas K,
Muliyil IP. A high rate of Cesarean sections in anaffluent section ofChennai: Is it cause forconcern?NallMed 1 India 1999;12:156-8.
2 Kannan KP, Thankappan KR, Raman Kutty V,Aravindan KP·(eds). Healtb and development in ruralKuala. Thiruvananthapuram:The KeralaSastraSahityaParishad,1991:90-1.
3 Homan RK, Thankappan KR. Performance of privateand public sector hospitals in Thiruvananthapuramdistrict, Kerala. Unpublished report, UNDP/GOIIIDRCResearch Project, Centre for Development Studies.Thiruvananthapuram. India. 1995:26-7.
4 Kunhikannan TP. Aravindan KP.Changes ill the healthstatus of Keralu. Unpublished report. Science Centre.Kozhikodu:The Kerala Sasrra Sahitya Parishad, 1999:28-32.
5 Notzon FC. Placek Pl. Taffel SM. Comparisons ofnational ceasarean-secrion ttues.N EI1/1IJ Med 1987;12:386-9.
6 Socol ML. Garcia PM, Peaceman AM, Dooley SL.Reducing ceasarean births at a primarily privateuniversity hospital. Alii 1 Obstet Gvnecol 1993;168:1748-58.
7 Stafford RS.The impact of nonclinical factors on repeatcesarean section. lAMA 1991;265:59-63.
-III '. 1ft III m
ABC D E F G H J K L M N 0 P Q R S G P
Hospital(A.J = Government, K-S = Private, last two bars = sector average)
FIG I. Percentage of deliveries by Caesarean section
Ocular toxicity-A rare side-effect ofcyclophosphamide
Cyclophosphamide, an alkylating agent. is one ofthe most commonly used antineoplastic agents. Itis routinely prescribed for Iymphoproliferativedisorders and carcinomas of the ovary and breast.Common side-effects include nausea, vomiting,alopecia and haemorrhagic cystitis (with highdoses).
Rarely, facial discomfort and ocular toxicityhave been reported. Recently, we came across a33-year-old man diagnosed as a case of high-grade non-Hodgkin's lymphoma stage IVB. Hereceived six cycles of CHOP chemotherapy (cy-clophosphamide, adriamycin, oncovin, predniso-lone), which he tolerated well, and achieved near-complete remission.
In view of the high-grade and advanced stage,he was advised high-dose chemotherapy followedby autologous peripheral blood stem cell trans-plantation. Meanwhile, he received two morecycles of CHOP. During the seventh cycle ofCHOP, immediately following infusion of cyclo-phosphamide ( 1.2 g), he developed oedema of theleft eyelid with left conjunctival chemosis andcongestion. He was given injection pheniraminewhich relieved his symptoms after 3-4 hours.Subsequently, following high-dose cyclophospha-mide (2.5 g) infusion, he again developed thesame side-effect, which improved after pheni-ramine injection. His visual acuity and visual fieldremained normal during these two episodes.
There are two reports of cyclophosphamide-induced facial discomfort described in the litera-ture.' Symptoms described in these reports in-clude facial burning, nasal or ocular congestion,oropharyngeal tingling, rhinorrhoea, sneezing andlacrimation. The symptoms generally occur dur-ing or immediately following cyclophosphamideadministration.P In most cases, these symptomsare bothersome but self-limiting.
Some authors believe that these reactions maybe mediated by the parasympathetic nervous sys-tem (vagus) and propose the use of anticholinergicmedications to mitigate these symptoms. Mea-sures advocated to avoid reactions during subse-quent administration of cyclophosphamide in-clude prolonging the duration of administration,diluting the concentration of cyclophosphamide,or administering ipratropium bromide intra-nasally. Our patient responded well to antihista-minics only.
Thus, awareness regarding the ocular toxicityof this commonly used anti-cancer drug wouldhelp in its early identification and management.
3 September 1999 Jyoti WadhwaSameer Badlani
Lalit KumarDepartment of Medical OncologyInstitute Rotary Cancer Hospital
All India Institute of Medical SciencesNew Delhi
REFERENCESI Silberstein PT, Vercellotti GM. Facial burning from
298
cyclophosphamide. Cancer Treat Rep 1984;68:1057.2 Kosirog-Glowacki JL, Bressler LR. Cyclophosphamide-
induced facial discomfort. Ann Pharmacother1994;28: 197-9.
Indicators of iodine deficiency disorders
We read the article entitled 'Interpretation ofindicators of iodine deficiency disorders: Recentexperiences" with great interest and found it in-formative and useful.
The authors have proposed a new cut-off ofindicators for establishing the status of iodinedeficiency disorders ODDs) in a population. In theproposed classification, goitre grade I has beenmerged with normal-size thyroid gland. Also, theurinary iodine excretion (VIE) levels have beenrevised.
The prevalence of goitre reflects the past whileVIE levels indicate the current status of iodinenutrition in a community. Recent studies con-ducted in India amongst children 6-12 years ofage have revealed the total goitre prevalence tovary from I % to 20%. Similarly, goitre grade II(visible goitre) prevalence was in the range of 0%to 2%. Merging of grade I with grade 0 would haveprovided the prevalence rate of visible goitre from0% to 2% in these studies undertaken. A multi-centric study of the Indian Council of MedicalResearch also reported total goitre prevalence of5.1 %, 4.2%, 2.2% and 0.2% in school children inselected districts of Jammu and Kashmir, UttarPradesh, Himachal Pradesh and Maharashtra,respectively.
The prevalence of visible goitre has been re-ported to be low (range 0% to 2%) by other investi-gators also.":" It would be difficult to categorizethe small range of visible goitre into those due tomild, moderate and severe iodine deficiency. Be-fore revising the existing classification, there is aneed to establish a correlation between the preva-lence of visible goitre and VIE levels in mild,
THE NATIONAL MEDICAL JOURNAL OF INDIA VOL, 12, NO, 6, 1999
moderate and severe iodine-deficient populations.The sample size of these studies should be ade-quate 10 make scientifically valid conclusions.
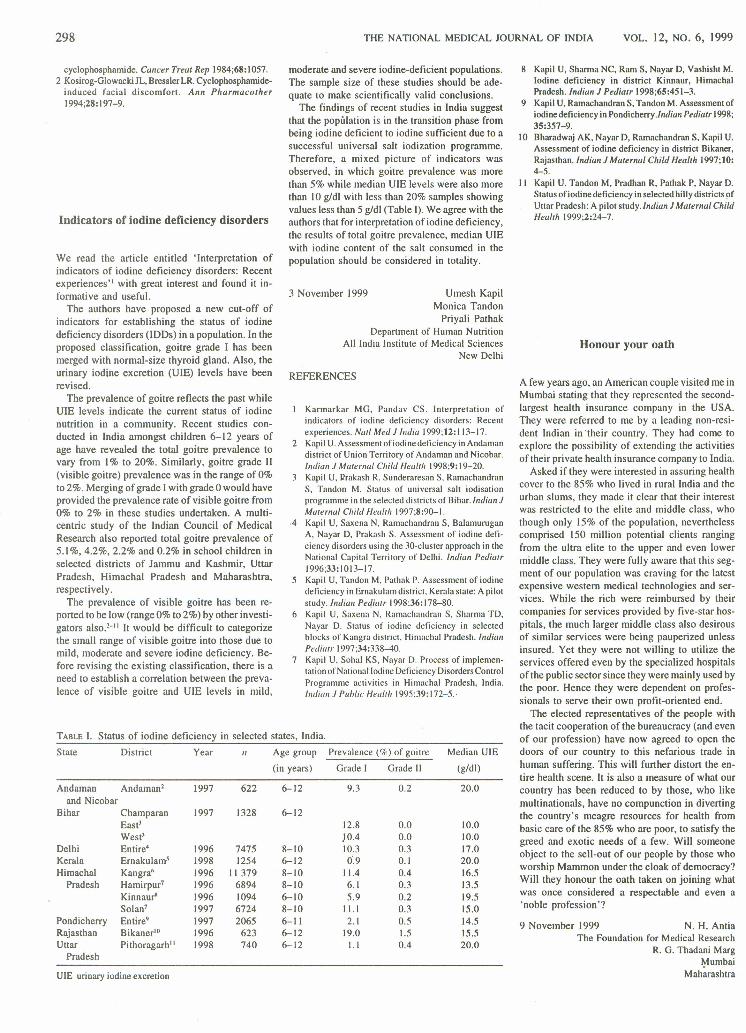
The findings of recent studies in India suggestthat the population is in the transition phase frombeing iodine deficient to iodine sufficient due to asuccessful universal salt iodization programme.Therefore, a mixed picture of indicators wasobserved, in which goitre prevalence was morethan 5% while median UIE levels were also morethan 10 g/dl with less than 20% samples showingvalues less than 5 g/dl (Table I). We agree with theauthors that for interpretation of iodine deficiency,the results of total goitre prevalence, median UIEwith iodine content of the salt consumed in thepopulation should be considered in totality.
3 November 1999 Umesh KapilMonica Tandon
Priyali PathakDepartment of Human Nutrition
All India Institute of Medical SciencesNew Delhi
REFERENCES
Karmarkar MG, Pandav CS. Interpretation ofindicators of iodine deficiency disorders: Recentexperiences. Natl Med J India 1999;12:113-17.
2 Kapil U. Assessment of iodine deficiency in Andamandistrict of Union Territory of Andaman and Nicobar.Indian J Maternal Child Health 1998;9: 19-20.Kapil U, L'rakash R, Sunderaresan S, RamachandranS, Tandon M. Status of universal salt iodisationprogramme in the selected districts of Bihar. Indian JMaternal Child Health 1997;8:90-1.
-4 Kapil U, Saxena N, Ramachandran S, BalamuruganA, Nayar D, Prakash S. Assessment of iodine defi-ciency disorders using the 30-c1uster approach in theNational Capital Territory of Delhi. Indian Pediatr1996;33:1013-17.
5 Kapil U, Tandon M, Pathak P. Assessment of iodinedeficiency in Ernaku lam district, Kerala state: A pilotstudy. Indian Pediotr 1998:36: 178-80.
6 Kapil U, Saxena N, Ramachandran S, Sharma TD,Nayar D. Status of iodine deficiency in selectedblocks of Kangra district, Himachal Pradesh. IndianPediatr 1997;34:338-40.
7 Kapil U, Sohal KS, Nayar D. Process of implemen-tationofNationallodine Deficiency Disorders ControlProgramme activities in Himachal Pradesh, India.Indian J Puhlic Health 1995;39:172-5.·
TABLE I. Status of iodine deficiency in selected states, India.
State District Year II Age group Prevalence (%) of goitre Median UIE
(in years) Grade I Grade II (g/dl)
Andaman Andaman? 1997 622 6-12 9.3 0.2 20.0and Nicobar
Bihar Champaran 1997 1328 6-12East' 12.8 0.0 10.0West' )0.4 0.0 10.0
Delhi Entire' 1996 7475 8-10 10.3 0.3 17.0Kerala Ernakulam' 1998 1254 6-12 0.9 0.1 20.0Himachal Kangra" 1996 11379 8-10 11.4 0.4 16.5
Pradesh Hamirpur? 1996 6894 8-10 6.1 0.3 13.5Kinnaur" 1996 1094 6-10 5.9 0.2 19.5Solan' 1997 6724 8-10 II.I 0.3 15.0
Pondicherry Entire" 1997 2065 6-11 2.1 0.5 14.5Rajasthan Bikaner'" 1996 623 6-12 19.0 1.5 15.5Uttar Pithoragarh" 1998 740 6-12 1.1 0.4 20.0
Pradesh
UlE urinary iodine excretion
8 Kapil U, Sharma NC, Ram S, Nayar D, Vashisht M.Iodine deficiency in district Kinnaur, HimachalPradesh. Indian J Pediatr 1998;65:451-3.
9 Kapil U, Ramachandran S, Tandon M. Assessment ofiodine deficiency in Pondicherry .lndiunPediatr 1998;35:357-9.
10 Bharadwaj AK, Nayar D, Ramachandran S, Kapil U.Assessment of iodine deficiency in district Bikaner,Rajasthan. Indian J Maternal Child Health 1997;10:4-5.
I I Kapil U. Tandon M, Pradhan R, Pathak P, Nayar D.Status of iodine deficiency in selected hilly districts ofUttar Pradesh: A pilot study.lndian J Maternal ChildHealth 1999;2:24-7.
Honour your oath
A few years ago, an American couple visited me inMumbai stating that they represented the second-largest health insurance company in the USA.They were referred to me by a leading non-resi-dent Indian in 'their country. They had come toexplore the possibility of extending the activitiesof their private health insurance company to India.
Asked if they were interested in assuring healthcover to the 85% who lived in rural India and theurban slums, they made it clear that their interestwas restricted to the elite and middle class, whothough only 15% of the population, neverthelesscomprised 150 million potential clients rangingfrom the ultra elite to the upper and even lowermiddle class. They were fully aware that this seg-ment of our population was craving for the latestexpensive western medical technologies and ser-vices. While the rich were reimbursed by theircompanies for services provided by five-star hos-pitals, the much larger middle class also desirousof similar services were being pauperized unlessinsured. Yet they were not wi11ing to utilize theservices offered even by the specialized hospitalsof the public sector since they were mainly used bythe poor. Hence they were dependent on profes-sionals to serve their own profit-oriented end.
The elected representatives of the people withthe tacit cooperation of the bureaucracy (and evenof our profession) have now agreed to open thedoors of our country to this nefarious trade inhuman suffering. This will further distort the en-tire health scene. It is also a measure of what ourcountry has been reduced to by those, who likemultinationals, have no compunction in divertingthe country's meagre resources for health frombasic care of the 85% who are poor, to satisfy thegreed and exotic needs of a few. Will someoneobject to the sell-out of our people by those whoworship Mammon under the cloak of democracy?Will they honour the oath taken on joining whatwas once considered a respectable and even a'noble profession'?
9 November 1999 N. H. AntiaThe Foundation for Medical Research
R. G. Thadani Marg¥umbai
Maharashtra
CORRESPONDENCE
Polio eradication in India: Are we on thecorrect path?
Eradication represents the ultimate control of aninfectious disease. Smallpox eradication has beenone of the most important contributions to publichealth and preventive medicine in terms of savingmillions of lives and money. The other infectiousdisease which is on the verge of eradication ispoliomyelitis. I It is a tremendous achievement onthe part of the World Health Organization (WHO),which with the active cooperation of Rotary Inter-national and governments around the world, hasbrought polio eradication measures to a final phase.From 35 252 cases reported in 19882 the numberhas dropped dramatically to 5000 cases in 1998. InIndia, the reported cases of paralytic poliomyelitisdecreased from 24 257 cases in 1988 to 3556 in1998. If the present level of funding and coopera-tion continues, the world could well be free ofpolio by the year 2003, a moderate re-estimationof the 1998 WHO goal of polio eradication by theyear 2000.'
The strategies for eradication of wild polioviruses have been defined as:" (i) maintaining highoral polio virus immunization coverage by admin-istering three doses of primary immunization tochildren below 12 months of age; (ii) supplemen-tary immunization campaigns through nationalimmunization days (NIDs) conducted twice a year4-6 weeks apart; (iii) mopping-up, door-to-doorlocalized immunization campaigns targeted athigh-risk areas where wild polio virus transmis-sion is likely to persist; and (iv) developing effec-tive surveillance systems capable of detecting andinvestigating every case of acute flaccid paralysis(AFP) which could be due to polio.
According to the WHO, active surveillance forAFP'·· is based on epidemiological and virologi-cal information obtained from stool specimens ofsuspected cases. The sensitivity of surveillance isdefined by the rate of non-polio cases among thetotal paralytic cases reported, and that of ade-quacy of stool samples collected for wild poliovirus culture and identification. The isolates arethen classified as polio or non-polio types. This isof critical importance to permit certification ofpoliomyelitis eradication. In India, nine WHOsurveillance centres are accredited to conductpoliovirus isolation from AFP cases and to ulti-mately certify the country free of polio. Certifica-tion depends on: (i) no detection of paralytic poliocases caused by wild virus for a 3-year period;(ii) a satisfactory surveillance system to distin-guish polio virus infections from other causes ofparalysis; and (iii) environmental surveys (e.g.sewage, stools, etc.) to demonstrate the absence ofwild polio viruses.
Embarking upon lItl eradication programme
Just as eradication of smallpox served as the foun-dation for eradication of polio, the successes andfailures of this campaign would provide lessonsfor future eradication and elimination initiatives.'Elimination of infection has been practised in thecase of polio with the aim of reducing the inci-dence of infection to zero in a defined geographi-cal area. This also requires ongoing measures toprevent re-establishment of viral transmission.The factors that favour eradication" of polio are(i) limitation of the disease to a human host,
without an animal reservoir or insect vector;(ii) easily diagnosed clinically; (iii) availability oftwo safe and potent vaccines which could inter-rupt wild virus transmission; and (iv) a techno-logical change that has simplified the logistics byintroduction of an individual vaccine vial monitor(VVM), a thermo-sensitive marker which changescolour when exposed to heat.
Since December 1995, India with active sup-port from tbe WHO and international fundingagencies has conducted massive polio immuniza-tion drives called 'pulse polio' campaigns. Des-pite this, there has been an increase in AFP cases.From the available information it is evident that:
I. In 1998, a total of 1281 confirmed cases ofpoliomyelitis associated with wild polio virusisolation were reported (Table I). There hasbeen a rise in cases of AFP, from 1005 in 1996to 3556 in 1998.
2. Despite high immunization, coverage, there iswidespread circulation and upsurge of polio-virus type I and type 3 with focal circulationof polio virus type 2 in various states of India.
3. The ·continued circulation of wild polio virusin places which have conducted 4 or moreNIDs is an indicator of the failure to immunizea large enough population.
These could be due to:
I. continued under-reporting of cases,2. poor sanitation, and unhygienic and poor
standards oflivingespecially, in crowded urbanslums,
3. failure of the vaccine to induce appropriateneutralizing antibody levels,
4. insufficient field studies with regard to deter-mination of vaccine efficacy and seroprotec-tion, and
5. frequent failures in cold chain (-20 "C) main-tenance.
At present, four cycles of NIDs have been con-ducted and more than US$ 1000 million have beenspent on polio eradication. Two policy options areevident.
Persisting with the OPV and Nllrs till polio iseradicated
In view of WHO's worldwide success with OPVand the logistics and ease of OPV administration,it is probably best to continue with the currentstrategy. With OPV, eradication measures prima-rily aim to achieve an interruption in the wild viruscirculation with a Sabin vaccine strain in thepopulation. The vaccine strains persist with the
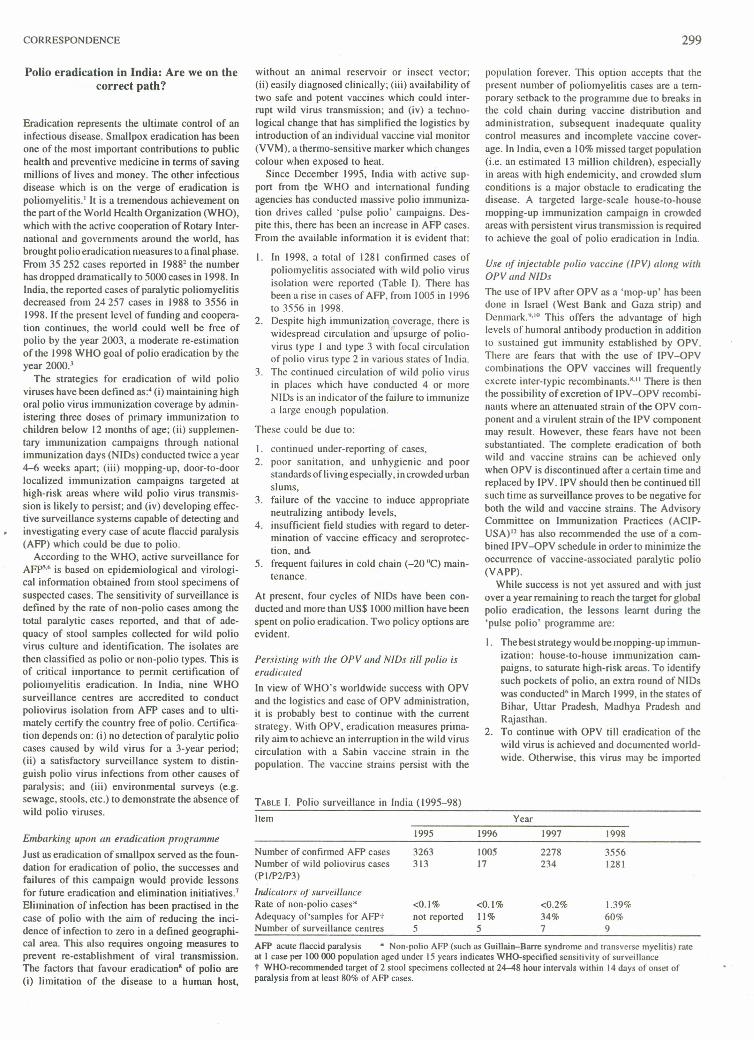
TABLEI. Polio surveillance in India (1995-98)
299
population forever. This option accepts that thepresent number of poliomyelitis cases are a tem-porary setback to the programme due to breaks inthe cold chain during vaccine distribution andadministration, subsequent inadequate qualitycontrol measures and incomplete vaccine cover-age. In India, even a 10% missed target population(i.e. an estimated 13 million children), especiallyin areas with high endemicity, and crowded slumconditions is a major obstacle to eradicating thedisease. A targeted large-scale house-to-housemopping-up immunization campaign in crowdedareas with persistent virus transmission is requiredto achieve the goal of polio eradication in India.
Use of injectable polio vaccine (IPV) along withOPV and ntt»The use of IPV after OPV as a 'mop-up' has beendone in Israel (West Bank and Gaza strip) andDenmark .•.IH This offers the advantage of highlevels of humoral antibody production in additionto sustained gut iinmunity established by OPV.There are fears that with the use of IPV-OPVcombinations the OPV vaccines will frequentlyexcrete inter-typic recombinants."!' There is thenthe possibility of excretion of IPV -OPV recombi-nants where an attenuated strain of the OPV com-ponent and a virulent strain of the IPV componentmay result. However, these fears have not beensubstantiated. The complete eradication of bothwild and vaccine strains can be achieved onlywhen OPV is discontinued after a certain time andreplaced by IPV. IPV should then be continued tillsuch time as surveillance proves to be negative forboth the wild and vaccine strains. The AdvisoryCommittee on Immunization Practices (ACIP-USA)" has also recommended the use of a com-bined IPV-OPV schedule in order to minimize theoccurrence of vaccine-associated paralytic polio(VAPP).
While success is not yet assured and with justover a year remaining to reach the target for globalpolio eradication, the lessons learnt during the'pulse polio' programme are:
I. The best strategy would be mopping-up immun-ization: house-to-house immunization cam-paigns. to saturate high-risk areas. To identifysuch pockets of polio, an extra round of NIDswas conducted" in March 1999, in the states ofBihar, Uttar Pradesh. Madhya Pradesh andRajasthan.
2. To continue with OPV till eradication of thewild virus is achieved and documented world-wide. Otherwise, this virus may be imported
1995 1998
Item Year1996 1997
Number of confirmed AFP casesNumber of wild poliovirus cases(PI/P2/P3)
3263313
Indicators of surveillanceRate of non-polio cases'Adequacy of"samples for AFP+Number of surveillance centres
<0.1%not reported5
100517
2278234
35561281
<0.1%11%5
<0.2%34%7
1.39%60%9
AFP acute flaccid paralysis • Non-polio AFP (such as Guillain-Barre syndrome and transverse myelitis) rateat I case per 100 ()()()population aged under 15years indicates WHO-specified sensitivity of surveillancet WHO-recommended target of 2 stool specimens collected at 24--48 hour intervals within 14 days of onset ofparalysis from at least 80% of AFP cases.
300
and may spread widely in the absence ofcontinued or inadequately immunized sub-populations.
3. Immunization with IPV should be considered.This will avoid any OPV-induced AFP. onceeradication is achieved.
Having corne this far. it would be tragic if the goalsare not met and polio remains a risk for childrenbeyond the year 2000.
6 November 1999 Renu JainT. Ajay KumarSurinder Singh
Virology LaboratoryNational Institute of Biologicals
New Delhi
REFERENCESI World Health Assembly. Global eradication 1I111111io-
myelitis by the year 2000. Geneva:World HealthOrganization. 1998,WHO resolution no. WHA41.28.
2 Hull HF, de Quadros C, Bilous J, Oblapenko G,Andrus J, Aslanian R, et al. Perspectives from theglobal poliomyelitis eradication initiative.Bull WorldHellith OrKlln 1998;76:42-6.
3 Dove AW. Racaniello YR. The polio eradicationeffort: Should vaccine eradication be next? Science1997;277:779-80.
4 Expanded Programme on Immunization (EPI).Progress towards the global eradication of polio-myelitis, 1996.Wk/y Epidemiol Rec 1997;72: 189-94.
5 Acute flaccid paralysis (AFP) surveillance: Thesurveillance strategy for poliomyelitis eradication.Wkly Epidemio! Rec 1998;73: 113-20.
6 Progress towards polio eradication South-East Asia,1997-98. WHy Epidemiol Rec 1999;74:90-3.
7 Dowdle }YR.The principles of disease eliminationand eradication. Bull World Health Organ 1998;76:22-5.
8 Robbins FC. Polio-historical. In: Plotkin SA,Mortimer EA Jr, (eds). Vaccines. Philadelphia:WBSaunders, 1994:137-54.
9 Goldblum N, Gerichter CB, Tu1chinskyTH, MelnickJL. Poliomyelitis control in Israel, the West Bank andGaza strip: Changing strategies with the goal of eradi-cation in an endemic area. Bull World Health Organ1994;72:783-96.
10 Melnick JL. Combined use oflive and killed vaccinesto control poliomyelitis in tropical areas. Dev BioiStand 1981;47:265-73.
II Ogra PL, Faden HS, Abraham R, Duffy LC, Sun M,Minor PD. Effect of prior immunity on the sheddingof virulent revertant virus in feces after oral immuniza-tion with live attenuated poliovirus vaccine. J InfectDi.v 1991;164:191-4.
12 Centers for Disease Control and Prevention.Poliomyelitis prevention in the United States:Introduction of a sequential vaccination schedule ofinactivated poliovirus vaccine followed by oralpoliovirus vaccine. MMWR 1997;96:1-25.
THE NATIONAL MEDICAL JOURNAL OF INDIA VOL. 12, No.6, 1999
Mortality due to adverse drug reactionsin a large general hospital
The World Health Organization defines an ad-verse drug reaction (ADR) as any noxious, un-intended. undesired effect of a drug that occurs atdoses used in man for diagnosis, prophylaxis ormodification of physiological function. A seriousADR is defined as one that requires hospitaliza-tion. is permanently disabling, or results in death(serious ADRs thus include fatal ADRs).' ADRsaccount for 2~'10 of hospital admissions, areencountered in 30% of hospitalized patients and,in addition, .15% of admitted patients have theirhospital stay prolonged by ADRs.' In the USA, itis estimated that ADRs could account for morethan 100 000 deaths each year; making them thefourth most common cause of death after heartdisease. cancer and stroke.' Studies of ADR inci-dence in the hospital setting have been carried outsince the 1960s. We report here a retrospectiveanalysis of hospital records at the King EdwardMemorial VII Hospital. a large Indian generalhospital and our findings about the nature andproportion of deaths due to ADRs.
This study was carried out as part of the ADRmonitoring activities of the Drugs ControllerGeneral's ADR centre at the Department of Clini-cal Pharmacology, which is also a WHO specialcentre.
Hospital admission registers (all admissions toall wards) of the year 1996 were systematicallyscreened and data on deaths were noted. Fromthese. based on the cause of death written in theregister. deaths attributed to ADRs were sepa-rated. Once a death was identified as being ADR-related. the case notes of the patient were obtainedand the following details noted: age and sex of thepatient. diagnosis, management, total number ofdrugs received, whether the patient was hospital-ized with the ADR or developed it in dur-ing hisJher stay in the hospital, and the suspected drug towhich the ADR was attributed.
There were 62647 admissions in 1996 and 4840deaths, giving a mortality rate of 7.7%. Of these,23 (14 women, 9 men) deaths were classified asdue to ADRs (0.48% of all deaths). There were 18adult, 2 geriatric and 3 paediatric deaths. Fifteenof these were attributed to antitubercular drugs, 2each to NSAIDs (both ibuprofen), anti-biotics(tetracycline and penicillin), anticancer drugs (cy-clophosphamide and cisplatin) and I each to ra-
die-contrast media and prednisolone. The primaryorgan systems involved were: gastrointestinal ( 16),skin and musculoskeletal systems (2 each) andgenitourinary and cardiovascular systems ( I each).One death was due to anaphylaxis. Twelve of the23 patients were admitted with ADR while IIdeveloped them in the hospital.
Thus, serious ADRs accounted for 0.48% of thetotal deaths and antitubercular drug-induced hepa-totoxicity was the most common cause of death.ADRs as a cause of death were ranked eleventh inour study. Other meta-analyses have shown thatserious ADRs account for 6.7% and fatal ADRsfor 0.32% of the total ADRs occurring in thehospital selling.' In this study, we have not com-puted the fatal ADRs as a percentage of the totalADRs due to the lack of a true incidence.
Our study could be biased towards under-detec-tion of ADR-related deaths, since it was retrospec-tive and based on the cause of death written in thehospital registers as against actual verification orspontaneous reporting of cases. It is also possiblethat physicians may not have recognized or attrib-uted the cause of the death to a particular drug insome cases. Under-reporting of ADRs is a world-wide phenomenon. Reporting of serious and fataladverse reactions, particularly to within-hospitalADR monitoring centres will help provide the trueincidence in the Indian setting.
IS November 1999 S. BalasubramaniamN. J. Gogtay
N. A. KshirsagarADR Monitoring Center of the Drugs Controller
General of IndiaWorld Health Organization Special Center
Department of Clinical PharmacologySeth G.S. Medical College and K.E.M. Hospital
MumbaiMaharashtra
REFERENCESI Edwards R, Biriell C. Harmonization in pharmaco-
vigilance. Drug Safety 1994;10:93-102.2 LivshitsTA, Levy M, Sadan B, Shalit M, GeisslingerG,
Brune K. Computerised surveillance of adverse drugreactions in hospital: Pilot study. Br J Clin Pharmacal1998;45:309-14.
3 Bonn D. Adverse drug reactions remain a major causeofdeath.l..ancet 1998;351:1183.
4 Lazarou J, Pomeranz BH, Corey PN. Incidence ofadverse drug reactions in hospitalized patients: A meta-analysis of prospective studies. JAMA 1998;279:1200-5.