correlation of measured fractal dimensions with … original paper forma, 14, 249–263, 1999...
TRANSCRIPT
249
Forma, 14, 249–263, 1999Original Paper
Correlation of Measured Fractal Dimensions with Lacunarities inComputer-Generated Three-Dimensional Images of Cantor Sets
and Those of Fractional Brownian Motion
Masaharu DOMON and Eiichi HONDA
Department of Dental Radiology and Radiation Research, Tokyo Medical and Dental University,1-5-45 Yushima, Bunkyo-ku, Tokyo 113-8549, Japan
(Received August 5, 1999; Accepted October 25, 1999)
Abstract. Three-dimensional images constructed by CT and MRI has been recently takenas routine diagnosis in medicine and so measures such as fractal dimensions. Lacunaritiesfor 3-dimensional networks or textures are expected to be used as diagnostic parameters.The method of moments and the box counting method to estimate the fractal dimensionsof images were examined for their reliability, using images with theoretical fractal-dimensions, which computationally implemented from 3-dimensional triadic Cantor setsand 3-dimensional fractional Brownian motion. In addition, correlation between thedeviations of the measured dimensions from the theoretical ones and lacunarities wasanalyzed. The lacunarity, Λ-dila was defined using a morphological filter of 3-dimensionaldilation of an image. It was found that the measured fractal-dimensions by the method ofmoments were well fit to the theoretical ones for those images with less Λ-dila’s, however,significantly deviated for those images with larger Λ-dila’s. Thus, the method of momentsis expected to estimate sufficiently accurate fractal dimensions of textures in 3-dimensionalmedical images with less Λ-dila’s.
1. Introduction
The fractal dimensions of medical 2-dimensional images are accepted as usefulevaluations of branching structures or networks of tissues in diagnosing diseases (BYNG etal., 1997; HONDA et al., 1992; PEISS et al., 1996; THIELE et al., 1996; VEENLAND et al.,1996). The digitizing technology has these days greatly progressed to allow constructionof 3-dimensional images in biology (STREICHER et al., 1997), and to numerically analyze3-dimensional medical images constructed by CT and MRI (LAINE et al., 1997; SERNETZ
et al., 1992) with a satisfactory speed of computation. Therefore, the present study hasprimarily attempted to assess methods to measure fractal dimensions of the 3-dimensionalmedical images in order to apply the dimensions as supplementary parameters in diagnosingdiseases such as osteoporosis (CHUNG et al., 1994; HAIDEKKER et al., 1997; MAJUMDAR etal., 1997).
Such assessment needs to take account of some problems on the nature of fractaldimensions. Firstly, the measured fractal dimension of an image is not unique yieldingdifferent values depending on the range of measuring scales (VOSS, 1988; EVERTSZ and
250 M. DOMON and E. HONDA
MANDELBROT, 1992). Secondly, fractal sets with the same fractal dimension give rise toimages with different textures depending on the lacunarities as discussed by MANDELBROT
(1983, 1994). For example, a triadic 1-dimensional Cantor set on the full closed interval of[0,1] with segmentation factor of 1/r = 3 and N = 2 segments to leave has the sameHausdorff-Bescovitch dimension, D = (log 2)/(log 3) as any sets with 1/r = 3k
and N = 2k
for integer k(k > 1). However, the texture and the dimension measured by a box countingmethod are quite different with increased N(k >> 1) depending on the arrangement ofdistribution of N segments on the interval [0,1]; the measured dimension, Dim ≈ 0 when theN segments are densely-shifted to near ends of the interval [0,1] with a large gap in itscenter, while Dim ≈ 1 when they are uniformly-spaced in the interval. Thirdly, digitizedimages of fractal sets due to their discretized nature do not conform to the mathematics offractal geometry, by which fractal dimension is defined by the power law in a range ofinfinitesimally-decreased scales of ε, or by Minkowski sausage (MANDELBROT, 1983).
Previous studies on 2-dimensional images by others showed large discrepancies (0.2to 0.3) between their measured fractal-dimensions and theoretical ones (KELLER et al.,1989; HUANG et al., 1994), which led to a view that absolute values of fractal dimensionscould not be measured and only the relative values were reliable. These images were thoseof 2-dimensional fractional Brownian motion, which treated as the surfaces in 3-dimensionalspace (Brownian surfaces). That is, the Brownian values f(x,y) were taken on z-axis.KELLER et al. (1989), recognized that points on the surface were widely spaced and so thesecontributed to lower the values of measured fractal-dimensions. To solve this problem wehave taken an algorithm to generate 2-dimensional binary images of the Brownian surfacesby the mean values of points, i.e. f(x,y) = 1 if |z – mean| ≤ ε, else f(x,y) = 0. These binaryimages gave accurate estimates of the fractal dimensions and correlation between thefractal dimensions and lacunarities was observed (DOMON et al., 1998).
The present study attempts to extend the 2-dimensional algorithms to 3-dimensionalones and to investigate whether 3-dimensional binary images implemented can be used asstandard fractal-images and the methods to measure the fractal dimensions and lacunaritiesare reliable.
2. Methods
2.1. Implementation of 3-dimensional fractal images2.1.1. 3-dimensional triadic Cantor sets
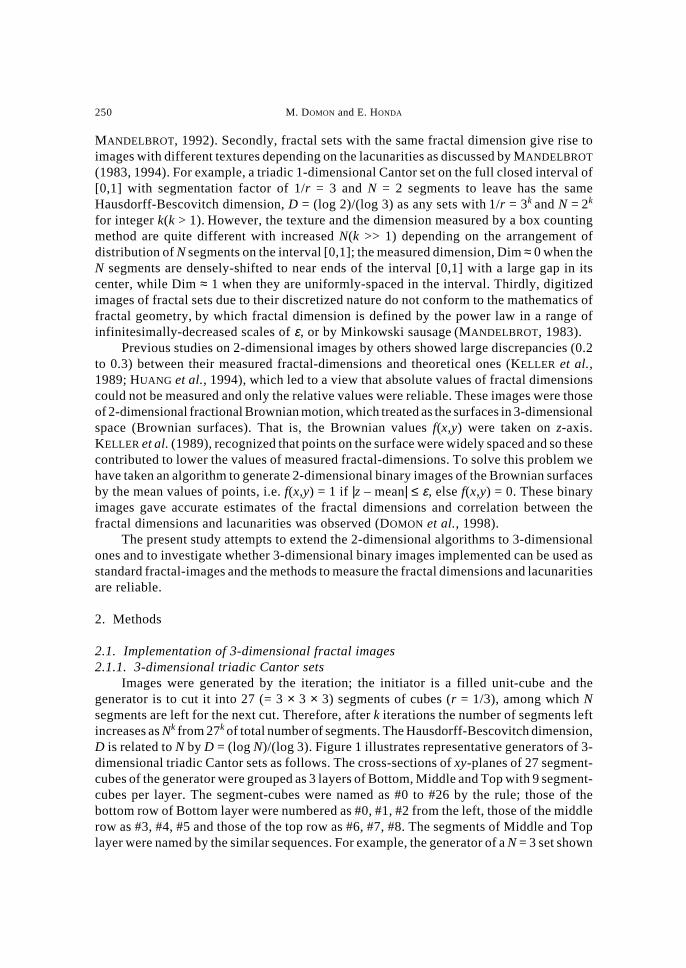
Images were generated by the iteration; the initiator is a filled unit-cube and thegenerator is to cut it into 27 (= 3 × 3 × 3) segments of cubes (r = 1/3), among which Nsegments are left for the next cut. Therefore, after k iterations the number of segments leftincreases as Nk from 27k of total number of segments. The Hausdorff-Bescovitch dimension,D is related to N by D = (log N)/(log 3). Figure 1 illustrates representative generators of 3-dimensional triadic Cantor sets as follows. The cross-sections of xy-planes of 27 segment-cubes of the generator were grouped as 3 layers of Bottom, Middle and Top with 9 segment-cubes per layer. The segment-cubes were named as #0 to #26 by the rule; those of thebottom row of Bottom layer were numbered as #0, #1, #2 from the left, those of the middlerow as #3, #4, #5 and those of the top row as #6, #7, #8. The segments of Middle and Toplayer were named by the similar sequences. For example, the generator of a N = 3 set shown
Fractal Dimensions, Lacunarities of 3-Dimensional Images 251
Fig. 1. Representative generators of 3-dimensional triadic Cantor sets with an initiator of filled box. At eachiteration step, a cube is cut into 27 segment-cubes grouped as Bottom (#0–#8 segment), Middle (#9–#17segment) and Top layer (#18–#26 segment), of which N segments are left for the next iteration. The segmentsin Bottom layer are sequentially numbered as #0 to #3 from left to right for the bottom row, #3 to #5 for themiddle row and #6 to #8 for the top row and those of other layers are numbered in a similar way.
252 M. DOMON and E. HONDA
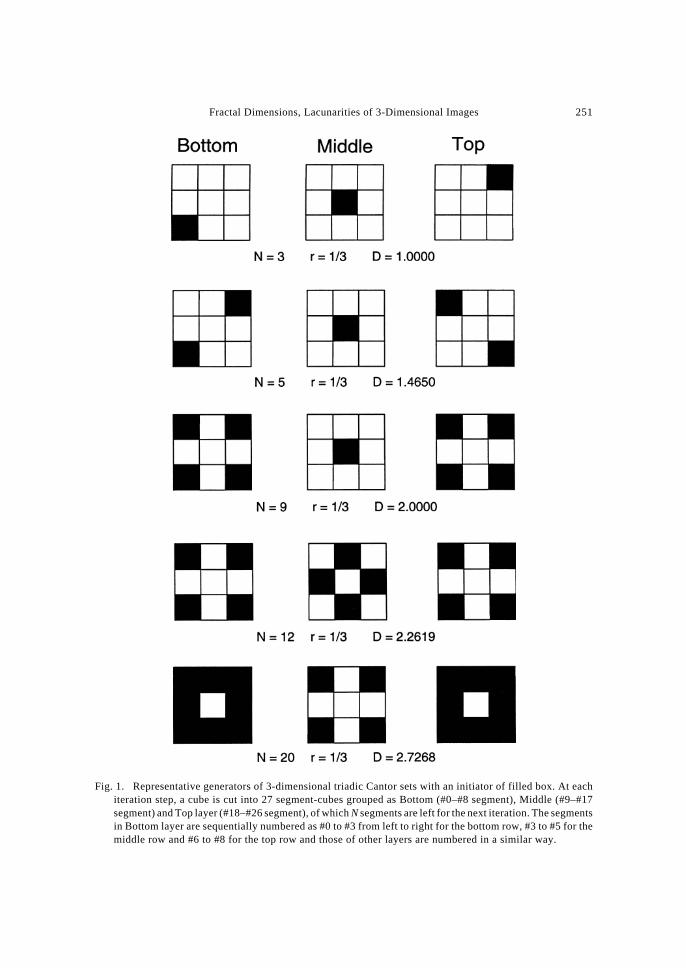
in Fig. 1 was to leave #0, #13 and #26 segment -cube as indicated by closed squares. Twentyimages of the Cantor sets were implemented in this study; 3 images with N = 3, 4 imageswith N = 5, 6 images with N = 9, 3 images with N = 12 and 4 images with N = 20. The imagecalled as a Menger sponge shown in Fig. 2 is visualized by volume rendering of a N = 20set, of which generator is seen in Fig. 1 (MANDELBROT, 1983).
The array size of all images was fixed at 244 × 244 × 244 with addresses of x, y, z from0 to 243, and the generator was operated by 5 iterations. Thus, the size of a final segment-cube left became 1 × 1 × 1 with addresses of 8 vertices. After initialization of 244 × 244× 244 array with setting to 0, the binary image was constructed from the image array for thefinal segment-cubes by giving 1 to only one vertex and 0 to the other 7 vertices for any finalsegment-cube. Figure 3 presents an image of the N = 9 set which displayed as three 2-dimensional binary images of xy-planes at z = 0, 1 and 2 (its generator is seen in Fig. 1).2.1.2. Sets of 3-dimensional fractional Brownian motion
Three-dimensional sets of fractional Brownian motion is defined by
Variance{f(Ri) – f(Rj)} ∝ Ri – Rj 2H, 0 < H < 1
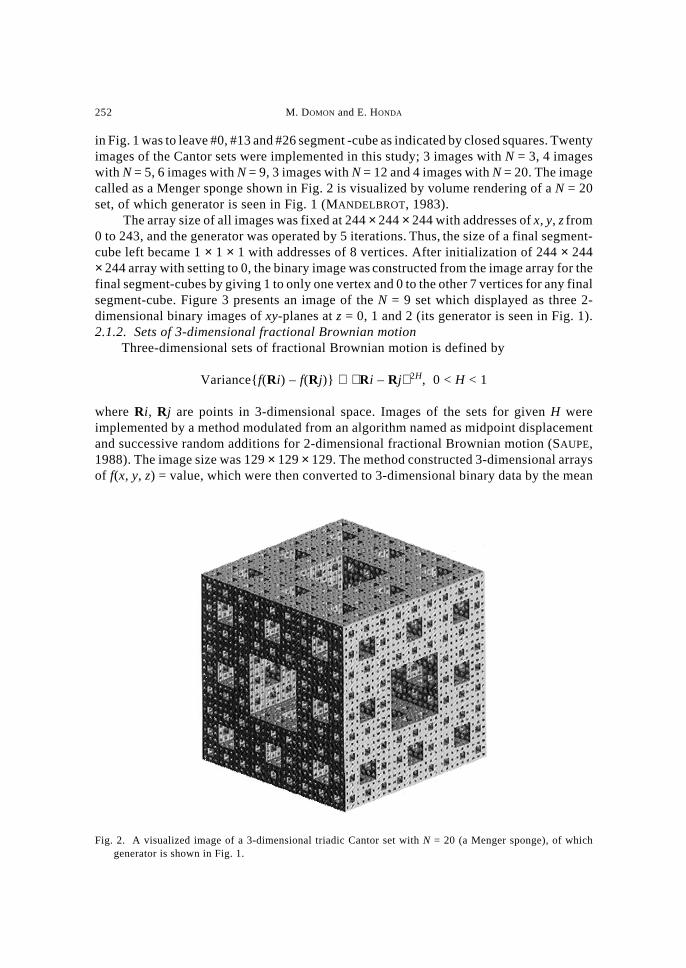
where Ri, Rj are points in 3-dimensional space. Images of the sets for given H wereimplemented by a method modulated from an algorithm named as midpoint displacementand successive random additions for 2-dimensional fractional Brownian motion (SAUPE,1988). The image size was 129 × 129 × 129. The method constructed 3-dimensional arraysof f(x, y, z) = value, which were then converted to 3-dimensional binary data by the mean
Fig. 2. A visualized image of a 3-dimensional triadic Cantor set with N = 20 (a Menger sponge), of whichgenerator is shown in Fig. 1.
Fractal Dimensions, Lacunarities of 3-Dimensional Images 253
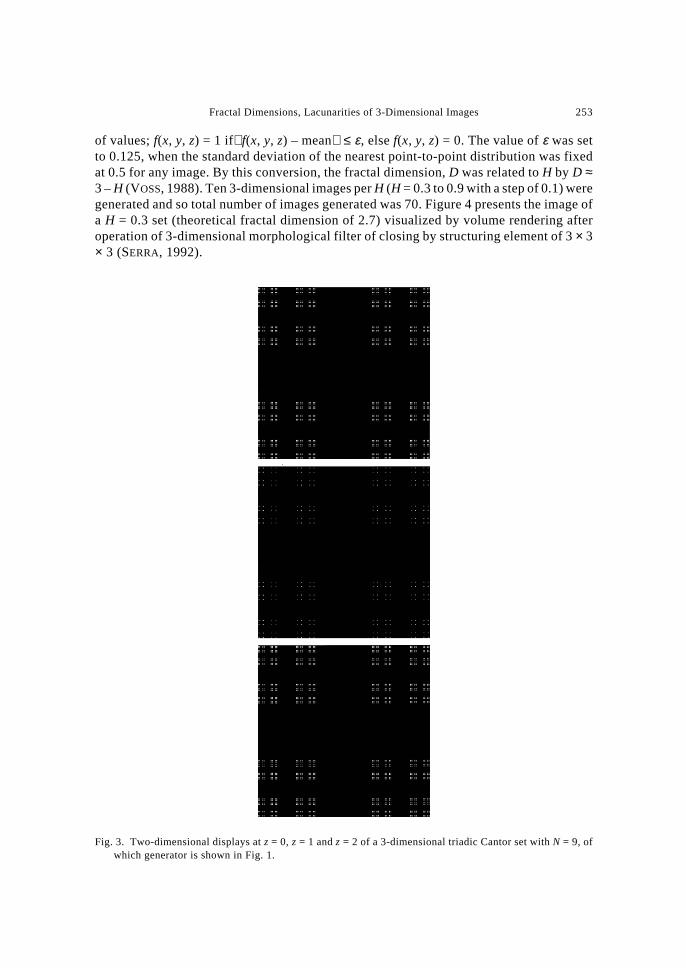
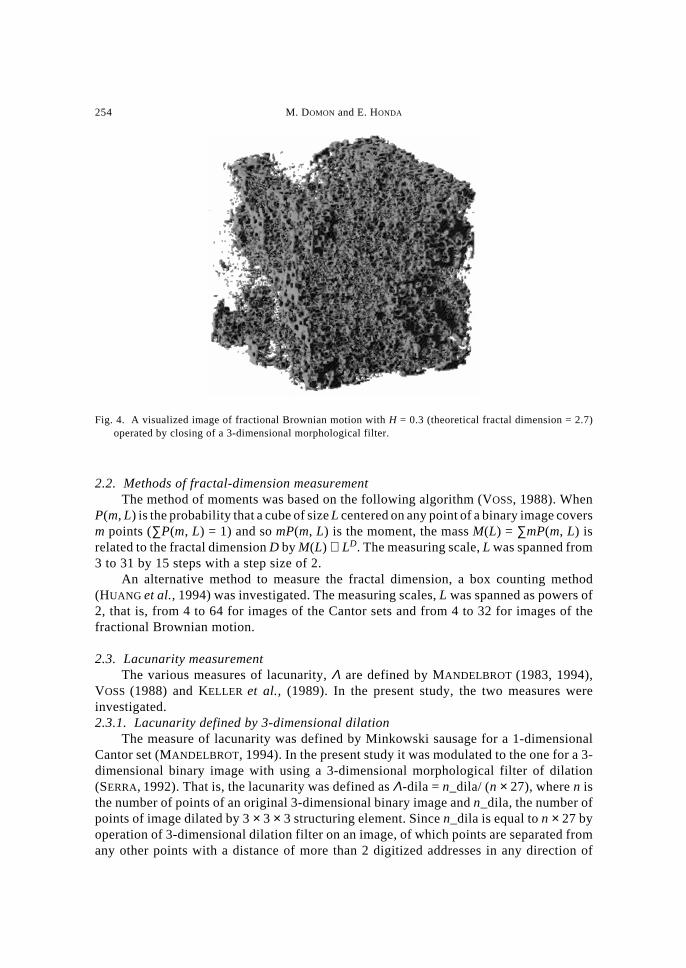
of values; f(x, y, z) = 1 if f(x, y, z) – mean ≤ ε, else f(x, y, z) = 0. The value of ε was setto 0.125, when the standard deviation of the nearest point-to-point distribution was fixedat 0.5 for any image. By this conversion, the fractal dimension, D was related to H by D ≈3 – H (VOSS, 1988). Ten 3-dimensional images per H (H = 0.3 to 0.9 with a step of 0.1) weregenerated and so total number of images generated was 70. Figure 4 presents the image ofa H = 0.3 set (theoretical fractal dimension of 2.7) visualized by volume rendering afteroperation of 3-dimensional morphological filter of closing by structuring element of 3 × 3× 3 (SERRA, 1992).
Fig. 3. Two-dimensional displays at z = 0, z = 1 and z = 2 of a 3-dimensional triadic Cantor set with N = 9, ofwhich generator is shown in Fig. 1.
254 M. DOMON and E. HONDA
2.2. Methods of fractal-dimension measurementThe method of moments was based on the following algorithm (VOSS, 1988). When
P(m, L) is the probability that a cube of size L centered on any point of a binary image coversm points (∑P(m, L) = 1) and so mP(m, L) is the moment, the mass M(L) = ∑mP(m, L) isrelated to the fractal dimension D by M(L) ∝ LD. The measuring scale, L was spanned from3 to 31 by 15 steps with a step size of 2.
An alternative method to measure the fractal dimension, a box counting method(HUANG et al., 1994) was investigated. The measuring scales, L was spanned as powers of2, that is, from 4 to 64 for images of the Cantor sets and from 4 to 32 for images of thefractional Brownian motion.
2.3. Lacunarity measurementThe various measures of lacunarity, Λ are defined by MANDELBROT (1983, 1994),
VOSS (1988) and KELLER et al., (1989). In the present study, the two measures wereinvestigated.2.3.1. Lacunarity defined by 3-dimensional dilation
The measure of lacunarity was defined by Minkowski sausage for a 1-dimensionalCantor set (MANDELBROT, 1994). In the present study it was modulated to the one for a 3-dimensional binary image with using a 3-dimensional morphological filter of dilation(SERRA, 1992). That is, the lacunarity was defined as Λ-dila = n_dila/ (n × 27), where n isthe number of points of an original 3-dimensional binary image and n_dila, the number ofpoints of image dilated by 3 × 3 × 3 structuring element. Since n_dila is equal to n × 27 byoperation of 3-dimensional dilation filter on an image, of which points are separated fromany other points with a distance of more than 2 digitized addresses in any direction of
Fig. 4. A visualized image of fractional Brownian motion with H = 0.3 (theoretical fractal dimension = 2.7)operated by closing of a 3-dimensional morphological filter.
Fractal Dimensions, Lacunarities of 3-Dimensional Images 255
x-, y-, and z-axis, its lacunarity is 1.0. By the dilation operation on a digitized image ofEuclidean solid objects (E = 3), its dilated image remains as the original one and so thelacunarity is 1/27. A digitized image of the straight line (E = 1) yields Λ-dila = 9/27 andthat of the plane (E = 2), Λ-dila = 3/27. Thus, 1/27 ≤ Λ-dila ≤ 1.2.3.2. Lacunarity defined by moments
When P(m, L) is probability that the box with size L centered on a point contains mpoints, q-th moment of P(m, L) Mq (L) = ∑ mq P(m, L). As mentioned before M(L) is the massof P(m, L). The measure of lacunarity proposed by VOSS (1988) is defined as Λ-moment= {M2(L) – M(L)2 }/M(L)2. When points are uniformly distributed in the range of measuringbox size, m ≅ constant and so Λ-moment ≅ 0. Therefore, an image in which points areisolated (m = 1) or compactly -filled in measuring box gives Λ-moment ≅ 0.
3. Results
3.1. Measured fractal dimensions of triadic Cantor imagesThe mass M(L) of a 3-dimensional binary image was in general fit to a straight line of
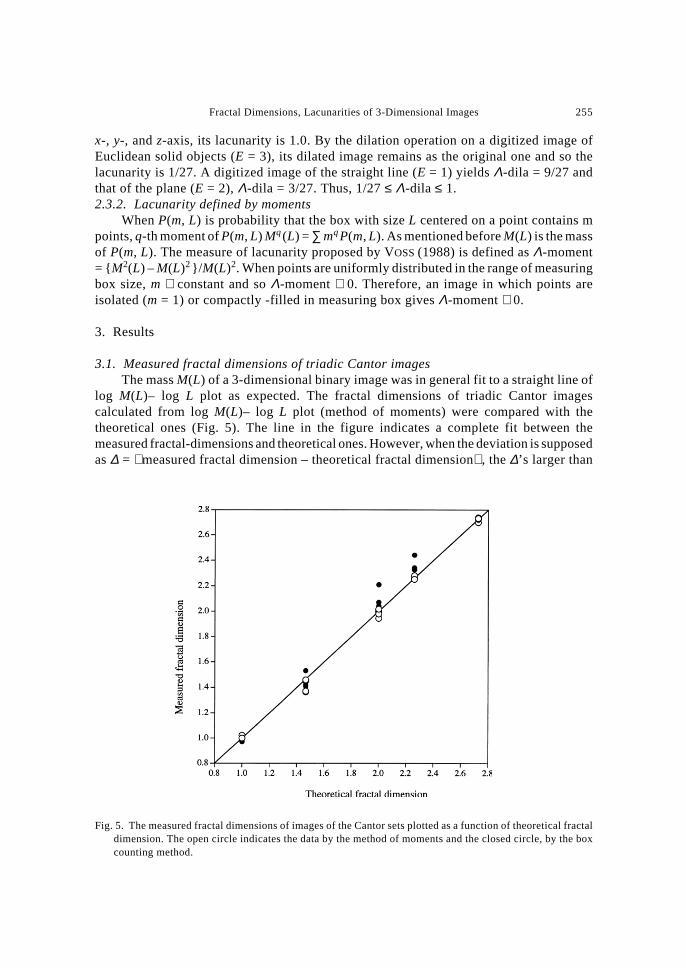
log M(L)– log L plot as expected. The fractal dimensions of triadic Cantor imagescalculated from log M(L)– log L plot (method of moments) were compared with thetheoretical ones (Fig. 5). The line in the figure indicates a complete fit between themeasured fractal-dimensions and theoretical ones. However, when the deviation is supposedas ∆ = measured fractal dimension – theoretical fractal dimension , the ∆’s larger than
Fig. 5. The measured fractal dimensions of images of the Cantor sets plotted as a function of theoretical fractaldimension. The open circle indicates the data by the method of moments and the closed circle, by the boxcounting method.

256 M. DOMON and E. HONDA
0.02 were investigated in 6 out of 20 images. The largest ∆ > 0.1 was given by the data fora N = 5 image, of which theoretical fractal dimension is 1.4650.
The box counting method gave exactly the same value of fractal dimension as thetheoretical one for any image of the Cantor sets when measuring scale L’s were chosen aspower of 3. Such complete fit was reasonable since images of the triadic sets wereimplemented by the generators with r = 1/3 (see, Fig. 1). Therefore such measurements areonly significant in confirming the error-free of the program to implement images of theCantor sets and so not concerned in further analyses. As mentioned in Sec. 2, the data bybox counting method was obtained by the measuring scales of power 2.
The data by the box counting method are superimposed in Fig. 5 (closed circles). It isevident that the deviation ∆’s are in general larger than those by the method of moments.In fact, the deviation ∆’s are larger than 0.02 in 15 cases out of 20 Cantor sets investigated.The largest deviation ∆ = 0.21 was seen for a N = 9 image with theoretical fractal-dimensionof 2.0.
3.2. Measured fractal-dimensions of images of fractional Brownian motionThe data by the method of moments and box counting method are plotted in Figs. 6a
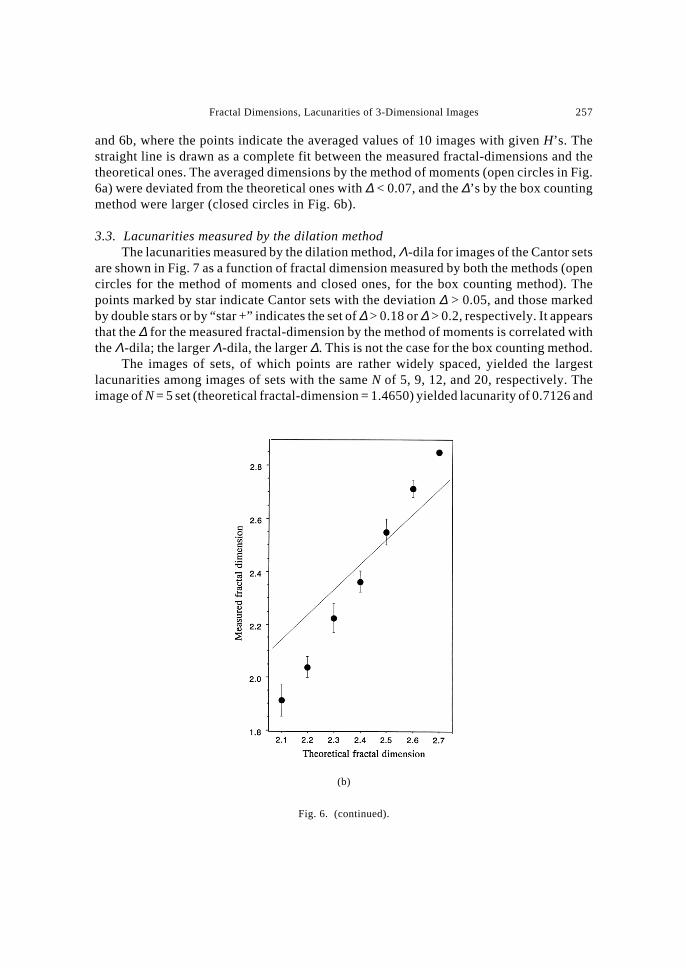
Fig. 6. The measured fractal dimensions of images of the fractional Brownian motion plotted as a function oftheoretical fractal dimension. The open circle indicates the data by the method of moments (Fig. 6a) and theclosed circle, by the box counting method (Fig. 6b). Each point and bar indicates means and standard error,respectively.
(a)
Fractal Dimensions, Lacunarities of 3-Dimensional Images 257
and 6b, where the points indicate the averaged values of 10 images with given H’s. Thestraight line is drawn as a complete fit between the measured fractal-dimensions and thetheoretical ones. The averaged dimensions by the method of moments (open circles in Fig.6a) were deviated from the theoretical ones with ∆ < 0.07, and the ∆’s by the box countingmethod were larger (closed circles in Fig. 6b).
3.3. Lacunarities measured by the dilation methodThe lacunarities measured by the dilation method, Λ-dila for images of the Cantor sets
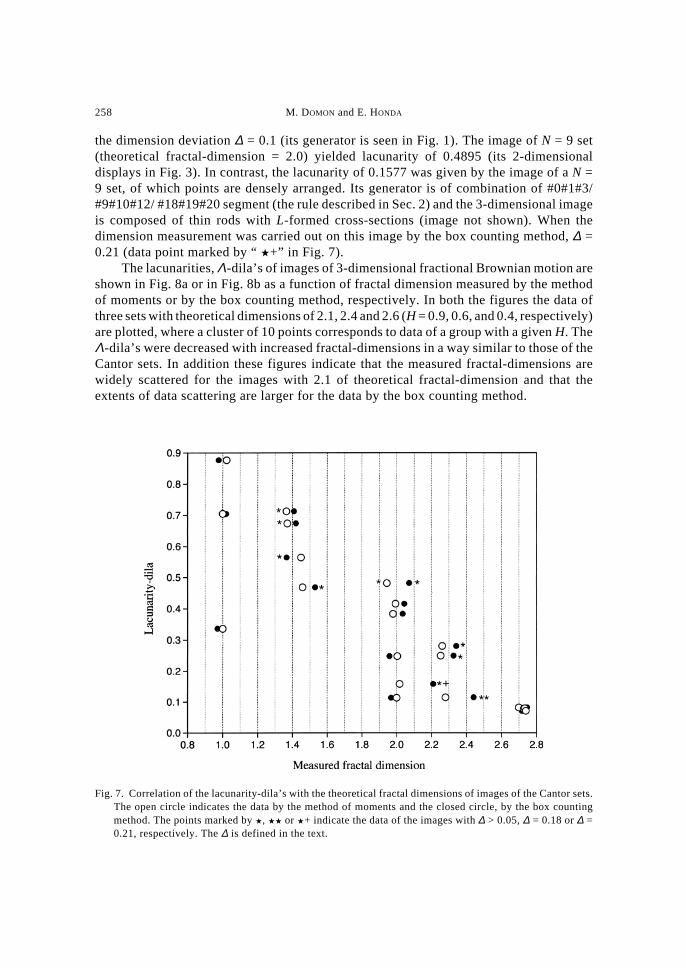
are shown in Fig. 7 as a function of fractal dimension measured by both the methods (opencircles for the method of moments and closed ones, for the box counting method). Thepoints marked by star indicate Cantor sets with the deviation ∆ > 0.05, and those markedby double stars or by “star +” indicates the set of ∆ > 0.18 or ∆ > 0.2, respectively. It appearsthat the ∆ for the measured fractal-dimension by the method of moments is correlated withthe Λ-dila; the larger Λ-dila, the larger ∆. This is not the case for the box counting method.
The images of sets, of which points are rather widely spaced, yielded the largestlacunarities among images of sets with the same N of 5, 9, 12, and 20, respectively. Theimage of N = 5 set (theoretical fractal-dimension = 1.4650) yielded lacunarity of 0.7126 and
Fig. 6. (continued).
(b)
258 M. DOMON and E. HONDA
the dimension deviation ∆ = 0.1 (its generator is seen in Fig. 1). The image of N = 9 set(theoretical fractal-dimension = 2.0) yielded lacunarity of 0.4895 (its 2-dimensionaldisplays in Fig. 3). In contrast, the lacunarity of 0.1577 was given by the image of a N =9 set, of which points are densely arranged. Its generator is of combination of #0#1#3/#9#10#12/ #18#19#20 segment (the rule described in Sec. 2) and the 3-dimensional imageis composed of thin rods with L-formed cross-sections (image not shown). When thedimension measurement was carried out on this image by the box counting method, ∆ =0.21 (data point marked by “ �+” in Fig. 7).
The lacunarities, Λ-dila’s of images of 3-dimensional fractional Brownian motion areshown in Fig. 8a or in Fig. 8b as a function of fractal dimension measured by the methodof moments or by the box counting method, respectively. In both the figures the data ofthree sets with theoretical dimensions of 2.1, 2.4 and 2.6 (H = 0.9, 0.6, and 0.4, respectively)are plotted, where a cluster of 10 points corresponds to data of a group with a given H. TheΛ-dila’s were decreased with increased fractal-dimensions in a way similar to those of theCantor sets. In addition these figures indicate that the measured fractal-dimensions arewidely scattered for the images with 2.1 of theoretical fractal-dimension and that theextents of data scattering are larger for the data by the box counting method.
Fig. 7. Correlation of the lacunarity-dila’s with the theoretical fractal dimensions of images of the Cantor sets.The open circle indicates the data by the method of moments and the closed circle, by the box countingmethod. The points marked by �, �� or �+ indicate the data of the images with ∆ > 0.05, ∆ = 0.18 or ∆ =0.21, respectively. The ∆ is defined in the text.

Fractal Dimensions, Lacunarities of 3-Dimensional Images 259
Fig. 8. The lacunarity-dila’s of the images of fractional Brownian motion plotted as a function of the fractaldimension measured by the method of moments (Fig. 8a) and by the box counting method (Fig. 8b). The dataof three groups are plotted. The group is composed of 10 images with H = 0.9 (theoretical fractal dimension= 2.1), H = 0.6 and H = 0.4, respectively.
(a)
(b)
260 M. DOMON and E. HONDA
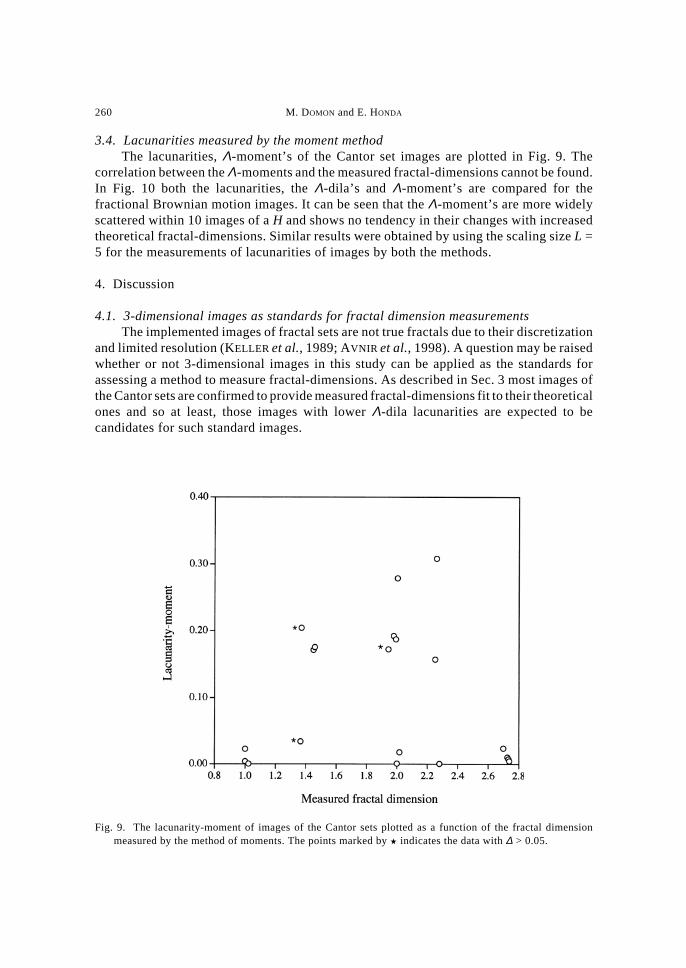
3.4. Lacunarities measured by the moment methodThe lacunarities, Λ-moment’s of the Cantor set images are plotted in Fig. 9. The
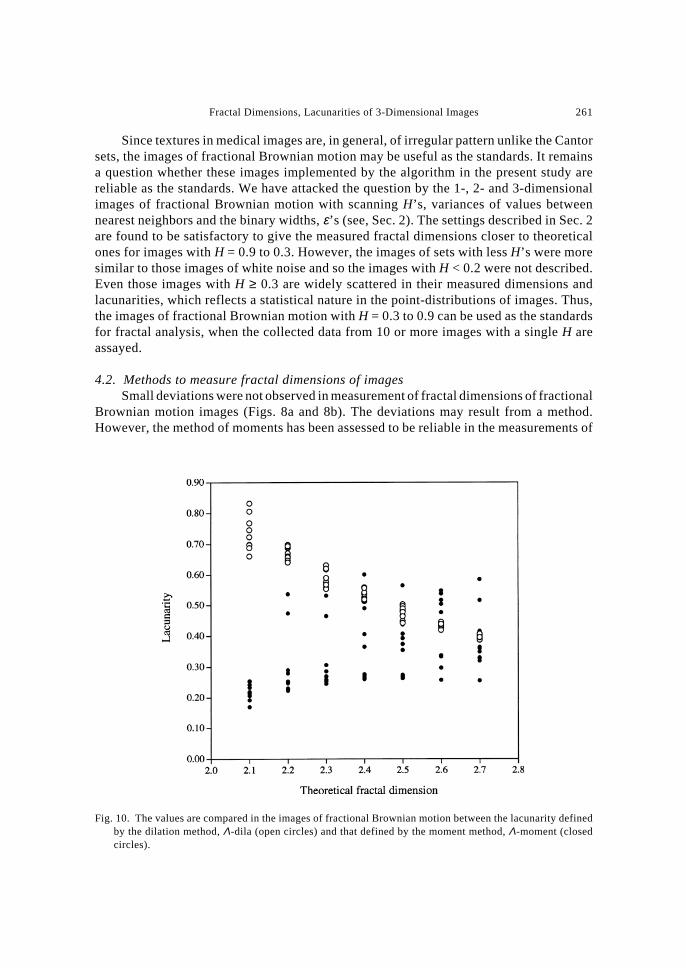
correlation between the Λ-moments and the measured fractal-dimensions cannot be found.In Fig. 10 both the lacunarities, the Λ-dila’s and Λ-moment’s are compared for thefractional Brownian motion images. It can be seen that the Λ-moment’s are more widelyscattered within 10 images of a H and shows no tendency in their changes with increasedtheoretical fractal-dimensions. Similar results were obtained by using the scaling size L =5 for the measurements of lacunarities of images by both the methods.
4. Discussion
4.1. 3-dimensional images as standards for fractal dimension measurementsThe implemented images of fractal sets are not true fractals due to their discretization
and limited resolution (KELLER et al., 1989; AVNIR et al., 1998). A question may be raisedwhether or not 3-dimensional images in this study can be applied as the standards forassessing a method to measure fractal-dimensions. As described in Sec. 3 most images ofthe Cantor sets are confirmed to provide measured fractal-dimensions fit to their theoreticalones and so at least, those images with lower Λ-dila lacunarities are expected to becandidates for such standard images.
Fig. 9. The lacunarity-moment of images of the Cantor sets plotted as a function of the fractal dimensionmeasured by the method of moments. The points marked by � indicates the data with ∆ > 0.05.
Fractal Dimensions, Lacunarities of 3-Dimensional Images 261
Since textures in medical images are, in general, of irregular pattern unlike the Cantorsets, the images of fractional Brownian motion may be useful as the standards. It remainsa question whether these images implemented by the algorithm in the present study arereliable as the standards. We have attacked the question by the 1-, 2- and 3-dimensionalimages of fractional Brownian motion with scanning H’s, variances of values betweennearest neighbors and the binary widths, ε’s (see, Sec. 2). The settings described in Sec. 2are found to be satisfactory to give the measured fractal dimensions closer to theoreticalones for images with H = 0.9 to 0.3. However, the images of sets with less H’s were moresimilar to those images of white noise and so the images with H < 0.2 were not described.Even those images with H ≥ 0.3 are widely scattered in their measured dimensions andlacunarities, which reflects a statistical nature in the point-distributions of images. Thus,the images of fractional Brownian motion with H = 0.3 to 0.9 can be used as the standardsfor fractal analysis, when the collected data from 10 or more images with a single H areassayed.
4.2. Methods to measure fractal dimensions of imagesSmall deviations were not observed in measurement of fractal dimensions of fractional
Brownian motion images (Figs. 8a and 8b). The deviations may result from a method.However, the method of moments has been assessed to be reliable in the measurements of
Fig. 10. The values are compared in the images of fractional Brownian motion between the lacunarity definedby the dilation method, Λ-dila (open circles) and that defined by the moment method, Λ-moment (closedcircles).
262 M. DOMON and E. HONDA
the fractal dimension of an 3-dimensional image except for cases with larger lacunarities,Λ-dila. In contrast, the box counting method, in general, provides rather larger deviations,the ∆’s. The reason for this was given by EVERTSZ and MANDELBROT (1992) as follows. Thebox counting method counts the number of boxes of size, L to cover an image when the boxcontains a single point, a few points or even large number of points, respectively. In otherwords the number of boxes N(L) is counted without taking into consideration of the weightsof points.
4.3. Lacunarity and noiseThe results lead to the conclusion that the measure of lacunarity defined by the
dilation, Λ-dila of an image is preferable to the one by the moment method and gives thecorrelation between lacunarities and fractal dimensions. In addition the present studyindicates the influence of noise which is universal in medical images. When the noise levelis high, the moment mP(m, L) is increased resulting in the larger fractal dimension.Inversely, the noise at a lower level is added to images with lower theoretical fractal-dimensions, the isolated points are widely positioned and so the moment P(1, L) becomessignificant resulting in lowering the measured fractal-dimensions and increasing the Λ-dila’s. Thus, it may be essential to remove the noise of images prior to the measurementsof their fractal dimensions.
The work has been partly supported by Grant-in-Aid of Japanese Ministry of Education,Culture and Sports, Grant # 08672150.
REFERENCES
AVNIR, D., BIHAM, O., LIDAR, D. and MALCAI, O. (1998) Is the geometry of nature fractal?, Science, 279, 39–40.
BYNG, J. W., YAFFE, M. J., LOCKWOOD, G. A., LITTLE, L. E., TRITCHLER, D. L. and BOYD, N. F. (1997) Automatedanalysis of mammographic densities and breast carcinoma risk, Cancer, 80, 66–74.
CHUNG, H.-W., CHU, C.-C., UNDERWEISER, M. and WEHRLI, F. W. (1994) On the fractal nature of trabecularstructure, Med. Phys., 21, 1535–1540.
DOMON, M., HONDA, E. and SASAKI, T. (1998) Two dimensional images of fractal sets and their usefulness inanalysis of the method of dimension measurement, in CAR’98—Computer Assisted Radiology and Surgery(ed. H. U. Lemke, M. W. Vannier, K. Inamura and A. G. Farman), Elsevier, Amsterdam, p. 972.
EVERTSZ, C. J. G. and MANDELBROT, B. B. (1992) Multifractal measures in Chaos and Fractals New Frontiersof Science (ed. H.-O. Peitgen, H. Jürgens and D. Saupe), Springer-Verlag, New York, pp. 922–953.
HAIDEKKER, M. A., ANDRESEN, R., EVERTSZ, C. J. G., BANZER, D. and PEITGEN, H.-O. (1997) Assessing the degreeof osteoporosis in the axial skeleton using the dependence of the fractal dimension on the grey levelthreshold, Brit. J. Radiol., 70, 586–593.
HONDA, E., DOMON, M., SASAKI, T., OBAYASHI, N. and IDA, M. (1992) Fractal dimensions of ductal patterns inthe parotid glands of normal subjects and patients with Sjögren syndrome, Invest. Radiol., 27, 790–795.
HUANG, Q., LORCH, J. R. and DUBES, R. C. (1994) Can the fractal dimension of images be measured?, PatternRecognition, 27, 339–349.
KELLER, J. M., CHEN, S. and CROWNOVER, R. M. (1989) Texture description and segmentation through fractalgeometry, Comput. Vis. Graph. Image Proc., 45, 150–166.
LAINE, H.-J., KONTOLA, K., LEHTO, M. U. K., PITKÄNEN, M., JARSKE, P. and LINDHOLM, T. S. (1997) Imageprocessing for femoral endosteal anatomy detection: description and testing of a computed tomographybased on program, Phys. Med. Biol., 42, 673–689.
MAJUMDAR, S., GENANT, H. K., GRAMPP, S., NEWITT, D. C., TRUONG, V. H., LIN, J. C. and MATHUR, A. (1997)
Fractal Dimensions, Lacunarities of 3-Dimensional Images 263
Correlation of trabecullar bone structure with age, bone mineral density and osteoporotic status- in vitrostudies in the distal radius using high resolution magnetic resonance imaging, J. Bone Mineral Res., 12, 111–118.
MANDELBROT, B. B. (1983) The Fractal Geometry of Nature, Freeman, New York, pp. 310–318.MANDELBROT, B. B. (1994) A fractal’s lacunarity, and how it can be tuned and measured, in Fractals in Biology
and Medicine (ed. T. F. Nonnenmacher, G. A. Losa and E. R. Weibel), Birkhäuser Verlag, Basel, pp. 8–21.PEISS, J., VERLANDE, M., AMELING, W. and GÜNTHER, R. W. (1996) Classification of lung tumors on chest
radiographs by fractal texture analysis, Invest. Radiol., 31, 625–629.SAUPE, D. (1988) Algorithms for random fractals in The Science of Fractal Images (ed. H.-O, Peitgen and D.
Saupe), Springer-Verlag, New York, pp. 71–136.SERRA, J. (1992) Dilation and filtering for numerical functions in Image analyss and Mathematical Morphology
Volume 2: Theoretical Advances (ed. J. Serra), Academic Press, London, pp. 181–202.SERNETZ, M., WÜBBEKE, J. and WLCZEK, P. (1992) Three-dimensional image analysis and fractal characterization
of kidney arterial vessels, Physica A, 191, 13–16.STREICHER, J., WENINGER, W. J. and MÜLLER, G. B. (1997) External marker-based automatic congruencing: a
new method of 3-dimensional reconstruction from serial sections, Anat. Rec., 248, 583–602.THIELE, D. L., KIMME-SMITH, C., JOHNSON, T. D., MCCOMBS, M. and BASSETT, L. W. (1996) Using tissue texture
surrounding calcification clusters to predict benign vs malignant outcomes, Med. Phys., 23, 549–555.VEENLAND, J. F., GRASHUIS, J. L., VAN DER MEER, F., BECKERS, A. L. D. and GELSEMA, E. S. (1996) Estimation
of fractal dimension in cardiographs, Med. Phys., 23, 585–594.VOSS, R. F. (1988) Fractals in nature: from characterization to simulation, in The Science of Fractal Images (ed.
H.-O. Peitgen and D. Saupe), Springer-Verlag, New York, pp. 21–70.