correlation between yield, must attributes and nutritional status of the greek red wine grape...
TRANSCRIPT
This article was downloaded by: [Moskow State Univ Bibliote]On: 17 February 2014, At: 06:37Publisher: Taylor & FrancisInforma Ltd Registered in England and Wales Registered Number: 1072954 Registeredoffice: Mortimer House, 37-41 Mortimer Street, London W1T 3JH, UK
Journal of Plant NutritionPublication details, including instructions for authors andsubscription information:http://www.tandfonline.com/loi/lpla20
CORRELATION BETWEEN YIELD, MUSTATTRIBUTES AND NUTRITIONAL STATUSOF THE GREEK RED WINE GRAPE VARIETY‘AGIORGITIKO’Anna Assimakopoulou a & Charikleia Tsougrianis ba Technological Educational Institute of Kalamata , Antikalamos ,Greeceb Ministry of Agriculture , District Laboratory of Agricultural AdvisoryService and Fertilizer Analysis , Xylokastro , GreecePublished online: 11 May 2012.
To cite this article: Anna Assimakopoulou & Charikleia Tsougrianis (2012) CORRELATION BETWEENYIELD, MUST ATTRIBUTES AND NUTRITIONAL STATUS OF THE GREEK RED WINE GRAPE VARIETY‘AGIORGITIKO’, Journal of Plant Nutrition, 35:7, 1022-1036, DOI: 10.1080/01904167.2012.671405
To link to this article: http://dx.doi.org/10.1080/01904167.2012.671405
PLEASE SCROLL DOWN FOR ARTICLE
Taylor & Francis makes every effort to ensure the accuracy of all the information (the“Content”) contained in the publications on our platform. However, Taylor & Francis,our agents, and our licensors make no representations or warranties whatsoever as tothe accuracy, completeness, or suitability for any purpose of the Content. Any opinionsand views expressed in this publication are the opinions and views of the authors,and are not the views of or endorsed by Taylor & Francis. The accuracy of the Contentshould not be relied upon and should be independently verified with primary sourcesof information. Taylor and Francis shall not be liable for any losses, actions, claims,proceedings, demands, costs, expenses, damages, and other liabilities whatsoever orhowsoever caused arising directly or indirectly in connection with, in relation to or arisingout of the use of the Content.
This article may be used for research, teaching, and private study purposes. Anysubstantial or systematic reproduction, redistribution, reselling, loan, sub-licensing,systematic supply, or distribution in any form to anyone is expressly forbidden. Terms &Conditions of access and use can be found at http://www.tandfonline.com/page/terms-and-conditions
Journal of Plant Nutrition, 35:1022–1036, 2012Copyright C© Taylor & Francis Group, LLCISSN: 0190-4167 print / 1532-4087 onlineDOI: 10.1080/01904167.2012.671405
CORRELATION BETWEEN YIELD, MUST ATTRIBUTES
AND NUTRITIONAL STATUS OF THE GREEK RED WINE
GRAPE VARIETY ‘AGIORGITIKO’
Anna Assimakopoulou1 and Charikleia Tsougrianis2
1Technological Educational Institute of Kalamata, Antikalamos, Greece2Ministry of Agriculture, District Laboratory of Agricultural Advisory Service and FertilizerAnalysis, Xylokastro, Greece
� The appropriate tissue and sampling time for the Greek wine-grape variety ‘Agiorgitiko’ nutri-tional diagnosis was to be evaluated by relating leaf tissue nutrient contents with the yield andmust potassium (K), pH, total soluble solids (TSS), and titratable acidity (TA). At bloom, veraisonand harvest, leaves opposite the basal cluster (LOBC) and youngest mature leaves (YML) wereharvested, and soil and berry samples were collected from six vineyards in Nemea, Greece. PetioleK concentration of the LOBC was found to be better correlated with the yield, TSS, TA and mustK than the blade or whole leaf K content; the contrary was observed in nitrogen (N), phosphorus(P), calcium (Ca), and magnesium (Mg) concentrations. The LOBC reflected better the nutritionalstatus of the variety compared to the YML. Regarding the sampling time, petiole K presented strongercorrelations with yield and must K, TSS, TA at harvest whereas N and P at bloom and veraison.
Keywords: grapevine, Vitis vinifera L., tissue analysis, blade, petiole, soil analysis, nutri-ent ratios
INTRODUCTION
Nemea is one of the most famous red wine grape growing and winemak-ing areas of Greece, where 2,500 ha are cultivated with the red wine grapevariety ‘Agiorgitiko’ (Vitis vinifera L.); the wine ‘Nemea’ (Vinde Qualite Pro-duit Dans Une Region Determinee) is produced from that variety. However,there is limited information on the nutrient status of the variety and theeffects of plant nutrients on must and wine quality. An increasing concernfor the wine acidity of ‘Agiorgitiko’ has been reported in a number of vine-yards in the area, as the acidity of a wine is closely related to high potassium(K) levels of musts and wines (Boulton, 1980; Ruhl et al., 1988; Ruhl, 1989;
Received 19 January 2010; accepted 13 September 2011.Address correspondence to Anna Assimakopoulou, Technological Educational Institute of Kalamata
241 00, Antikalamos, Messinia, Greece. E-mail: [email protected]
1022
Dow
nloa
ded
by [
Mos
kow
Sta
te U
niv
Bib
liote
] at
06:
37 1
7 Fe
brua
ry 2
014
Yield, Must Attributes, Nutrition of ‘Agiorgitiko’ 1023
Mpelasoka, 2003; Wolpert et al., 2005). It is generally known that in hotregions, the fruits tend to develop high K and pH levels; wines with highpH acquire a dull color and poor stability while wines with lower pH at-tain a bright red color, suggestive of good quality (Hale, 1977). Moreover,high must or wine K increases the precipitation of tartrate and hence de-creases free tartrate; a reduced tartrate:malate ratio produces unfavorableconditions for high quality wines.
On the other hand, one of the most difficult challenges in any vineyardmanagement is to maintain a balance between vegetative growth and fruitproduction. The most reliable analytical tool that provides a guide for vine-yard nutrient management is tissue analysis which is much more effective andreliable than soil analysis (Christensen, 1969). However, there is some dis-crepancy with regard to the type of the tissue and its position on the shootas well as the best time for leaf sampling. Among a variety of grapevine tis-sues, a preference to analyze leaf petioles has been reported. Some haveproposed petioles from the leaves opposite the basal clusters while othersprefer petioles from the most recently mature leaves. Opinion is also dividedas to the optimum sampling time; Kasimatis and Christensen (1976) haveproposed bloom, veraison, and harvest. However, in recent years, leaf bladeanalysis close to harvest was questioned, since changes in nutrient concen-tration in the leaf blade at that time are small compared to changes in thepetiole (Klein et al., 2000). The petiole at flowering time is considered to bea preferable tissue for nitrogen (N) and phosphorus (P) diagnosis whereasdiagnosis of K at that time was found to be inadequate (Hepner and Bravdo,1985). Nevertheless, bloom-time sampling of opposite-cluster petioles hasbeen widely used in Californian and Australian vineyard nutritional surveys(Christensen, 1969, 1984; Kasimatis and Christensen, 1976) whereas thesampling of whole leaves is still common in France, Israel and South Africa.
The objective of our study was to evaluate the appropriate tissue, itsposition on the shoot and sampling time for the nutritional diagnosis of‘Agiorgitiko’ through leaf analysis, as well as to establish correlation coeffi-cients between tissue nutrients and their ratios with the yield and must K, pH,total soluble solids (TSS) and titratable acidity (TA) in order to obtain moreinformation about the nutrient element needs of the variety for optimumyield and wine quality under the climatic conditions of Nemea, Greece.
MATERIALS AND METHODS
The study was conducted for two successive years, 2006 and 2007, insix vineyards located in the area of Nemea, north-east of the Peloponnese,Greece. All vineyards included mature vines of Vitis vinifera L. ‘Agiorgitiko’,bilateral cordon trained and spur-pruned (Royat), vertical shoot positioned.Four of them were grafted on ‘Richter 110’ whereas the other two were on‘41B’. They all received the same cultural practices concerning fertilization,tillage and irrigation, as well as insect and disease control.
Dow
nloa
ded
by [
Mos
kow
Sta
te U
niv
Bib
liote
] at
06:
37 1
7 Fe
brua
ry 2
014
1024 A. Assimakopoulou and C. Tsougrianis
With regard to sampling, three subplots were selected per vineyard co-incident with two rows each and ten vines per row. At the three differentdevelopmental stages of vine, bloom, veraison and harvest, representativeleaf samples were collected from the marked twenty vines per subplot; at fullripeness, berry samples were also collected from the same vines. The firsttype of leaf sample consisted of one leaf opposite the basal cluster per vine(twenty leaves per subplot) and the other type of one youngest mature leafper vine. Leaf blades were separated from petioles just after the leaf cut andthey were analyzed separately in order to determine their concentrations ofN, P, K, calcium (Ca), magnesium (Mg), iron (Fe), manganese (Mn), zinc(Zn), copper (Cu), and boron (B). Leaf blades and petioles brought intothe laboratory were carefully washed with detergent and tap water and threetimes with deionized water; they were dried to constant weight in a forced-draught air oven at 80◦C, ground to pass 30 mesh and dry-ashed in a furnaceat 500◦C; the dry digest had been extracted in hydrochloric acid (HCl).The concentration of P was determined by vanadomolybdophosphate yel-low color method, B by azomethin-H, K by flame photometry and Ca, Mg, Fe,Mn, Zn, and Cu by atomic absorption spectrometry, in the dry digest. Theconcentration of N was determined by using the indophenol-blue method inthe wet digest. The ratios N+P+K, K+Ca+Mg, N+P/K, Ca/P, K/Ca, K/Mgand K/(Ca+Mg) were also calculated since they are often used as indexesof vine nutritional status (Muthukrishnan and Srinivasan, 1974; Neyroudet al., 2007).
Concerning soil sampling, five cores per subplot, 0–30 cm below thesurface, between the marked vines, were taken with an Edelman auger ateach sampling stage; these five cores were combined into a composite samplefor chemical analysis.
In addition, at full ripeness when fruit was considered mature (TSS ≥22.5 oBrix), berry samples consisted of 200 berries per subplot were col-lected from several parts of various clusters from the marked vines duringthe early hours of the morning and transported to the laboratory in anice cooler. They were immediately weighed and counted in order to de-termine the average berry weight. Then, they were crushed and the mustobtained was centrifuged at 3500 rpm for 10 minutes; total soluble solids(TSS) of the must was measured using a hand refractometer (Atago P-1;Atago Inc., Bellevue, WA, USA) and expressed as a percentage at 20◦C, pHby a pH-meter whereas the determination of titratable acidity (TA) was real-ized by titration against 0.1N sodium hydroxide (NaOH) and expressed in gL−1 of tartaric acid. The TSS/TA ratio was also calculated (Muthukrishnanand Srinivasan, 1974). A quantity of the supernatant must was frozen andstored in –21◦C in order to measure the potassium concentration by a VarianAA240FS atomic absorption spectrophotometer (Varian Inc., Palo Alto, CA,USA); cesium chloride was added to all must samples and standards to avoidionization interferences. The total yield of grapes was also recorded for eachsubplot.
Dow
nloa
ded
by [
Mos
kow
Sta
te U
niv
Bib
liote
] at
06:
37 1
7 Fe
brua
ry 2
014
Yield, Must Attributes, Nutrition of ‘Agiorgitiko’ 1025
Linear correlations were worked out between: a) yield and must qualityattributes, b) macro- and micronutrient contents of blades, petioles andwhole leaves opposite the basal cluster with yield and must quality attributes,c) macro- and micronutrients of blades, petioles and whole youngest matureleaves with yield and must quality attributes, d) nutrient ratios of both leaftypes with yield and must quality attributes and e) soil parameters with yieldand must quality attributes, at the three developmental stages.
RESULTS
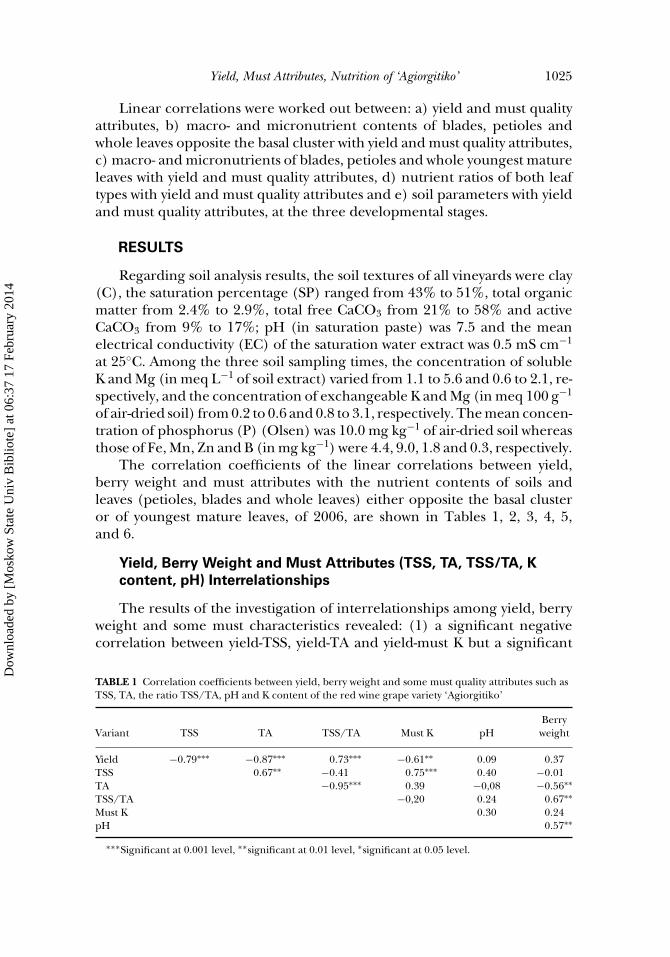
Regarding soil analysis results, the soil textures of all vineyards were clay(C), the saturation percentage (SP) ranged from 43% to 51%, total organicmatter from 2.4% to 2.9%, total free CaCO3 from 21% to 58% and activeCaCO3 from 9% to 17%; pH (in saturation paste) was 7.5 and the meanelectrical conductivity (EC) of the saturation water extract was 0.5 mS cm−1
at 25◦C. Among the three soil sampling times, the concentration of solubleK and Mg (in meq L−1 of soil extract) varied from 1.1 to 5.6 and 0.6 to 2.1, re-spectively, and the concentration of exchangeable K and Mg (in meq 100 g−1
of air-dried soil) from 0.2 to 0.6 and 0.8 to 3.1, respectively. The mean concen-tration of phosphorus (P) (Olsen) was 10.0 mg kg−1 of air-dried soil whereasthose of Fe, Mn, Zn and B (in mg kg−1) were 4.4, 9.0, 1.8 and 0.3, respectively.
The correlation coefficients of the linear correlations between yield,berry weight and must attributes with the nutrient contents of soils andleaves (petioles, blades and whole leaves) either opposite the basal clusteror of youngest mature leaves, of 2006, are shown in Tables 1, 2, 3, 4, 5,and 6.
Yield, Berry Weight and Must Attributes (TSS, TA, TSS/TA, K
content, pH) Interrelationships
The results of the investigation of interrelationships among yield, berryweight and some must characteristics revealed: (1) a significant negativecorrelation between yield-TSS, yield-TA and yield-must K but a significant
TABLE 1 Correlation coefficients between yield, berry weight and some must quality attributes such asTSS, TA, the ratio TSS/TA, pH and K content of the red wine grape variety ‘Agiorgitiko’
BerryVariant TSS TA TSS/TA Must K pH weight
Yield −0.79∗∗∗ −0.87∗∗∗ 0.73∗∗∗ −0.61∗∗ 0.09 0.37TSS 0.67∗∗ −0.41 0.75∗∗∗ 0.40 −0.01TA −0.95∗∗∗ 0.39 −0,08 −0.56∗∗TSS/TA −0,20 0.24 0.67∗∗Must K 0.30 0.24pH 0.57∗∗
∗∗∗Significant at 0.001 level, ∗∗significant at 0.01 level, ∗significant at 0.05 level.
Dow
nloa
ded
by [
Mos
kow
Sta
te U
niv
Bib
liote
] at
06:
37 1
7 Fe
brua
ry 2
014
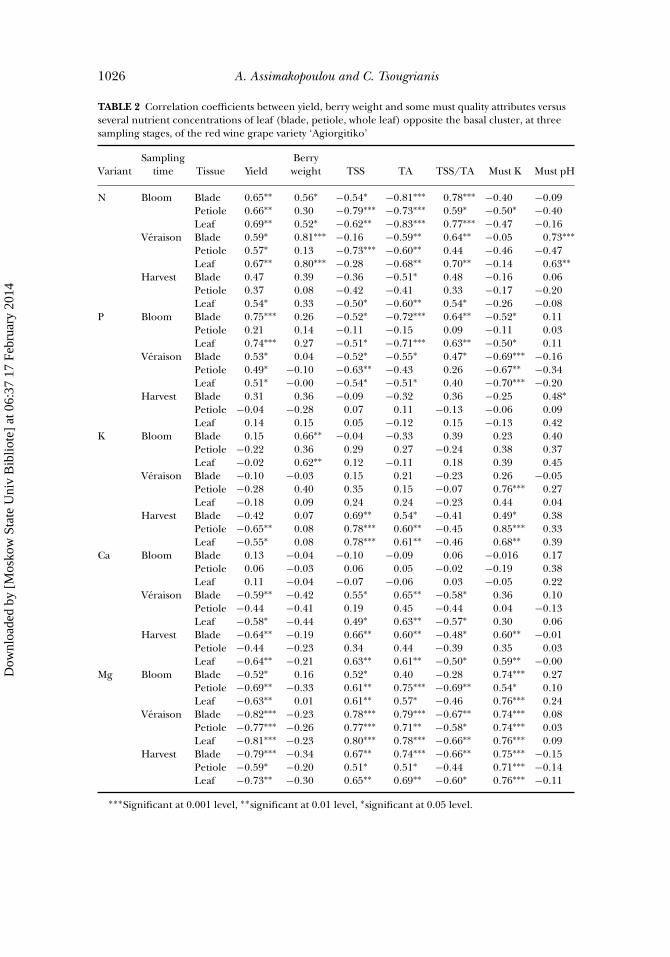
1026 A. Assimakopoulou and C. Tsougrianis
TABLE 2 Correlation coefficients between yield, berry weight and some must quality attributes versusseveral nutrient concentrations of leaf (blade, petiole, whole leaf) opposite the basal cluster, at threesampling stages, of the red wine grape variety ‘Agiorgitiko’
Sampling BerryVariant time Tissue Yield weight TSS TA TSS/TA Must K Must pH
N Bloom Blade 0.65∗∗ 0.56∗ −0.54∗ −0.81∗∗∗ 0.78∗∗∗ −0.40 −0.09Petiole 0.66∗∗ 0.30 −0.79∗∗∗ −0.73∗∗∗ 0.59∗ −0.50∗ −0.40Leaf 0.69∗∗ 0.52∗ −0.62∗∗ −0.83∗∗∗ 0.77∗∗∗ −0.47 −0.16
Veraison Blade 0.59∗ 0.81∗∗∗ −0.16 −0.59∗∗ 0.64∗∗ −0.05 0.73∗∗∗Petiole 0.57∗ 0.13 −0.73∗∗∗ −0.60∗∗ 0.44 −0.46 −0.47Leaf 0.67∗∗ 0.80∗∗∗ −0.28 −0.68∗∗ 0.70∗∗ −0.14 0.63∗∗
Harvest Blade 0.47 0.39 −0.36 −0.51∗ 0.48 −0.16 0.06Petiole 0.37 0.08 −0.42 −0.41 0.33 −0.17 −0.20Leaf 0.54∗ 0.33 −0.50∗ −0.60∗∗ 0.54∗ −0.26 −0.08
P Bloom Blade 0.75∗∗∗ 0.26 −0.52∗ −0.72∗∗∗ 0.64∗∗ −0.52∗ 0.11Petiole 0.21 0.14 −0.11 −0.15 0.09 −0.11 0.03Leaf 0.74∗∗∗ 0.27 −0.51∗ −0.71∗∗∗ 0.63∗∗ −0.50∗ 0.11
Veraison Blade 0.53∗ 0.04 −0.52∗ −0.55∗ 0.47∗ −0.69∗∗∗ −0.16Petiole 0.49∗ −0.10 −0.63∗∗ −0.43 0.26 −0.67∗∗ −0.34Leaf 0.51∗ −0.00 −0.54∗ −0.51∗ 0.40 −0.70∗∗∗ −0.20
Harvest Blade 0.31 0.36 −0.09 −0.32 0.36 −0.25 0.48∗Petiole −0.04 −0.28 0.07 0.11 −0.13 −0.06 0.09Leaf 0.14 0.15 0.05 −0.12 0.15 −0.13 0.42
K Bloom Blade 0.15 0.66∗∗ −0.04 −0.33 0.39 0.23 0.40Petiole −0.22 0.36 0.29 0.27 −0.24 0.38 0.37Leaf −0.02 0.62∗∗ 0.12 −0.11 0.18 0.39 0.45
Veraison Blade −0.10 −0.03 0.15 0.21 −0.23 0.26 −0.05Petiole −0.28 0.40 0.35 0.15 −0.07 0.76∗∗∗ 0.27Leaf −0.18 0.09 0.24 0.24 −0.23 0.44 0.04
Harvest Blade −0.42 0.07 0.69∗∗ 0.54∗ −0.41 0.49∗ 0.38Petiole −0.65∗∗ 0.08 0.78∗∗∗ 0.60∗∗ −0.45 0.85∗∗∗ 0.33Leaf −0.55∗ 0.08 0.78∗∗∗ 0.61∗∗ −0.46 0.68∗∗ 0.39
Ca Bloom Blade 0.13 −0.04 −0.10 −0.09 0.06 −0.016 0.17Petiole 0.06 −0.03 0.06 0.05 −0.02 −0.19 0.38Leaf 0.11 −0.04 −0.07 −0.06 0.03 −0.05 0.22
Veraison Blade −0.59∗∗ −0.42 0.55∗ 0.65∗∗ −0.58∗ 0.36 0.10Petiole −0.44 −0.41 0.19 0.45 −0.44 0.04 −0.13Leaf −0.58∗ −0.44 0.49∗ 0.63∗∗ −0.57∗ 0.30 0.06
Harvest Blade −0.64∗∗ −0.19 0.66∗∗ 0.60∗∗ −0.48∗ 0.60∗∗ −0.01Petiole −0.44 −0.23 0.34 0.44 −0.39 0.35 0.03Leaf −0.64∗∗ −0.21 0.63∗∗ 0.61∗∗ −0.50∗ 0.59∗∗ −0.00
Mg Bloom Blade −0.52∗ 0.16 0.52∗ 0.40 −0.28 0.74∗∗∗ 0.27Petiole −0.69∗∗ −0.33 0.61∗∗ 0.75∗∗∗ −0.69∗∗ 0.54∗ 0.10Leaf −0.63∗∗ 0.01 0.61∗∗ 0.57∗ −0.46 0.76∗∗∗ 0.24
Veraison Blade −0.82∗∗∗ −0.23 0.78∗∗∗ 0.79∗∗∗ −0.67∗∗ 0.74∗∗∗ 0.08Petiole −0.77∗∗∗ −0.26 0.77∗∗∗ 0.71∗∗ −0.58∗ 0.74∗∗∗ 0.03Leaf −0.81∗∗∗ −0.23 0.80∗∗∗ 0.78∗∗∗ −0.66∗∗ 0.76∗∗∗ 0.09
Harvest Blade −0.79∗∗∗ −0.34 0.67∗∗ 0.74∗∗∗ −0.66∗∗ 0.75∗∗∗ −0.15Petiole −0.59∗ −0.20 0.51∗ 0.51∗ −0.44 0.71∗∗∗ −0.14Leaf −0.73∗∗ −0.30 0.65∗∗ 0.69∗∗ −0.60∗ 0.76∗∗∗ −0.11
∗∗∗Significant at 0.001 level, ∗∗significant at 0.01 level, ∗significant at 0.05 level.
Dow
nloa
ded
by [
Mos
kow
Sta
te U
niv
Bib
liote
] at
06:
37 1
7 Fe
brua
ry 2
014
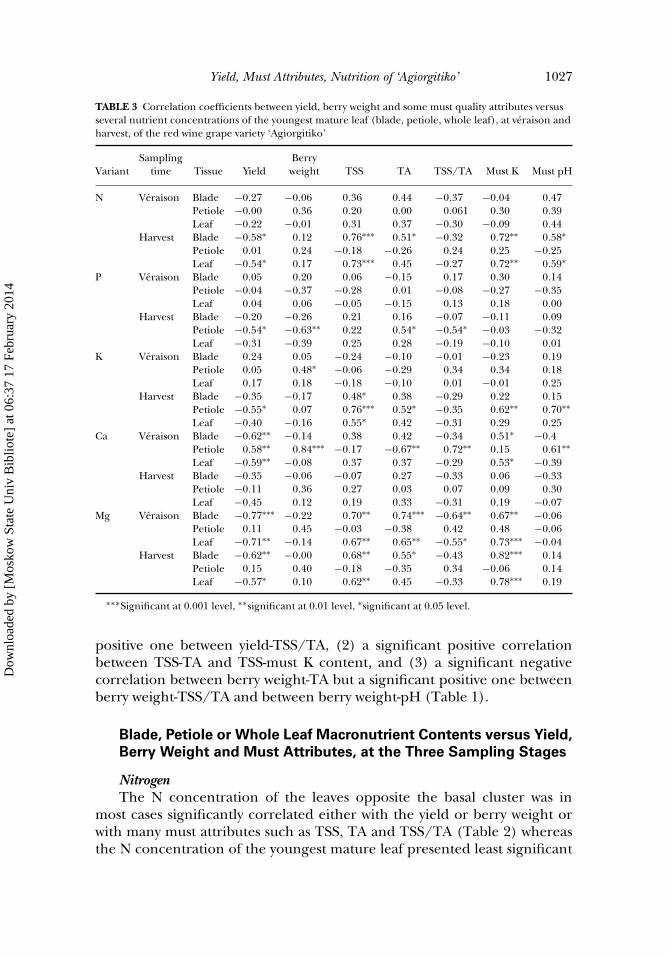
Yield, Must Attributes, Nutrition of ‘Agiorgitiko’ 1027
TABLE 3 Correlation coefficients between yield, berry weight and some must quality attributes versusseveral nutrient concentrations of the youngest mature leaf (blade, petiole, whole leaf), at veraison andharvest, of the red wine grape variety ‘Agiorgitiko’
Sampling BerryVariant time Tissue Yield weight TSS TA TSS/TA Must K Must pH
N Veraison Blade −0.27 −0.06 0.36 0.44 −0.37 −0.04 0.47Petiole −0.00 0.36 0.20 0.00 0.061 0.30 0.39Leaf −0.22 −0.01 0.31 0.37 −0.30 −0.09 0.44
Harvest Blade −0.58∗ 0.12 0.76∗∗∗ 0.51∗ −0.32 0.72∗∗ 0.58∗Petiole 0.01 0.24 −0.18 −0.26 0.24 0.25 −0.25Leaf −0.54∗ 0.17 0.73∗∗∗ 0.45 −0.27 0.72∗∗ 0.59∗
P Veraison Blade 0.05 0.20 0.06 −0.15 0.17 0.30 0.14Petiole −0.04 −0.37 −0.28 0.01 −0.08 −0.27 −0.35Leaf 0.04 0.06 −0.05 −0.15 0.13 0.18 0.00
Harvest Blade −0.20 −0.26 0.21 0.16 −0.07 −0.11 0.09Petiole −0.54∗ −0.63∗∗ 0.22 0.54∗ −0.54∗ −0.03 −0.32Leaf −0.31 −0.39 0.25 0.28 −0.19 −0.10 0.01
K Veraison Blade 0.24 0.05 −0.24 −0.10 −0.01 −0.23 0.19Petiole 0.05 0.48∗ −0.06 −0.29 0.34 0.34 0.18Leaf 0.17 0.18 −0.18 −0.10 0.01 −0.01 0.25
Harvest Blade −0.35 −0.17 0.48∗ 0.38 −0.29 0.22 0.15Petiole −0.55∗ 0.07 0.76∗∗∗ 0.52∗ −0.35 0.62∗∗ 0.70∗∗Leaf −0.40 −0.16 0.55∗ 0.42 −0.31 0.29 0.25
Ca Veraison Blade −0.62∗∗ −0.14 0.38 0.42 −0.34 0.51∗ −0.4Petiole 0.58∗∗ 0.84∗∗∗ −0.17 −0.67∗∗ 0.72∗∗ 0.15 0.61∗∗Leaf −0.59∗∗ −0.08 0.37 0.37 −0.29 0.53∗ −0.39
Harvest Blade −0.35 −0.06 −0.07 0.27 −0.33 0.06 −0.33Petiole −0.11 0.36 0.27 0.03 0.07 0.09 0.30Leaf −0.45 0.12 0.19 0.33 −0.31 0.19 −0.07
Mg Veraison Blade −0.77∗∗∗ −0.22 0.70∗∗ 0.74∗∗∗ −0.64∗∗ 0.67∗∗ −0.06Petiole 0.11 0.45 −0.03 −0.38 0.42 0.48 −0.06Leaf −0.71∗∗ −0.14 0.67∗∗ 0.65∗∗ −0.55∗ 0.73∗∗∗ −0.04
Harvest Blade −0.62∗∗ −0.00 0.68∗∗ 0.55∗ −0.43 0.82∗∗∗ 0.14Petiole 0.15 0.40 −0.18 −0.35 0.34 −0.06 0.14Leaf −0.57∗ 0.10 0.62∗∗ 0.45 −0.33 0.78∗∗∗ 0.19
∗∗∗Significant at 0.001 level, ∗∗significant at 0.01 level, ∗significant at 0.05 level.
positive one between yield-TSS/TA, (2) a significant positive correlationbetween TSS-TA and TSS-must K content, and (3) a significant negativecorrelation between berry weight-TA but a significant positive one betweenberry weight-TSS/TA and between berry weight-pH (Table 1).
Blade, Petiole or Whole Leaf Macronutrient Contents versus Yield,
Berry Weight and Must Attributes, at the Three Sampling Stages
NitrogenThe N concentration of the leaves opposite the basal cluster was in
most cases significantly correlated either with the yield or berry weight orwith many must attributes such as TSS, TA and TSS/TA (Table 2) whereasthe N concentration of the youngest mature leaf presented least significant
Dow
nloa
ded
by [
Mos
kow
Sta
te U
niv
Bib
liote
] at
06:
37 1
7 Fe
brua
ry 2
014
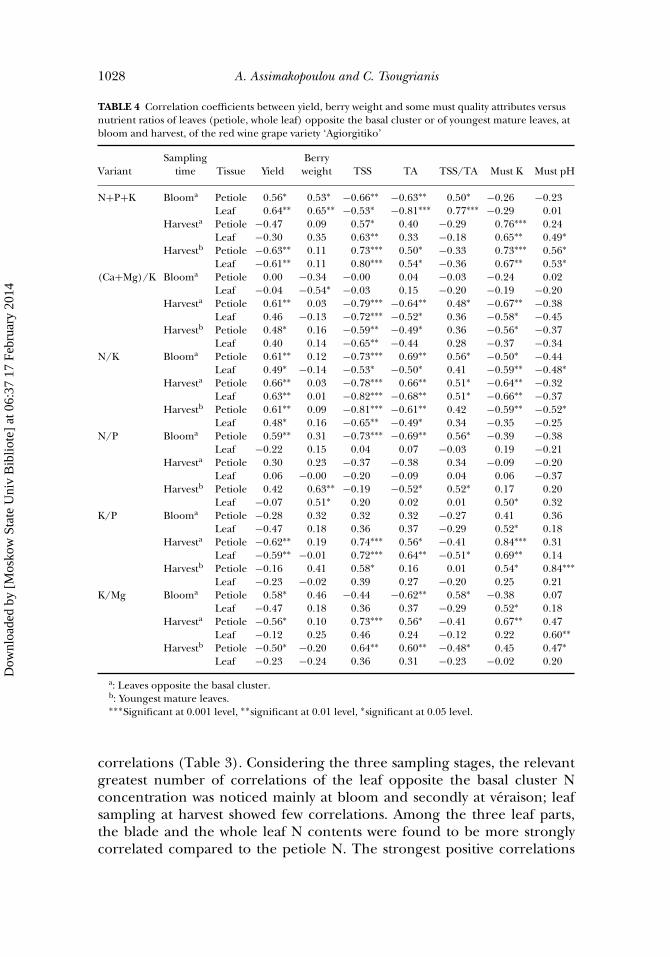
1028 A. Assimakopoulou and C. Tsougrianis
TABLE 4 Correlation coefficients between yield, berry weight and some must quality attributes versusnutrient ratios of leaves (petiole, whole leaf) opposite the basal cluster or of youngest mature leaves, atbloom and harvest, of the red wine grape variety ‘Agiorgitiko’
Sampling BerryVariant time Tissue Yield weight TSS TA TSS/TA Must K Must pH
N+P+K Blooma Petiole 0.56∗ 0.53∗ −0.66∗∗ −0.63∗∗ 0.50∗ −0.26 −0.23Leaf 0.64∗∗ 0.65∗∗ −0.53∗ −0.81∗∗∗ 0.77∗∗∗ −0.29 0.01
Harvesta Petiole −0.47 0.09 0.57∗ 0.40 −0.29 0.76∗∗∗ 0.24Leaf −0.30 0.35 0.63∗∗ 0.33 −0.18 0.65∗∗ 0.49∗
Harvestb Petiole −0.63∗∗ 0.11 0.73∗∗∗ 0.50∗ −0.33 0.73∗∗∗ 0.56∗Leaf −0.61∗∗ 0.11 0.80∗∗∗ 0.54∗ −0.36 0.67∗∗ 0.53∗
(Ca+Mg)/K Blooma Petiole 0.00 −0.34 −0.00 0.04 −0.03 −0.24 0.02Leaf −0.04 −0.54∗ −0.03 0.15 −0.20 −0.19 −0.20
Harvesta Petiole 0.61∗∗ 0.03 −0.79∗∗∗ −0.64∗∗ 0.48∗ −0.67∗∗ −0.38Leaf 0.46 −0.13 −0.72∗∗∗ −0.52∗ 0.36 −0.58∗ −0.45
Harvestb Petiole 0.48∗ 0.16 −0.59∗∗ −0.49∗ 0.36 −0.56∗ −0.37Leaf 0.40 0.14 −0.65∗∗ −0.44 0.28 −0.37 −0.34
N/K Blooma Petiole 0.61∗∗ 0.12 −0.73∗∗∗ 0.69∗∗ 0.56∗ −0.50∗ −0.44Leaf 0.49∗ −0.14 −0.53∗ −0.50∗ 0.41 −0.59∗∗ −0.48∗
Harvesta Petiole 0.66∗∗ 0.03 −0.78∗∗∗ 0.66∗∗ 0.51∗ −0.64∗∗ −0.32Leaf 0.63∗∗ 0.01 −0.82∗∗∗ −0.68∗∗ 0.51∗ −0.66∗∗ −0.37
Harvestb Petiole 0.61∗∗ 0.09 −0.81∗∗∗ −0.61∗∗ 0.42 −0.59∗∗ −0.52∗Leaf 0.48∗ 0.16 −0.65∗∗ −0.49∗ 0.34 −0.35 −0.25
N/P Blooma Petiole 0.59∗∗ 0.31 −0.73∗∗∗ −0.69∗∗ 0.56∗ −0.39 −0.38Leaf −0.22 0.15 0.04 0.07 −0.03 0.19 −0.21
Harvesta Petiole 0.30 0.23 −0.37 −0.38 0.34 −0.09 −0.20Leaf 0.06 −0.00 −0.20 −0.09 0.04 0.06 −0.37
Harvestb Petiole 0.42 0.63∗∗ −0.19 −0.52∗ 0.52∗ 0.17 0.20Leaf −0.07 0.51∗ 0.20 0.02 0.01 0.50∗ 0.32
K/P Blooma Petiole −0.28 0.32 0.32 0.32 −0.27 0.41 0.36Leaf −0.47 0.18 0.36 0.37 −0.29 0.52∗ 0.18
Harvesta Petiole −0.62∗∗ 0.19 0.74∗∗∗ 0.56∗ −0.41 0.84∗∗∗ 0.31Leaf −0.59∗∗ −0.01 0.72∗∗∗ 0.64∗∗ −0.51∗ 0.69∗∗ 0.14
Harvestb Petiole −0.16 0.41 0.58∗ 0.16 0.01 0.54∗ 0.84∗∗∗Leaf −0.23 −0.02 0.39 0.27 −0.20 0.25 0.21
K/Mg Blooma Petiole 0.58∗ 0.46 −0.44 −0.62∗∗ 0.58∗ −0.38 0.07Leaf −0.47 0.18 0.36 0.37 −0.29 0.52∗ 0.18
Harvesta Petiole −0.56∗ 0.10 0.73∗∗∗ 0.56∗ −0.41 0.67∗∗ 0.47Leaf −0.12 0.25 0.46 0.24 −0.12 0.22 0.60∗∗
Harvestb Petiole −0.50∗ −0.20 0.64∗∗ 0.60∗∗ −0.48∗ 0.45 0.47∗Leaf −0.23 −0.24 0.36 0.31 −0.23 −0.02 0.20
a: Leaves opposite the basal cluster.b: Youngest mature leaves.∗∗∗Significant at 0.001 level, ∗∗significant at 0.01 level, ∗significant at 0.05 level.
correlations (Table 3). Considering the three sampling stages, the relevantgreatest number of correlations of the leaf opposite the basal cluster Nconcentration was noticed mainly at bloom and secondly at veraison; leafsampling at harvest showed few correlations. Among the three leaf parts,the blade and the whole leaf N contents were found to be more stronglycorrelated compared to the petiole N. The strongest positive correlations
Dow
nloa
ded
by [
Mos
kow
Sta
te U
niv
Bib
liote
] at
06:
37 1
7 Fe
brua
ry 2
014

Yield, Must Attributes, Nutrition of ‘Agiorgitiko’ 1029
TABLE 5 Correlation coefficients between yield, berry weight and some must quality attributes versusseveral micronutrient concentrations of the leaf (blade, petiole, whole leaf) opposite the basal cluster,at bloom, veraison and harvest, of the red wine grape variety ‘Agiorgitiko’
Sampling BerryVariant time Tissue Yield weight TSS TA TSS/TA Must K Must pH
Fe Bloom Blade −0.76∗∗∗ −0.50∗ 0.56∗ 0.70∗∗∗ −0.62∗∗ 0.28 −0.29Petiole −0.75∗∗∗ −0.51∗ 0.57∗ 0.87∗∗∗ −0.80∗∗∗ 0.21 −0.15Leaf −0.71∗∗∗ −0.55∗ 0.51∗ 0.69∗∗ −0.62∗∗ 0.17 −0.33
Veraison Blade 0.44 −0.16 −0.30 −0.18 0.10 −0.55∗ 0.01Petiole 0.15 −0.23 −0.19 0.09 −0.22 −0.08 0.12Leaf 0.57∗ −0.08 −0.42 −0.33 0.22 −0.63∗∗ 0.03
Harvest Blade 0.82∗∗∗ −0.02 −0.87∗∗∗ −0.69∗∗ 0.50∗ −0.79∗∗∗ −0.35Petiole −0.06 −0.01 0.26 −0.03 0.14 0.01 0.41Leaf 0.82∗∗∗ −0.00 −0.86∗∗∗ −0.71∗∗∗ 0.53∗ −0.80∗∗∗ −0.32
Mn Bloom Blade 0.44 0.20 −0.20 −0.42 0.39 −0.00 0.01Petiole −0.11 −0.07 0.34 0.21 −0.16 0.37 0.13Leaf 0.41 0.17 −0.16 −0.38 0.35 0.02 0.01
Veraison Blade 0.10 0.08 0.19 −0.08 0.13 0.25 0.03Petiole −0.62∗∗ 0.06 0.63∗∗ 0.53∗ −0.39 0.63∗∗ 0.23Leaf −0.40 0.09 0.59∗ 0.36 −0.23 0.63∗∗ 0.19
Harvest Blade −0.19 −0.13 0.26 0.19 −0.17 0.34 −0.14Petiole −0.56∗ 0.07 0.62∗∗ 0.54∗ −0.41 0.64∗∗ 0.19Leaf −0.54∗ −0.05 0.63∗∗ 0.54∗ −0.44 0.68∗∗ 0.07
Zn Bloom Blade 0.04 −0.01 0.21 −0.09 0.15 0.12 0.22Petiole 0.40 −0.08 −0.44 −0.20 0.02 −0.33 −0.29Leaf 0.10 −0.03 0.11 −0.10 0.12 0.05 0.14
Veraison Blade −0.64∗∗ −0.52∗ 0.65∗∗ 0.80∗∗∗ −0.72∗∗∗ 0.30 0.11Petiole −0.44 −0.36 0.40 0.61∗∗ −0.62∗∗ 0.28 −0.12Leaf −0.64∗∗ −0.52∗ 0.65∗∗ 0.80∗∗∗ −0.73∗∗∗ 0.31 0.10
Harvest Blade −0.47 −0.51∗ 0.54∗ 0.69∗∗ −0.64∗∗ 0.24 0.13Petiole −0.48∗ −0.49∗ 0.51∗ 0.59∗ −0.55∗ 0.29 −0.07Leaf −0.48∗ −0.51∗ 0.55∗ 0.69∗∗ −0.64∗∗ 0.25 0.12
B Bloom Blade 0.66∗∗ −0.18 −0.73∗∗∗ −0.59∗ 0.42 −0.70∗∗∗ −0.35Petiole 0.25 0.01 0.03 −0.16 0.21 −0.32 0.38Leaf 0.68∗∗ −0.18 −0.73∗∗∗ −0.60∗∗ 0.43 −0.72∗∗∗ −0.33
Veraison Blade −0.18 −0.28 0.23 0.22 −0.23 0.16 0.06Petiole 0.17 −0.03 −0.40 −0.27 0.19 −0.25 −0.39Leaf −0.16 −0.28 0.17 0.18 −0.20 0.12 0.00
Harvest Blade −0.47∗ 0.15 0.54∗ 0.34 −0.23 0.45 0.27Petiole 0.20 0.06 −0.14 −0.26 0.24 0.00 −0.06Leaf −0.44 0.15 0.52∗ 0.31 −0.21 0.44 0.26
∗∗∗ Significant at 0.001 level, ∗∗ significant at 0.01 level, ∗ significant at 0.05 level.
were shown between blade N-berry weights at veraison (r = 0.81∗∗∗) whereasthe strongest negative ones between petiole N-TSS (r = −0.79∗∗∗) at veraisonand between whole leaf N-TA (r = −0.83∗∗∗) at bloom.
PhosphorusSimilarly to N, positive correlations were noticed between blade P con-
tents and yield whereas negative ones were noticed between P-TSS, P-TAand P-must K. In contrast to N, the berry weight was not significantly
Dow
nloa
ded
by [
Mos
kow
Sta
te U
niv
Bib
liote
] at
06:
37 1
7 Fe
brua
ry 2
014
TA
BL
E6
Cor
rela
tion
coef
fici
ents
betw
een
yiel
dan
dso
me
mus
tatt
ribu
tes
vers
usso
ilso
lubl
ean
dex
chan
geab
leK
and
Mg,
atal
lsam
plin
gst
ages
,oft
he
red
win
egr
ape
vari
ety
‘Agi
orgi
tiko
’
Soil
solu
ble
KSo
ilso
lubl
eM
gSo
ilex
chan
geab
leK
Soil
exch
ange
able
Mg
meq
L−1
ofso
ilex
trac
tm
eq10
0g−
1of
air-
drie
dso
il
Var
ian
tB
loom
Ver
aiso
nH
arve
stB
loom
Ver
aiso
nH
arve
stB
loom
Ver
aiso
nH
arve
stB
loom
Ver
aiso
nH
arve
st
Yiel
d−0
,17
0.80
∗∗∗
0.81
∗∗∗
0,46
0,24
0.67
∗∗0.
70∗∗
0.67
∗∗0.
71∗∗
∗0.
74∗∗
∗0.
50∗
0.79
∗∗∗
TSS
0,34
−0.8
1∗∗∗
−0.8
6∗∗∗
−0,4
2−0
,12
−0.6
2∗∗
−0.8
4∗∗∗
−0.8
1∗∗∗
−0.8
5∗∗∗
−0.8
5∗∗∗
−0.6
6∗∗
−0.8
9∗∗∗
TA
0,15
−0.7
2∗∗∗
−0.7
9∗∗∗
−0,3
5−0
,16
−0.5
7∗−0
.69∗
∗−0
.61∗
∗−0
.72∗
∗∗−0
.67∗
∗−0
.58∗
−0.7
4∗∗∗
Mus
tK0,
38−0
.53∗
−0.5
7∗−0
,34
−0,1
1−0
,41
−0.5
8∗−0
.57∗
−0.5
8∗−0
.73∗
∗∗−0
,45
−0.7
4∗∗∗
Mus
tpH
0,37
−0,3
0−0
,37
−0,0
60,
16−0
,20
−0.5
0∗−0
.47∗
−0.4
9∗−0
,38
−0,3
8−0
,40
∗∗∗
Sign
ifica
nta
t0.0
01le
vel,
∗∗si
gnifi
can
tat0
.01
leve
l,∗
sign
ifica
nta
t0.0
5le
vel.
1030
Dow
nloa
ded
by [
Mos
kow
Sta
te U
niv
Bib
liote
] at
06:
37 1
7 Fe
brua
ry 2
014
Yield, Must Attributes, Nutrition of ‘Agiorgitiko’ 1031
correlated with P level (Table 2). With regard to sampling time, more sig-nificant correlations were found primarily at veraison and secondarily atbloom.
PotassiumAmong the three sampling stages, contrary to N and P, the tissue K con-
centration was significantly correlated with many must attributes at harvest.With regard to the leaf part, petiole K contents of the leaf either oppositethe basal cluster or of the youngest mature leaf were stronger correlatedthan the relevant blade K contents. The correlations between leaf oppositethe basal cluster K and TSS, TA and must K were positive whereas with theyield negative (Table 2). In the case of the youngest mature leaf analysis, theaforementioned correlations were fewer and less strong (Table 3).
CalciumNo significant correlations were observed between leaf Ca concentration
and any of the parameters determined at bloom; adversely, at veraison andharvest, the blade or the whole leaf (not the petiole) opposite the basal clus-ter presented the higher correlation coefficients. The relevant ones with theyield were negative but with TSS, TA and must K they were positive (Table 2).In the case of the youngest mature leaf Ca, at harvest, no significant correla-tions were observed (Table 3).
MagnesiumMg concentration of any part of the leaf opposite the basal cluster,
at every sampling stage, presented highly significant positive correlationswith TSS, TA and must K and significant negative ones with the yield andTSS/TA (Table 2). On the contrary, neither berry weights nor must pHwere significantly correlated with Mg content. Among the several leaf parts,the petiole Mg concentration of the leaf either opposite the basal cluster orof the youngest mature leaf, presented lower or no significant correlationcoefficients compared to that of blade or whole leaf Mg (Tables 2 and 3).
Nutrient Ratios versus Yield, Berry Weight and Must Attributes
The results concerning the correlation coefficients between the nutrientratios N+P+K, (Ca+Mg)/K, N/P, N/K, K/P, K/Mg of the leaf opposite thebasal cluster versus yield, berry weight and must pH, TSS, TSS/TA, at bloomand harvest, as well as, the relevant ones of the youngest mature leaf atharvest, are presented in Table 4. The relevant coefficients either of the leafopposite the basal cluster or of the youngest mature leaf at veraison werefound to be low (data not shown). The N/K ratio presented the greatestnumber of significant correlations with yield, TSS, TA, TSS/TA and must K,regardless of the leaf part or the sampling stage; with regard to the number
Dow
nloa
ded
by [
Mos
kow
Sta
te U
niv
Bib
liote
] at
06:
37 1
7 Fe
brua
ry 2
014
1032 A. Assimakopoulou and C. Tsougrianis
of significant correlations, the ratios N+P+K and (Ca+Mg)/K followed(Table 4).
Blade, Petiole or Whole Leaf Micronutrients versus Yield, Berry
Weight and Must Attributes at the Three Sampling Stages
Regarding the leaf part, the blade micronutrient contents were morestrongly correlated either with yield or must attributes with the only excep-tion of Mn. The greater number of significant correlations was observed inthe cases of Zn and Fe contents. Blade and whole leaf B was also significantlycorrelated with yield and many must attributes, at bloom (Table 5).
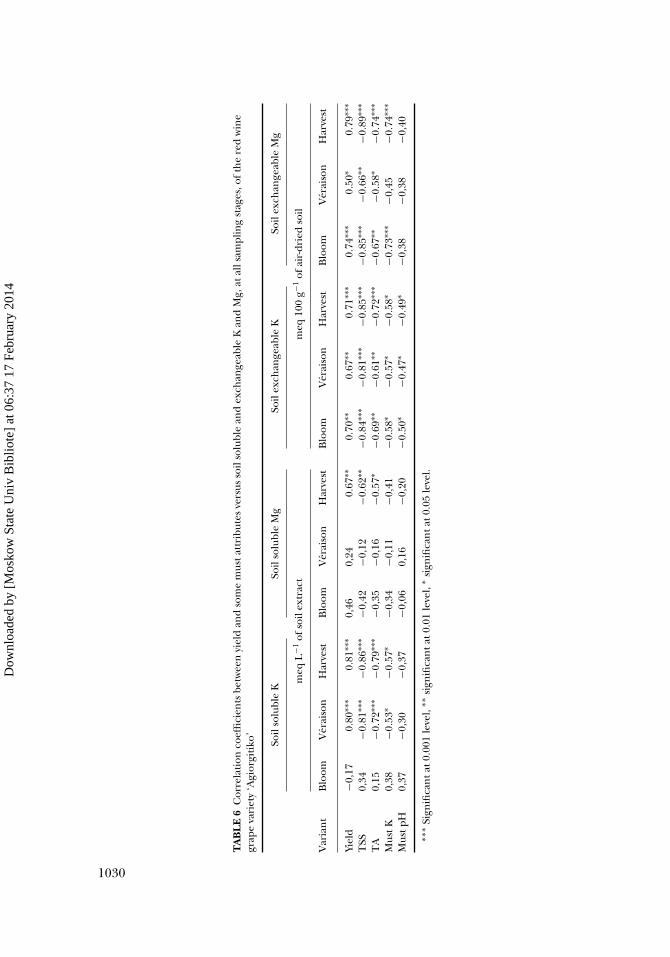
Soil Parameters versus Yield and Must Attributes at Three
Sampling Stages
Yield, TSS and TA were significantly correlated with soil exchangeable Kand Mg at all the sampling stages and with soluble K at veraison and harvest.In the case of yield, the relevant correlation coefficients were positive butin the case of TSS and TA they were negative. Must K was significantlynegatively correlated with soil soluble K at veraison and harvest, as well aswith exchangeable K at all the sampling stages (Table 6).
DISCUSSION
The inorganic nutrition of both years of all the vineyards included in thiswork ranged within normal levels. Specifically, comparing petiole analysisdata at veraison to standards values for grapevine (Vitis vinifera L.) fromthe literature (Reuter and Robinson, 1986; Jones et al., 1991) N, K, Ca, Fe,Zn, Mn and B concentrations were within normal ranges whereas P and Mgcontents were above normal but not excessive (data not shown).
Leaf analysis results of the present study showed how far the leaf nutrientcontents are related to the yield and must quality characteristics. Based on theresults of the leaf opposite the basal cluster sampling (Table 2), the yield wasbetter reflected by N and P status at bloom and veraison and by K at harvest.Despite the positive correlation of N and P contents with the vine production,the relevant K, Ca and Mg correlations were negative. The greater the N andP supply to the vine the higher the growth and yield (Marschner, 1997).Such a positive correlation between plant N and yield was also referred toby Muthukrishnan and Srinivasan (1974). However, the higher the yield thelower the leaf K, Ca, and Mg concentration; the negative correlation betweenK and vine yield at harvest may be attributed to the massive K consumptionby the berries at that time which results in depletion of K reserves from theleaves. Contrary to our results, Amiri and Fallahi (2007) reported that K
Dow
nloa
ded
by [
Mos
kow
Sta
te U
niv
Bib
liote
] at
06:
37 1
7 Fe
brua
ry 2
014
Yield, Must Attributes, Nutrition of ‘Agiorgitiko’ 1033
addition increased the vine yield, that discrepancy could be explained bythe assumption that in their experiments K level might be low and the Kaddition increased vine production.
Among the macronutrients determined, Mg of the leaf opposite the basalcluster was the element that presented the highest correlation coefficientswith the yield at any sampling stage and leaf part. Those coefficients werenegative (Table 2). Hepner and Bradvo (1985) have also declared that leafMg was reduced by crop levels but that effect was apparent only in petioles,not in blades or whole leaves. Mg content presented also the greatest numberof strong correlations with TSS, TA, TSS/TA, and must K, as compared toother elements determined.
With regard to the leaf part, the higher correlation coefficients betweenyield and N, P, Ca and Mg levels were noticed in the case of whole leafor blade analysis, whereas in the case of K, they were noticed in petioles.Hepner and Bravdo (1985) results seem to confirm our findings; crop loadeffects were more significant in petiole K than in blades. Whole leaf K wasalso negatively correlated with the yield since the contents of both tissues(petiole and blade) varied in parallel but this correlation was less strongin whole leaves (Table 2), since blades are normally 4 to 5 times higher inweight than petioles. Christensen (1984) and Garcia et al. (1999) have alsodeclared that the K status of the vine is better reflected by petioles than byblade contents. In relation to K sampling time, our results are in accordancewith those of Hepner and Bradvo (1985) and Klein et al. (2000) who hadalso found that harvest is the best time for K diagnosis, as bloom-time Kpetiole analysis may be misleading in cases of high crop loads. With regardto the correlation of P content with yield, the results of the present studyare consistent with Skinner et al. (1987), considering the leaf blade to bea better indicator of P status since extractable P accumulates preferably inlamina.
In contrast to the positive correlation of the yield with N and P contents ofthe leaf opposite the basal cluster, the correlations of TSS and TA with N andP levels, respectively, were negative while the relevant ones with K, Ca andMg were positive (Table 2). Taking account of the high positive correlationbetween N-yield (Table 2), as well as, the high negative one between yield-TSS(r = −0.79∗∗∗) (Table 1) we are in agreement with Okamoto et al. (2003) thatTSS in grape berries can be reduced by high nitrogen application. Moreover,in agreement with Muthukrishnan and Srinivasan (1974), TSS presented thehighest positive correlation with the petiole K content at harvest whereasTA was found to be highly negatively correlated with the whole leaf N atbloom. Leaf Mg at veraison was also highly correlated either with TSS orwith TA.
Given that K is the major mineral cation in berries and its relationshipwith many berry attributes such as sugar accumulation, stimulatory effectson anthocyanin metabolism, improving effect on TA of grape juice, etc.
Dow
nloa
ded
by [
Mos
kow
Sta
te U
niv
Bib
liote
] at
06:
37 1
7 Fe
brua
ry 2
014
1034 A. Assimakopoulou and C. Tsougrianis
is well documented (Mpelasoka et al., 2003; Amiri and Fallahi, 2007), theresults related to must K gather much interest. In our work, petiole K andmust K concentrations were found to be positively highly correlated to eachother at both veraison (r = 0.76∗∗∗) and harvest (r = 0.85∗∗∗). Matticket al. (1972) has also referred to such a correlation whereas Hepner andBravdo (1985) reported similar correlations at veraison only. In the Amiriand Fallahi (2007) experiments, the more pronounced effects of K on variousyield and quality components of grapes were shown. Regarding the leafpart, petiole K at both sampling times presented the strongest correlationwith must K (Tables 2 and 3). Moreover, Garcia et al. (1999) investigatedthe effect of K-Ca ratios on grapevine K nutrition and must quality. Thehigh negative correlation between must K and leaf N and P should also beevaluated because of the crucial role of N and P in vine growth, the higherthe N and P nutritional status the greater the berry K dilution. Based on thenon significant correlation between must pH and yield (Table 1), we couldassume that must pH was not affected by the crop load probably due to thefact that cation and anion concentrations fluctuated in parallel (Boulton,1980; Hepner and Bravdo, 1985). These results are consistent with those byRuhl et al. (1988) who reported that pH is not always correlated with berryweight.
No significant correlations between berry weight or must pH with themajority of nutrient concentrations determined were observed (Tables 2and 3). However, the highest positive correlation (r = 0.80∗∗∗) betweenleaf N and berry weight at veraison should be evaluated; given that berrysize components (berry weight, width and length) are correlated stronglyand positively with each other (Wie et al., 2002), Amiri and Fallahi (2007)have also reported that N alone or in combination with Mg or K increasedberry size. Small differences in berry size can lead to considerable differ-ences in flesh: skin ratios, with a higher percentage of skin per total berryweight in smaller berries. Skin K concentration is also reported to be higherfor smaller compared to larger berries (Storey, 1987) and this parametermay have an adverse effect on wine quality. The least number of significantcorrelations were observed in the case of must pH (Table 2); the main excep-tion was the positive correlation between must pH and blade N content atveraison.
Berry weight was correlated strongly and negatively with TA but positivelywith the ratio of TSS: TA and pH. Given the significant positive correlationbetween TSS and TA (Table 1), TSS was favourably associated with mustacidity like Wie et al. (2002) have reported.
Regarding the results of the youngest mature leaf sampling (Table 3),the nutrient concentration of whatever leaf part was not in most cases signif-icantly correlated with the parameters examined; it should be attributed tothe fact that in Greece cultural practices like the frequent cut of the growingshoot tip, as well as, the dry and heat weather do not permit the normal
Dow
nloa
ded
by [
Mos
kow
Sta
te U
niv
Bib
liote
] at
06:
37 1
7 Fe
brua
ry 2
014
Yield, Must Attributes, Nutrition of ‘Agiorgitiko’ 1035
development of shoot tip leaves; therefore incorrect sampling proceduremay takes place.
Among the correlation coefficients between yield, berry weight and somemust quality attributes with the nutrient content ratios of leaves opposite thebasal cluster or of youngest mature leaves (Table 4), N/K and secondlyN+P+K and (Ca+Mg)/K either of the petiole or whole leaf, at bloom andharvest, reflected better the yield, TSS, TA and must K (Table 4). Con-trary to the absolute amounts of the elements, the ratio N/K was stronglycorrelated with TSS, TA and must K regardless of the sampling stage andleaf part analyzed. Moreover, the N+P+K content of the petioles at harvestreflected better the must K. The aforementioned results support that thenet accumulation of individual plant nutrients in the tissues alone does notgovern the yield and quality but the intensity and balance between them israther important. The N/K and N+P+K ratios were reported by Hepnerand Bravdo (1985) to be more sensitive to the yield, TSS, TA and must Kthan the absolute amounts of each element. Muthukrishnan and Srinivasan(1974) have also declared that the N/K ratio expresses a bearing on vineyield and several quality factors.
Regarding soil analysis results, it is well known that soil nutrient intensityand chemistry can have a major impact on fruit production and quality. Ac-cording to the linear correlation results between several soil parameters withyield and must quality attributes, the yield, TSS and TA were significantlycorrelated with soil exchangeable K and Mg at all the sampling stages. How-ever, the relevant correlation coefficients were positive in the case of yieldbut negative in the case of TSS and TA. Those results may be related to thefact that the more enriched a soil with exchangeable cations is, the higherthe plant yield, but the higher the yield the lower the TSS and TA (Table 1).Must K was found to be significantly negatively correlated with soil solubleK at veraison and harvest, as well as with exchangeable K at all the samplingstages (Table 6); the higher the K demand from the berries the greater thesoil K depletion.
With this preliminary work we have tried to obtain a guideline for a futuredetailed investigation; further studies are needed to better understand theeffects of plant nutrients on vine yield and their implication with the grapejuice quality of ‘Agiorgitiko’ under different environmental conditions inNemea region, Greece.
REFERENCES
Amiri, E. M., and E. Fallahi. 2007. Influence of mineral nutrients on growth, yield, berry quality, andpetiole mineral nutrient concentrations of table grape. Journal of Plant Nutrition 30: 463–470.
Boulton, R. 1980. The general relationship between potassium, sodium and pH in grape juices and wines.American Journal of Enology and Viticulture 31: 283–287.
Christensen, P. 1969. Seasonal changes and distribution of nutritional elements in Thomson seedlessgrapevines. American Journal of Enology and Viticulture 20: 176–190.
Dow
nloa
ded
by [
Mos
kow
Sta
te U
niv
Bib
liote
] at
06:
37 1
7 Fe
brua
ry 2
014
1036 A. Assimakopoulou and C. Tsougrianis
Christensen, P. 1984. Nutrient level comparisons of leaf petioles and blades in twenty-six grape cultivarsover three years (1979 through 1981). American Journal of Enology and Viticulture 35: 124–133.
Garcia, M., C. Daverede, P. Gallego, and M. Toumi. 1999. Effect of various potassium calcium ratios oncation nutrition of grape grown hydroponically. Journal of Plant Nutrition 22: 417–425.
Hale, C. R. 1977. Relation between potassium and the malate and tartrate contents of grape berries. Vitis16: 9–19.
Hepner, Y., and B. Bravdo. 1985. Effect of crop level and drip irrigation scheduling on the potassiumstatus of Cabernet Sauvingon and Carignane vines and its influence on must and wine compositionand quality. American Journal of Enology and Viticulture 36: 140–147.
Jones, J. B. JR, B. Wolf, and H. A. Mills. 1991. Plant Analysis Handbook. Athens, GA: Micro-Macro Publishing,Inc.
Kasimatis, A. N., and L. P. Christensen. 1976. Response of thompson seedless grapevines to potassiumapplication from three fertilizer sources. American Journal of Enology and Viticulture 27: 145–149.
Klein, I., L. Strime, L. Fanbernstein, and Y. Mani. 2000. Irrigation and fertigation effects on phosphorusand potassium nutrition of wine grapes. Vitis 39: 55–62.
Marschner, H. 1997. Mineral Nutrition of Higher Plants, 2nd ed. London: Academic Press.Mattick, L. R., N. J. Shaulis, and J. C. Moyer. 1972. The effect of potassium fertilization on the acid
content of ‘concord’ grape juice. American Journal of Enology and Viticulture 23: 26–30.Mpelasoka, B., D. Schachtman, M. Treeby, and M. Thomas. 2003. A review of potassium nutrition
in grapevines with special emphasis on berry accumulation. Australian Journal of Grape and WineResearch 9: 154–168.
Muthukrishnan, C. R., and C. Srinivasan. 1974. Correlation between yield, quality and petiole nutrientsin grapes. Vitis 12: 277–285.
Neyroud, J. A., S. Amiguet, G. Andrey, and Ch. Evequoz. 2007. Foliar diagnosis in the orchard: Review ofa 20 years study. Revue Suisse de Viticulture, et Arboriculture, et Horticulture 39: 307–313.
Okamoto, G., H. Onishi, and K. Hirano. 2003. The effect of different fertilizer application levels onanthocyanoplast development in berry skin of Pione grapevines (V. vinifera x V. labrusca). Vitis 42:117–121.
Reuter, D. J., and J. B. Robinson. 1986. Plant Analysis: An Interpretation Manual, 2nd ed. Brunswick,Australia: CSIRO Publishing.
Ruhl, E. H. 1989. Uptake and distribution of potassium by grapevine rootstocks and its implication forgrape juice pH of scion varieties. Australian Journal of Experimental Agriculture 29: 707–712.
Ruhl, E. H., P. R. Clingeleffer, P. R. Nicholas, R. M. Cirami, M. G. Mccarthy, and J. R. Whiting. 1988.Effect of rootstocks on berry weight and pH, mineral content and organic acid concentrations ofgrape juice of some wine varieties. Australian Journal of Experimental Agriculture 28: 119–125.
Skinner, P. W., M. A. Matthews, and R. M. Carlson. 1987. Phosphorus requirements of wine grapes: Ex-tractable phosphate of leaves indicates phosphorus status. Journal of American Society and HorticulturalScience 112: 449–454.
Storey, R. 1987. Potassium localization in the grape berry pericarp by energy-dispersive x-ray microanalysis.American Journal of Enology and Viticulture 38: 301–309.
Wie, X., S. R. Sykes, and P. R. Clingeleffer. 2002. An investigation to estimate genetic parameters inCSIRO’s table grape breeding program. 2. Quality characteristics. Euphytica 128: 343–351.
Wolpert, J. A., D. R., Smart, and M. Anderson. 2005. Lower petiole potassium concentration at bloom inrootstocks with Vitis Berlandieri genetic backgrounds. American Journal of Enology and Viticulture 56:163–169.
Dow
nloa
ded
by [
Mos
kow
Sta
te U
niv
Bib
liote
] at
06:
37 1
7 Fe
brua
ry 2
014