correlating ivc measurements with intravascular volume changes … · correlating ivc measurements...
TRANSCRIPT

Correlating IVC Measurements with IntravascularVolume Changes at Three Distinct Measurement Sites
Item Type Thesis
Authors Yang, Kimberly
Publisher The University of Arizona.
Rights Copyright © is held by the author. Digital access to this materialis made possible by the College of Medicine - Phoenix, Universityof Arizona. Further transmission, reproduction or presentation(such as public display or performance) of protected items isprohibited except with permission of the author.
Download date 05/08/2018 08:38:54
Link to Item http://hdl.handle.net/10150/315932

i
Correlating IVC Measurements with Intravascular Volume Changes at Three Distinct
Measurement Sites
A Thesis submitted to the University of Arizona College of Medicine – Phoenix
in partial fulfillment of the requirements for the Degree of Doctor of Medicine
Kimberly Yang
Class of 2014
Mentor: Teresa Wu, MD, FACEP

ii
DEDICATION
The author would like to thank the following for their integral role in this study:
Daniel Haase, MD
Shannon K. Gust, MD
Kai‐Ning Khor, BS, MPH
David Drachman, PhD
And also to TWu for her great mentorship and most importantly, because she’s always got my
back.

iii
ABSTRACT
Bedside ultrasound of the inferior vena cava (IVC) has grown to be an important tool in
the assessment and management of critically ill patients. This study endeavors to examine
which location along the IVC is most highly correlated with changes in intravascular volume
status: (1) the diaphragmatic juncture (DJ) (2) two centimeters caudal to the hepatic vein
juncture (2HVJ) or (3) left renal vein juncture (LRVJ). Data was collected in this prospective
observational study on patients in the emergency department who were at least 16 years of
age, being treated with intravenous fluids (IVF). Measurements of the IVC were recorded at
each site during standard inspiratory and expiratory cycles, and again with the patient actively
sniffing to decrease intrapleural pressures. IVF was then administered per the patient’s
predetermined treatment, and the same six measurements were repeated after completion of
fluid bolus. The difference in caval index (dCI) was calculated for all six data sets and correlated
with the mL/kg of IVF administered. There was a statistically significant correlation between
mL/kg of IVFs administered and dCI at all three sites (DJ: r = 0.354, p value = 0.0002; 2HVJ: r =
0.334, p value = 0.0003; LRVJ: r = 0.192, p value = 0.03). The greatest correlation between
amount of fluids administered and dCI was observed along the IVC at the site 2 cm caudal to
the juncture of the hepatic veins (2HVJ). This site is also where the largest change in diameter
can be appreciated on ultrasound during intravascular volume resuscitation. Our data also
suggests that every mL/kg of IVFs administered should change the dCI by 0.86‐1.00%. This
anticipated change in IVC diameter can be used to gauge a patient’s response to intravascular
volume repletion.

iv
TABLE OF CONTENTS
DEDICATION ..................................................................................................................................... i
ABSTRACT ........................................................................................................................................ iii
LIST OF FIGURES AND TABLES .......................................................................................................... v
INTRODUCTION ............................................................................................................................... 1
Background .................................................................................................................................. 1
Impact .......................................................................................................................................... 2
Aims and Goals ............................................................................................................................ 3
MATERIALS AND METHODS ............................................................................................................ 4
RESULTS........................................................................................................................................... 6
Figure 1 ........................................................................................................................................ 7
Figure 2: ....................................................................................................................................... 8
Figure 3 ........................................................................................................................................ 9
Figure 4 ...................................................................................................................................... 10
Figure 5 ...................................................................................................................................... 11
Figure 6 ...................................................................................................................................... 12
DISCUSSION ................................................................................................................................... 13
LIMITATIONS ................................................................................................................................. 15
CONCLUSION ................................................................................................................................. 17
REFERENCES .................................................................................................................................. 18

v
LIST OF FIGURES AND TABLES
Figure 1. dIVC vs. mL/kg at the Diaphragmatic Juncture (DJ)
Figure 2. Diaphragmatic juncture of the IVC as measured by ultrasound
Figure 3. dIVC vs. mL/kg 2 cm distal to Hepatic Vein Junction (2HVJ)
Figure 4. 2cm caudal to hepatic vein juncture on IVC as measured by ultrasound
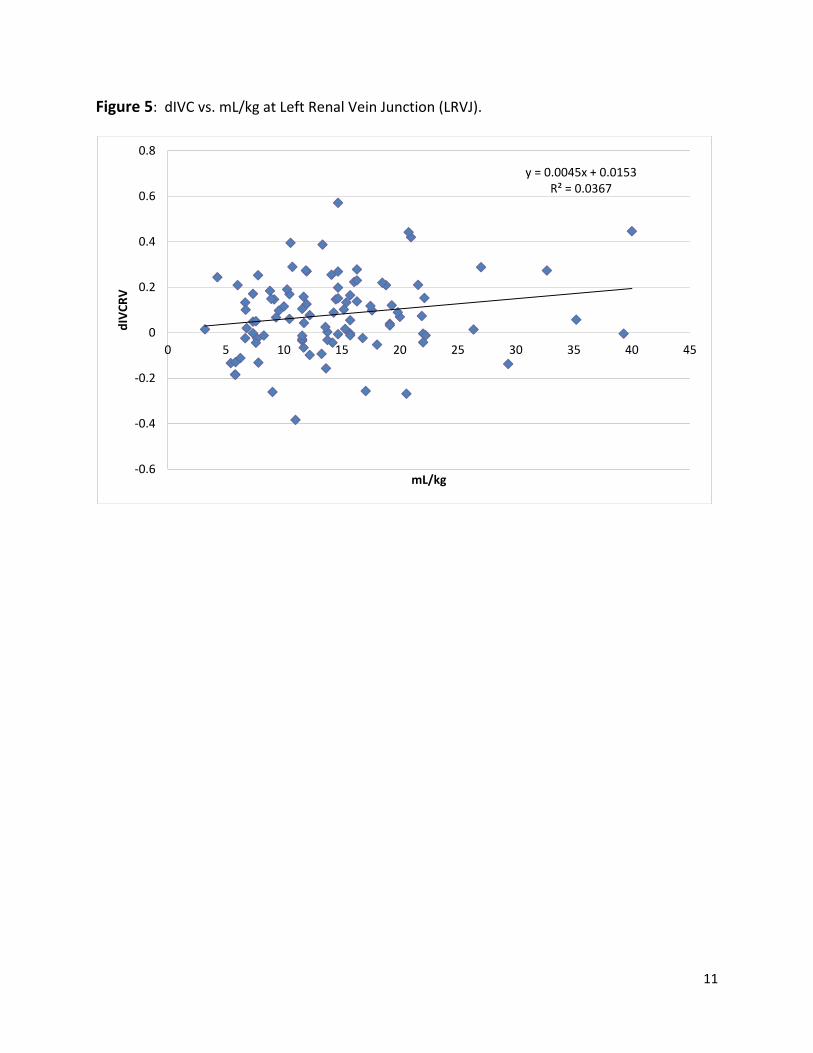
Figure 5. dIVC vs. mL/kg at Left Renal Vein Junction (LRVJ)
Figure 6. Left renal vein juncture on IVC as measured by ultrasound

1
INTRODUCTION
Background
Bedside ultrasound of the inferior vena cava (IVC) is an important tool in the assessment
and management of critically ill patients and can provide very useful information about a
patient’s intravascular volume status within a matter of minutes. Over the years, physicians in
acute care settings have found that ultrasound measurements of the IVC can help guide
intravenous fluid management and direct resuscitation options 1. An evaluation of a patient’s
IVC can be performed quickly at the bedside, and serial examinations can be conducted in a
non‐invasive manner, with little to no risk to the patient.
There are currently a variety of methods available for assessing a patient’s intravascular
volume status. These methods include, but are not limited to, the use of pulmonary artery
catheters, central venous pressure monitors, esophageal Doppler analysis, arterial waveform
analysis, mitral valve inflow evaluation, and tissue Doppler studies 2.Many of these methods
require invasive procedures that place the patient at risk for complications such as hemorrhage,
infection, and accidental puncture or laceration of adjacent structures. It is also common for
clinicians to evaluate physical exam findings such as skin turgor, mucous membrane
appearance, and capillary refill to help gauge a patient’s intravascular volume status. Studies
have shown that these physical exam findings can be very subjective and are limited by the
interpretation of the practitioner. Blood pressure, heart rate, and pulse pressures are also
common measurements assessed in the evaluation of patient’s in shock, but these parameters
have been shown to be unreliable indicators of intravascular blood volume unless the severity
of shock is extreme 3.
The idea of using bedside ultrasound to evaluate the IVC and its relationship to
intravascular volume status has been met with great enthusiasm over the past decade. The
application is portable, non‐invasive, and the results have been shown to be highly reliable in
various patient populations. Practitioners have found that the IVC can be easily visualized via
2
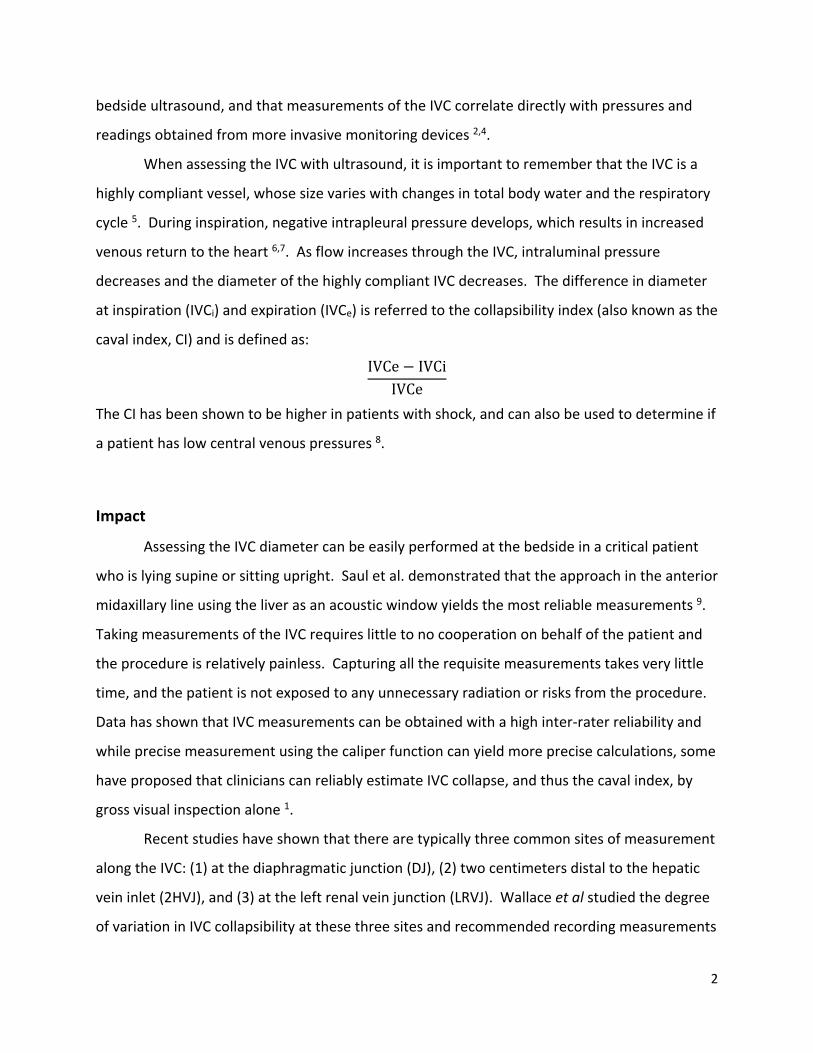
bedside ultrasound, and that measurements of the IVC correlate directly with pressures and
readings obtained from more invasive monitoring devices 2,4.
When assessing the IVC with ultrasound, it is important to remember that the IVC is a
highly compliant vessel, whose size varies with changes in total body water and the respiratory
cycle 5. During inspiration, negative intrapleural pressure develops, which results in increased
venous return to the heart 6,7. As flow increases through the IVC, intraluminal pressure
decreases and the diameter of the highly compliant IVC decreases. The difference in diameter
at inspiration (IVCi) and expiration (IVCe) is referred to the collapsibility index (also known as the
caval index, CI) and is defined as:
IVCe IVCiIVCe
The CI has been shown to be higher in patients with shock, and can also be used to determine if
a patient has low central venous pressures 8.
Impact
Assessing the IVC diameter can be easily performed at the bedside in a critical patient
who is lying supine or sitting upright. Saul et al. demonstrated that the approach in the anterior
midaxillary line using the liver as an acoustic window yields the most reliable measurements 9.
Taking measurements of the IVC requires little to no cooperation on behalf of the patient and
the procedure is relatively painless. Capturing all the requisite measurements takes very little
time, and the patient is not exposed to any unnecessary radiation or risks from the procedure.
Data has shown that IVC measurements can be obtained with a high inter‐rater reliability and
while precise measurement using the caliper function can yield more precise calculations, some
have proposed that clinicians can reliably estimate IVC collapse, and thus the caval index, by
gross visual inspection alone 1.
Recent studies have shown that there are typically three common sites of measurement
along the IVC: (1) at the diaphragmatic junction (DJ), (2) two centimeters distal to the hepatic
vein inlet (2HVJ), and (3) at the left renal vein junction (LRVJ). Wallace et al studied the degree
of variation in IVC collapsibility at these three sites and recommended recording measurements

3
at 2HVJ and LRVJ only 10. The data from this study were collected in healthy volunteers and
consisted of students and residents present in the emergency department (ED) at that time.
While other studies have proposed which site is the best to measure the CI, none have
established which location along the IVC is most accurate for measuring the changes before and
after fluid resuscitation.
Aims and Goals
Although there is great interest in using IVC ultrasound to assess intravascular volume
status and guide resuscitation, there are still many unanswered questions in regards to this
relatively novel ultrasound application. Our study attempted to address some of these
questions. In the first portion of our study, we attempted to identify whether the
diaphragmatic juncture (DJ), two centimeters caudal to the hepatic vein juncture (2HVJ), or the
left renal vein juncture (LRVJ) is the most accurate, dynamic, and reproducible spot for
determining intravascular volume status. We then evaluated whether changes in IVC diameter
can be predicted based on patient weight and amount of fluid administered.

4
MATERIALS AND METHODS
Study Design
This was a prospective, observational study where bedside ultrasound was used to
obtain serial IVC diameter measurements in emergency department (ED) patients. Bedside
ultrasonography is used routinely in the department where data was collected, and the
hospital’s institutional review board approved the research study prior to its commencement.
Study Setting and Population
This study was conducted at a Level 1 trauma center with an annual ED census of
approximately 65,000 patients. Patients were eligible for enrollment if they were at least 16
years of age and the treating physician identified the patient as requiring intravenous fluid as
part of the management plan. Patients were excluded if they were unable to give consent.
Other exclusion criteria included positive‐pressure ventilation, trauma, or pregnancy greater
than 20 weeks of gestational age.
Study Protocol
Emergency medicine residents, emergency ultrasound fellows, and emergency medicine
attending physicians were trained on how to perform IVC measurements via bedside
ultrasound prior to study commencement. All participants received both a didactic and hands‐
on instructional course, and were supervised by an ultrasound fellowship‐trained and
credentialed emergency physician. Prior to the transabdominal ultrasound of the IVC, patient
blood pressure, height, and weight were recorded. Patients were placed in the supine position
with the head at 0 degrees. Using a phased array transducer on a SonoSite M‐Turbro (Bothell,
WA), the IVC and aorta were identified in the transverse plane in the subxiphoid window and
both vessels were confirmed using color or spectral Doppler. Once the IVC was identified in the
transverse plane, the probe was rotated 90 degrees so that a long‐axis view of the IVC was
obtained. Measurements of the IVC were obtained in the long‐axis view along the anterior to
mid‐axillary line on the right side of the patient, using the liver as an acoustic window or via the

5
subxiphoid approach. The practitioner performing the scan was advised to take measurements
in the view that provided them with the best visualization of the walls of the IVC.
Initial measurements of the IVC diameter were taken at the DJ, 2HVJ, and LRVJ during
the patient’s standard inspiratory and expiratory cycle at baseline. Then, all three
measurements were repeated with the patient actively sniffing to decrease intrapleural
pressures. Intravenous fluids (IVFs), typically normal saline, were then administered per the
individual treatment plans as pre‐determined by the treating physician, and the same six
measurements were taken after the fluid bolus was completed. The difference in caval index
(dCI) was calculated for all six data sets. The Pearson correlation coefficient (r) with the mL/kg
of IV fluids administered was then calculated for the dCI at each individual location.

6
RESULTS
A total of 117 patients were recruited for enrollment in the study based on the inclusion
and exclusion criteria. The mean patient height was 65.45 inches with a mean weight of 73.62
Kg. All six measurements were successfully obtained in 100 of the 117 enrolled patients. Data
was missing on 17 patients secondary to obstructing bowel gas limiting the view of the IVC
during subsequent measurements, lack of patient cooperation with subsequent scans, or
patients leaving the ED prior to the completion of data acquisition.
The mean difference in IVC collapse (dCI) was 0.97 cm at the DJ, 1.15 cm at 2HVJ, and
0.8 cm at LRVJ. Measurements at both the diaphragmatic juncture (DJ) and 2 cm caudal to the
juncture of the hepatic vein (2HVJ) had the greatest correlation (DJ; r = 0.334, p value =
0.00002; 2HVJ; r = 0.354, p value = 0.0003).
There was a statistically significant correlation between mL/kg of IVFs administered and
dCI at all three sites (DJ: r = 0.334, p value = 0.0002; 2HVJ: r = 0.354, p value = 0.0003; LRVJ: r =
0.192, p value = 0.03). Both the DJ and the 2HVJ measurements yielded a power of 98% and
96% while LRVJ had a power of 52%.
The largest average dCI was seen at the 2HVJ site. The smallest average dCI was seen at
the DJ site. The average dCI/mL/kg of IVFs administered was 0.90% at the DJ site, 1.00% at the
HVJ site, and 0.86% at the LRVJ site. There was a statistically significant correlation between
mL/kg of IVFs administered and dCI at all three sites evaluated.

7
Figure 1: dIVC vs. mL/kg at the Diaphragmatic Juncture (DJ).
y = 0.0114x ‐ 0.0668R² = 0.1253
‐0.6
‐0.4
‐0.2
0
0.2
0.4
0.6
0.8
1
0 5 10 15 20 25 30 35 40 45
dIVCD
mL/kg

8
Figure 2: Diaphragmatic juncture of the IVC as measured by ultrasound

9
Figure 3: dIVC vs. mL/kg 2 cm distal to Hepatic Vein Junction (2HVJ).
y = 0.0099x ‐ 0.0278R² = 0.1114
‐0.8
‐0.6
‐0.4
‐0.2
0
0.2
0.4
0.6
0.8
0 5 10 15 20 25 30 35 40 45dIVCHV
mL/kg

10
Figure 4: 2cm caudal to the hepatic vein juncture site as measured by ultrasound
11
Figure 5: dIVC vs. mL/kg at Left Renal Vein Junction (LRVJ).
y = 0.0045x + 0.0153R² = 0.0367
‐0.6
‐0.4
‐0.2
0
0.2
0.4
0.6
0.8
0 5 10 15 20 25 30 35 40 45
dIVCRV
mL/kg

12
Figure 6: Left renal vein juncture on the IVC as measured by ultrasound

13
DISCUSSION
When measuring the IVC diameter during the assessment and resuscitation of patients
requiring intravascular volume repletion, the three most common sites of measurement in
recent literature are (1) at the diaphragmatic junction (DJ), (2) two centimeters distal to the
hepatic vein inlet (2HVJ), and (3) at the left renal vein junction (LRVJ). These three points on
the IVC are the most common sites for evaluation because they are the easiest sites to identify
distinctly on bedside ultrasound. The retrohepatic and proximal IVC are most clearly seen on
ultrasound when the liver is usually used as an acoustic window. Attempts to visualize the IVC
distal to the confluence of the left renal vein is difficult because of overlying bowel gas and lack
of an acoustic window. To date, most of the literature mentions analysis of the IVC diameter at
one of the three aforementioned sites, but there is no consensus detailing which site provides
the most accurate, dynamic, and reproducible measurements for IVC diameter assessment
using bedside ultrasound.
The first goal of our study was to determine whether the diaphragmatic juncture (DJ),
two centimeters caudal to the hepatic vein juncture (2HVJ), or the left renal vein juncture (LRVJ)
demonstrates the most dynamic change during an assessment for intravascular volume status.
During a resuscitation, it is important to know which part of the IVC demonstrates the greatest
change in diameter during intravascular volume repletion. This appreciable change in diameter
is what is being used to assess a patient’s response to fluid administration during point‐of‐care
ultrasound. If a practitioner performs serial measurements at a site on the IVC that does not
normally fluctuate in size based on intravascular volume status, the sonographic data obtained
will not be useful in gauging response to IV fluid administration.
Based on our data the greatest correlation between the amount of intravenous fluids
administered and the dCI was seen along the IVC 2 cm caudal to the juncture of the hepatic
veins (2HVJ). The data from our study makes sense in regards to what would be expected from
an anatomical standpoint. In most patients, the walls of the IVC are tethered to walls of the
diaphragm as it enters into the thoracic cavity at its foramen at T8 and joins the right atrium.
Because of this tethering, ultrasound analysis of the IVC at this level may not demonstrate as

14
large of a difference in IVC diameter with changes in intrapleural pressures and during
intravascular volume resuscitation. The hepatic veins typically join the IVC anywhere between
0.5 to 3.0 cm proximal to the ostium of the right atrium and this juncture can be easily
visualized on ultrasound. The IVC 2 cm proximal to this juncture is very dynamic and variations
with respiration are easily appreciated during sonographic evaluations of the IVC walls at this
level. It stands to reason that this is the best site to evaluate the IVC for changes in diameter
and to assess the change in caval index during intravascular volume resuscitation. At the level
of the left renal vein juncture, the IVC is smaller in diameter and harder to visualize. Because
the absolute diameter of the IVC at the LRVJ is smaller than cranial portions of the vessel,
changes in diameter at this level are harder to appreciate and accurate measurements at this
site are more difficult to reproduce.
The second aim of our study was to evaluate whether changes in the IVC diameter can
be predicted based upon the patient’s weight and amount of fluid administered. In our study,
every mL/kg of IVFs administered was shown to change the dCI by 0.86‐1.00%. This proved to
be an interesting trend and can be very useful data in the clinical setting. If a patient is
receiving intravascular volume repletion, it is useful to know if the IVC diameter is responding
and increasing as predicted. If the dCI is not increasing by 0.86 to 1% for every mL/kg of IVFs
administered, the patient may not be retaining the fluid intravascularly (ie. hemorrhaging) or
the clinical situation may require vasopressor agents to help improve vascular resistance and
appropriate distribution of the intravascular volume being administered. Knowing the
dCI/mL/Kg can help guide the total volume of fluid resuscitation required based on the patient’s
weight and help gauge whether or not the patient is demonstrating the predicted response to
the fluid administered.
15
LIMITATIONS
In evaluating the IVC via ultrasound, the major pitfalls encountered are usually
secondary to large patient body habitus, obstructing bowel gas, subcutaneous emphysema, and
provider experience level with ultrasound. In an attempt to minimize these pitfalls, most IVC
ultrasounds are performed in the ED using the lateral approach where the IVC is imaged
through the liver at the anterior axillary line. A long‐axis view of the IVC can be obtained with
this approach using the liver as an acoustic window. The long‐axis view allows the practitioner
to see the confluence between the IVC, the hepatic veins, and the left renal vein. In order to
standardize our ultrasound scanning technique and measurement, we had our practitioners
obtain all measurements of the IVC in the long‐axis view so that they could easily identify the
diaphragm, the hepatic vein joining the IVC, and the left renal vein.
It is important to note that the measured diameter of the IVC in this long‐axis view can
be smaller than the true diameter of the IVC if the measurements are taken just medial or
lateral to the center of the IVC. On a long‐axis view of a cylindrical structure, it is impossible to
know if the sound waves are directed directly through the center of the structure or if they are
tangentially off to one side or the other. Although the long‐axis view provides practitioners
with the clearest view of the IVC, it is important to note that this view may underestimate the
true diameter of the IVC and the data should be interpreted accordingly. In our study, we
minimized the tangential cylindrical effect by calculating the % of change in IVC diameter.
Further studies are necessary to elucidate the differences between diameter measurements in
the short‐axis subxiphoid view of the IVC, long‐axis subxiphoid view of the IVC, and lateral long‐
axis view of the IVC. Also, because the IVC is not a perfect cylinder and is typically more
lenticular shaped in patients with a normal or sub‐normal intravascular volume status, the
normal transverse diameter is typically larger than the normal antero‐posterior (AP) diameter.
Larger studies should be aimed at determining the difference between the dCI when
measurements are taken in the AP diameter versus the transverse diameter during
resuscitation attempts.

16
Another limitation of this study is that we do not know whether or not any of our
patients had any congenital or anatomical abnormalities that would have led to erroneous IVC
diameter measurements. In situations where the diameter values are unexpected and falsely
low or high, it may be prudent to take serial measurements at various sites along the IVC to
ensure that there are not other confounding factors for the unexpected readings.

17
CONCLUSION
Our study demonstrated that the greatest correlation between the amount of
intravenous fluids administered and the dCI was seen along the IVC 2 cm caudal to the juncture
of the hepatic veins (2HVJ) and that this site is where the largest change in diameter can be
appreciated on ultrasound during intravascular volume resuscitation. Our data also suggests
that every mL/kg of IVFs administered should change the dCI by 0.86‐1.00%. This anticipated
change in IVC diameter can be used to gauge a patient’s response to intravascular volume
repletion.
18
REFERENCES
1. Fields JM, Lee PA, Jenq KY, Mark DG, Panebianco NL, Dean AJ. The interrater reliability
of inferior vena cava ultrasound by bedside clinician sonographers in emergency
department patients. Acad Emerg Med. 2011;18(1):98‐101.
2. Stawicki SP, Braslow BM, Panebianco NL, et al. Intensivist use of hand‐carried
ultrasonography to measure IVC collapsibility in estimating intravascular volume status:
correlations with CVP. J Am Coll Surg. 2009;209(1):55‐61.
3. Wo CC, Shoemaker WC, Appel PL, Bishop MH, Kram HB, Hardin E. Unreliability of blood
pressure and heart rate to evaluate cardiac output in emergency resuscitation and
critical illness. Crit Care Med. 1993;21(2):218‐223.
4. Schefold JC, Storm C, Bercker S, et al. Inferior vena cava diameter correlates with
invasive hemodynamic measures in mechanically ventilated intensive care unit patients
with sepsis. J Emerg Med. 2010;38(5):632‐637.
5. Lyon M, Blaivas M, Brannam L. Sonographic measurement of the inferior vena cava as a
marker of blood loss. Am J Emerg Med. 2005;23(1):45‐50.
6. Barbier C, Loubières Y, Schmit C, et al. Respiratory changes in inferior vena cava
diameter are helpful in predicting fluid responsiveness in ventilated septic patients.
Intensive Care Med. 2004;30(9):1740‐1746.
7. Feissel M, Michard F, Faller JP, Teboul JL. The respiratory variation in inferior vena cava
diameter as a guide to fluid therapy. Intensive Care Med. 2004;30(9):1834‐1837.
8. Nagdev AD, Merchant RC, Tirado‐Gonzalez A, Sisson CA, Murphy MC. Emergency
department bedside ultrasonographic measurement of the caval index for noninvasive
determination of low central venous pressure. Ann Emerg Med. 2010;55(3):290‐295.
9. Saul T, Lewiss RE, Langsfeld A, Radeos MS, Del Rios M. Inter‐rater reliability of
sonographic measurements of the inferior vena cava. J Emerg Med. 2012;42(5):600‐605.
10. Wallace DJ, Allison M, Stone MB. Inferior vena cava percentage collapse during
respiration is affected by the sampling location: an ultrasound study in healthy
volunteers. Acad Emerg Med. 2010;17(1):96‐99.