corrective and preventive action
TRANSCRIPT
Corrective and preventive action
Tania L. Motschman *, S. Breanndan Moore
Department of Laboratory Medicine and Pathology, Division of Transfusion Medicine, Mayo Foundation, 200 First Street SW,
Rochester, MN 55905, USA
Abstract
Recognized principles of quality management include a component for process improvement, comprised largely of
corrective and preventive action taken in response to identi®ed problems. The importance of identifying and investi-
gating problems has been clearly established in transfusion medicine. Such problems can be identi®ed in the following
ways: error, incident, and accident reports; adverse reaction reports; customer complaints; process indicator mea-
surements; results of pro®ciency testing; and results of internal or external audits, inspections, or assessments. Re-
sponses to reported events can be remedial, in which the symptom is addressed, or corrective, in which the underlying
cause is addressed with the intent to prevent recurrence. If identi®ed problems or their root causes are trended to look
for patterns or problems not yet occurring are anticipated, the action taken is proactive and considered preventive.
Methods to trend events, monitor processes, and perform root cause analysis are discussed as well as use of the fol-
lowing process improvement `tools': control charts, ¯owcharting, the `repetitive why', cause-and-e�ect diagram, and
Pareto analysis. Ó 1999 Elsevier Science Ltd. All rights reserved.
Keywords: Remedial action; Corrective action; Preventive action; Root cause; Process indicators; Process monitoring; Event
classi®cation; Error classi®cation
1. Introduction
Quality management principles, recognizedworld-wide, include a component for processimprovement, comprised largely of actions takento correct or prevent problems. Corrective orpreventive action is usually initiated in responseto a speci®c event with adverse consequences ora collection of events that trigger the desire orneed to change. Customer and business needstypically drive the remainder of an organizationÕs
process improvement e�orts. In TransfusionMedicine opportunities to improve processes cancome to light in a variety of ways. The followingprovide a wealth of information for possiblecorrective or preventive actions: error, incident,and accident reports, adverse reaction reports,customer complaints, process indicator measure-ments, and results of pro®ciency testing andinternal or external audits, inspections, or as-sessments. The corrective and preventive actionprocess includes identi®cation of problems andtheir causes and identi®cation and evaluation ofsolutions to prevent future problems. This articleexplores methods that can be used to createan e�ective corrective and preventive actionprocess.
www.elsevier.com/locate/transci
Transfusion Science 21 (1999) 163±178
* Corresponding author. Tel.: +507-284-9007; fax: +507-284-
1399.
0955-3886/99/$ - see front matter Ó 1999 Elsevier Science Ltd. All rights reserved.
PII: S 0 9 5 5 - 3 8 8 6 ( 9 9 ) 0 0 0 8 8 - 0
2. De®nitions and concepts
A process is a series of actions, performed undercertain conditions, using resources to produce aproduct or other output. Every process has `input',which is usually comprised of information andmaterials, the `performance phase' in which theactivities or steps are performed, and an `output',which can be tangible, such as a product, or in-tangible, such as a service. The outcome is theresulting cumulative e�ect from performance ornonperformance of one or more processes. A sys-tem is a group of related processes supported by aninfrastructure to manage and coordinate its func-tion. A system provides focus and an environmentfor the processes. Process improvement is an or-ganized and ongoing study and adaptation ofprocesses to improve the output of those processesor increase the probability of achieving the desiredoutcome.
Corrective action has been de®ned as the actiontaken to eliminate the causes of an existing non-conformity, defect, or other undesirable situationin order to prevent recurrence [1]. On the otherhand, preventive action has been de®ned as theaction taken to eliminate the causes of a potentialnonconformity, defect, or other undesirable situ-ation in order to prevent occurrence [1]. Imple-menting corrective action can be thought of as areactive approach to reported problems that in-cludes a preventive component, whereas preven-tive action can be thought of as a proactiveapproach resulting from analysis of informationand data. Preventive action can result from ana-lyzing a collection of reported problems as well asperceived potential problems. In contrast, reme-dial action has been de®ned as the action taken toalleviate the symptoms of existing nonconformitiesor any other undesirable situation [2]. Remedialaction addresses only the visible indicator of aproblem, not the actual cause. Examples to illus-trate these di�erences, taken from Russell andRegel [2], are as follows. Your 20 year old roofstarts to leak, so you patch the roof and replasterthe ceiling where the leaky roof has caused damage(remedial action). Your 20 year old roof starts toleak, so you replace the roof and repair the ceilingwhere the leaky roof has caused damage (correc-
tive action). Your 20 year old roof has not yetstarted to leak but the shingles were only guaran-teed for 20 years, so you replace the roof beforeany leaking starts (preventive action).
A case report, which illustrates a progressiveapproach from remedial to corrective to preventiveaction, was described by Sirkin and Stalk [3]. Thereport described a paper mill that went throughfour phases to address their ®nancial problems.This phased approach brought the company fromthe brink of bankruptcy in the 1980s to the posi-tion of number-one national supplier for itsproduct within two-and-one-half years. Manage-ment personnel from the paper mill enlisted com-pany employees to help resolve the problems, butmade it clear that if e�orts failed, the companywould have to close operations. They provided thenecessary resources and promised ®nancial bo-nuses if pro®ts turned around. In the ®rst problem-solving phase, company employees interviewedcustomers of the paper mill. They determined thattheir paper product quality was adversely a�ectingtheir customersÕ ability to deliver products andservices. They decided that the paper productquality needed to be improved. Their initial ap-proach to the problem was to inspect their ®nishedproducts and reject those that were substandard.Problems were ®xed as they arose; the authorscalled this phase `Fix-as-Fail'. The employeesquickly realized that problems kept mounting. Upto 50% of their ®nished product was rejected andthere were not enough personnel to address all ofthe problems. Next a phase was implemented inwhich someone inspected the process as it occurredto determine if any actions were resulting in sub-standard quality of the ®nished products. Minoradjustments were made in the process that resultedin dramatically reduced product failures. The au-thors called this phase `Prevention'. More per-sonnel were initially required in this phase becauseinspections of the ®nished products continued.However, as solutions occurred, they were able tominimize ®nal product inspections and create timeto move on to the next phase. In this phase, whichthe authors called `Root Cause', the company be-gan to analyze their problems, determine the un-derlying causes and change the manufacturingprocess to improve the overall quality of their
164 T.L. Motschman, S.B. Moore / Transfusion Science 21 (1999) 163±178

output, the paper products. The methods used inthis phase were so successful that the employeeshad time to move on to the ®nal phase, which theauthors called `Anticipation'. In this phase em-ployees used their time to think about possibleproblems, develop ways to make their productsless costly, and develop innovative ways for thecompany to make new products and more pro®ts.
3. Regulations and accreditation requirements
The importance of identifying and investigatingproblems is well-established and, in some in-stances, required. In the United States there arerequirements that each blood establishment have amechanism in place for reporting and investigatingerrors and accidents [4,5]. The Food and DrugAdministration (FDA) has further expanded theirexpectations regarding this requirement in aguidance document [6] as follows. Procedures forreview, evaluation, investigation, and correctionof manufacturing errors and accidents need to bein place and exactly followed. For licensed facili-ties only, events that may a�ect product safety,purity, identity, or quality must be reported to theFDA in a timely manner. Although the speci®cdetails have not been ®nalized, the FDA hasproposed to expand this requirement to all regis-tered, unlicensed facilities [7]. Complaints re-garding product quality must be investigated.Procedures must be in place to assure that patientor donor adverse reactions are thoroughly inves-tigated and documented. Fatalities regardingproduct collection or transfusion must be reportedto the FDA [8]. The Health Care Financing Ad-ministration requires a laboratory to performpro®ciency testing for each of its analytes and thatthe samples be tested in the same manner as pa-tient specimens [9]. The Joint Commission onAccreditation of Healthcare Organizations re-quires that performance expectations be estab-lished and measured [10]. ISO 9001 Standardsrequire facilities to perform internal quality audits[11]. The American Association of Blood Banksrequires facilities to perform internal assessmentsof the operations and quality system [12].
4. Identifying problems
The primary mechanisms used to identifyproblems in transfusion medicine are: reportingevents, measuring process indicators, and per-forming process assessments. Errors, incidents,and accidents, adverse reactions, and customercomplaints are examples of events that should bereported. Errors, incidents, and accidents can leadto adverse consequences in the manufacturing ofproducts or delivery of services. They have thepotential to adversely a�ect the safety, purity,potency, or e�cacy of blood products or patient ordonor safety. An adverse reaction can be life-threatening and result from such events. Customercomplaints could relate to an error or accident inmanufacturing. Several reports establish the im-portance of reporting events where the conse-quences are not quite so obvious [13±17]. These`near-miss' or `upstream' events can provide awealth of information long before the event withthe adverse consequences takes place. Mechanismsto improve detection and reporting of events havebeen described and include such mechanisms asintentionally planting simulated errors into thesystem and practicing detection as part of em-ployee competence assessment [15,16,18,19]. In theairline industry the prompt reporting and evalua-tion of `near-miss' situations is strongly encour-aged, not only by the industry itself, but by theirfederal regulatory body the Federal Aviation Au-thority (FAA). This latter body backs up its en-couragement by having in place a `no fault'reporting system which applauds rather thancondemns the reporting of such `near-misses', evenif the reporting person was at fault in the original`near-miss' situation. Reporting events is a passiveapproach to identifying problems. It can be turnedinto a more proactive one, however, if `upstream'events are reported and we employ a mechanism toanalyze them.
5. Event classi®cation
A method that can be used to glean furtherinformation about reported events is to classifythem and look for trends. By enumerating all the
T.L. Motschman, S.B. Moore / Transfusion Science 21 (1999) 163±178 165

events within a certain classi®cation, one can get asense of the most frequently occurring problemswithin a facility. Those occurring most frequentlycan then be targeted for corrective/preventive ac-tion. The most e�ective methods of classi®cationinvolve use of multiple categories so patterns,previously not obvious, can emerge. For example,if the following event were reported, a unit ofgranulocytes from a directed donor was issued toan incorrect patient, it could be classi®ed in at leastthe following ways: (1) type of event ± patient (asopposed to product, test, or donor); (2) process inwhich the event occurred ± product issue; (3)product involved ± granulocytes; (4) other char-acteristics ± directed donation. Over a time periodone can look at the number of patient events, thenumber of product issue events, the number ofevents involving granulocytes, and the number ofevents involving directed donations. We may thenbe able to sort through reams of data to note thatthe majority of product issue events involve unitsfrom directed donations.
A classi®cation mechanism used at the authorsÕfacility was described by Taswell [20] and Son-nenberg [21]. In this method an error is classi®edby the speci®c procedure involved, as well as oneof the following functions: performance, tran-scription, identi®cation, interpretation, or storage/retrieval. Using this method of classi®cation, theexample event would be classi®ed as an identi®-cation error occurring in the product issue proce-dure. After determining the total number of suchevents, the total number of such procedures, andthe total number of functional steps within theprocedure, one can calculate procedural error ratesand functional error rates within a procedure. Bygrouping procedures together, it is also possible todetermine which functional classi®cation occursmost frequently in the facility. One can also readilymeasure events in such a fashion that trends can beevaluated from multiple di�erent perspectives.
We further re®ned this method in the followingways: (1) expanded the classi®cation from errors toevents, (2) performed classi®cation by process andsystem rather than merely by procedure, and (3)introduced a conversion factor to normalize thedata [15,16]. With this re®ned method, our exam-ple event would be classi®ed as an event within the
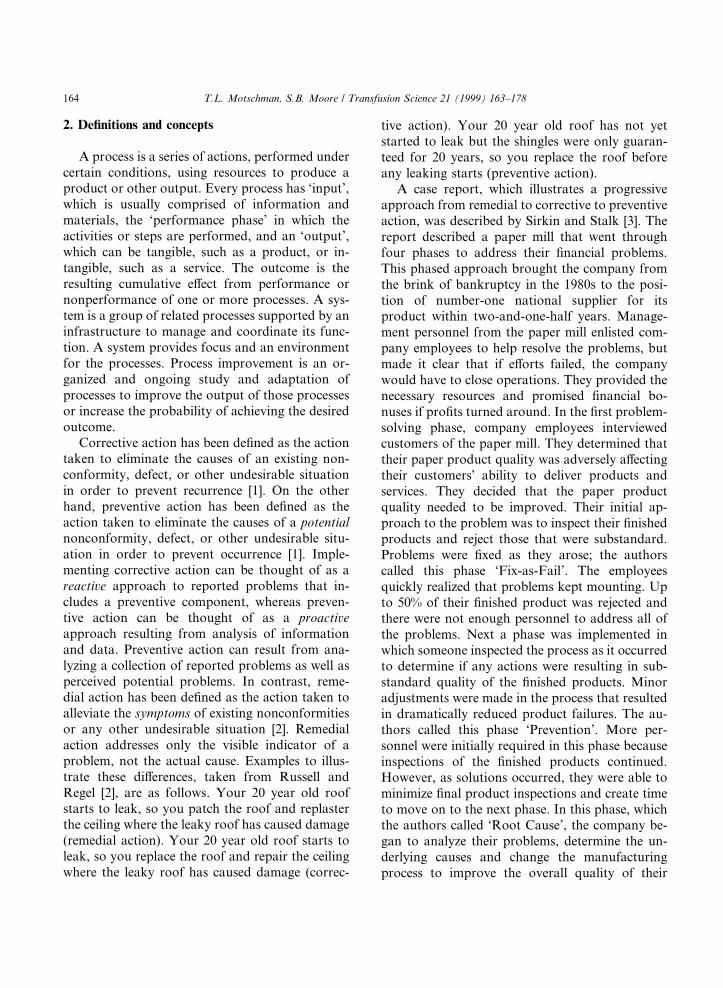
product issue process and the product adminis-tration system. Our current classi®cation schemefor processes and systems was based upon theAmerican Association of Blood Banks QualityProgram [22] and is shown in Table 1. An exampleof the enumeration of these events is illustrated inFig. 1. As rates improved, the scales of measure-ment became so small that it became easy tooverlook or fail to recognize, for example, that arate which changed from 0.0004% to 0.0002% wasactually a 50% improvement. Because of this rec-ognition factor and to avoid working with suchsmall numbers, we began converting percents into`events per 10 000'. (In many manufacturing in-dustries, world class quality is measured as defectsper million. Clearly the blood industry has a wayto go to reach that level!) The 10 000 denominatorcan represent either a process or a system. Usingour example event, the rate could be representedby either product issue events per 10 000 issueprocesses or by product issue events per 10 000product administrations. Use of a system denom-inator, rather than a process denominator, hasallowed us to compare process events within asystem and to determine which occur the mostfrequently. It saves time because only the numbersfor system denominators need to be collected, notthose for each process. Since the systems are verystable, compared to the steps within a process andeven the processes themselves, it also allows us towatch our processes over extended periods of time.
Kaplan has proposed yet another classi®cationmechanism in which each event is thoroughly in-vestigated and the root cause determined [17]. Heuses a modi®ed version (medical) of the EindhovenClassi®cation Model adapted for TransfusionMedicine [23]. In this classi®cation method eachevent is investigated to determine its antecedentevents and root causes for each. To counteract biasfor starting and stopping root cause analysis at thelevel of the end-user, and leaving the systemquestions unanswered, root causes in this methodare considered in the prede®ned order of technical,organizational, and human. Technical causes in-clude physical items and their design, construction,and defects as well as external technical failuresbeyond the control of the investigating organiza-tion. Organizational causes include protocols and
166 T.L. Motschman, S.B. Moore / Transfusion Science 21 (1999) 163±178

Table 1
System and related processes Also include with this system if applicable
Quality management system
Environmental conditions Physical location of event
Documents & data management Work unit(s) involved
Personnel quali®cation, training, &
competence
Associated operational process(es)
Type of event
Critical materials & services Testing event
Quali®cation & control Patient event
Equipment selection, quali®cation, Donor event
operation, & maintenance Product event
Process control & improvement Employee event
Customer complaint
Collection system
Registration and identi®cation Type of event
Evaluation for collection Patient event
Donor deferral Donor event
Collection Type of collection
Lookback and re-entry Whole blood collection
Apheresis collection
Therapeutic collection
Intraoperative salvage
Autologous collection
Directed collection
Processing system
Product processing Speci®c process performed (ex. pooling, irradiating, thawing, etc)
Labeling Product involved
Relabeling Product name
Batch release Autologous
Directed
Testing system
Sample collection Physical location of event
Test performance Type of testing
Recording and reporting results Patient
Donor
Product
Speci®c test performed (ex. ABO/Rh, HBsAg, CD34, Histocompatibility, etc.)
Inventory control system
Product import Product involved
Product storage Product name
Distribution of product Autologous
Product transport Directed
Returning product to inventory
Control of non-conforming product
Final disposition
Product administration systemProduct ordering Product involved
Order processing Product name
Product issue Autologous
Product administration Directed
Patient reactions/other follow-up Special transfusion requirements (ex CMV neg., irradiated, antigen neg. blood,
etc.) All in this Category are Patient Events
T.L. Motschman, S.B. Moore / Transfusion Science 21 (1999) 163±178 167
procedures, transfer of knowledge, managementpriorities, and culture as well as those issues be-yond the control of the investigating organization.Human causes include knowledge-based behav-iors, rule-based behaviors such as quali®cations,coordination, veri®cation, intervention, and mon-itoring, and skill-based behaviors, as well as thosehuman behaviors external to the organization.Causes that do not ®t into these categories areclassi®ed as `other' or `unclassi®able'. After allroot causes are identi®ed, they are tallied and usedas an indicator for where preventive actions couldbe directed. These root causes can also be talliedfor all events occurring within a facility or subdi-vided by the speci®c processes in which they occur.This method has been used successfully in theUnited States at four facilities (two donor centersand two transfusion services). Results reported byKaplan indicate a remarkable similarity betweenthe distribution of root causes in transfusionmedicine and the petrochemical industry, which
®rst used this classi®cation model. He proposedthat this causal classi®cation system represents apotential standardized method for classi®cation oferrors in transfusion medicine.
Regardless of the method used for classi®cationof events, these concepts can be applied to anytype of triggering events. The goal is to identifythose events occurring most frequently and targetthem for corrective/preventive action.
6. Process indicators
A proactive approach to problem identi®cationcan be done through the measurement of speci®cprocess indicators. A process indicator is a speci®cperformance measurement designed to monitorthe stability of an existing process. Such indicatorscan be process-based or outcome-based. Process-based indicators measure the degree to which aprocess can be consistently performed. An exam-
Fig. 1. Example of a Pareto chart.
168 T.L. Motschman, S.B. Moore / Transfusion Science 21 (1999) 163±178
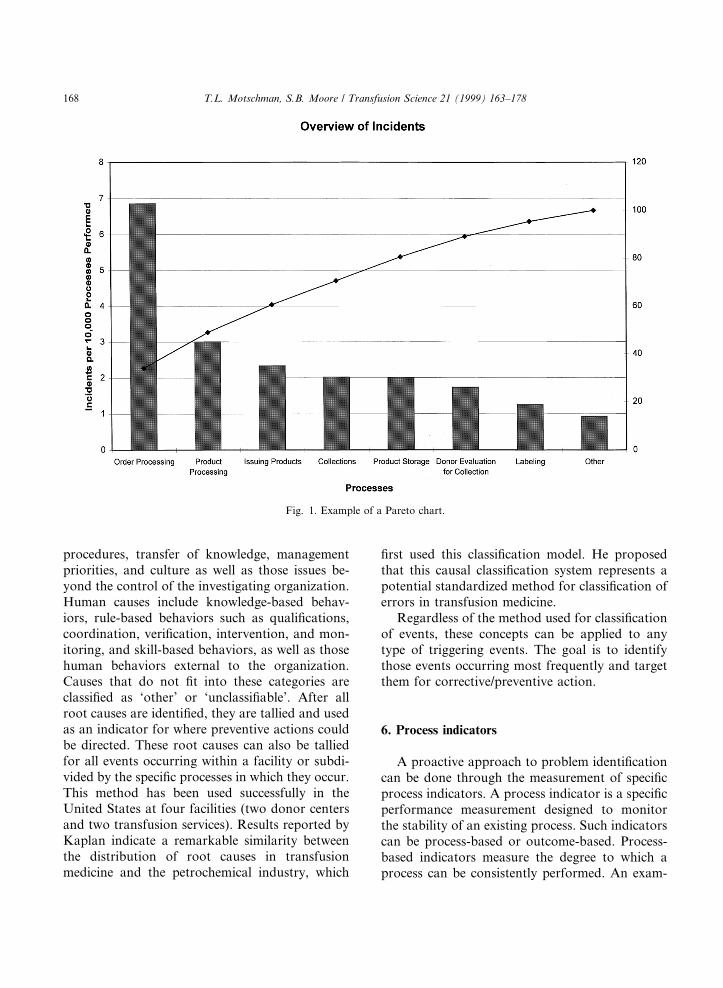
ple of a process-based indicator is a measurementof the turnaround time from blood product or-dering until transfusion. The most frequently usedindicators are outcome-based. These indicatorsmeasure what does or does not happen after aprocess is performed or not performed. An ex-ample of an outcome-based indicator is countingthe number of failed processes, such as the incor-rect reporting of test results. Another type ofoutcome-based indicator is pro®ciency testing.Pro®ciency testing is a method used to evaluate alaboratoryÕs methods, materials, equipment, andpersonnel skills. It is an indirect method of eval-uating a process because it only looks at the out-put of the process, not the process itself. For eachindicator, thresholds are set that represent warninglimits and/or action limits. These can be internallydesigned, benchmarked, or driven by regulatory/accreditation requirements. Frequently these typesof indicators are presented in a control chart for-mat, which is a time-ordered pictorial representa-tion of normal process variation (see Fig. 2). In acontrol chart, upper and lower limits are setmathematically from the data. One expects to seedata points above and below the central line,
which is the mean of the data. However, 7 or moreconsecutive points on the same side of the mean ora single point more than 3 standard deviationsfrom the mean, usually indicate something of sig-ni®cance that should be investigated. Additionalstatistical rules indicate that a process is not `incontrol' (predictable) when at least two of threeconsecutive points fall on the same side of themean and are more than 2 standards deviationsfrom the mean and when at least four of ®veconsecutive points fall on the same side of themean and are more than 1 standard deviationfrom the mean. It is important to note that a badprocess can be `in control'. In this instance we are`doing things right', but not necessarily the `rightthings'.
7. Process assessments
Performance of internal and external audits,inspections, and assessments is another proactiveapproach to problem identi®cation. During thesetypes of assessments, examinations are made todetermine if processes comply with requirements,
Fig. 2. Example of a control chart.
T.L. Motschman, S.B. Moore / Transfusion Science 21 (1999) 163±178 169

are e�ectively implemented, and are suitable tomeet de®ned objectives. Depending upon theirfocus, they can monitor only the output, both theprocess and the output, or can monitor relatedprocesses and their outputs, i.e. the system. In anoutput-focused assessment, usually called a prod-uct audit, the assessor looks at the ®nal productand determines whether it conforms to productspeci®cations, performance standards, and cus-tomer requirements. In other words, the ®nalproductÕs ®tness for use for its intended purpose isevaluated. In a process assessment, an evaluationof a speci®c process is made to determine its ef-fectiveness and the appropriateness of its output.The associated records and written procedures areexamined, as well as the process itself. A systemassessment evaluates the elements of a system todetermine that they are appropriate and have beendeveloped, documented, and e�ectively imple-mented in accordance to organizational policiesand other speci®ed requirements. It includes manyprocess and product assessments. During each ofthese types of examinations, assessors gather in-formation in an objective manner, then use thatdata to draw conclusions. Multiple examples
illustrating failure to meet a speci®c requirementare usually necessary for the assessor to concludethat there is a nonconformance to that require-ment. The assessor draws conclusions aboutoverall e�ectiveness of the facility processes andsystems by grouping many of these failures to-gether.
8. Process monitor summary
Fig. 3 illustrates the authorsÕ perception of howthese di�erent process monitors ®t together. Eachindicator represented in the ®gure monitors dif-ferent aspects of the process. Adverse reactions,customer complaints and the results of pro®ciencytesting are all indicators of process outcomes. Er-rors, incidents, accidents, and upstream eventsoccur during the process, so are indicators of theprocess itself. Speci®c indicators put in place canbe process-based or outcome-based. Outcome-based indicators monitor process output whereasprocess-based indicators monitor the process itself.Internal audits or assessments and external audits,inspections, or assessments can monitor di�erent
Fig. 3. Author's perception of di�erent process monitors and their relationship to the processes.
170 T.L. Motschman, S.B. Moore / Transfusion Science 21 (1999) 163±178
aspects of a process depending on their focus.They can monitor only the output, both the pro-cess and the output, or can monitor related pro-cesses and their outputs, the system. All of theseprocess monitors have their value.
Selection of which monitors to use is a veryimportant decision. The monitors selected shouldbe representative of the processes performed bythe facility, consistent with organizational goals,and re¯ect the needs of the customer. If inadequatemonitors are selected, measurements may indicatethat everything is Ôin controlÕ, when in fact, it isnot. However, the problem may not be in the datathat you have, but in the data that you do nothave. For instance, you measure the time it takesyou to deliver blood products from receipt of theorder until the ®rst product is issued for transfu-sion and ®nd that you meet your stated goal of 1 h95% of the time. However, several important as-pects are missing from this measurement. Yourcustomer, the physician, measures good service intotal turnaround time, that is, from his/her writingof the product order until the transfusion of theproduct. The time it takes for the order to reachthe laboratory and perhaps collect a patient bloodsample, as well as the time from issue of theproduct until transfusion, are missing from thismeasurement. Although these aspects may be outof the control of the laboratory, the customer seesthem as part of the process. Furthermore, thecustomer may not agree that 1 h is a reasonableturnaround time, even if you meet it 100% of thetime. You may ®nd that the measurements you donot have are the key to your process improve-ments. In general, an organization with a well-es-tablished process improvement program will selectmonitors that re¯ect all aspects of their processesand the full spectrum of passive and proactivemonitors. They recognize the need for balancebetween product or outcome and process mea-surements. Organizations that are relatively new tothe concept have a tendency to use only passivemonitors or select only outcome-based indicators.The following are dimensions that can be useful inmeasuring processes in the healthcare industry:appropriateness, availability, continuity, e�ective-ness, e�cacy, e�ciency, respect and caring, safety,and timeliness [24].
9. Determining a course of action
Once a problem has been identi®ed, there areseveral options: do nothing, implement remedialaction, or investigate the problem to determineroot cause with the intent of implementing cor-rective action. The decision is a�ected by: know-ledge of the problem, the processes and thesystems involved; risks (harm or potential harm toa patient, donor, or the business) and bene®ts;likelihood that such a problem (or similar prob-lem) could recur; available resources; and organi-zational goals. In general, the closer an event is tothe process outcome, the more obvious the con-sequences. The more obvious the negative a�ectsupon the organization or individual and thegreater the likelihood of recurrence, the morelikely we are to investigate a single event. Unfor-tunately, when the negative a�ects are not so ob-vious, we typically do nothing or only implementremedial action. Investigation of root cause andimplementation of corrective action usually waituntil the same events recur or a combination ofdi�erent events result in serious consequences.
The choice to do nothing is typically madewhen: the perceived risk is extremely small, there isno perceived bene®t in taking action, the decision-maker does not have enough knowledge about therami®cations or root cause of the problem, orproblem correction does not ®t in with organiza-tional goals. It is important to recognize that thewisest course of action following problem identi-®cation is not always to take action, because im-plementing a change may actually adversely a�ectthe process. In his seminars Edwards Demingpopularized an example to illustrate this point. Inhis example, beads are dropped one by onethrough a funnel, which has an adjustable posi-tion, pass through some resistance in the form ofseveral rows of alternately but evenly spaced pegs,then land in collection cylinders. If a large numberof beads are dropped through a stationary posi-tioned funnel, the collection cylinders will have aGaussian distribution of the beads (equal numbersof beads on either side of the centrally placedcylinder). In order to minimize variation (e.g. morebeads drop closer to the targeted middle cylinder),the position of the funnel is adjusted based upon
T.L. Motschman, S.B. Moore / Transfusion Science 21 (1999) 163±178 171
knowledge gained from the landing position of theprevious bead. Several di�erent funnel positionscan be used to improve upon the bead distribution.The position of the funnel can be adjusted inwhatever manner deemed appropriate wheneverthe beads fall into the extreme outlying cylinders.The funnel position can be adjusted relative to thetarget; for example, if a bead lands in a cylindertwo spaces to the right of the target cylinder, thefunnel position for the next bead can be adjustedtwo spaces left to compensate. A third way inwhich the funnel position can be adjusted is toalign the funnel directly over the landing positionof the previous bead. Results of this experimentgive the following patterns. If the funnel position ismoved whenever a bead lands in one of the out-lying cylinders, there is at least 40% more variationin the bead distribution than if no adjustments infunnel position were made. If the funnel position ismoved relative to the target, the beads will movefurther away from the target in alternating direc-tions. If the funnel position is moved to align di-rectly over the cylinder where the previous beadlanded, the beads will move further away from thetarget in one direction or another. The point ofthis exercise is to demonstrate that, unless onefully understands the entire process involved, it isbetter to do nothing than to tamper with it.
The choice to implement remedial action istypically made when: the organization is in a `Fix-as-Fail' problem-solving mode; the perceived riskis small; the decision-maker lacks knowledge andauthority regarding the problem, the process andthe system; there are insu�cient resources to per-form the necessary investigation for root cause;there is a need to implement an interim steppending root cause analysis and corrective actionimplementation; or corrective action is too costlyor ®ts minimally with organizational goals. If weare in the `Fix-as-Fail' mode of problem solving,we address each problem as it presents, then stop.This is the mode we are in when most of ourdocumented `corrective action' (which is actuallyremedial) is to review the correct procedure withthe personnel who perform it. There is no evalu-ation of the frequency of such problems. Neither isthere a determination of how or why such an eventtook place. We just ®x the obvious symptom and
move on to our next activity. Examples of suchproblem solving are: after receiving a citation forfailure to perform our annual procedure manualreview, we perform and document the review; afterissuing an incorrect product for a patient, we re-place it with the correct product; after mislabelinga product with the incorrect ABO/Rh type, werelabel the product with the correct label; afterreceiving an unsatisfactory result on a pro®ciencytest, we have our employee retest the specimen andthe correct answer is obtained; when our customercomplains that the cookies in the donor center arestale, we throw the cookies away and replace themwith fresh cookies; when a donor subsequentlyinforms us of information that we should haveelicited at a previous donation, we defer the donorand retrieve products from the previous donations.Obviously, there is nothing intrinsically wrongwith these actions; they are appropriate to take.However, in each one of these examples we onlyperformed remedial action. There is an opportu-nity to look closer at our processes to determinehow and why these events took place and imple-ment action to prevent recurrence. Realistically,because of limited resources, we cannot look intoevery single event that presents itself, but at thevery least, there should be a mechanism in place torecord that these events occurred so they can betracked over time. If they recur frequently, it maybe time to address the issue. On the other hand, ifthere is a serious clinical adverse outcome or `near-miss', such as transfusion to the patient of theincorrect product, we may want to investigate theindividual event promptly.
Problem investigation for root cause is typicallyundertaken when the decision-maker is knowl-edgeable about the process and the system, therami®cations of failing to act are serious, andresolution of the problem ®ts with organizationalgoals.
10. Identifying the causes
E�ective corrective action cannot be imple-mented until one evaluates a process in relation-ship to its related processes and de®nes theunderlying cause(s) of the problem. This is called
172 T.L. Motschman, S.B. Moore / Transfusion Science 21 (1999) 163±178

`systems thinking'. Russell and Regel [2] use awonderful example to illustrate looking beyondthe symptoms and tracing the problem back to thepoint of origin by using this thinking process.Their example goes like this:
After rearranging your furniture you notethat the lamp next to your favorite chairwonÕt light. You check the lamp cord, theplug and the bulb. The bulb is blown, soyou conclude that the bulb was blown byrough treatment during your furniture rear-rangement. You change the bulb and the lightgoes on. A short time later the lamp is notworking again, so you change the bulb again,only to repeat the process within a few days.This time you conclude that there is some-thing wrong with the lamp. You check thelight socket and its wiring connections and®nd a screw holding a wire that is a little bitloose. You conclude that this is more evidenceof rough treatment during the move, so youtighten the screw and change the bulb again.When the bulb burns out the fourth timeyou decide to call upon your neighbor whois an electrician. The electrician recognizesthat a lamp is part of a larger system and eval-uates the problem from the perspective of theentire electrical system. He begins to ask ques-tions like: have there been problems with oth-er appliances? Is there a pattern in the lengthof time the bulbs last before burning out? Areall the bulbs from the same lot? What otherelectrical devices are in the same room? Howold is the house? And who was the electricalcontractor? The electrician looks at the elec-trical panel and examines the circuits and re-ceptacles. Ultimately he identi®es thatmodi®cations have been made to the houseÕselectrical system that included wire substitu-tions, which are not recommended for homewiring systems. The movement of your lampwas the precipitating event that caused theelectrical circuit to malfunction.
The electrician is using systems thinking to re-solve the problem. He determined that the burnedout bulbs were only symptoms of a larger problem.
11. Root cause analysis
Root cause analysis is an approach used toidentify the underlying reason for an undesirablecondition or problem. It can be done by an indi-vidual or group. The more complex the problemand involved the process, the greater the need toenlist a team of individuals and formalize theanalysis. The team should include people who:perform the steps of the process, oversee the pro-cess, are knowledgeable about the process but arenot directly involved in its performance or over-sight, and are knowledgeable about process im-provement activities and tools. Because it ishuman nature to typically seek the method in-volving least e�ort [25], root cause analysis is,unfortunately, often performed in a subjectivemanner that relies upon the aim of the analysis:whether the analyst is trying to explain events,allocate responsibility and blame, or identify pos-sible system improvements. Plausible explanationscan be taken for granted and only the most obvi-ously unusual ®ndings are considered important.Thus, the analysis is often terminated when anexplanation is found that ®ts with the analystsÕpreconceived ideas.
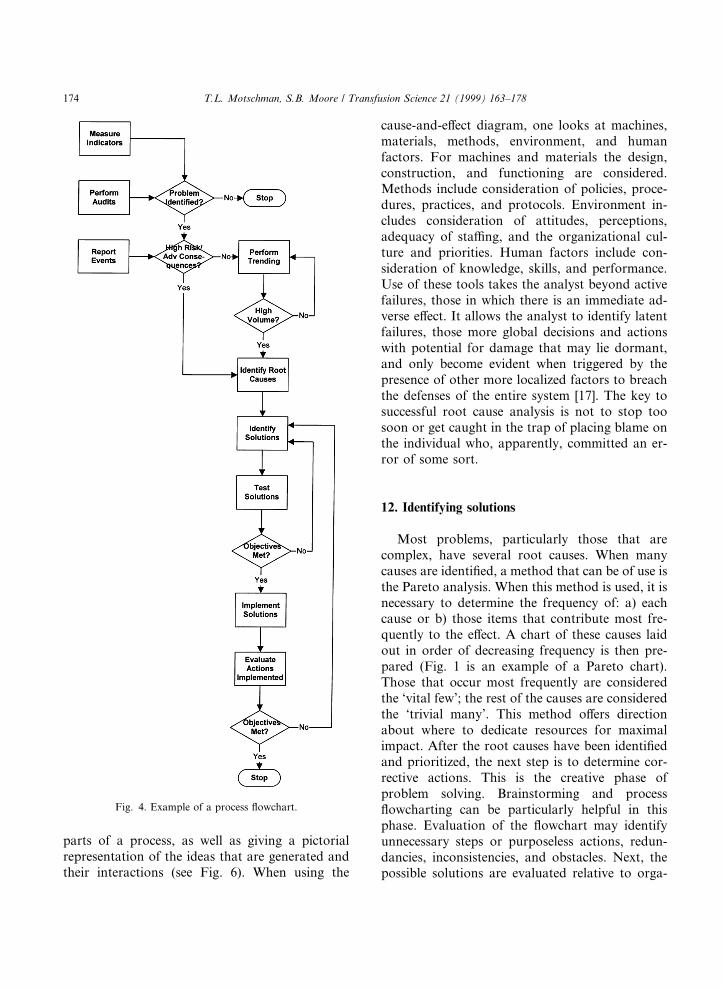
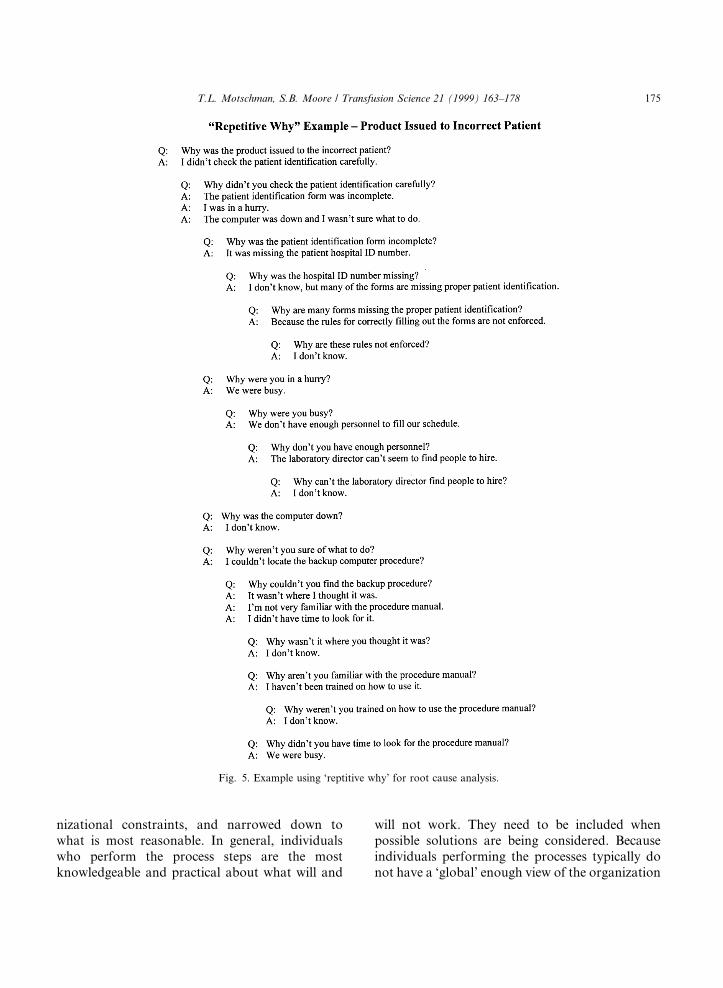
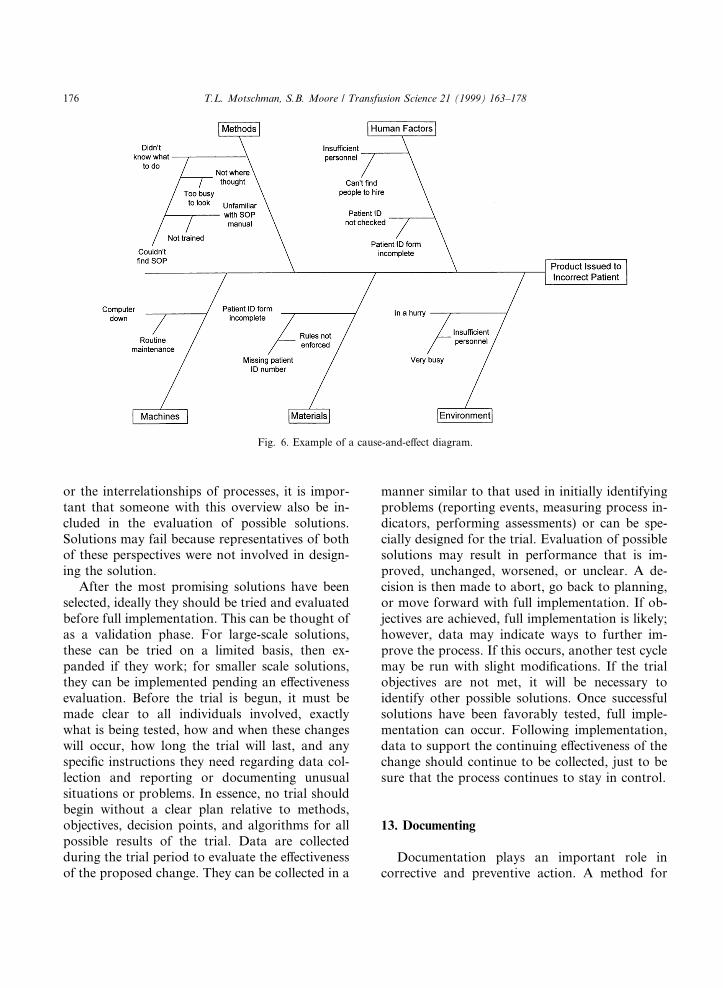
The three most commonly used tools for iden-tifying underlying causes in an objective mannerare process ¯owcharting, use of the `repetitivewhy', and the cause-and-e�ect diagram. A process¯owchart gives a detailed picture of the multiplesteps and the important decision points within thatprocess (see Fig. 4). By examining this picture onecan begin to identify areas that are problem prone.When the `repetitive why' is used, one worksbackwards through the process and asks thequestion why? repeatedly until: no new informa-tion can be gleaned, the causal path cannot befollowed because of missing information, or fur-ther investigation is impractical, impossible, oroutside the boundaries of the organization (seeFig. 5). Use of the `repetitive why' avoids themistake of interpreting an e�ect as a cause. Thecause-and-e�ect diagram, also known as the Is-hikawa or ®sh-bone diagram, employs a special-ized form of brainstorming that breaks downproblems into `bite-size' pieces. It is a methoddesigned to focus ideas around the component
T.L. Motschman, S.B. Moore / Transfusion Science 21 (1999) 163±178 173
parts of a process, as well as giving a pictorialrepresentation of the ideas that are generated andtheir interactions (see Fig. 6). When using the
cause-and-e�ect diagram, one looks at machines,materials, methods, environment, and humanfactors. For machines and materials the design,construction, and functioning are considered.Methods include consideration of policies, proce-dures, practices, and protocols. Environment in-cludes consideration of attitudes, perceptions,adequacy of sta�ng, and the organizational cul-ture and priorities. Human factors include con-sideration of knowledge, skills, and performance.Use of these tools takes the analyst beyond activefailures, those in which there is an immediate ad-verse e�ect. It allows the analyst to identify latentfailures, those more global decisions and actionswith potential for damage that may lie dormant,and only become evident when triggered by thepresence of other more localized factors to breachthe defenses of the entire system [17]. The key tosuccessful root cause analysis is not to stop toosoon or get caught in the trap of placing blame onthe individual who, apparently, committed an er-ror of some sort.
12. Identifying solutions
Most problems, particularly those that arecomplex, have several root causes. When manycauses are identi®ed, a method that can be of use isthe Pareto analysis. When this method is used, it isnecessary to determine the frequency of: a) eachcause or b) those items that contribute most fre-quently to the e�ect. A chart of these causes laidout in order of decreasing frequency is then pre-pared (Fig. 1 is an example of a Pareto chart).Those that occur most frequently are consideredthe `vital few'; the rest of the causes are consideredthe `trivial many'. This method o�ers directionabout where to dedicate resources for maximalimpact. After the root causes have been identi®edand prioritized, the next step is to determine cor-rective actions. This is the creative phase ofproblem solving. Brainstorming and process¯owcharting can be particularly helpful in thisphase. Evaluation of the ¯owchart may identifyunnecessary steps or purposeless actions, redun-dancies, inconsistencies, and obstacles. Next, thepossible solutions are evaluated relative to orga-
Fig. 4. Example of a process ¯owchart.
174 T.L. Motschman, S.B. Moore / Transfusion Science 21 (1999) 163±178
nizational constraints, and narrowed down towhat is most reasonable. In general, individualswho perform the process steps are the mostknowledgeable and practical about what will and
will not work. They need to be included whenpossible solutions are being considered. Becauseindividuals performing the processes typically donot have a `global' enough view of the organization
Fig. 5. Example using `reptitive why' for root cause analysis.
T.L. Motschman, S.B. Moore / Transfusion Science 21 (1999) 163±178 175
or the interrelationships of processes, it is impor-tant that someone with this overview also be in-cluded in the evaluation of possible solutions.Solutions may fail because representatives of bothof these perspectives were not involved in design-ing the solution.
After the most promising solutions have beenselected, ideally they should be tried and evaluatedbefore full implementation. This can be thought ofas a validation phase. For large-scale solutions,these can be tried on a limited basis, then ex-panded if they work; for smaller scale solutions,they can be implemented pending an e�ectivenessevaluation. Before the trial is begun, it must bemade clear to all individuals involved, exactlywhat is being tested, how and when these changeswill occur, how long the trial will last, and anyspeci®c instructions they need regarding data col-lection and reporting or documenting unusualsituations or problems. In essence, no trial shouldbegin without a clear plan relative to methods,objectives, decision points, and algorithms for allpossible results of the trial. Data are collectedduring the trial period to evaluate the e�ectivenessof the proposed change. They can be collected in a
manner similar to that used in initially identifyingproblems (reporting events, measuring process in-dicators, performing assessments) or can be spe-cially designed for the trial. Evaluation of possiblesolutions may result in performance that is im-proved, unchanged, worsened, or unclear. A de-cision is then made to abort, go back to planning,or move forward with full implementation. If ob-jectives are achieved, full implementation is likely;however, data may indicate ways to further im-prove the process. If this occurs, another test cyclemay be run with slight modi®cations. If the trialobjectives are not met, it will be necessary toidentify other possible solutions. Once successfulsolutions have been favorably tested, full imple-mentation can occur. Following implementation,data to support the continuing e�ectiveness of thechange should continue to be collected, just to besure that the process continues to stay in control.
13. Documenting
Documentation plays an important role incorrective and preventive action. A method for
Fig. 6. Example of a cause-and-e�ect diagram.
176 T.L. Motschman, S.B. Moore / Transfusion Science 21 (1999) 163±178
documentation that the authors have found par-ticularly helpful is the use of a Process Improve-ment Form. This form is used to document follow-up on any identi®ed problem for which it has beendecided to initiate a corrective/preventive action.These problems can include individually reportedevents such as errors, incidents, accidents, andcustomer complaints, collections of events whichhave been trended and show a signi®cant pattern,process measurements indicating out-of-controlresults, internal audit ®ndings, and external in-spection citations. Each problem is assigned to aresponsible individual. The quality managementteam issues the form containing a tracking num-ber, its point of origin, and a description of theproblem to be addressed, to that individual. It isthis assigned personÕs responsibility to ensure thatthe problem is satisfactorily addressed. When thecorrective/preventive action has been fully imple-mented, the responsible individual completes theform with the stated action, date of completion,and their signature, and returns the form to thequality management personnel. The assignee andquality management then jointly decide on post-implementation follow-up. The description of thefollow-up action to be taken is added to the form,which is then routed to the individual responsiblefor that follow-up action. This is frequently thequality management team, but can be the originalassignee or another designated individual. Whenthe follow-up evaluation is performed, usuallymany months later, results are documented on theform. It is signed and dated by the individualcompleting the follow-up and the form routed toquality management personnel. If the follow-upevaluation indicates successful correction of theproblem, the process improvement initiative isconsidered complete. Further evaluation of e�ec-tiveness then becomes part of routine processmonitoring. If the follow-up indicates correctiveaction was unsuccessful, a new process improve-ment form is generated and the cycle repeated.Prior to implementation of this form, some cor-rective actions that we thought had been fullytested and implemented had actually only beenpartially addressed. It was not always clear whohad been assigned responsibility. Sometimes as-signments were forgotten, or actions had been ta-
ken, but documentation was incomplete or di�cultto locate. We have found this method to be par-ticularly useful for citations received from externalinspection/accreditation agencies. Because of therequired response period, there is usually insu�-cient time to analyze a problem for root cause andto implement appropriate corrective action. Inresponses to citations, one usually has to indicatewhat actions are planned rather than actually im-plemented. The use of this form provides us with aconvenient format for documenting the details ofthe plan, tracking the improvement initiative,which may take many months to complete, andproving that it was e�ectively implemented.
14. Summary
Opportunities to improve processes withintransfusion medicine can present themselves in avariety of ways. Error, incident, and accident re-ports, adverse reactions, and customer complaintsare events that should be reported, investigated ifadverse consequences result, and evaluated forevidence of trends to identify process problems.Speci®c process indicators, as well as internal andexternal process assessments, are other methodsthat can be used to identify problems. Once iden-ti®ed, a decision must be made whether or not toaddress the problem. Care should be taken in thisdecision so that one does not tamper with pro-cesses that are just showing normal variation. Useof `systems thinking' is required to analyze theprocess and determine the root cause of theproblem. Remedial action is that taken to addressthe symptom of the problem. Corrective action isthat taken to correct the problem and prevent itfrom recurring. Preventive action is that taken toprevent occurrence of a potential problem. Po-tential solutions should be tested before being fullyimplemented. Once implemented, follow-up eval-uation should be performed to assure that thechanges remain e�ective. A method to documentand track corrective/preventive action can behelpful. Corrective and preventive action is asubset of the overall organizational process im-provement e�orts. The goal is to correct theproblems so that they stay corrected and to prevent
T.L. Motschman, S.B. Moore / Transfusion Science 21 (1999) 163±178 177
new problems from occurring. Ultimately, thedelivery of better patient care will be the reward.
References
[1] Quality Management and Quality Assurance ± Vocabulary
(ISO 8402). Geneva, Switzerland: International Organiza-
tion for Standardization, 1994.
[2] Russell JP, Regel T. After the quality audit. Milwaukee,
WI: ASQC Quality Press, 1996:5.
[3] Sirkin H, Stalk Jr G. Fix the process, not the problem.
Harvard Business Review 1990;68:26±33.
[4] US Food and Drug Administration: Code of Federal
Regulations, Title 21, Part 606.160 (b) (7) (iii). Washing-
ton, DC: US Government Printing O�ce, 1998.
[5] US Food and Drug Administration: Code of Federal
Regulations, Title 21, Part 211.192. Washington, DC: US
Government Printing O�ce, 1998.
[6] US Center for Biologics Evaluation and Research: Guide-
line for Quality Assurance in Blood Establishments.
Rockville, MD: Congressional and Consumer A�airs
Branch of the Food and Drug Administration, 1995.
[7] US Food and Drug Administration: Biological Products;
Reporting of Errors and Accidents in Manufacturing ±
Proposed Rule. Federal Register 1997; 62:49 642±49 648.
[8] US Food and Drug Administration: Code of Federal
Regulations, Title 21, Part 606.170 (b). Washington, DC:
US Government Printing O�ce, 1998.
[9] US Food and Drug Administration: Code of Federal
Regulations, Title 42, Part 405. Washington, DC: US
Government Printing O�ce, 1998.
[10] Comprehensive accreditation manual for hospitals: the of-
®cial handbook. Oakbrook Terrace, IL: Joint Commission
on Accreditation of Healthcare Organizations, 1999:PI.3.
[11] Quality systems model for quality assurance in design/
development, production, installation and servicing (ISO
9001). Geneva, Switzerland: International Organization
for Standardization, 1994.
[12] Standards committee: standards for blood banks and
transfusion services (19th edn.). Bethesda, MD: American
Association of Blood Banks, 1999:7.
[13] Taswell HF, Sonnenberg CL. Error analysis: types of
errors in the blood bank, In: Smit Sibinga CTh, Das PC,
Taswell HF, editors, Quality assurance in blood banking
and its clinical impact. Boston, MA: Martinus Nijho�,
1984:248.
[14] Gambino R, Mallon P. Near misses ± an untapped data
base to ®nd root causes. Lab Rep 1991;13:41±44.
[15] Motschman TL, Santrach PJ, Moore SB. Error/incident
management and its practical application. In: Duckett JB,
Woods LL, Santrach PJ, editors. Quality in action.
Bethesda, MD: American Association of Blood Banks,
1996:37±67.
[16] Motschman TL, Moore SB. Error detection and reduction
in blood banking. Clin in Lab Med 1996;16:961±73.
[17] Kaplan HS, Battles JB, Van der Schaaf TW, Shea CE,
Mercer SQ. Identi®cation and classi®cation of the causes
of events. Transfusion 1998;38:1071±81.
[18] Taswell HF, Smith AM, Sweatt MA, Pfa� K. Quality
control in the blood bank ± a new approach. Am J Clin
Pathol 1974;62:491±5.
[19] Taswell HF. Error production and its control. In: Myhre
BA, editor. A seminar on performance evaluation. Wash-
ington, DC: American Association of Blood Banks,
1976;15±20.
[20] Taswell HF, Sonnenberg CL. Error analysis: types of
errors in the blood bank. In: Smit Sibinga CTh, Das PC,
Taswell HF, editors. Quality assurance in blood banking
and its clinical impact. Boston, MA: Martinus Nijho�,
1984:227±237.
[21] Sonnenberg CL, Taswell HF. Error analysis: methods of
detection, analysis and control. In: Smit Sibinga C Th, Das
PC, Taswell HF, editors, Quality assurance in blood
banking and its clinical impact. Boston, MA: Martinus
Nijho�, 1984:239±246.
[22] Technical Quality Assurance Committee. Quality pro-
gram, vol. 1 (Quality plan manual) and vol. 2 (Self-
assessment manual). Bethesda, MD: American Associa-
tion of Blood Banks, 1994.
[23] Battles JB, Kaplan HS, Van der Schaaf TW, Shea CE. The
attributes of medical event reporting systems. Arch Pathol
Lab Med 1998;122:132±8.
[24] The measurement mandate. Oakbrook Terrace, IL: Joint
Commission on Accreditation of Healthcare Organiza-
tions, 1993:68±69.
[25] Rasmussen J. Human error and the problem of causality
in analysis of accidents. Phil Tran R Soc Lond 1990;327:
449±62.
178 T.L. Motschman, S.B. Moore / Transfusion Science 21 (1999) 163±178