corporate governance reform and risk-taking: … · corporate governance reform and risk-taking:...
TRANSCRIPT

Corporate Governance Reform and Risk-taking: Evidence from an Emerging market.
Santosh Koirala (Strathclyde Business School) Andrew Marshal l (Strathclyde Business School)
Suman Neupane (Gri f f i th Universi ty)Chandra Thapa* (Strathclyde Business School)

CGR and Risk Taking: Role of SOX
Milton Friedman : “SOX says to every entrepreneur:for God’s sake don’t innovate. Don’t take chancesbecause down will come the hatchet.” (Gerstain,2006)
Alan Greenspan: “Business leaders have been quitecircumspect about embarking on major newinvestment projects” because of SOX (Greenspan,2003).
12/29/2017
2

Motivation: Empirical Front
Negative relation:Higher compliance cost of CGR - increased role of independent directors(higher information costs) and expansion/criminalization of directors’liability (higher risk aversion) discourage risk-taking (Bargeron et al., 2010, JAE;Cohen et al., 2013, CAR).
Evidence around SOX in the US (Developed market context : Relative to EM,stronger IP regime, market forces of corporate scrutiny and already highercompliance cost of existing regulations).
Our QuestionDoes CGR of similar nature and provisions affect risk-taking in an emergingmarket in a similar way as in a developed market?
Relatively weaker IP regime, market-based CG, higher ownership concentrationand lower compliance cost of existing regulation.
As a result, does the benefit of CGR outweigh highercompliance costs in this market?
12/29/2017
3

Motivation: Theoretical Front
Positive prediction: With weaker corporate governance environment dominant
insiders would choose to use corporate resources to pursuetheir own self-interest.
The weaker the Investor Protection (IP) environment, thehigher the expected diversion for private benefits (Shleifer andWolfenzon, 2002, JFE).
Investment choices are more conservative and far below theoptimal choices (John et al., 2008, JF)
CGR should reduce private benefits, encourage topursue value enhancing risky investments.
12/29/2017
4

Motivation: Theoretical Front
Negative Prediction:Managerial Discretion Argument:
Improvement in IP reduces the monitoring by dominant insidersresulting in less prevalence of dominant shareholders. Thisreduction allows greater managerial discretion to pursue less risktaking (Burkart et al., 2003, JF).
Tunneling Distortion Argument:
In a weaker IP regime, a dominant insider (DI) would take morerisks in units where the DI has lower cash flow rights (but highercontrol rights) and tunnel the proceeds to units where the DI’s cashflow rights are higher (but control rights are lower)[Johnson, et al.,2000, AER; John et al., 2008, JF].
Thus, opposing theoretical predictions also motivateour empirical investigation.
12/29/2017
5

Motivation…
CGR in India (Clause-49) Comparable to SOX in the US (nature). Emerging economy (context).
(Black and Khanna, 2007, JELS)
The setting has been used in previous empiricalstudies in law and finance (Dharmapala and Khanna, 2013,JLEO)
12/29/2017
6

CG in India before CGR in 2000
Governance practice: Weak and Dysfunctional
Inconsistent disclosure Ineffective BoDs Pervasive insider diversion Firms relying on internal sources and various arms
of government for capital – rather than stockmarket.
(see Khanna, 2009 and Dharmapala and Khanna, 2013)
12/29/2017
7

CGR in India (Clause-49)
2000: Change in the listing agreement. Board & audit committee independence – made them powerful
and focused monitors of management. CEO/CFO and auditor or company secretary certification. Enhanced disclosure – aiding institutional and other minority
shareholders in monitoring management.
2004: Amendment of Securities ContractsSection 23E imposed financial and criminal penalties againstindividuals and firms for violation of Clause-49 requirements.(up to INR 250 million for a violation and makes insiders personally liablefor non compliance) – This makes the provision similar to SOX.
12/29/2017
8
Survey evidence indicates majority of firms subject to the rules are in complianceafter 2004 (Balasubramanium et al, 2010) .

Time-line of Clause-49 (CGR) in India
12/29/2017
9
Any firm listed before 2000 who did not meet the paid-up capital ornet worth criteria are in Control Group. Rest are in Treatment Group.
Applies to all firms with paid-up capital of at least INR 30 million ornet worth of INR 250 million.

Hypotheses Development1. CGR-Risk Taking
H1: CGR positively affects corporate risk-taking in an(emerging market) environment with weaker market-basedcorporate scrutiny.
Economic Rationale: (John et al., 2008,JF)
CGR creates disutility from private benefits thereby requiring controlling insiders toderive utility from wealth effect through investment in +NPV risky projects.
Risk-taking=U(Investment)=U(Wealth Effect)+U(Private benefits)
In EM, CGR improves IP and corporate scrutiny (Dharmapala and Khanna, 2013 JLEO)
The benefits of alignment of interest between insiders and outsider forvalue should enhance risky investments.
12/29/2017
10
CGR reduces U(P) CGR increases U(W)

2. CGR-Risking Taking-Ownership Concentration
H2: In comparison to their counterparts with lowerconcentrated ownership, firms with higher ownershipconcentration undertake more risk-taking following CGR.
Economic rationale:- Utility from private benefits should is higher for firms with
higher concentrated ownership favoring investmentconservatism (Bertrand et al., 2002, QJE; John et al., 2008, JF; Gul et al.,2010, JFE)
- Following CGR, firms with higher concentrated ownershipshould derive higher U(W) relative to U(P) by undertakingvalue enhancing risky investments.
12/29/2017
11

H3: In comparison to their peers with lower creditors’ stake,firms with higher creditors’ stake undertakes more risk-takingfollowing CGR.
Economic rationale:
Higher creditors’ stake favor investment conservatismbecause of debt-equity agency problem (Morck andNakamura, 1999, JF; Acharya et al., 2011, JFE; Miller and Reisel, 2012, RFS).
CGR reduces this agency problem through highertransparency and independent monitoring ofcorporate decisions.
12/29/2017
12
3. CGR - Risking Taking – Creditors’ Stake

4. CGR - Risk Taking - Valuation
H4: Firms with higher risk-taking are associated tohigher valuation following CGR enforcement.
Economic rationale:
Current evidence: CGR provides high firm valuation(Dharmapala and Khanna, 2013, JLEO; Fauver et al, 2017, JFE).
We suggest risk-taking is an important channel throughwhich CGR supplies value to firm.
Increase in +NPV risky investments following CGR shouldbe reflected in market valuation.
12/29/2017
13

Summarizing contribution
3 Strands of literature CGR and risk-taking (John et al., 2008, JF; Bargeron et al, 2010, JAE; Cohen et al,
2013, CAR)
Positive in a context with higher private benefits and weaker marketforces of corporate scrutiny.
CGR encourages risk-taking of otherwise conservative firmsbecause of Concentrated ownership (Bertrand et al., 2002 QJE, Gul et al., 2010, JFE)
Creditors’ dominance (Morck and Nakamura, JF, 1999; Acharya et al.,2011, JFE)
Value-relevance of risk-taking (Dharmapala and Khanna,2013, JLEO Fauveret al, 2017, JFE)
Risk taking is an important channel through which CGR suppliesvalue to a firm.
12/29/2017
14
Data
Database: Prowess maintained by CMIE.
Data: Annual data of 3839 non-financial listedIndian firms from (1997) 2000-2007.
This database has been used by a number of recentstudies, including Lilienfeld-Toal et al., 2012, Econometrica;Vig , 2013, JF and Gopalan et al., 2016, RFS.
12/29/2017
15

Variables
12/29/2017
16
Variable Description SourceDependent variable: Risk-taking
Earnings-Volatility Three year rolling standard deviation of operatingearnings where operating earnings is EBITDA scaled bytotal assets expressed in percentages.
Derived from CMIE
Capital Expenditure Addition to Long-term Assets as a percentage of last yearlong-term assets
Derived from CMIE
R&D Expenditure R&D Expenditure as a percentage of total assets Derived from CMIE
Control (competing) variables
Size Ln(total asset); CMIE
Leverage Book debt to equity ratio Derived from CMIE
Liquidity Book value of Liquid Assets/Current Liability CMIE
Ownership concentration Shares owned by promoters (insiders) as percentage of total shares outstanding.
CMIE
MB Market-to-book value CMIE
Industry 22 industries. Derived from CMIE

Descriptive Statistics
12/29/2017
17
Pre-CGR (2000-2003) Post-CGR (2004-2007) Overall (2000-2007)

Visual InspectionEarnings-Volatility (demeaned)
12/29/2017
18
-1-.8
-.6-.4
-.20
.2.4
.6.8
1Ea
rning
s Vola
tility (
%)
2000 2001 2002 2003 2004 2005 2006 2007Year
Control Firms Treated Firms

Visual InspectionCapital Expenditure (demeaned)
12/29/2017
19
-2-1
.5-1
-.50
.51
1.52
Capit
al Ex
pend
iture
(%)
2000 2001 2002 2003 2004 2005 2006 2007year
Control Firms Treated Firms
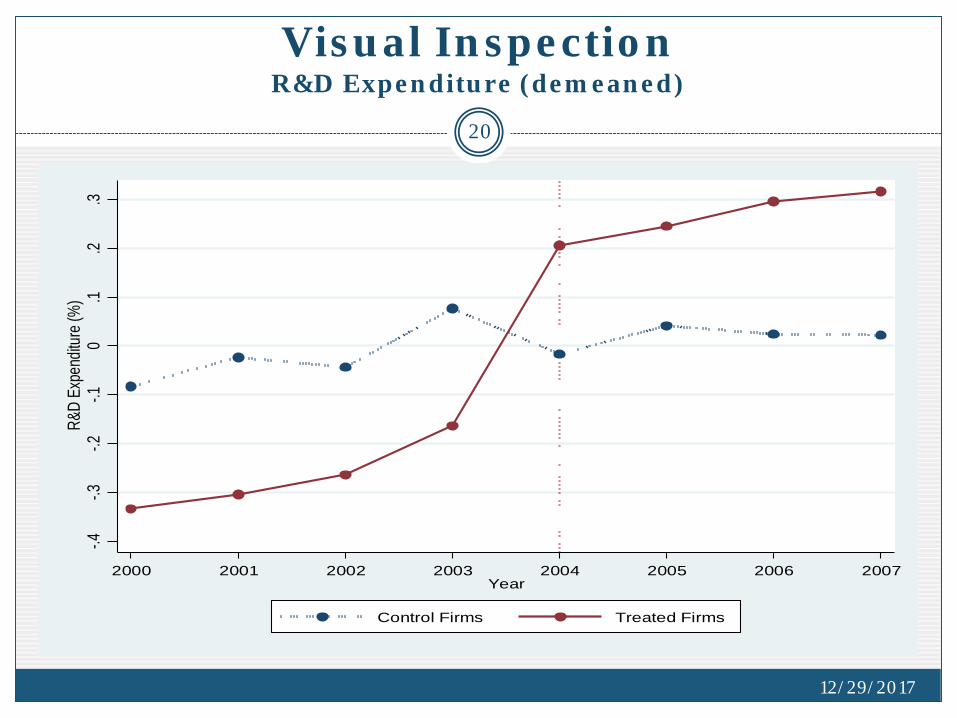
Visual InspectionR&D Expenditure (demeaned)
12/29/2017
20
-.4-.3
-.2-.1
0.1
.2.3
R&D
Expe
nditu
re (%
)
2000 2001 2002 2003 2004 2005 2006 2007Year
Control Firms Treated Firms

Univariate Analysis
Pre CGR (2000-2003) Post CGR (2004-2007)
12/29/2017
21

CGR and Risk-taking (H1)
12/29/2017
22
𝑅𝑅𝑅𝑅𝑅𝑅𝑅𝑅𝑖𝑖𝑖𝑖𝑖𝑖 = 𝛼𝛼 + 𝛽𝛽. 1 𝐶𝐶𝐶𝐶𝐶𝐶𝐶𝐶𝐶𝐶𝐶𝐶49=1 . 1 𝐴𝐴𝐴𝐴𝑖𝑖𝐶𝐶𝐴𝐴=1 + 𝜆𝜆. 1 𝐶𝐶𝐶𝐶𝐶𝐶𝐶𝐶𝐶𝐶𝐶𝐶49=1 + 𝜌𝜌. 1 𝐴𝐴𝐴𝐴𝑖𝑖𝐶𝐶𝐴𝐴=1 +𝑿𝑿𝒊𝒊𝒊𝒊𝒊𝒊.𝜹𝜹 +𝛾𝛾𝑖𝑖 + 𝜗𝜗𝑖𝑖 + 𝜏𝜏𝑖𝑖 + 𝑒𝑒𝑖𝑖𝑖𝑖𝑖𝑖
Identification Strategy - DiD

Addressing Size-Effect
Firm’s Characteristics based on groups exogenously classified by Clause-49 reform (2000-2003) – Size based (paid-up capital and net-worth)
12/29/2017
23
Group IIIB paid-up capital of 30-40 million and Group IVA paid-up capital of 15-30 million.

Addressing Size-Effect
12/29/2017
24
For each risk-taking measure, columns [1] and [3] report regression without andwith controls, whereas column [2] reports regression without control for the non-missing sub-sample of all control variables.

Addressing Pre-compliance Difference
Treated firms= Size matched (highest decile based on size) firms: Av. Size 8.85 Control Firms= Cross-listed firms. (Av. size 8.86)
12/29/2017
25

Other Robustness Tests and Summarizing the Findings
False Experiments and introduction effect
Industry-level confounding shocks
Self-selection Bias
12/29/2017
26
Summarizing the findingsIncrease of at least 0.51, 2.37 and 0.24 percentage points ofearnings-volatility, capital expenditure and R&D expenditurerespectively of the treated firms in the post CGR enforcementperiod.

Exploring Cross-Sectional Heterogeneity: Ownership Concentration (H2)
12/29/2017
27
𝑅𝑅𝑅𝑅𝑅𝑅𝑅𝑅𝑖𝑖𝑖𝑖𝑖𝑖 = 𝛼𝛼 + 𝜔𝜔. 1(𝐶𝐶𝐶𝐶𝐶𝐶𝐶𝐶𝐶𝐶𝐶𝐶49=1). 1 𝐴𝐴𝐴𝐴𝑖𝑖𝐶𝐶𝐴𝐴=1 .𝑂𝑂𝑂𝑂𝑂𝑂𝑂𝑂𝑂𝑂𝑂𝑂𝑖𝑖 + 𝜆𝜆. 1 𝐶𝐶𝐶𝐶𝐶𝐶𝐶𝐶𝐶𝐶𝐶𝐶49=1 + 𝜌𝜌. 1 𝐴𝐴𝐴𝐴𝑖𝑖𝐶𝐶𝐴𝐴=1
+𝑿𝑿𝑖𝑖𝑖𝑖𝑖𝑖.𝜹𝜹 +𝛾𝛾𝑖𝑖 + 𝜗𝜗𝑖𝑖 + 𝜏𝜏𝑖𝑖 + 𝑒𝑒𝑖𝑖𝑖𝑖𝑖𝑖

Exploring Firm’s Heterogeneity: Leverage (H3)
12/29/2017
28𝑅𝑅𝑅𝑅𝑅𝑅𝑅𝑅𝑖𝑖𝑖𝑖𝑖𝑖
= 𝛼𝛼 + 𝜔𝜔. 1 𝐶𝐶𝐶𝐶𝐶𝐶𝐶𝐶𝐶𝐶𝐶𝐶49=1 . 1 𝐴𝐴𝐴𝐴𝑖𝑖𝐶𝐶𝐴𝐴=1 . 𝐿𝐿𝑒𝑒𝐿𝐿𝑒𝑒𝐿𝐿𝐿𝐿𝐿𝐿𝑒𝑒𝑖𝑖 + 𝜆𝜆. 1 𝐶𝐶𝐶𝐶𝐶𝐶𝐶𝐶𝐶𝐶𝐶𝐶49=1 + 𝜌𝜌. 1 𝐴𝐴𝐴𝐴𝑖𝑖𝐶𝐶𝐴𝐴=1
+ 𝑿𝑿𝑖𝑖𝑖𝑖𝑖𝑖.𝜹𝜹 +𝛾𝛾𝑖𝑖 + 𝜗𝜗𝑖𝑖 + 𝜏𝜏𝑖𝑖 + 𝑒𝑒𝑖𝑖𝑖𝑖𝑖𝑖

Value-relevance of Risk-taking:(H4)
12/29/2017
29
𝑉𝑉𝐿𝐿𝑉𝑉𝑉𝑉𝑒𝑒𝑖𝑖𝑖𝑖𝑖𝑖 = 𝛼𝛼 + 𝜑𝜑. 1 𝐶𝐶𝐶𝐶𝐶𝐶𝐶𝐶𝐶𝐶𝐶𝐶49=1 . 1 𝐴𝐴𝐴𝐴𝑖𝑖𝐶𝐶𝐴𝐴=1 .𝑅𝑅𝑅𝑅𝑅𝑅𝑅𝑅 − 𝑡𝑡𝐿𝐿𝑅𝑅𝑅𝑅𝑂𝑂𝐿𝐿 + 𝜆𝜆. 1 𝐶𝐶𝐶𝐶𝐶𝐶𝐶𝐶𝐶𝐶𝐶𝐶49=1 + 𝜌𝜌. 1 𝐴𝐴𝐴𝐴𝑖𝑖𝐶𝐶𝐴𝐴=1+𝑿𝑿𝒊𝒊𝒊𝒊𝒊𝒊.𝜹𝜹 +𝛾𝛾𝑖𝑖 + 𝜗𝜗𝑖𝑖 + 𝜏𝜏𝑖𝑖 + 𝑒𝑒𝑖𝑖𝑖𝑖𝑖𝑖

Conclusion
In a regime of high IP, market forces of corporate scrutinyare stronger and cost of CG compliance is higher. Anyadditional cost of CG interventions may be redundant, infact counterproductive. It increases compliance burdenand discourage risk-taking, as documented by previousstudies.
However, similar reforms in emerging markets, wheremarket forces of corporate scrutiny are weaker and theperceived benefits of CGR is higher than the cost, it cansubstitute missing market based governance andencourage corporate risk-taking.
12/29/2017
30

Thank You
12/29/2017
31