corporate governance and intellectual capital reporting in ... · corporate governance factors on...
TRANSCRIPT
Corporate governance and intellectual capital reporting in a period of financial crisis:
evidence from Portugal
Lúcia Lima Rodrigues, University of Minho Francisca Tejedo-Romero, Universidad de Castilla-La Mancha Russell Craig, Victoria University
ABSTRACT This paper uses an analytical frame comprised of agency theory and a resource based
perspective to explore the influence of boards of directors on listed companies’ voluntary disclosure of
information concerning intellectual capital [IC]. The IC disclosures in 75 published company reports
of 15 listed Portuguese companies in a five year period of financial crisis, 2007 to 2011, are
investigated using content analysis and regression techniques. IC disclosures are found to increase
with company size, dual corporate governance models, industry, listing on sustainability indexes, and
increases in board size up to a maximum point (beyond which disclosures decrease). IC disclosures are
reduced by CEO duality and by a higher proportion of independent directors on boards. The year of
reporting is not significant, suggesting that the period of financial crisis did not influence the level of
IC disclosures. The evidence adduced is consistent with a view that highly visible companies
acknowledge the importance of IC disclosures in maintaining their reputation and competitive
advantage, even during a period of financial crisis. This paper highlights the need for caution in
believing that adding extra directors to an existing board will lead to improved disclosure outcomes.
Additionally, given the token number of females appointed to boards currently, the Portuguese capital
market regulator should consider enforcing measures to ensure compliance with EU objectives.
Keywords: board, directors, disclosure, intellectual capital, Portugal, resource-based, perspective, agency
theory, financial crisis
INTRODUCTION
Intellectual capital [IC] has had an increasingly important influence on long term corporate value in the
knowledge economy. Consistent with Meritum (2002) and Oliveira et al. (2010), we conceive IC as:
... the value-creating combination of a company’s human capital (skills, experience, competence and innovation
ability of personnel), structural capital (organizational processes and systems, software and databases and
business processes), and relational capital (all resources linked to the external relationships of the firm with
stakeholders, such as customers, creditors, investors, suppliers, etc.).
Similarly, the European Commission (2006, p. 31) defines IC as the combination of the human,
organizational and relational resources and activities of an organization – by which it includes the
knowledge, skills, experiences and abilities of employees; R&D activities, organizational routines,
procedures, systems, databases and intellectual property rights of the company; and all resources linked to
the external relationships of the enterprise, such as with customers, suppliers, and R&D partners.
If stakeholders are informed fully of a firm’s management of IC, their ability to assess the firm’s
capacity to sustain and increase long-term value will be enhanced. However, access to information regarding
IC is asymmetric. Most stakeholders are disadvantaged in terms of access to information and are forced to
rely strongly on voluntary disclosures of information about IC to inform their decision making.
In this paper we report findings which update, reinforce and extend prior studies of the effect of
corporate governance factors on levels of disclosure of IC items (Cerbioni and Parbonetti, 2007; Li et al.,
2008; Hidalgo et al., 2011). Gul and Leung (2004, p. 355) suggest that the ‘failure to include corporate
governance characteristics could account for the inconsistent results [in prior studies] since corporate
disclosure policies emanate from the board.’ As with Hidalgo et al. (2011), we seek to improve
understanding of the corporate governance variables that are likely to reduce information asymmetry. We
focus on voluntary disclosures of information about IC items.
Currently, knowledge of the factors influencing voluntary disclosure of IC information by companies is
incomplete. This study makes a distinctive contribution by focusing on governance issues in the context of
the Portuguese financial crisis, 2007-2011; by framing its analysis in terms of agency theory and a resources-
based perspective [RBP]; and by exploring voluntary IC disclosures in a wider catchment of published

reports than usual (that is, in company annual reports, sustainability reports, and/or a combination of both).1
Although Manolopoulou and Tzelepis (2014) concluded that IC reporting significantly decreased during the
period of crisis in Greece, our evidence reveals that Portuguese companies maintained their level of IC
reporting, apparently to maintain their reputation and competitive advantage. We also analyse levels of
female board membership and explore whether the gender diversity of boards influences IC disclosures.2
Our results improve understanding of how financial crisis affects disclosure practices related to IC
information, especially the influence of the composition of boards of directors on disclosures. They also help
to assess the impact of recent corporate governance regulations in Portugal on IC disclosures. Portugal is an
ideal setting to explore these matters for two reasons: first, because it was one of the European Union [EU]
members most affected by the Global Financial Crisis [GFC]; and second, because the decision to require
greater female participation on boards of Portuguese companies represents a deep cultural change.3
Our findings suggest that even in a period of financial crisis, companies understand the importance of
maintaining levels of IC disclosure in building a positive image of innovation and concern for IC matters. As
with Hidalgo et al. (2011), we find a quadratic relationship between board size and IC disclosure. Thus, an
increase in the number of directors is related positively to the level of IC disclosure until a maximum is
reached, beyond which any increase in directors does not increase the level of IC disclosure. Similarly, we
also find CEO duality is statistically significant at the 10% level in explaining voluntary disclosure of IC
items. Importantly, we provide new evidence of a statistically significant negative correlation between levels
of IC disclosure and the proportion of independent board members; and of the absence of a statistically
significant relationship between the gender diversity of a board and levels of IC disclosure.
The average size of boards of directors of listed companies in Portugal has grown in response to the
Portuguese Securities Exchange Commission’s requirement that at least one quarter of boards of listed
companies be comprised by independent directors (Instituto Português de Corporate Governance [IPCG],
2006). In effect, this requirement implies that non-independent directors be replaced by independent
1 The International Integrated Reporting Council [IIRC] (2011) argues that integrating annual reports and sustainability reports
into a combined report will build understanding of how performance in one area drives value in another. 2 Recently, a European Union [EU] report required publicly listed companies in Europe to commit voluntarily to increase the
presence of women on their corporate boards to 30% by 2015 and 40% by 2020, by actively recruiting qualified women to replace
outgoing male members (EC, 2012). 3 Salazar’s dictatorship in Portugal (1932 to 1968) shaped Portugal as a very ‘masculine’ country. In Salazar’s era, Portuguese
society was very conservative. Women had little or no access to senior positions in government or business and their employment
was restricted mainly to manual work and domestic duties (Nogueira et al., 1995).

directors. In view of this, it is surprising to find that higher proportions of independent directors had a
negative influence on IC disclosures. We draw attention to the small number of females on boards of listed
companies in Portugal, and to whether the EU’s targeted representation levels for 2020 will be attained. We
reveal that more IC information is disclosed by companies in high intangibles intensive industries, by
companies with high visibility and reputation (as measured by size and listing in sustainability indexes), and
by companies with a dual corporate governance model.
In the following section we explain the corporate regulatory context of Portugal, review relevant
literature, and develop research hypotheses. Thereafter, we explain our research design, sample selection,
and dependent and independent variables. We then present results, before entering conclusions and
recommendations.
PORTUGUESE CORPORATE REGULATORY CONTEXT AND DEVELOPMENT OF
HYPOTHESES
Portuguese regulatory context
The Portuguese Stock Exchange is small by international standards. There are many listed family companies
(Oliveira et al., 2010). Traditionally, the ownership of Portuguese companies is concentrated highly (Lopes
and Rodrigues, 2007). Many companies are financed strongly by family owners and banks (Caria and
Rodrigues, 2014). There is strong concern within the Portuguese business community about the extensive
financial disclosure requirements imposed by the Securities Market Commission (Comissão do Mercado de
Valores Mobiliários–CMVM) (Oliveira et al., 2010).
From January 2005 onwards, compliance with International Financial Reporting Standards [IFRS]
became compulsory for Portuguese listed companies in preparing consolidated accounts. From 1 January
2010, the Portuguese government imposed an IFRS-based system (Sistema de Normalização contabilística -
Accounting Standardization system) on all unlisted companies. The income tax code was adapted to be more
amenable to the new accounting rules. Listed companies were permitted to apply IFRS from 2010 onwards
in separate financial statements (Guerreiro et al., 2012).
The first Portuguese corporate governance code, issued by the CMVM in 1999 (CMVM, 1999), was
motivated by publication of the ‘OECD Principles of Corporate Governance’ (OECD, 1999). The

Portuguese Code required listed companies to disclose information related to various aspects of corporate
governance. In 2007, a major amendment to the corporate governance code required boards of directors to
include sufficient non-executive members to ensure effective supervision, monitoring and evaluation of
executive members’ activities (CMVM, 2007). At least one quarter of directors were required to be non-
executive directors. The CMVM also recommended that boards of directors rotate responsibility for the
finance area among directors at least every two complete terms of office. There was no recommendation
related to the gender composition of boards.
In 2006, the IPCG recommended that the positions of CEO and Chair be held by different persons (Silva
et al., 2006). If the Chair and CEO was the same person, the IPCG recommended that companies explain in
their annual report how the work of non-executive directors was coordinated. The IPCG’s study of corporate
governance practices in Portugal concluded that:
the average size of boards of directors had increased since 1996 due to the inclusion of
independent non-executive directors, and the trend to establish an Executive Committee for the
day-to-day running of a company.
the main purpose of companies must be to create wealth and to distribute it equally among
shareholders.
the annual general meeting of shareholders should approve a company’s policies relating to
sustainable development and social responsibility.
audit committee independence should be strengthened, particularly in view of the lack of
assurance that audit committees were independent of executive directors.
Portugal was affected severely by the Global Financial Crisis (GFC). The Portuguese economy
suffered a pronounced on-going recession, featuring persistently high unemployment. The recession
increased the level of debt rapidly, despite efforts to reduce public spending through government-
imposed austerity measures. Additionally, Portugal has many gender-based inequalities. These are
evident in aspects of management power and leadership, both in companies and in government bodies
(Nogueira et al., 1995).
Development of hypotheses
According to agency theory, a board of directors should monitor managers to ensure they behave in the
interests of shareholders (Bertoni et al., 2014). In fulfilling this role, a board of directors serves as a value-
protection mechanism. According to the RBP view of corporate endeavour, a board of directors should help
a company attain valuable resources to facilitate its competitive advantage. This role includes giving
strategic advice, contributing to the company’s reputation, and expanding the company’s business contacts.
Adoption of an RBP view emphasizes several matters: the value-creation capacity of a board of directors;
that intangible resources and capabilities are the most important sources of company success; and that
intangible resources are created, enhanced or depleted through relationships with stakeholders (Branco and
Rodrigues, 2006).
Asymmetry exists between what is known inside a company and what is known outside a company.
Corporate reputations are sometimes more important than the true state of affairs in shaping the way external
actors engage with companies (Branco and Rodrigues, 2006). IC disclosures are an information signal with
the capacity to influence the way stakeholders assess corporate reputation under conditions of incomplete
information. In this regard, IC disclosures can be particularly important in assisting a company to develop
competitive advantage by creating a positive image (for example, of a modern and competitive company),
thereby encouraging people “to do business with the firm and buy its products” (Hooghiemstra, 2000, p. 64).
Companies which invest in IC activities to create positive reputation often fail to realise the value of that
reputation unless they make associated disclosures about their activities (Toms, 2002; Hasseldine et al.,
2005). Disclosures about IC activities help to build a positive image with external stakeholders and
employees. These perceptions are also interrelated since employees’ assessments of how external
stakeholders will react to their employer will influence their job satisfaction and employment intentions
(Branco and Rodrigues, 2006).
We seek to understand how the composition of a board of directors explains why listed companies
disclose IC information in published reports. We do so in respect of Portugal during a period of financial
crisis. We are especially interested in exploring argument that it is important to understand whether the
effect of internal governance mechanisms on voluntary corporate disclosures is complementary or
substitutive (Cerboni and Parbonetti, 2007). If it is complementary, agency theory predicts increased

disclosure since the adoption of more governance mechanisms will strengthen a company’s monitoring
environment. If the relationship is substitutive, managers could decide to disclose less information to avoid
competitive disadvantage by disclosing strategic information (Dye, 2001). Cerboni and Parbonetti (2007)
argued that although results have been mixed and controversial, because of strong demand for product
development information by technology analysts and science-based companies, firms seek to satisfy this
demand by disclosing value-relevant information.
Thus, we contend that corporate governance mechanisms have a positive impact on corporate
disclosures. We begin by exploring the explanatory potential of corporate governance characteristics,
canvassed in a diverse body of scholarly literature, to explain motivators for voluntary disclosure of
information by listed companies. These characteristics include board size, board activity, CEO duality,
independent directors, gender representation, and corporate governance model. The reasons for choosing
these factors are discussed below. Related hypotheses are developed.
Board size
Board size has a significant influence on the efficiency, effectiveness and supervision of management
(Hidalgo et al., 2011). Allegrini and Greco (2013) found a positive association between board size and levels
of voluntary disclosure. Some prior studies have suggested that large boards are less effective at mitigating
agency conflicts than smaller ones (Babío and Muíño, 2005; Cerbioni and Parbonetti, 2007), although
opinion is often expressed cautiously:
… larger boards may be beneficial because they increase the pool of expertise and resources available to the organisation
but, as the number of members on the board increases, this benefit may be offset by the incremental costs of poorer
communication and increased decision making time that are often associated with large groups (Hidalgo et al., 2011, p.
486).
Several studies have reported a quadratic relationship between board size and economic performance
(e.g., Andres and Vallelado, 2008; Veprauskaitė and Adams, 2013; López and Morrós, 2014), between board
size and corporate social disclosure (Cormier et al., 2011), and between board size and disclosures of IC
information (Hidalgo et al., 2011). These studies have found, in effect, an inverted “U” relationship, with

optimal board size existing at the midpoint (Cormier et al., 2011; Hidalgo et al., 2011). Increases in board
size have been found to improve the marginal rate of disclosure up to the top of the inverted “U”, but then
the marginal rate of disclosure diminishes as the size of the board becomes larger, and possibly unwieldy.
This leads to the following hypotheses:
H1a: Board size is related positively to voluntary disclosures of IC information.
H1b: Board size is related positively to voluntary disclosures of IC information, up to an optimal
board size. Board size beyond an optimal point is related negatively to voluntary disclosures of IC
information.
Independent directors
The Green Paper on the EU Corporate Governance Framework (EC, 2011a) argues that boards will benefit
from non-executive members who possess diverse views, skills and professional experience. The Green
Paper recommends that independent non-executive board members be selected on the basis of “merit,
professional qualifications, experience, personal qualities […] independence and diversity” (p. 5). These
characteristics accord with the value-creation mechanisms of a board of directors that are emphasised by a
RBP.
Board of director effectiveness in protecting shareholders is associated positively with the proportion of
independent directors on the board (Rosenstein and Wyatt 1990; Dechow et al., 1996; Peasnell et al., 2005).
Nevertheless, Eng and Mak (2003) and Gul and Leung (2004) have found a substitution effect: that an
increase in independent directors reduces the need to disclose more information, and that increased
monitoring by independent directors results in a lower level of voluntary disclosure. Although Hidalgo et al.
(2011) did not find any significant relationship between the number of independent directors and disclosures
of information about IC, Cerbioni and Parbonetti (2007) found a significant positive relationship. Given the
possibility of a substitution effect, our hypothesis H2 is non-directional.
H2: The proportion of independent members on a board of directors is related to voluntary disclosures
of information about IC.

Board activity
Boards of directors which meet more frequently than others are argued to be more diligent and to monitor
management more effectively (Lipton and Lorsch, 1992; Xie et al., 2003; Kanagaretnam et al., 2007).
Allegrini and Greco (2013) reported a positive relationship between number of board meetings and voluntary
disclosures of information. Thus, an active board of directors is likely to provide more effective management
control of IC, and disclose more information about IC, to publicise work undertaken.
H3. The number of meetings of a board of directors is related positively to voluntary disclosure of
information about IC.
CEO duality
A common requirement of corporate governance regulation internationally is to separate the role of chair of
the board from that of CEO. Agency theory suggests that combining the two roles enables the CEO to
engage in opportunistic behaviour because of his/her dominance of the board (Barako et al., 2006). Since
one of a board’s most important roles is to oversee top management’s performance, allowing the CEO to
serve concurrently as chair compromises desired checks and balances, and reduces the probability that the
board will execute its oversight and governance role properly (Lorsh and MacIver, 1989). Forker (1992) and
Gul and Leung (2004) have reported a negative relationship between voluntary information disclosure and
“CEO duality” (that is, in circumstances where one person assumes the roles of CEO and of chair of the
board of directors). Cerbioni and Parbonetti (2007) reported that concentration of power through CEO
duality is associated negatively with IC disclosures, whereas Hidalgo et al., (2011) found no such
relationship.
H4: CEO duality is related negatively to voluntary disclosures of information about IC.
Gender composition
Gender diversity in the membership of a board of directors yields a broader range of competencies and
expertise. Gender composition is considered important in enhancing the collective intelligence of a board of

directors in the EU Corporate Governance Framework (EC, 2011a).4 Arguments for the appointment of
female non-executive directors are that this will increase diversity of opinion, enhance decision making and
leadership styles, and provide a competitive advantage by improving company image with stakeholder
groups (Burgess and Tharenou 2002; Carter et al., 2003).
Barako and Brown (2008) found that the representation of women on boards of Kenyan banks is
associated positively with the extent of corporate social reporting information disclosed in annual reports.
Nalikka (2009), in a study of 108 annual reports for 2005 to 2007 of companies listed on the Helsinki Stock
Exchange, concluded that “gender diversity is one of the attributes influencing the extent of voluntary
disclosure in annual reports.” Specifically, she found a statistically significant association between
companies with female Chief Financial Officers and the level of voluntary disclosure in annual reports. As
well, a wide variety of empirical research reports that gender diversity improves company performance (for
example, Lückerath-Rovers, 2013). We draw on such prior findings to argue that gender diversity should
have a positive impact on disclosure.
H5: The proportion of women directors on the board is related positively to the voluntary disclosure of
information about IC.
Corporate governance model
The governance structure of Portuguese companies has changed in recent years. In 1999, companies
followed either:
the Latin model of corporate governance (Board of Directors and an Audit Board (which could be
one person) or
the Continental model (Supervisory Board and a Management Board. The latter was responsible for
arranging a statutory audit).
In 2006, the revised Companies Code (Código das Sociedades Comerciais, CSC) allowed Portuguese
companies to adopt more advanced models of corporate governance: they could choose between a Latin
4 A Securities and Exchange Commission Staff Working Paper (EC, 2011b), titled “The Gender Balance in Business Leadership”,
reported the average proportion of females on (supervisory) boards of listed companies in the EU was only 12%.

model, a Continental model, and an Anglo-Saxon model. The Anglo-Saxon model comprised a board of
directors, an audit committee, and a statutory auditor – all elected at a company’s annual general meeting.
The audit committee is to be composed exclusively of non-executive directors, but with at least one member
having sound knowledge of accounting and auditing. The CSC regarded the Anglo-Saxon model to be a
more advanced model of corporate governance, and one likely to increase a company’s legitimacy and
reputation with many stakeholders (Costa et al., 2013). Companies adopting this model were thought likely
to disclose more IC information than companies which adopted either of the other models.
H6. Companies adopting the Anglo-Saxon model of corporate governance are more likely to disclose
IC information than companies which adopt either of the classical (Latin or Continental) models
of corporate governance.
Control Variables
We selected company size, industry, listing on sustainability indexes, ownership concentration, and reporting
year, as control variables.
Several previous studies have found that firm size influences voluntary disclosure (Chow and Wong-
Boren, 1987; Meek et al., 1995; Bozzolan et al., 2003; Oliveira et al., 2006; Cerbioni and Parbonetti, 2007;
Lopes and Rodrigues, 2007; Hidalgo et al., 2011).
Consistent with previous research in Portugal (Oliveira et al., 2006; 2010), we partitioned companies
into “high intangibles intensive” and “low intangibles intensive.” High intangibles industries include
chemicals, electronics, technology, telecommunications and finance. Our sample included six “high
intangibles intensive” companies and nine “low intangibles intensive” companies.
We include listing on sustainability indexes as a proxy for reputation, consistent with Michelon and
Parbonetti (2012). This variable was included in studies by Dragomir (2010), Gallego-Alvarez et al. (2011),
and Prado-Lorenzo et al. (2009).
Prior empirical research on the association between voluntary corporate disclosures and ownership
concentration has reported mixed results. However, most studies have found an inverse relationship between
these variables (for example, Gul and Leung, 2004; Firer and Williams, 2005; Barako et al., 2006).

The variable “year” controls for the effects of the financial crisis on IC disclosure. A study by Ahmed
and Mohd (2012) of major listed Malaysian companies, 2008 to 2010, showed a significant increasing trend
over time in the human capital disclosure index. However, Manolopoulou and Tzelepis (2014) found that IC
reporting significantly decreased during the period of crisis in Greece. There are plausible grounds to believe
that companies would reduce disclosure levels in a financial crisis: for example, to save costs. Indeed, the
turmoil of a financial crisis could cause companies become more focused on operational efficiency rather
than on stakeholder impression management, and legitimacy-seeking through voluntary disclosure.
RESEARCH DESIGN
Sample
We sample annual reports, sustainability reports, and reports which are a combination of both of these types
of reports, for 2007 to 2011, for companies listed on the Lisbon Stock Exchange at 31 December 2012.
Initially, we intended to sample all companies comprising the PSI 20 index.5 However, because some PSI 20
companies did not include information on corporate social responsibility (CSR), we included other
companies that were not part of the index in 2012, but had been so in the period 2007 – 2011 (and had
reported information on CSR). The latter step seems justifiable in view of the large overlap of CSR and IC
indicators found by Cordazzo (2005), Pedrini (2007) and Oliveira et al. (2010). We are mindful of the
potential to understate IC disclosure levels if sustainability reports and annual reports were not both
considered.
We selected 15 companies that were included on the PSI 20 index during the five years of this study.
These companies, and the industries to which they belong, are listed in Appendix A. Reports were accessed
on each company’s website. We used pooled data with 75 firm-year observations: that is, 15 companies for 5
years each. The companies were from the following industries: Basic Materials (n = 1); Consumer Services
5 The PSI 20 is a benchmark stock market index of companies trading on Euronext Lisbon. It tracks the prices of the twenty largest
listings according to market capitalization and share turnover in the general market of the Lisbon Stock Exchange.

(n = 2); Financial (n = 4); Industrial (n = 3); Oil and Energy (n = 1); Telecommunications (n = 2); and
Utilities (n = 2).
Variables and data collection
Dependent Variable
Our dependent variable was an IC disclosure index (ICI). This was constructed using content analysis
(Guthrie et al., 2004; Beattie & Thomson, 2007). Such a method allows repeatability and valid inferences
from data according to the context (Krippendorf, 1980). The content analysis technique involves codifying
information into pre-defined categories to derive patterns in the presentation and reporting of information
(Cerbioni and Parbonetti, 2007). It analyses published information systematically, objectively and reliably
(Krippendorf, 1980). This method has been used in previous studies of disclosure of information (Guthrie et
al., 2004; Bukh et al., 2005; García-Meca et al., 2005; Cerbioni and Parbonetti, 2007; Singh and Van der
Zahn, 2008; Oliveira et al., 2010; Hidalgo et al., 2011; Allegrini and Greco, 2013).
We assumed all items were relevant to all firms and were calculable by them. Thus, the total score of
ICI for a company is:
ICI = m
dm
i
i1
where
di = 0, if the disclosure item is not found
di = 1, if the disclosure item is found
m = the maximum number of items a company can disclose
ICI = Intellectual Capital Index (of disclosure)
We pilot tested three randomly chosen reports to obtain a list that better reflected the diverse nature of
disclosed items. The final list included 88 IC items that firms could disclose (Strategy – 22; Processes – 10;
Innovation, Research and Development [IRD] – 8; Technology – 5; Customers – 14; Human Capital – 29)
(see Table 1). The data disclosures identified in our content analysis of the full sample were coded manually
since software-assisted searches for words or sentences are insufficiently robust to capture the nature of IC

disclosures (Beattie and Thomson, 2007; Oliveira et al., 2010). Content analysis of the entire sample was
performed by the first author, informed by her prior coding of an initial sample of four annual reports with
the second author. An inter-coder reliability test revealed the scale of coding errors (Scott’s pi = 85.1%) to
be “an acceptable level of inter-coder reliability” (Hackston and Milne 1996, p. 87).
Independent Variables
The hypotheses tested included independent variables for board size, proportion of independent directors,
board activity, CEO duality, board composition as measured by the presence of female directors, and
governance model. We proceeded consistent with studies by Barako et al. (2006), Cerbioni and Parbonetti
(2007), Lim et al. (2007), Barako and Brown (2008), Li et al. (2008), Prado and García (2010), Hidalgo et
al. (2011), and Allegrini and Greco (2013). Our independent variables were:
Board size: number of members of the board of directors.
Independent directors: percentage of independent directors comprising the board of directors.
Board activity: number of meetings of the board of directors during a financial year.
CEO duality: dummy variable with a value of 1 in case of CEO duality, and 0 otherwise.
Gender composition: percentage of females on the board of directors.
Governance model: dummy variable with a value of 1 if the Anglo Saxon model is used, and 0 if the
Latin or dual Continental model is used.
Control Variables
Company size: logarithm of the number of employees (Subramaniam and Youndt, 2005)
Industry: a dummy variable that takes the value of 1 if a company belongs to a high intangibles intensive
industry, and 0 otherwise (Oliveira et al., 2006; 2010).
Listing on sustainability indexes: a dummy variable that takes the value of 1 if a company is included in
sustainability indexes (e.g., Dow Jones Sustainability Index (DJSI) or FTSE4Good), and 0 otherwise
(Prado-Lorenzo et al., 2009; Dragomir 2010; Gallego-Alvarez et al., 2011).

Ownership concentration: proportion of ordinary shares owned by substantial shareholders (with equity
of 5% or more) (Lopes and Rodrigues, 2007).
Year: four dummy variables were included in the model to control for the effects of year of publication
(0 = reference year = 2007; 1 = Y2 = 2008; 2 = Y3 = 2009; 3 = Y4 = 2010; and 4 = Y5 2011) (Costa et
al., 2013).
Research models
The four econometric models we used are based on linear regression techniques. They test hypotheses H1 to
H6, consistent with approaches in prior disclosure studies by García-Meca et al. (2005), Oliveira et al.
(2010) and Hidalgo et al. (2011). We developed a pooled regression (or data pool) estimate using an
Ordinary Least Squares (OLS) approach, in accord with similar studies (for example, by Cheng and
Courtenay, 2006). We began by analysing the independent variables in Models 1 and 2. To control for any
nonlinear relationship between board size and the level of IC disclosures, we also considered the square of
the LnBoardSize variable (model 2). We also considered the square of the board size variable in Models 3
and 4. Our logarithmic transformation of variables for board size, and board activity avoids potential
problems of heteroscedasticity, facilitates data interpretation, and improves the quality of results (Haniffa
and Hudaib 2006; La Rosa and Liberatore, 2014). In Model 3 we considered the independent and control
variables. To control the unobservable events common to all companies for yearly differences, dichotomous
variables (time dummies for each year) were incorporated into Model 4, consistent with Al-Akra et al.
(2010) and Cardamone et al. (2012).
Model 1
ICI = β0 + β1LnBoardSizeit + β2IndependentDirectorsit + β3LnBoardActivityit + β4CEO dualityit +
β5Genderit + β6GovernanceModel Dummies + ε
Model 2
ICI = β0 + β1LnBoardSizeit + β2(LnBoardSize)2it + β3IndependentDirectorsit + β4LnBoardActivityit +
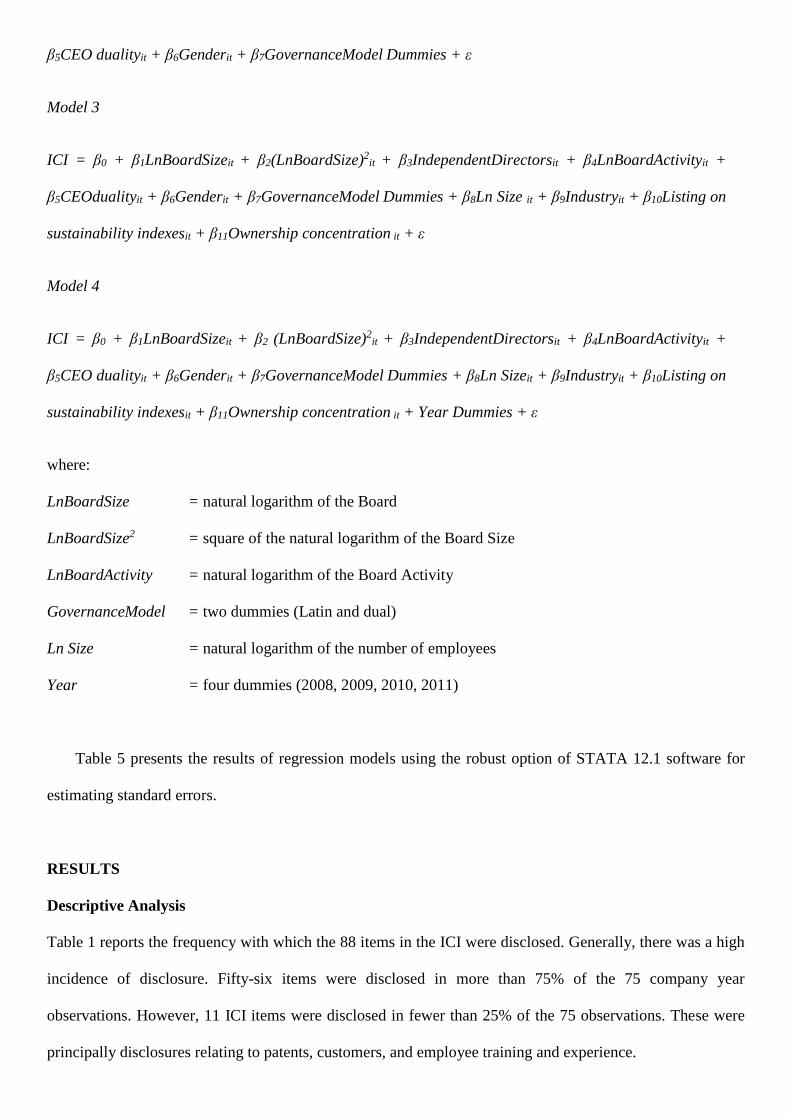
β5CEO dualityit + β6Genderit + β7GovernanceModel Dummies + ε
Model 3
ICI = β0 + β1LnBoardSizeit + β2(LnBoardSize)2it + β3IndependentDirectorsit + β4LnBoardActivityit +
β5CEOdualityit + β6Genderit + β7GovernanceModel Dummies + β8Ln Size it + β9Industryit + β10Listing on
sustainability indexesit + β11Ownership concentration it + ε
Model 4
ICI = β0 + β1LnBoardSizeit + β2 (LnBoardSize)2it + β3IndependentDirectorsit + β4LnBoardActivityit +
β5CEO dualityit + β6Genderit + β7GovernanceModel Dummies + β8Ln Sizeit + β9Industryit + β10Listing on
sustainability indexesit + β11Ownership concentration it + Year Dummies + ε
where:
LnBoardSize = natural logarithm of the Board
LnBoardSize2 = square of the natural logarithm of the Board Size
LnBoardActivity = natural logarithm of the Board Activity
GovernanceModel = two dummies (Latin and dual)
Ln Size = natural logarithm of the number of employees
Year = four dummies (2008, 2009, 2010, 2011)
Table 5 presents the results of regression models using the robust option of STATA 12.1 software for
estimating standard errors.
RESULTS
Descriptive Analysis
Table 1 reports the frequency with which the 88 items in the ICI were disclosed. Generally, there was a high
incidence of disclosure. Fifty-six items were disclosed in more than 75% of the 75 company year
observations. However, 11 ICI items were disclosed in fewer than 25% of the 75 observations. These were
principally disclosures relating to patents, customers, and employee training and experience.

-------------------------------
TABLE 1 ABOUT HERE
---------------------------------
Table 2 presents descriptive statistics for the data reported in Table 1. It reveals the levels of disclosure
for the ICI overall, and for its six sub-indexes. The ICI scores per company ranged from 0.557 to 0.875. On
average, the annual report and the sustainability report (or combined report) disclosed information in respect
of 72.8 per cent of the total disclosure items, with a standard deviation of 7.3%. In terms of sub-indexes, the
three highest average levels were for Strategy (91%), Processes (80%) and Human Capital (76%). The three
lowest average levels were for Technology (63%), Innovation, Research and Development (40%), and
Customers (55%). These results are consistent with previous studies by García-Meca et al. (2005) and
Oliveira et al. (2010). As with Oliveira et al. (2010), the standard deviation for the Innovation, Research and
Development category was also the highest (0.275).
--------------------------------
TABLE 2 ABOUT HERE
--------------------------------
Table 3 presents descriptive statistics for the independent and control variables. Board size ranged from
6 to 30, with a mean of 15.6. In 1994 the mean board size was 9; in 1999 it was 11; and in 2004 it was 15
(Silva et al., 2006). The increasing size of the board is associated mainly with regulatory pressures to include
non-executive directors. The size of the board in Portugal is similar to that found in other Continental
European countries, but it is larger than in UK (9) or US (11) (Silva et al., 2006). On average, 27.7% of
directors were classified as independent. This complies with the Portuguese Corporate Governance Code
requirement that at least one quarter of directors be independent.
On average, the boards met 12 times per year. Females comprised only about 4% of members, although
this number is increasing gradually.6 In 77% of observations, the roles of the CEO and board chair were
separate, in accord with Portuguese corporate governance regulations. In Portugal, the Anglo-Saxon model
6 In 2012, women represented 7.4% of the board members of the twenty largest listed companies in Portugal. This was
significantly less than the average of 15.8% in the EU. The rate of increase of women on boards between 2003 and 2012 was 0.4
percentage points per annum. “At this rate of change, boards with at least 40% of each gender would not be seen for at least 75
years.” (EC, 2013).

of corporate governance was more dominant (45%). The Latin governance model was important too (41%).
The dual model was not significant (13%). There was a high level of ownership concentration: 61% of
ordinary shares were held in individual shareholdings of 5% or more. Forty per cent of the companies
belonged to high intangibles intensive industries. Seventy-three per cent of observations were not included in
any sustainability index, while 27% were part of at least one index.
----------------------------------------
TABLE 3 ABOUT HERE
___________________________
Bivariate analysis
The bivariate analysis results in Table 4 reveal ICI is correlated positively with board size, board activity,
listing on sustainability indexes, and the dual governance model; and correlated negatively with CEO
duality. The results are similar from year to year. These bivariate relationships are consistent with the results
obtained in previous studies (Eng and Mak, 2003; Cerbioni and Parbonetti, 2007; Barako and Brown, 2008;
Li et al., 2008; Dragomir 2010; Oliveira et al., 2010; Prado and García, 2010; Hidalgo et al., 2011; Allegrini
and Greco, 2013).
----------------------------------
TABLE 4 ABOUT HERE
-------------------------------------
Independent directors are more likely to be found in larger companies that adopt the Anglo-Saxon or
dual corporate governance models, and to have lower levels of ownership concentration. Board activity is
correlated positively with board size, listing on sustainability indexes, adoption of a dual corporate
governance model, and lower levels of ownership concentration. The percentage of females on boards of
directors is very low. Gender is not a significant factor. However, more females on boards are found in
companies with lower levels of ownership concentration.
Companies which adopt the Anglo-Saxon model of corporate governance typically belong to
sustainability indexes, have a large board of directors, and low levels of ownership concentration.
Companies with the Continental corporate governance model are bigger, have a higher proportion of

independent directors, larger boards, and higher levels of ownership concentration than companies which
adopt the Latin model of corporate governance.
The correlation coefficients do not indicate collinearity. No pair-wise correlation coefficient is greater
than 0.80 (Gujarati, 1995, p. 335).
Multivariate analysis
We validated the models using specification tests. To verify whether the models had omitted variables, the
Ramsey Reset test was performed. To detect the presence of autocorrelation in the residuals (prediction
errors) from a regression analysis, we applied the Durbin-Watson test. The overall significance of the models
was assessed using an F-test. The models were significant globally at the 1 per cent level (F-test=5.331,
5.23, 5.555 and 4.021, respectively).
For Model 1, the only significant variable was board activity at the 5% level (β3 = 0.033, t = 2.41). This
is consistent with results reported by Allegrini and Greco (2013) for a study of non-financial companies
listed on the Italian Stock Exchange in 2007. Board size is not significant (β1 = 0.038, t = 1.29) − a result
similar to of Cheng and Courtenay (2006). The latter authors found no association between the level of
disclosure and board size. They argued that large boards lead to a decrease in monitoring capabilities.
When we included the variable (LnBoardSize)2 in Model 2, board size was also significant (5% level).
The coefficient of the LnBoardSize variable was positive (β1= 0.446) and the variable (LnBoardSize)2 was
negative (β2= -0.087). That is, the quadratic term of the proposed model resulted in a curve represented by
an inverse "U", where the number of directors is related positively with the level of disclosure of IC up to a
certain maximum, beyond which the level of disclosure of IC information decreases. Thus, board size
increases IC disclosures up to a maximum point, beyond which board size is related negatively to ICI. This
is consistent with Cormier et al. (2011) and Hidalgo et al. (2011).
In Model 2, the variable CEO duality is related negatively (10% level) to IC disclosure. Thus, when the
CEO is also the Chair, disclosure of IC is reduced. These results accord with Cerbioni and Parbonetti (2007),
Barako (2008), Li et al. (2008), Hidalgo et al. (2011) and Allegrini and Greco (2013).
When control variables are added (Model 3), ICI is related positively and significantly to board size at
the 0.1% level (β1 = 1.055, t = 3.93; β2 = -0.204, t = -3.97; respectively), board activity at the 10 per cent

level (β4 = 0.029, t = 1.91) and the dual governance model at the 5% level (β7 = 0.120, t = 2.23). Moreover,
ICI is related negatively to independent directors at the 5% level (β3 = -0.148, t = -2.22), corroborating the
findings of Eng and Mak (2003) and Gul and Leung (2004). Firm size (5%), industry (1%) and listing on
sustainability indexes (0.1%) are also related positively to ICI, in accord with results obtained by Eng and
Mak (2003); Cerbioni and Parbonetti (2007); Dragomir (2010); Oliveira et al., (2010); and Hidalgo et al.,
(2011). The year of reporting (Model 4) is not statistically significant: the level of disclosure was similar
over the period 2007-2011. The financial crisis in that period does not seem to have influenced levels of
disclosure of IC.
----------------------------------
TABLE 5 ABOUT HERE
-----------------------------------
We used Model 4 to test for the relationship between ICI and all sub-indexes (see Table 6). The Ramsey
Reset test indicates that Model 4 is well specified only in the case of the following sub-indexes: Strategy,
Processes, and Human Capital. Disclosures in the sub-indexes for Innovation, Technology, and Customers
do not seem to be explained by governance or firm characteristics.
Strategy disclosures are related positively to size and the Latin corporate governance model (both at the
5% level), and board activity (at 10%); and they are related negatively to CEO duality (at 10%). Disclosures
in the sub-index Processes are related positively to board size and industry (both at 1%), and listing on
sustainability indexes (at 10%); and they are related negatively to gender (at 5%). Finally, disclosures in the
sub-index Human Capital are related positively to board size (at the 0.1% level), to listing on a sustainability
index (at 5%), and industry (at 10%); and they are related negatively to independent directors (at 5%).
----------------------------------
TABLE 6 ABOUT HERE
-----------------------------------
DISCUSSION AND CONCLUSIONS

Recent regulatory initiatives in Portugal and elsewhere in the EU regarding corporate governance are
motivated, implicitly at least, by belief that beneficial disclosures of corporate information would flow from
mandating a more heterogeneously composed board of directors ─ in particular, boards that include more
females and a substantial proportion of independent directors.
Our results are inconclusive with respect to the idea that increased gender diversity will increase IC
disclosure (H5). As well, they point to the need for caution in believing that simply adding extra external
independent directors to an existing board will improve disclosure outcomes. In Portugal, increases in board
size seem to be related more to the need to comply with corporate governance regulations to increase the
number of external independent directors, than to desire to include more females on boards. Portuguese
capital markets and Portuguese corporate governance regulations do not seem to have been influenced by the
policy debate, in September 2010, when the EC adopted its Strategy for Equality between Women and Men
(2010-2015) and announced “targeted initiatives to get more women into top jobs in decision-making” (EU,
2012). It is timely to consider whether reluctance to appoint women to boards of directors has the potential
to damage the financial situation and reputation of Portuguese companies.
The White Book issued by the IPCG in 2006 noted that, in Portugal, there was no clear identification of
directors who are truly independent from those who are non-independent. This is due to the absence of
information allowing any clear connection to be established between the directors and the company’s main
shareholders. Perhaps because of the absence of independence, our study reveals that independent directors
influence IC disclosure negatively. Another explanation is the substitution effect detected by Eng and Mak
(2003) and Gul and Leung (2004). From the perspective of agency theory, independent directors do not
appear to monitor the behavior of managers to ensure managers operate in the interests of shareholders (H2).
IC disclosure did not decrease between 2007 and 2011 − a period of deep financial crisis in Portugal.
Our data reveal that this occurred independently of a company’s ownership concentration (please see Table
4). This can be explained using a RBP view: one in which directors are conceived to have a role in helping a
firm attain valuable resources to facilitate its competitive advantage. If that competitive advantage is lost
because of a decrease in IC investment, this can reduce a company’s reputation (e.g., in terms of innovation).
This seems attributable, in part, to directors being conscious of the possibility of damaging their firm’s

image (associated, for example, with speculation about their financial situation).7 A plausible case can be
made that they use disclosure as a means of legitimising the company’s existence − and to maintain or
empower its image. This reveals the utility of a RBP view in analysing a company’s IC disclosures. The high
visibility and reputation of the companies in our sample seems likely to have prompted them to maintain
levels of IC disclosure to avoid reputational damage. Directors had an incentive to maintain IC disclosures
so as to influence people to continue considering their company to be modern and competitive.
The Portuguese setting reinforces previous research that has found a quadratic relationship between
board size and IC disclosure (H1b). This finding implies that large boards should be avoided if IC
disclosures are regarded as important. Although a board’s monitoring capacities increase with the number of
directors, the costs involved (such as slower decision making and less candid discussions of managerial
performance) could outweigh the benefits. This finding, and the results showing a negative relationship
between IC disclosure and independent directors (H3), and CEO duality (H4), should interest the Portuguese
CMVM in devising its future reform agenda. Additionally, given the token number of females appointed to
boards at the moment, the CMVM should consider undertaking enforcement measures to ensure compliance
with EU objectives.
The level of board activity is related slightly to IC disclosure (H3). This is explainable by the fact that
active boards have ample opportunities to convey information to society. Such information includes
messages that a company is well managed, that stakeholders’ interests are taken into account, and that the
board of directors is functioning well as a value-protection mechanism, thereby legitimising the company’s
behavior. Our results confirm that IC disclosures are more likely to occur with the Continental governance
model than with the Anglo Saxon model (contrary to the view of the CMVM).
Company size is a proxy for company visibility. More visible companies which belong to high
intangibles intensive industries and which are listed on sustainability indexes disclose more IC information.
This accords with a resource-based perspective because it emphasizes the role of the board of directors in
contributing to the firm’s image and reputation.
7 This was the case of Banco Espírito Santo. Although this bank declared bankruptcy at the end of 2013, it kept disclosures at the
same level in the analysis period.

It is important to continue researching how corporate governance characteristics influence IC disclosure.
A particularly beneficial line of investigation would be to explore associations between IC disclosures and
features of various sub-committees of a board of directors. As well, it would be beneficial if future research
used larger samples, less visible companies, and companies in countries facing deep financial crises (e.g.,
Spain, Italy and France) to better understand whether levels of IC information disclosures are maintained
during periods of financial crisis. Another line of future enquiry might be to explore family-held, publicly-
traded companies to assess the influence of the compositional dynamics of the board of directors of such
companies on voluntary disclosures of IC.

REFERENCES
Haji, A.A. and Ghazali, N. A. (2012) Intellectual capital disclosure trends: some Malaysian evidence.
Journal of Intellectual Capital 13(3): 377-397.
Al-Akra, M., Eddie, I.A. and Ali, M.J. (2010) The influence of the introduction of accounting disclosure
regulation on mandatory disclosure compliance: Evidence from Jordan. British Accounting Review
42(3): 170-186.
Allegrini, M. and Greco, G. (2013) Corporate boards, audit committees and voluntary disclosure: evidence
from Italian listed companies. Journal of Management & Governance 17(1): 187-216.
Andres, P. and Vallelado, E. (2008) Corporate governance in banking: the role of the board of directors.
Journal of Banking and Finance 32(12): 2570-2580.
Babío, M.R. and Muíño, M.F. (2005) Corporate characteristics, governance rules and the extent of voluntary
disclosure in Spain. Advances in Accounting 21: 299-331.
Barako, D.G. and Brown, A.M. (2008) Corporate social reporting and board representation: Evidence from
the Kenyan banking sector. Journal of Management and Governance 12(4): 309-324.
Barako, D.G., Hancock, P. and Izan, H.Y. (2006) Relationship between corporate governance attributes and
voluntary disclosures in annual reports: the Kenyan experience. Financial Reporting Regulation and
Governance 5(1): 1-27.
Barney, J. (1991) Firm resources and sustained competitive advantage. Journal of Management 17(1): 99-
120.
Beattie, V. and Thomson, S. (2007) Lifting the lid on the use of the content analysis to investigate IC
disclosures. Accounting Forum 31(2): 129-63.
Bertoni, F., Meoli, M. and Vismara, S. (2014) Board independence, ownership structure and the valuation of
IPOs in Continental Europe. Corporate Governance: An International Review 22(2): 116-131.
Bozzolan, S., Favotto, F. and Ricceri, F. (2003) Italian annual intellectual capital disclosure: An empirical
analysis. Journal of Intellectual Capital 4(4): 543-558.
Branco, M. and Rodrigues, L.L. (2006) Corporate social responsibility and resource based perspectives.
Journal of Business Ethics 69(2): 111-132.

Bukh, P., Nielsen, C., Gormsen, P. and Mouritsen, J. (2005) Disclosure of information on intellectual capital
in Danish IPO prospectuses. Accounting, Auditing & Accountability Journal 18(6): 713-32.
Burgess, Z. and Tharenou, P. (2002) Women board directors: Characteristics of the few. Journal of Business
Ethics 37(1): 39–49.
Cardamone, P., Carnevale, C. and Giunta, F. (2012) The value relevance of social reporting: evidence from
listed Italian companies. Journal of Applied Accounting Research 13(3): 255-269.
Caria, A.A. and Rodrigues, L.L. (2014) The evolution of financial accounting in Portugal since the 1960s: A
new institutional economics perspective. Accounting History 19(1-2): 227-254.
Carter, D.A., Simkins, B.J. and Simpson, W.G. (2003) Corporate governance, board diversity, and firm
value. Financial Review 38: 33–53.
Cerbioni, F. and Parbonetti, A. (2007) Exploring the effects of corporate governance on intellectual capital
disclosure: An analysis of European biotechnology companies. European Accounting Review 16(4): 791
- 826.
Cheng, E. and Courtenay, S.M. (2006) Board composition, regulatory regime and voluntary disclosure.
International Journal of Accounting 41(3): 262-289.
Chow, C.W. and Wong-Boren, A. (1987) Voluntary financial disclosure by Mexican corporations.
Accounting Review 62(3): 533–541.
Comissão do Mercado de Valores Mobiliários, CMVM, (1999) Recommendations on Corporate
Governance. Comissão do Mercado de Valores Mobiliários. Available at: http://www.cmvm.pt
Comissão do Mercado de Valores Mobiliários, CMVM, (2007) Code of Corporate Governance. Comissão
do Mercado de Valores Mobiliários. Available at: http://www.cmvm.pt
Cordazzo, M. (2005) IC statements vs environmental and social reports: an empirical analysis of their
convergences in the Italian context. Journal of Intellectual Capital 6(3): 441-64.
Cormier, D., Ledoux, M. J. and Magnan, M. (2011) The informational contribution of social and
environmental disclosures for investors. Management Decision 49(8): 1276-1304.
Costa, G.A., Oliveira, L.C., Rodrigues, L.L. and Craig, R. (2013) Factors associated with the publication of a
CEO letter. Corporate Communications: An International Journal 18(4): 432-450.

Dechow, P.M., Sloan, R.G. and Sweeney, A.P. (1996) Causes and consequences of earnings manipulation:
An analysis of firms subject to enforcement actions by the SEC. Contemporary Accounting Research
13(1): 1-36.
Dragomir, V.D. (2010) Environmentally sensitive disclosures and financial performance in a European
setting. Journal of Accounting & Organizational Change 6(3): 359-388.
Dye, R. A. (2001) An evaluation of ‘essays on disclosure’ and the disclosure literature in accounting.
Journal of Accounting and Economics 32(1): 181-235.
Eng, L.L. and Mak, Y.T. (2003) Corporate governance and voluntary disclosure. Journal of Accounting and
Public Policy 22(4): 325-345.
European Commission (2006). RICARDIS reporting intellectual capital to augment research, development
and innovation in SMEs, available at: http://ec.europa.eu/invest-in-
research/policy/capital_report_en.htm.
European Commission, EC (2011a) The EU corporate governance framework. Green paper, Brussels,
COM(2011) 164 final, 5 April.
European Commission, EC (2011b) The gender balance in business leadership. Commission Staff Working
Paper. Brussels, SEC(2011) 246 final, 1 March.
European Commission, EC (2012) Women in economic decision-making in the EU: Progress report, A
Europe 2020 initiative. Available at: http://ec.europa.eu/justice/gender-equality/files/women-on-
boards_en.pdf.
European Commission, EC (2013) Gender Balance in Boards. Available at:
http://ec.europa.eu/justice/gender-equality/files/womenonboards/womenonboards-factsheet-pt_en.pdf.
Firer, S. and Williams, S.M. (2005) Firm ownership structure and intellectual capital disclosures. Journal of
Accounting Research 19(1): 1-18.
Forker J.J. (1992) Corporate governance and disclosure quality. Accounting and Business Research 22(1):
111-124.
Gallego-Álvarez, I., Rodríguez-Domínguez, L. and García-Sánchez, I. (2011) Study of some explanatory
factors in the opportunities arising from climate change. Journal of Cleaner Production 19: 912-926.

García-Meca, E., Parra, I., Larrán, M. and Martínez, I. (2005) The explanatory factors of intellectual capital
disclosures to financial analysts. European Accounting Review 14(1): 63-94.
Guerreiro, M.S., Rodrigues, L.L. and Craig, R. (2012) Factors influencing the preparedness of large unlisted
companies to implement adapted International Financial Reporting Standards in Portugal. Journal of
International Accounting, Auditing & Taxation 21(2): 169-184.
Gujarati, D.N. (1995) Basic econometrics. New York, NY: McGraw-Hill.
Gul, F.A. and Leung, S. (2004) Board leadership, outside directors' expertise and voluntary corporate
disclosures. Journal of Accounting and Public Policy 23(5): 351-379.
Guthrie, J., Petty, R., Yongvanich, K. and Ricceri, F. (2004) Using content analysis as a research method to
inquire into intellectual capital reporting. Journal of Intellectual Capital 5(2): 282-293.
Hackston, D. and Milne, M.J. (1996) Some determinants of social and environmental disclosures in New
Zealand companies. Accounting, Auditing & Accountability Journal 9(1): 77-108.
Haniffa, R. and Hudaib, M. (2006) Corporate governance structure and performance of Malaysian listed
companies. Journal of Business Finance & Accounting 33(7‐8): 1034-1062.
Hasseldine, J., Salama, A.I. and Toms, J.S. (2005) Quantity versus quality: the impact of environmental
disclosures on the reputations of UK Plcs. British Accounting Review 37(2): 231-248.
Hidalgo, R.L., García-Meca, E. and Martinez, I. (2011) Corporate governance and intellectual capital
disclosure. Journal of Business Ethics 100(3): 483-495.
Hooghiemstra, R. (2000) Corporate communication and impression management–new perspectives why
companies engage in corporate social reporting. Journal of Business Ethics 27(1-2): 55-68.
Instituto Português de Corporate Governance (IPCG) (2006), White Book on Corporate Governance in
Portugal. Available at: http://www.ecgi.org/codes/code.php?code_id=192, (accessed October 2014).
International Integrated Reporting Council (2011) Towards integrated reporting: communicating value in the
21st century. Available at: http://www.iirc.org
Kanagaretnam, K., Lobo, G.J. and Whalen, D.J. (2007) Does good corporate governance reduce information
asymmetry around quarterly earnings announcement. Journal of Accounting & Public Policy 26(4):
497–522.
Krippendorf, K. (1980) Content Analysis: An Introduction to its Methodology. London, Sage.

La Rosa, F. and Liberatore, G. (2014) Biopharmaceutical and chemical firms’ R&D disclosure, and cost of
equity: The impact of the regulatory regime. European Management Journal 32(5): 806-820.
Li, J., Pike, R. and Haniffa, R. (2008) Intellectual capital disclosure and corporate governance structure in
UK firms. Accounting and Business Research 38(2): 137-159.
Lim, S., Matolcsy, Z. and Chow, D. (2007) The association between board composition and different types
of voluntary disclosure. European Accounting Review 16(3): 555-583.
Lipton, M. and Lorsh, J.W. (1992) A modest proposal for improved corporate governance. Business Lawyer
48(1): 59-77.
Lopes, P. and Rodrigues, L.L. (2007) Accounting for financial instruments: an analysis of the determinants
of disclosure in the Portuguese stock exchange. International Journal of Accounting 42(1): 25-56.
López, F.J. and Morrós, I. (2014) Boards of directors and firm performance: the effect of multiple
directorships. Spanish Journal of Finance and Accounting 43(2): 177-192
Lorsh, J.W. and MacIver, E. (1989) Pawns or Potentates: The Reality of America’s Corporate Boards.
Boston, MA: Harvard Business School Press.
Lückerath-Rovers, M. (2013) Women on boards and firm performance. Journal of Management and
Governance 17: 491-509.
Manolopoulou, E. and Tzelepis, D. (2014) Intellectual capital disclosure: the Greek case. Int. J. Learning
and Intellectual Capital 11(1): 33-51.
Meek, G.K., Roberts, C.B. and Gray, S.J. (1995) Factors influencing voluntary annual report disclosures by
US and UK and Continental European multinational corporations. Journal of International Business
Studies 26(3): 555-572.
Meritum (2002), Proyeto Meritum: Guidelines for Managing and Reporting Intangibles, Meritum, Madrid.
Michelon, G. and Parbonetti, A. (2012) The effect of corporate governance on sustainability disclosure.
Journal of Management & Governance 16(3): 477-509.
Nalikka, A. (2009) Impact of gender diversity on the extent of voluntary disclosure in annual reports.
Journal of Accounting and Taxation 1(1): 101-113.
Nogueira, C., Paúl, C. and Amâncio. L. (1995) Women in management in Portugal: A demographic
overview. In Amâncio, L. and Nogueira, C. (Eds), Gender Management and Science. Braga, Portugal:
Institute of Education and Psychology, University of Minho, pp. 207–218.
OECD (1999) OECD Principles of Corporate Governance. Paris: OECD.
Oliveira, L., Rodrigues, L.L. and Craig, R. (2006) Firm-specific determinants of intangibles reporting:
evidence from Portuguese stock market. Journal of Human Resource Costing and Accounting 10(1): 11-
33.
Oliveira, L., Rodrigues, L.L. and Craig, R. (2010) Intangible assets and value relevance: Evidence from the
Portuguese stock exchange. British Accounting Review 42(4): 241-252.
Oliveira, L., Rodrigues L.L. and Craig, R. (2010) ‘Intellectual Capital Reporting in Sustainability Reports,’
Journal of Intellectual Capital, 11(4): 575-594.
Peasnell, K.V., Pope, P.F. and Young, S. (2005) Board monitoring and earnings management: do outside
directors influence abnormal accruals?. Journal of Business Finance & Accounting 32(7-8): 1311 –
1346.
Pedrini, M. (2007) Human capital convergences in intellectual capital and sustainability reports. Journal of
Intellectual Capital 8(2): 346-66.
Prado, J.M. and García, I.M., (2010) The role of the board of directors in disseminating relevant information
on greenhouse gases. Journal of Business Ethics 97(3): 391-424.
Prado-Lorenzo, J.M., Rodríguez-Domínguez, L., Gallego-Álvarez, I. and García-Sánchez, I.M. (2009)
Factors influencing the disclosure of greenhouse gas emissions in companies world-wide. Management
Decision 47(7): 1133 – 1157.
Rosenstein S. and Wyatt J.G. (1990) Outside directors, board independence and shareholder wealth. Journal
of Financial Economics 26(2): 175-192.
Silva, A.S., Vitorino, A., Alves, C.F., Cunha, J. and Monteiro, M.A. (2006) Livro Branco sobre Corporate
Governance em Portugal. Instituto Português de Corporate Governance, Lisboa.
Singh, I. and Van der Zahn, J.-L. (2008) Determinants of intellectual capital disclosure in prospectuses of
initial public offering. Accounting and Business Research 38(50): 409-31.

Subramaniam, M. and Youndt, M.A. (2005) The influence of intellectual capital on the types of innovative
capabilities. Academy of Management Journal 48(3): 450-463.
Toms, J.S. (2002) Firm resources, quality signals and the determinants of corporate environmental
reputation: some UK evidence. British Accounting Review 34(3): 257-282.
Veprauskaitė, E. and Adams, M. (2013) Do powerful chief executives influence the financial performance of
UK firms?. British Accounting Review 45(3): 229-241.
Wernerfelt, B. (1995) The resource-based view of the firm: Ten years after. Strategic Management Journal
16(3): 171-174.
Xie, B., Davidson, W. and Dadalt, P. (2003) Earning management and corporate governance: The role of the
board and the audit committee. Journal of Corporate Finance 9: 295–315.

Table 1. Frequency of intellectual capital items disclosed by firms
Items Observations
n = 75
(%)
2007-2011
Strategy – 22 items
1. Corporate governance 75 100
2. New products or services and technology 73 97
3. Investments in new business 73 97
4. Strategic alliances or agreements 74 99
5. Acquisitions and mergers 38 51
6. Leadership 65 87
7. Network of suppliers and distributors 73 97
8. Supplier evaluation policy 66 88
9. Image and brand 73 97
10. Corporate culture 68 91
11. Best practices 71 95
12. Organisational structure 71 95
13. Environmental investments 50 67
14. Community involvement 74 99
15. Corporate social responsibility and objective 74 99
16. Shareholders’ structure 62 83
17. Price policy 49 65
18. Business vision, objectives and consistency of strategy 74 99
19. Quality of products and or services 75 100
20. Marketing activities 66 88
21. Stakeholder relationships and or engagement 75 100
22. Risk management 75 100
Processes – 10 items
1. Working environment, safety and hygiene 65 87
2. Internal sharing of knowledge and information 72 96
3. External sharing of knowledge and information 75 100
4. Measure of internal or external failures 40 53
5. Environmental approvals and statements and or policies 55 73
6. Utilisation of energy, raw materials, and other inputs 71 95
7. Efficiency 74 99
8. Business model 43 57
9. Litigations and or law suits and or sanctions 35 47
10. Quality approvals and statements and or policies 68 91
Innovation. research and development – 8 items
1. Policy, strategy and or objectives of IRD activities 74 99
2 IRD expenses 36 48
3 IRD in basic research 37 49
4. IRD in product design and or development 33 44
5. Future IRD projects or IRD projects in progress 35 47
6. Details of firm patents 10 13
7. Patents, licences, papers, etc. 8 11
8. Patents pending 5 7
Technology – 5 items
1. Investments in information technology – description 71 95
2. Information technology systems and facilities 74 99
3. Software assets 55 73
4. Web transactions 34 45
5. Number of visits to the web 1 1
Customers – 14 items
1. Number of customers 38 51
2. Sales by customer 7 9
3. Annual sales per segment or product 73 97
4. Average customer size 4 5
5. Customer relationships 72 96
6. Customer satisfaction and or survey 67 89
7. Education and or training of customers 44 59
8. Customers by employee 5 7
9. Value added per customer or segment 1 1
10. Market share by country and or segment and or product 63 84
11. Relative market share to competitors 48 64
12. Customer seniority and loyalty 40 53

Items Observations
n = 75
(%)
2007-2011
13. Customer complaints 67 89
14. New customers 53 71
Human capital – 29 items
1. Labour and unions 69 92
2. Staff community involvement 45 60
3. Staff entrepreneurship (new ideas) 54 72.
4. Staff by age 69 92
5. Staff by gender 69 92
6. Staff by job function and or business area 64 85
7. Staff by level of education 35 47
8. Staff by geographic area and or country 67 89
9. Staff by type of contract 66 88
10. Staff turnover 63 84
11. Changes in number of employees 66 88
12. Staff health and safety 71 95
13. Absenteeism 59 79
14. Staff interview and or employee survey 57 76
15. Policy on competence development 75 100
16. Description of competence development programs and activities 75 100
17. Education and training policy 72 96
18. Education and training expenses 15 20
19. Education and training hours ÷ number of employees 68 91
20. Employee expenses ÷ number of employees 5 7
21. Recruitment policies 66 88
22. Job rotation opportunities 69 92
23. Career opportunities 75 100
24. Remuneration and evaluation systems 74 99
25. Incentive systems and fringe benefits 67 89
26. Pensions 60 80
27. Value added per employee or production per employee 2 3
28. Employee quality and experience 45 60
29. Management quality and experience 33 44

Table 2. Descriptive statistics for ICI and sub-indexes
2007 2008 2009 2010 2011 2007-2011
Intellectual Capital (ICI)
mean 0.710 0.720 0.724 0.733 0.751 0.728
sd 0.066 0.071 0.082 0.077 0.072 0.073
max 0.841 0.830 0.864 0.875 0.875 0.875
min 0.568 0.602 0.557 0.614 0.602 0.557
Strategy – 22 items
mean 0.903 0.918 0.885 0.903 0.918 0.905
sd 0.071 0.062 0.080 0.087 0.083 0.076
max 1.000 1.000 0.955 1.000 1.000 1.000
min 0.773 0.818 0.727 0.727 0.682 0.682
Processes – 10 items
mean 0.747 0.807 0.787 0.807 0.840 0.797
sd 0.119 0.110 0.113 0.139 0.130 0.123
max 0.900 1.000 1.000 1.000 1.000 1.000
min 0.500 0.600 0.600 0.600 0.700 0.500
Innovation, research and development – 8 items
mean 0.392 0.350 0.383 0.408 0.450 0.397
sd 0.291 0.251 0.273 0.301 0.287 0.275
max 0.875 0.625 1.000 1.000 1.000 1.000
min 0.000 0.125 0.125 0.125 0.125 0.000
Technology – 5 items
mean 0.587 0.627 0.640 0.627 0.653 0.627
sd 0.220 0.128 0.172 0.183 0.160 0.172
max 0.800 0.800 0.800 0.800 0.800 0.800
min 0.000 0.400 0.200 0.200 0.400 0.000
Customers – 14 items
mean 0.543 0.548 0.552 0.557 0.571 0.554
sd 0.132 0.166 0.154 0.153 0.132 0.144
max 0.714 0.786 0.714 0.857 0.857 0.857
min 0.214 0.214 0.214 0.286 0.357 0.214
Human capital – 29 items
mean 0.740 0.743 0.772 0.770 0.779 0.761
sd 0.090 0.076 0.086 0.102 0.101 0.090
max 0.897 0.862 0.897 0.862 0.897 0.897
min 0.586 0.517 0.586 0.517 0.517 0.517
N (observations) 15 15 15 15 15 75

Table 3. Descriptive statistics for independent and control variables
Panel A: Continuous Variables
2007 2008 2009 2010 2011 2007-2011
Board size
mean 14.7 15 15.800 16.300 16.300 15.600
sd 6.9 6.180 6.720 6.500 6.260 6.370
max 30.0 26 27 27 25 30
min 6.0 7 7 8 9 6
Independent directors
mean 0.273 0.264 0.300 0.258 0.292 0.277
sd 0.148 0.139 0.141 0.137 0.131 0.136
max 0.444 0.444 0.500 0.500 0.560 0.560
min 0 0 0 0 0 0
Board Activity
mean 9.47 9.27 12.40 13.50 16.70 12.3
sd 4.09 3.84 10.50 11.30 16.10 10.4
max 18.00 18.00 48.00 50.00 58.00 58.00
min 5.00 5.00 5.00 5.00 5.00 5.00
Gender
mean 0.035 0.026 0.033 0.042 0.062 0.0396
sd 0.087 0.058 0.061 0.071 0.077 0.0707
max 0.333 0.214 0.214 0.267 0.308 0.333
min 0.000 0.000 0.000 0.000 0.000 0.000
Firm size
mean 12847 14450 15134 15849 18612 15378
sd 12885 15089 16211 17491 22906 16882
max 41300 53375 53977 61061 72046 72046
min 802 793 738 728 734 728
Ownership concentration
mean 0.576 0.596 0.610 0.625 0.635 0.608
sd 0.178 0.191 0.174 0.163 0.178 0.173
max 0.777 0.812 0.770 0.844 0.844 0.844
min 0.099 0.099 0.169 0.286 0.174 0.099
N (observations) 15 15 15 15 15 75
Panel B: Dummy Variables No Yes No Yes No Yes No Yes No Yes No Yes
CEO duality
Frequency 10 5 12 3 12 3 11 4 13 2 58 17
Percentage (%) 67 33 80 20 80 20 73 27 87 13 77 23
Latin or Continental governance
Frequency 8 7 9 6 9 6 9 6 9 6 44 31
Percentage (%) 53 47 60 40 60 40 60 40 60 40 59 41
Anglo-Saxon governance
Frequency 9 6 8 7 8 7 8 7 8 7 41 34
Percentage (%) 60 40 53 47 53 47 5 47 53 47 55 45
Dual governance
Frequency 13 2 13 2 13 2 13 2 13 2 65 10
Percentage (%) 87 13 87 13 87 13 87 13 87 13 87 13
High intangibles intensive industries
Frequency 9 6 9 6 9 6 9 6 9 6 45 30
Percentage (%) 60 40 60 40 60 40 60 40 60 40 60 40
Listing on sustainability indexes
Frequency 12 3 11 4 11 4 11 4 10 5 55 20
Percentage (%) 80 20 73 27 73 27 73 27 67 33 73 27
N (observations) 15 15 15 15 15 75

Table 4. Correlations (Pearson and Spearman)
[1] [2] [3] [4] [5] [6] [7] [8] [9] [10] [11] [12] [13] [14] [15] [16] [17] [18] [19] [20] [21] [22] [23] [24]
[1] Intellectual Capital 1.00 0.57** 0.53** 0.73** 0.21 0.67** 0.64** 0.29* -0.10 0.32** -0.24* -0.02 0.13 0.12 0.27* -0.19 -0.18 0.27* 0.00 -0.12 -0.05 -0.02 0.03 0.16
[2] Strategy 0.60** 1.00 0.25* 0.34** -0.11 0.54** -0.03 -0.13 -0.16 0.11 -0.34** 0.06 0.24* -0.04 -0.21 -0.01 -0.42** 0.09 0.37** -0.02 0.08 -0.14 -0.02 0.08
[3] Processes 0.52** 0.24* 1.00 0.35** -0.06 0.25* 0.21 -0.05 -0.02 0.02 -0.07 -0.15 -0.03 0.08 0.09 0.09 0.09 -0.09 -0.03 -0.21 0.04 -0.04 0.04 0.17
[4] Innovation 0.73** 0.42** 0.34** 1.00 -0.11 0.21 0.44** 0.16 -0.17 0.27* -0.06 0.11 0.12 -0.31** 0.31** 0.02 -0.02 0.00 0.02 -0.01 -0.09 -0.02 0.02 0.10
[5] Technology 0.11 -0.21 -0.12 -0.19 1.00 0.37** 0.11 0.20 0.20 0.14 -0.05 0.11 0.23* 0.45** 0.26* -0.29* -0.08 0.21 -0.07 -0.12 0.00 0.04 0.00 0.08
[6] Customers 0.68** 0.52** 0.29* 0.22 0.26* 1.00 0.10 0.17 -0.04 0.13 -0.46** -0.15 0.29* 0.40** 0.01 -0.29* -0.44** 0.36** 0.19 -0.04 -0.02 -0.01 0.01 0.06
[7] Human capital 0.60** 0.04 0.13 0.44** 0.19 0.10 1.00 0.47** -0.03 0.34** 0.07 -0.03 -0.21 0.09 0.39** -0.19 0.17 0.29* -0.37** -0.12 -0.10 0.06 0.05 0.10
[8] Board size (log) 0.24* -0.17 -0.07 0.14 0.20 0.14 0.50** 1.00 0.25* 0.33** -0.31** -0.07 0.24* 0.35** 0.55** -0.49** 0.32** 0.41** -0.60** -0.10 -0.05 0.01 0.06 0.07
[9] Independent directors -0.07 -0.06 -0.02 -0.11 0.16 0.01 0.02 0.11 1.00 -0.02 -0.09 0.04 0.46** -0.04 0.17 -0.44** 0.25* 0.28* -0.45** -0.02 -0.05 0.08 -0.07 0.05
[10] Board activity (log) 0.25* 0.07 0.02 0.28* 0.08 0.09 0.34** 0.32** -0.11 1.00 0.15 -0.10 0.01 0.08 0.25* -0.30** -0.13 0.44** -0.17 -0.12 -0.14 0.01 0.07 0.18
[11] CEO duality -0.26* -0.29* -0.07 -0.06 0.04 -0.42** 0.06 -0.27* -0.05 0.25* 1.00 -0.12 -0.44** -0.12 0.11 0.22 0.15 -0.21 0.00 0.13 -0.03 -0.03 0.05 -0.11
[12] Gender 0.06 0.06 -0.12 0.03 0.25* 0.01 0.02 0.10 0.09 -0.10 -0.28* 1.00 0.15 -0.10 -0.16 0.07 0.02 -0.08 0.03 -0.04 -0.10 -0.05 0.02 0.16
[13] Size (log) 0.06 0.18 -0.07 0.07 0.05 0.19 -0.09 0.24* 0.55** -0.04 -0.41** 0.12 1.00 0.07 0.09 -0.53** 0.08 0.22 -0.24* -0.05 0.00 0.00 0.01 0.04
[14] Industry 0.07 -0.12 0.07 -0.35** 0.46** 0.38** 0.06 0.34** -0.10 0.12 -0.12 0.06 0.04 1.00 0.12 -0.31** 0.08 0.08 -0.13 0.00 0.00 0.00 0.00 0.00
[15] Listing on sustainability indexes 0.23 -0.09 0.06 0.29* 0.26* 0.03 0.42** 0.55** 0.16 0.21 0.11 -0.06 0.10 0.12 1.00 -0.34** 0.36** 0.12 -0.44** -0.08 0.00 0.00 0.00 0.08
[16] Ownership concentration -0.04 0.08 0.17 0.05 -0.33** -0.20 -0.15 -0.42** -0.52** -0.09 0.19 -0.06 -0.68** -0.29* -0.46** 1.00 0.08 -0.80** 0.47** -0.09 -0.03 0.00 0.05 0.08
[17] Anglo-Saxon governance model -0.23 -0.38** 0.07 -0.05 -0.04 -0.41** 0.17 0.34** 0.18 -0.05 0.15 -0.09 0.14 0.08 0.36** -0.11 1.00 -0.36** -0.76** -0.05 0.01 0.01 0.01 0.01
[18] Dual governance model 0.30** 0.06 -0.09 0.02 0.24* 0.41** 0.32** 0.37** 0.30** 0.29* -0.21 0.05 0.27* 0.08 0.12 -0.59** -0.36** 1.00 -0.33** 0.00 0.00 0.00 0.00 0.00
[19] Latin governance model 0.02 0.35** -0.01 0.04 -0.12 0.13 -0.39** -0.60** -0.39** -0.14 0.00 0.05 -0.33** -0.13 -0.44** 0.51** -0.76** -0.33** 1.00 0.05 -0.01 -0.01 -0.01 -0.01
[20] 2007 -0.13 -0.04 -0.18 -0.02 -0.08 -0.04 -0.14 -0.12 0.02 -0.11 0.13 -0.12 -0.06 0.00 -0.08 -0.12 -0.05 0.00 0.05 1.00 -0.25* -0.25* -0.25* -0.25*
[21] 2008 -0.05 0.07 0.05 -0.08 -0.04 0.00 -0.14 -0.05 -0.03 -0.10 -0.03 -0.14 0.00 0.00 0.00 -0.04 0.01 0.00 -0.01 -0.25* 1.00 -0.25* -0.25* -0.25*
[22] 2009 -0.01 -0.14 -0.03 -0.02 0.05 0.03 0.06 0.02 0.07 0.02 -0.03 -0.06 0.00 0.00 0.00 0.03 0.01 0.00 -0.01 -0.25* -0.25* 1.00 -0.25* -0.25*
[23] 2010 0.02 0.01 0.01 0.02 0.01 -0.01 0.08 0.07 -0.08 0.06 0.05 0.03 0.02 0.00 0.00 0.03 0.01 0.00 -0.01 -0.25* -0.25* -0.25* 1.00 -0.25*
[24] 2011 0.17 0.10 0.15 0.11 0.07 0.02 0.15 0.08 0.01 0.13 -0.11 0.29* 0.04 0.00 0.08 0.10 0.01 0.00 -0.01 -0.25* -0.25* -0.25* -0.25* 1.00
NOTE: Pearson correlation coefficients are above the diagonal (shown in bold). Spearman correlation coefficients are below the diagonal.
** Significant at the 0.01 level (two-tailed). * Significant at the 0.05 level (two-tailed).

36
Table 5. Regression Models
Independent variables Hypothesis Predicted
sign
Model 1
(robust)
Model 2
(robust)
Model 3
(robust)
Model 4
(robust)
b
(t)
b
(t)
b
(t)
b
(t)
(Constant)
0.565*** (6.45)
0.036 (0.13)
-1.031** (-2.72)
-1.095* (-2.60)
Board size (log) H1a + 0.038
(1.29)
0.446*
(2.14)
1.055***
(3.93)
1.093***
(3. 72)
Board size2 (log) H1b - -0.077† (-1.89)
-0.204*** (-3.97)
-0.212*** (-3. 77)
Independent directors H2 ? -0.071
(-1.16)
-0.087
(-1.43)
-0.148*
(-2.22)
-0.151*
(-2. 18)
Board Activity (log) H3 + 0.033*
(2.41)
0.036*
(2.54)
0.029†
(1.91)
0.030†
(1.79)
CEO duality H4 - -0.035 (-1.63)
-0.037† (-1.72)
-0.035 (-1.64)
-0.036 (-1. 64)
Gender H5 + 0.006
(0.07)
-0.027
(-0.31)
-0.049
(-0.56)
-0.053
(-0. 58)
Latin Corporate Governance Model H6 + 0.022
(0.94)
0.020
(0.83)
0.018
(0.81)
0.017
(0.72)
Dual Corporate Governance Model H6 + 0.024 (0.92)
0.024 (0.88)
0.120* (2.23)
0.127* (2.25)
Size (log) + 0.024*
(2.17)
0.026*
(2. 14)
Industry + 0.058**
(2.96)
0.060**
(2. 87)
Listing on sustainability indexes + 0.088***
(3.82) 0.091***
(3. 60)
Ownership concentration - 0.210
(1.67)
0.231†
(1.70)
2008 -0.014 (-0.70)
2009 -0.010
(-0.41)
2010 -0.014
(-0.57)
2011
-0.010 (-0.36)
N 75 75 75 75
R-squared 0.236 0.260 0.426 0.430 Durbin-Watson 2.269 2.216 2.253 2.252
F test
(p-value)
5.331***
(0.000)
5.23***
(0.000)
5.555***
(0.000)
4.021***
(0.000) Ramsey Reset test
(p-value)
0.09
(0.967)
0.58
(0.629)
0.69
(0.564)
0.75
(0.526)
NOTE: †p<0.10; *p<0.05; **p<0.01; ***p<0.001
Model 1: Pooled OLS (Indep. variables). Model 2: Pooled OLS (Indep. variables with board size and board size squared). Model 3: Pooled
OLS (Indep. Variables, with board size and board size squared, and control variables). Model 4: Pooled OLS (Indep. Variables, with board
size and board size squared, control variables and time-effect).

37
Table 6. Regression Model 4 for sub-indexes
Independent variables Hypothesis Predicte
d sign
Strategy
(robust)
Processes
(robust)
Innovatio
n (robust)
Technology
(robust)
Customers
(robust)
Human
Capital
(robust)
b
(t)
b
(t)
b
(t)
b
(t)
b
(t)
b
(t)
(Constant)
0.587 (1.22)
-1.718† (-1.75)
-4.912** (-3.17)
-0.303 (-0.27)
-1.391* (-2.01)
-1.096* (-2.06)
Board size (log) H1a + 0.004
(0.01)
1.830**
(2.98)
3.281**
(3.18)
-0.108
(-0.13)
0.726
(1.48)
1.446***
(3.94)
Board size2 (log) H1b - -0.006 (-0.08)
-0.378** (-3.24)
-0.611** (-3.03)
0.003 (0.02)
-0.153 (-1.64)
-0.267*** (-3.86)
Independent directors H2 ? -0.061
(-0.85)
-0.078
(-0.61)
-0.799**
(-3.38)
0.275*
(2.02)
-0.092
(-0.87)
-0.169*
(-2.09)
Board Activity (log) H3 + 0.031†
(1.91)
0.030
(0.95)
0.141*
(2.47)
-0.008
(-0.23)
-0.001
(-0.04)
0.019
(0.97)
CEO duality H4 - -0.050† (-1.93)
-0.076 (-1.65)
-0.047 (-0.59)
0.050 (1.04)
-0.098* (-2.62)
0.007 (0.27)
Gender H5 + -0.012
(-0.1)
-0.427*
(-2.42)
0.236
(0.77)
0.469**
(2.84)
-0.357*
(-2.59)
0.023
(0.2) Latin Corporate
Governance Model H6 +
0.051*
(2.23)
-0.059
(-1.57)
0.062
(0.85)
0.067
(1.47)
0.092**
(2.68)
-0.040
(-1.46)
Dual Corporate Governance Model
H6 + 0.057 (1.02)
0.047 (0.46)
-0.004 (-0.02)
0.355** (3.07)
0.411*** (5.08)
0.066 (1.23)
Size (log) + 0.023*
(2.00)
0.018
(0.76)
0.089*
(2.18)
0.052**
(2.01)
0.065**
(3.31)
-0.011
(-0.92)
Industry + 0.006
(0.27)
0.118**
(3.24)
-0.121
(-1.62)
0.229***
(5.78)
0.191***
(5.33)
0.040†
(1.73)
Listing on sustainability
indexes +
0.006
(0.21)
0.107†
(1.99)
0.286**
(3.35)
0.186**
(2.69)
0.126**
(3.35)
0.062**
(2.73)
Ownership concentration - 0.121
(0.81)
0.221
(0.89)
0.194
(0.39)
0.672*
(2.62)
0.694**
(3.46)
0.028
(0.21)
2008 0.007 (0.33)
0.022 (0.51)
-0.102 (-1.27)
0.030 (0.53)
-0.038 (-1.14)
-0.015 (-0.54)
2009 -0.029
(-1.19)
0.011
(0.24)
-0.067
(-0.79)
0.026
(0.43)
-0.031
(-0.86)
0.018
(0.59)
2010 -0.014
(-0.58)
0.031
(0.6)
-0.101
(-1.13)
0.009
(0.14)
-0.033
(-0.87)
0.001
(0.02)
2011
-0.010 (-0.31)
0.048 (0.87)
-0.096 (-1.04)
0.003 (0.06)
-0.041 (-0.95)
0.006 (0.16)
N 75 75 75 75 75 75
R-squared 0.393 0.288 0.499 0.459 0.661 0.550
Durbin-Watson 1.79 2.335 2.115 1.839 2.122 2.156 F test
(p-value) 3.30*** 2.16* 4.66*** 7.28*** 8.23*** 5.24***
Ramsey Reset test (p-value)
0.72
(0.544) 0.46
(0.709) 5.82
(0.002) 11.88
(0.000) 5.88
(0.001) 0.24
(0.865)
NOTE: †p<0.10; *p<0.05; **p<0.01; ***p<0.001
Model 4: Pooled OLS (Indep. Variables, with board size and board size squared, control variables and time-effect).

38
Appendix. Sample companies and industry
Banif –Banco Internacional do Funchal Financial
BCP – Banco Comercial Português Financial
BES –Banco Espírito Santo Financial
BPI – Banco Português de Investimento Financial
Brisa Industrials
Cimpor Industrials
EDP Utilities
Galp Oil &Gas
J. Martins Consumer Services
M.Engil Industrials
Portucel Basic materials
PT-Telecom Telecommunications
REN Utilities
Sonae Consumer Services
Sonaecom Telecommunications