corner crack effect on the seismic behavior of steel plate ... · in the steel shear wall system,...
TRANSCRIPT

Civil Engineering Infrastructures Journal, 50(2): 311 – 332, December 2017
Print ISSN: 2322-2093; Online ISSN: 2423-6691
DOI: 10.7508/ceij.2017.02.007
* Corresponding author E-mail: [email protected]
311
Corner Crack Effect on the Seismic Behavior of Steel Plate Shear Wall
System
Broujerdian, V.1*, Shayanfar, M.A.2 and Ghamari, A.3
1 Assistant Professor, Department of Civil Engineering, Faculty, Iran University of Science
and Technology, Tehran, Iran. 2 Associate Professor, Department of Civil Engineering, Faculty, Iran University of Science
and Technology, Tehran, Iran. 3 Ph.D. Candidate, Department of Civil Engineering, Faculty, Iran University of Science
and Technology, Tehran, Iran.
Received: 24 Dec. 2016; Revised: 18 Jul. 2017; Accepted: 25 Jul. 2017
ABSTRACT: Although, experimental studies have reported fracture at the corner of Steel
Plate Shear Walls (SPSW), no study has been performed to investigate the crack effect, yet.
Therefore, in this paper, the effect of crack at the corner of SPSWs on the seismic behavior
of the system was investigated. Two probable cracks, that have been studies at the corner of
SPSWs utilizing extended Finite Element method based on cohesive crack approach, are
initial horizontal crack and initial vertical crack. Numerical results indicated that small initial
crack does not have considerable effect on the seismic behavior of SPSW. In addition, the
horizontal crack is more effective than vertical crack. Since SPSWs with long initial
horizontal crack are ruptured suddenly, so they could not be utilized as a lateral resisting in
seismic zone. Nevertheless, no ruptures occur in SPSWs with vertical cracks. Therefore,
SPSWs with horizontal crack must be repaired, but no repairing is needed in SPSWs with
initial vertical cracks.
Keywords: Crack, Extended Finite Element Method, Response Modification Factor, Seismic
Behavior, Steel Shear Wall.
INTRODUCTION
Steel Plate Shear Wall (SPSW) is a lateral
load bearing system which has shown a good
behavior in past earthquakes, and its
performance is corroborated by numerical
and experimental studies (Hatami et al., 2012;
Abdollahzadeh et al., 2017). In addition to its
ductile behavior, considerable stiffness and
strength of steel shear wall has made it
technically and economically suitable to be
used as a load bearing system in different
structures all over the world (Driver et al.,
1998; Abdollahzadeh and Malekzadeh,
2013). However, a constructional problem
could weaken this system and change its
behavior to a brittle one.
The main function of SPSW is to resist
horizontal story shear and overturning
moment engendered by lateral loads (Astane-
Asl, 2001). In general, SPSW system is
consisted of a steel plate wall (infill steel
plate), two boundary columns (VBE) and
horizontal floor beams (HBE) shown in

Broujerdian, V. et al.
312
Figure 1. The infill steel plate connects to the
VBEs and HBEs surrounding it by a Fishplate
as shown in Figure 1. In other words,
Fishplates are used along boundary frame
members to connect infill plate to the beams
and columns. The Bolted or Fillet weld can be
utilized to contact the infill plate to the
Fishplate, but only weld can be utilized to
contact the Fishplate to the boundary
elements, HBE and VBE. Since Fishplate and
infill plate have low thickness, the welding
between the Fishplate and boundary elements
is susceptible to crack. In other words, crack
between the Fishplate and boundary element
is undeniable. The main flaw is that repairing
the recognized crack is very difficult, because
removing the injured weld and welding the
thin plate again cannot result to a good quality
of fabrication. Therefore, investigated in this
study, it is important to know what kind of
crack is crucial between Fishplate and
boundary elements.
The quality of real fabrication on the civil
projects is much lower than experimental test
fabrication. However, experimental studies
are carefully performed with high quality of
fabrication, to prevent fracture, fracture of
welding or crack propagation in welds have
occurred in several testing (Guendel et al.,
2011; Dubina and Dinu, 2014;
Shekastehband et al., 2017). Therefore, it is
expected that crack propagation on real
SPSWs under real seismic loading be
evaluated more. Though, by taking care of
fabrication, some of experiments have failed
due to crack propagation in the weld or infill
plate, cracked SPSW have not yet been
comprehensively investigated. Although a
great deal of research is devoted to crack
analysis of steel plates, none of them
simulates the steel shear wall boundary
conditions.
Fig. 1. Shop-welded, field-bolted steel plate shear walls (Astane-Asl, 2001)

Civil Engineering Infrastructures Journal, 50(2): 311 – 332, December 2017
313
Till now, cracked SPSW has been studied
by authors for crack propagation at mid
height (corner and central crack) of infill steel
plate when two separate plates are utilized as
infill steel plate (Broujerdian et al., 2016).
Results showed that seismic behavior of shear
wall would be affected by the crack growth.
Also, more studies are required to investigate
complete effects of the cracks on the behavior
of SPSWs.
Considering a steel plate under pure shear,
where the shear loading reaches a certain
value, the plate buckles under the induced
diagonal compressive stresses, and it shows
an out-of-plane deformation. In the steel
shear wall system, plate buckling is usually
the dominant mode of failure. Therefore, the
influence of cracks on the buckling and load
bearing capacity of thin-walled panels must
be investigated and considered in the design
process.
Sih and lee (1968) investigated the
behavior of cracked plate under tensile and
compressive axial loads. They showed that as
crack length increases, pre-buckling capacity
of plate reduces. Shaw and Huang (1990)
studied the buckling behavior of cracked
plate under tensile force using Finite Element
method (Shaw and Huang, 1990). In that
study, the effect of crack length, boundary
conditions and biaxial loading were
investigated. Riks et al. (1992) investigated
buckling and post-buckling behavior of
cracked plate under tensile load using Finite
Element method. According to their results,
changing the post-buckling shape would
result in stress accumulation at the tip of
crack. This accumulation is intensified as the
crack length increases. In line with that
research, several studies have been conducted
into the effect of cracks on thin panels under
pure shear (Dubina, and Dinu, 2014), axial
compression (Bert and Devarakonda, 2003)
and axial tension (Brighenti, 2005).
As pointed before, previous studies mainly
focus on the behavior of individual plates out
of the structure. Therefore, the effects of
crack in the connection of shear plate to
boundary element (beam and column) on the
behavior of a complete steel shear wall
system and its seismic design parameters
have not been considered yet. In this study,
the effect of cracks in steel shear walls on the
overall behavior of structures is considered.
For this purpose, the Extended Finite Element
Method (XFEM) is used. Belytschko et al.
(2003) originally proposed this method.
XFEM has become increasingly popular to
solve different fracture problems (Xie et al.,
2016; Nasirmanesh, and Mohammadi, 2017;
Campilho et al., 2011; Golewski et al., 2012;
Wang et al., 2012).
METHOD OF STUDY
In this paper, the effect of cracks at the corner
of shear walls as the probable cracks is
investigated numerically. All studies are
performed numerically using XFEM. Since
the base material is steel, which is a ductile
material, the crack is modeled as a cohesive
one based on Dugdale model (Belytschko et
al., 2003). Due to the geometric nonlinearity
of SPSW arising from its low thickness,
compatibility and equilibrium equations are
formulated based on large deformation
assumption. To simulate the material
nonlinearity, the elastic-plastic behavior with
yield surface of von Mises yield criterion is
used. ANSYS software (ANSYS, 2016) is
used in combination with ABAQUS (Hibbitt
et al., 2012) to accelerate the modeling and
analysis process. The path of crack growth is
detected in ABAQUS using Solid elements,
and then all elements are simulated in the
form of Shell in ANSYS by utilizing APDL
capability. The main aim is to determine
elastic and inelastic behavior of SPSW due to
crack at the corner of the system. Therefore,
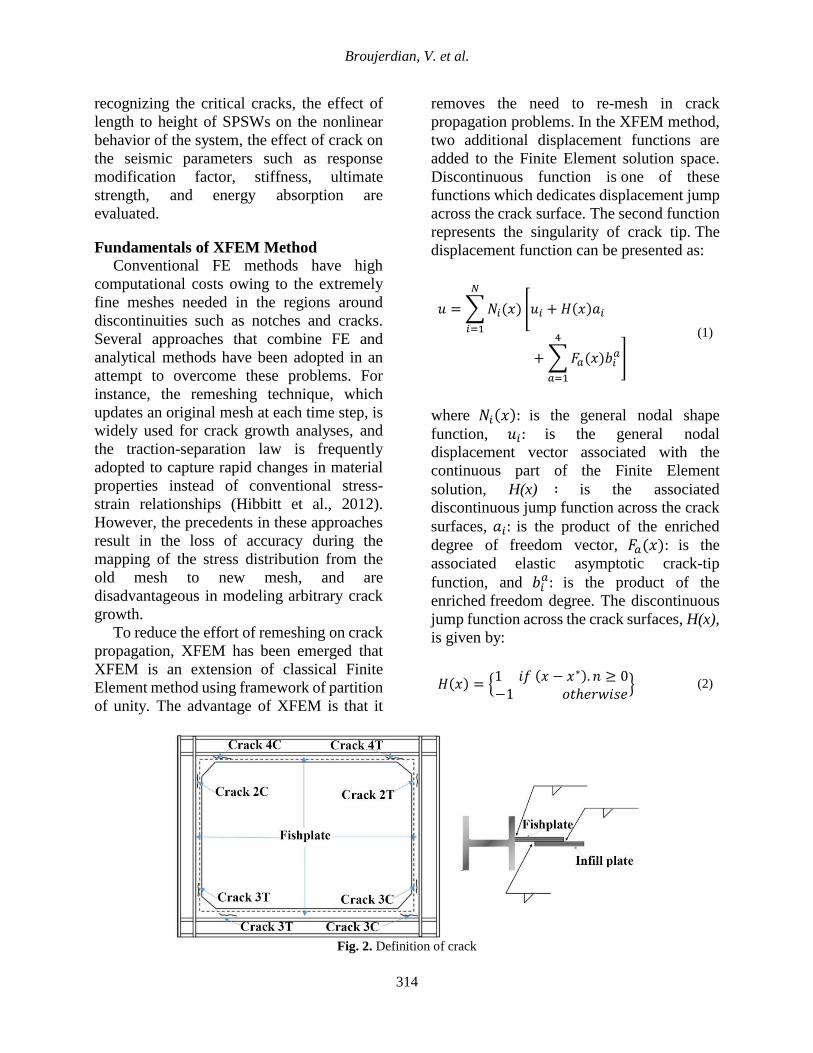
the critical probable cracks, Figure 2, are
recognized; horizontal or vertical cracks. In
addition, the effect of initial crack length,
Broujerdian, V. et al.
314
recognizing the critical cracks, the effect of
length to height of SPSWs on the nonlinear
behavior of the system, the effect of crack on
the seismic parameters such as response
modification factor, stiffness, ultimate
strength, and energy absorption are
evaluated.
Fundamentals of XFEM Method
Conventional FE methods have high
computational costs owing to the extremely
fine meshes needed in the regions around
discontinuities such as notches and cracks.
Several approaches that combine FE and
analytical methods have been adopted in an
attempt to overcome these problems. For
instance, the remeshing technique, which
updates an original mesh at each time step, is
widely used for crack growth analyses, and
the traction-separation law is frequently
adopted to capture rapid changes in material
properties instead of conventional stress-
strain relationships (Hibbitt et al., 2012).
However, the precedents in these approaches
result in the loss of accuracy during the
mapping of the stress distribution from the
old mesh to new mesh, and are
disadvantageous in modeling arbitrary crack
growth.
To reduce the effort of remeshing on crack
propagation, XFEM has been emerged that
XFEM is an extension of classical Finite
Element method using framework of partition
of unity. The advantage of XFEM is that it
removes the need to re-mesh in crack
propagation problems. In the XFEM method,
two additional displacement functions are
added to the Finite Element solution space.
Discontinuous function is one of these
functions which dedicates displacement jump
across the crack surface. The second function
represents the singularity of crack tip. The
displacement function can be presented as:
𝑢 =∑𝑁𝑖(𝑥) [𝑢𝑖 +𝐻(𝑥)𝑎𝑖
𝑁
𝑖=1
+∑𝐹𝑎(𝑥)𝑏𝑖𝑎
4
𝑎=1
]
(1)
where 𝑁𝑖(𝑥): is the general nodal shape
function, 𝑢𝑖: is the general nodal
displacement vector associated with the
continuous part of the Finite Element
solution, H(x) ∶ is the associated
discontinuous jump function across the crack
surfaces, 𝑎𝑖: is the product of the enriched
degree of freedom vector, 𝐹𝑎(𝑥): is the
associated elastic asymptotic crack-tip
function, and 𝑏𝑖𝑎: is the product of the
enriched freedom degree. The discontinuous
jump function across the crack surfaces, H(x),
is given by:
𝐻(𝑥) = 1 𝑖𝑓 (𝑥 − 𝑥∗). 𝑛 ≥ 0−1 𝑜𝑡ℎ𝑒𝑟𝑤𝑖𝑠𝑒
(2)
Fig. 2. Definition of crack

Civil Engineering Infrastructures Journal, 50(2): 311 – 332, December 2017
315
where, x: is a sample (Gauss) point, x*: is the
point on the crack closest to x, and n: is the
unit outward normal to the crack at x*. In an
isotropic elastic material, 𝐹𝑎(𝑥) is given by:
𝐹𝑎(𝑥) = [√𝑟 sin
𝜃
2, √𝑟 cos
𝜃
2,
√𝑟 sin𝜃 sin𝜃
2, √𝑟 sin𝜃 cos
𝜃
2
] (3)
where (𝑟, 𝜃): is a polar coordinate system
with its origin at the crack tip. 𝜃 = 0 is
tangent to the crack at the tip and √𝑟 sin𝜃
2
represents the discontinuity across the crack
surfaces. Cohesive segment method is based
on the cohesive elements with traction-
separation behavior, which is given by:
𝑡 =
𝑡𝑠𝑡𝑛𝑡𝑡
= [
𝐾𝑠𝑠 0 00 𝐾𝑛𝑛 00 0 𝐾𝑡𝑡
]
𝛿𝑠𝛿𝑛𝛿𝑡
= 𝐾𝛿 (4)
where t, the nominal traction stress vector,
consists of three components: 𝑡𝑠 , 𝑡𝑛 , and 𝑡𝑡with corresponding displacements of 𝛿𝑠, 𝛿𝑛,
and 𝛿𝑡 (Hibbitt et al., 2012).
XFEM Method in ABAQUS Software
ABAQUS software (Hibbitt et al., 2012)
allows implementing XFEM in both static
and dynamic problems. In
dynamic problems, only the use of implicit
dynamic analysis procedure is possible. Two
different methods are provided in ABAQUS
in order to determine the initial position of
crack. In the first method, user defines the
initial crack. This is the method which is used
in the present work to determine the initial
crack position. In the second method, the
software determines the initial crack during
the analysis based on the maximum stress or
principal strain criterion. After determining
the initial crack, crack propagation occurs in
a direction that the stress or principal strain is
greater than the maximum damage
value defined to the software. It is
noteworthy that the user defines crack
occurrence condition and crack growth
condition as the damage initiation criteria and
damage evolution law, respectively (Hibbitt
et al., 2012). In this study, maximum
principal stress damage, Maxps, is used as the
crack initiation criterion, and energy-based
damage evolution law based on a power law
criterion is used as a measure of crack growth.
The Abaqus ductile fracture material
model is based on phenomenological
criterion for predicting the onset of damage
due to nucleation, growth, and coalescence of
voids. The criterion for fracture initiation is
met when the following condition is satisfied:
1( )
pl
D pl
D
d
(5)
where the damage parameter 𝜔𝐷: is a state
variable increasing monotonically with
plastic deformation. It is zero for undamaged
material and equals one for totally damaged
material. The model assumes that the
equivalent plastic strain at the onset of
fracture 𝑑𝜀𝑝𝑖
𝜀𝐷𝑝𝑖(𝜂)
is a function of triaxiality η
defined as Eq. (6).
𝜂 = −𝑝
𝑞 (6)
where p: is the hydrostatic stress, and q is the
Mises equivalent stress. The equivalent
plastic strain function 𝑑𝜀𝑝𝑖
𝜀𝐷𝑝𝑖(𝜂)
was described by
Johnson-Cook model (Johnson and Cook,
1983):
3
1 2
Dpl
D D D e
(7)
where coefficients D1, D2 and D3 need to be
determined. The integration of damage

Broujerdian, V. et al.
316
parameter 𝜔𝐷 was evaluated numerically for
all estimated sets of coefficients Di.
Mesh Sensitivity and Buckling Analysis
The linear analysis option of the FE
program was incorporated to predict the
elastic shear buckling stress of perfect
uncracked shear wall having a uniform mesh
distribution. The Eigen-buckling method of
this package and its ‘‘Shell’’ element were
used as basic concepts. This four-node
quadrilateral shell element is capable of
modeling elastic behavior and can simulate
both membrane and flexural behaviors. In
addition, it has three rotational and three
translational degrees of freedom per node.
Regarding the convergence study and
verification of results, panels were divided
into sufficient number of elements to allow
for the development of shear buckling modes
and displacements. The elastic buckling shear
stress values derived from numerical analyses
were compared to those obtained from Eq.
(8).
𝜏𝑐𝑟 =𝐾𝑣𝜋
2𝐸
12(1 − 𝜈 2) (8)
𝐾𝜈 =
5.34 +4
(𝑑/𝑏)2 𝑑/𝑏 ≤ 1
4 +5.34
(𝑑/𝑏)2 𝑑/𝑏 > 1
(9)
where E, b and d : are the modulus of
elasticity, length of plate and height of plate,
respectively (Basler, 1961).
Figure 3 shows the variation of percentage
errors obtained by comparing the Finite
Element analysis results to the theoretical
value for different number of incorporated
elements. According to the results presented
in Figure 3, the models with a mesh
refinement of 30×30 (900 elements)
produced results that were in good agreement
with the theory and was therefore used as the
minimum requirement.
The Finite Element modeling and analysis
of cracked shear wall involve maximizing the
precision associated with the calculation of
stresses and displacements near cracks and
the local effects imposed by the cracks on the
overall response of panels. The first obvious
solution to increase precision was to use
denser Finite Element meshing near the
cracks. Therefore, for meshing purposes, the
panels were divided into three zones, namely
the ‘‘crack tips’’ along the ‘‘crack sides’’ and
‘‘away’’ from the cracks.
Fig. 3. Convergence studies and mesh sensitivity in uncracked
0
10
20
30
40
50
60
0 250 500 750 1000 1250 1500 1750 2000
% E
rro
r
Number of elemnts
Uncracked shear
wall
Cracked shear wall

Civil Engineering Infrastructures Journal, 50(2): 311 – 332, December 2017
317
These divisions were suggested for
assigning different mesh densities for zones
relative to the position of cracks. According
to a study conducted by Alinia and his
colleagues (Alinia et al., 2007) due to stress
concentration, very dense meshing is utilized
near the crack tips. The element sizes were
then gradually increased to the optimum size
of uncracked panels as they parted away from
cracks.
Verification of Numerical Modeling
Process
For validating the numerical modeling
process, the results of two experimental
models, consisting of a SPSW without crack
and a cracked steel plate, are compared
to Finite Element modeling results. In the
Finite Element model, shell element is used
to all components of shear wall. The elements
are meshed in a way that the nodes of the
beam, columns and steel plate elements
coincide. For a more tangled connection,
nodes in one spot are merged. It must be
noted that the probable constructional
imperfection of steel shear wall is considered
as a multiple of the first mode shape of
buckling obtained by an elastic buckling
analysis.
Numerical Modeling of Steel Full-Plate
Shear Wall without Crack
The experimental report by Driver and co-
workers (Driver et al., 1998), shown in Figure
4a, is considered as a benchmark to validate
ANSYS Finite Element modeling of steel
shear wall system without crack. The loading
contains cyclic lateral forces off at each story
level and two gravitational loads of “P” on
top of the columns. The mechanical property
of each component is reported in the
aforementioned reference. The yield stress
and stress-strain curves were extracted and
defined to the software for each element.
P- Δ effect is considered in the analysis. The
load-displacement curve of the first floor
extracted from the experimental hysteresis
curve is compared to the obtained numerical
one in Figure 4b. As it can be seen, there is a
good accordance.
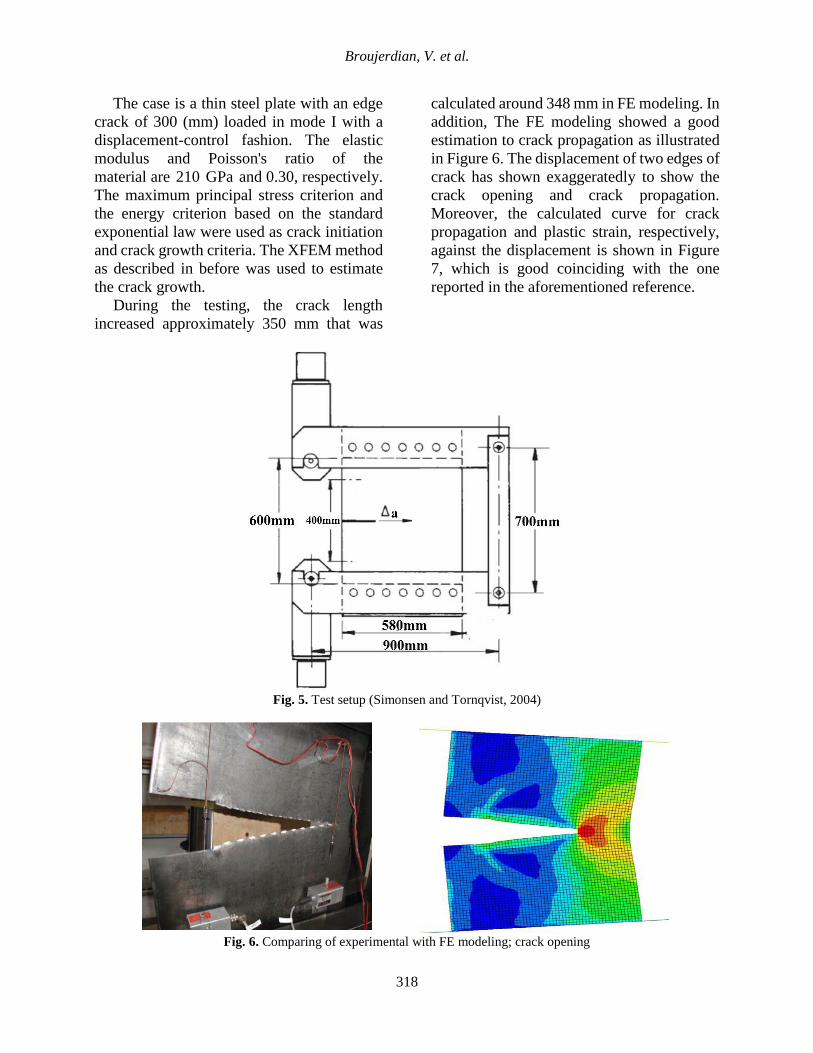
Numerical Modeling of Cracked Plate
To validate the crack growth process
modeling, an experimental test program
(Simonsen and Tornqvist, 2004) was
considered as illustrated in Figure 5.
(a) (b) Fig. 4. Steel Plate shear wall system without crack: a) Test setup (Driver, 1998), b) Load–displacement response
0
500
1000
1500
2000
2500
3000
3500
0 10 20 30 40 50 60 70
Bas
e s
he
ar (
kN)
Displacement (mm)
Test results
FEM
Broujerdian, V. et al.
318
The case is a thin steel plate with an edge
crack of 300 (mm) loaded in mode I with a
displacement-control fashion. The elastic
modulus and Poisson's ratio of the
material are 210 GPa and 0.30, respectively.
The maximum principal stress criterion and
the energy criterion based on the standard
exponential law were used as crack initiation
and crack growth criteria. The XFEM method
as described in before was used to estimate
the crack growth.
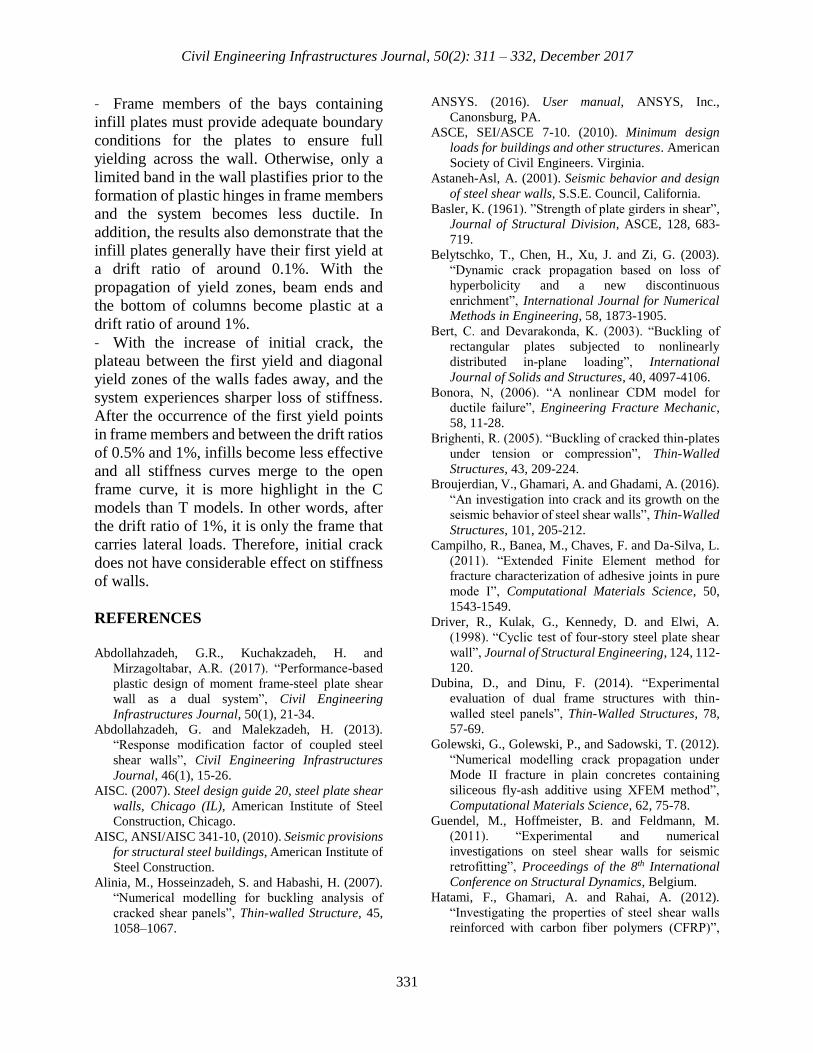
During the testing, the crack length
increased approximately 350 mm that was
calculated around 348 mm in FE modeling. In
addition, The FE modeling showed a good
estimation to crack propagation as illustrated
in Figure 6. The displacement of two edges of
crack has shown exaggeratedly to show the
crack opening and crack propagation.
Moreover, the calculated curve for crack
propagation and plastic strain, respectively,
against the displacement is shown in Figure
7, which is good coinciding with the one
reported in the aforementioned reference.
Fig. 5. Test setup (Simonsen and Tornqvist, 2004)
Fig. 6. Comparing of experimental with FE modeling; crack opening

Civil Engineering Infrastructures Journal, 50(2): 311 – 332, December 2017
319
Fig. 7. Comparing the test results with FE modeling
NUMERICAL MODELING
Specifications of Steel Shear Wall Models
Table 1 shows the specifications of the
models considered in this study to investigate
the effect of initial position of crack and also
the effect of crack growth on the SPSW
behavior. In all the models, the steel plate has
a thickness of 4mm and L = 4 m and h = 3 m.
The label of each model consists of three
characters and a number. The first letter in the
future curves can be S, P or F representing the
SPSW, Plate of SPSW and Frame of SPSW,
respectively. The second character can be 2C,
2T, … standing for cracks location as in
Figure 2. The numeric part represents the
crack length in centimeters. For example, “S-
2C-7.5” is a steel plate shear wall with a crack
at compressive diagonal with an initial crack
length of 7.5 cm.
The SPSW is designed according to the
AISC Design Guide 20 (AISC, 2007) and the
AISC 360-10 (AISC, 2010) rules and
provisions. The SPSW is designed by the
following capacity-design principles so that
the infill plate is assumed to resist forces
corresponding to its expected full shear yield
strength. HBEs and VBEs are designed to
allow the formation of full yield lines across
the plate, to resist the corresponding forces
from the infill, and to remain elastic. Plastic
hinges are only allowed to form at the ends of
HBEs and lower ends of VBEs. In this way,
the system would maintain stability even after
yield zones propagate across the infill plate.
The designed sections for HBEs and VBEs
are W14 × 176 and W14 × 257, respectively
as shown in Figure 8. Typical models have
shown in Figure 9 for FE modeling in
ANSYS and ABAQUS.
Material Properties
The ST37 steel is considered here. Young
modulus is 210 GPa and Poisson ratio is
assumed to be 0.3. The ST37 steel has a good
machinability and surface finish capabilities
with a high strength and adequate
workability. Reference mechanical properties
are summarized in Table1. Material flow
curve for steel ST37 at room temperature is
described using a power law. Power law is
usually a suitable approximation of plastic
response curve.
𝜎 = 𝐴 + 𝐵휀𝑝
𝑚 (10)
where three parameters A, B, and m need to
be determined. The Von-Mises yield
criterion, known to be the most suitable yield
function for metals, is used in this research.
The type of hardening to be used in this
simulation is isotropic hardening. And also,
the parameters of power law based on Bonora
damage model parameters for this material
(Bonora, 2006) is given in Table 2, and flow
curve diagram is depicted in Figure 10.

Broujerdian, V. et al.
320
Table 1. Model properties
Model 2a (cm) Crack Type Initial Crack Position (Figure 2 )
S-2C-7.5 7.5 Horizontal 2C
S-2C-15 15 Horizontal 2C
S-2C-30 30 Horizontal 2C
S-2C-60 60 Horizontal 2C
S-2C-120 120 Horizontal 2C
S-2C-240 240 Horizontal 2C
S-2T-7.5 7.5 Horizontal 2T
S-2T-15 15 Horizontal 2T
S-2T-30 30 Horizontal 2T
S-2T-60 60 Horizontal 2T
S-2T-120 120 Horizontal 2T
S-2T-240 240 Horizontal 2T
S-3C-7.5 7.5 Horizontal 2T
S-3C-15 15 Horizontal 3C
S-3C-30 30 Horizontal 3C
S-3C-60 60 Horizontal 3C
S-3C-120 120 Horizontal 3C
S-3C-240 240 Horizontal 3C
S-3T-7.5 7.5 Horizontal 3C
S-3T-15 15 Horizontal 3T
S-3T-30 30 Horizontal 3T
S-3T-60 60 Horizontal 3T
S-3T-120 120 Horizontal 3T
S-3T-240 240 Vertical 3T
S-4C-7.5 7.5 Vertical 4C
S-4C-15 15 Vertical 4C
S-4C-30 30 Vertical 4C
S-4C-60 60 Vertical 4C
S-4C-120 120 Vertical 4C
S-4C-240 240 Vertical 4C
S-4T-7.5 7.5 Vertical 4T
S-4T-15 15 Vertical 4T
S-4T-30 30 Vertical 4T
S-4T-60 60 Vertical 4T
S-4T-120 120 Vertical 4T
S-4T-240 240 Vertical 4T
S-5C-7.5 7.5 Vertical 4T
S-5C-15 15 Vertical 5C
S-5C-30 30 Vertical 5C
S-5C-60 60 Vertical 5C
S-5C-120 120 Vertical 5C
S-5C-240 240 Vertical 5C
S-5T-7.5 7.5 Vertical 5C
S-5T-15 15 Vertical 5T
S-5T-30 30 Vertical 5T
S-5T-60 60 Vertical 5T
S-5T-120 120 Vertical 5T
S-5T-240 240 Vertical 5T
Table 2. ST37 steel properties
Flow curve Parameters Damage Parameters
A (MPa) B (MPa) m th f 0D
crD
217 233.7 0.6428 0.259 1.4 0.0 0.065 0.2175

Civil Engineering Infrastructures Journal, 50(2): 311 – 332, December 2017
321
Fig. 8. A typical SPSW system
Fig. 9. A typical FE models in ANSYS and ABAQUS
Fig. 10. Typical tensile curve for ST37 steel

Broujerdian, V. et al.
322
The maximum principal stress criterion
and the energy criterion based on the standard
exponential law were used as crack initiation
and crack growth criteria. Yield strength and
fracture energy are assumed as 220 𝑀𝑃𝑎 and
42.2 N/mm, respectively.
Loading and Boundary Conditions
Lateral loads are applied to the beam-
column connections as shown in Figure 10;
and are gradually increased from zero to a
magnitude beyond the system's capacity. The
ultimate displacement limit is considered to
occur at a drift ratio of 2.5% per ASCE 7-05
(ASCE, 2010). To simulate the fixed
condition of the column-to-base plate
connections, the bottom nodes of both
columns flanges and webs are restrained from
displacement in all directions. To simulate
the constraints imposed by slabs of the story
floors, the out-of-plane displacements of
beam webs are also restrained.
Defining the Seismic Behavior Parameters
In order to estimate seismic parameters,
the actual load-displacement response curves
are usually idealized as illustrated in Figure
11. This idealization is based on the following
assumptions and definitions:
The maximum displacement of the
structure, ∆𝑚𝑎𝑥, will be considered based
on the requirements of the local
regulations.
The Ductility factor is measured as µ =∆𝑚𝑎𝑥 / ∆𝑦 from ideal curve.
The elastic stiffness, K, is equal to
initial slope of the load-deformation curve;
=𝑉𝑦
∆𝑦 .
The over strength factor, Ω, factor is the
reserved strength value existing between
Vy and Vs.
Response modification factor is
determined as 𝑅 = 𝑉𝑒 / 𝑉𝑠
RESULTS AND DISCUSSION
Load-Displacement Curve
Load-displacement curve contains
important information, and seismic
parameters can be extracted from it. Figures
12 and 13 show the load-displacement curve
for walls containing horizontal or vertical
cracks with fixed lengths (without
considering the crack growth phenomenon).
Fig. 11. Idealization of load–displacement curve of structures

Civil Engineering Infrastructures Journal, 50(2): 311 – 332, December 2017
323
(a) (b)
(c) (d) Fig. 12. Load-displacement of cracked SPSW with vertical crack, initial crack at; a) 2T, b) 2C, c) 3T, 3C
(a) (b)
0
1000
2000
3000
4000
5000
6000
0 0.5 1 1.5 2 2.5
Bas
e s
he
ar (
kN)
Drift ratio (%)
S-2T-240
S-2T-120
S-2T-60
S-2T-30
S-2T-15
S-2T-7.50
1000
2000
3000
4000
5000
6000
0 0.5 1 1.5 2 2.5
Bas
e s
he
ar (
kN)
Drift ratio (%)
S-2C-240
S-2C-120
S-2C-60
S-2C-30
S-2C-15
S-2C-7.5
0
1000
2000
3000
4000
5000
6000
0 0.5 1 1.5 2 2.5
Bas
e s
he
ar (
kN)
Drift ratio (%)
S-3-240
S-3T-120
S-3T-60
S-3T-30
S-3T-15
S-3T-7.50
1000
2000
3000
4000
5000
6000
0 0.5 1 1.5 2 2.5
Bas
e s
he
ar (
kN)
Drift ratio (%)
S-3C-240
S-3C-120
S-3C-60
S-3C-30
S-3C-15
S-3C-7.5
0
1000
2000
3000
4000
5000
0 0.5 1 1.5 2 2.5
Bas
e s
he
ar (
kN)
Drift ratio (%)
S-4T-240
S-4T-120
S-4T-30
S-4T-15
S-4T-7.5
0
1000
2000
3000
4000
5000
0 0.5 1 1.5 2 2.5
Bas
e s
he
ar (
kN)
Drift ratio (%)
S-4C-240
S-4C-120
S-4C-60
S-4C-30
S-4C-15
S-4C-7.5

Broujerdian, V. et al.
324
(c) (d)
Fig. 13. Load-displacement of cracked SPSW with horizontal crack, initial crack at a) 4T, b) 4C, c) 5T, d) 5C
The figures show that, the cracked shear
wall of 2 with 3 and also 4 with 5 have the
same behavior. In all models, crack located at
the tension diagonal field of plate (models
including T letter name) decreases the
strength and energy absorption more than
crack on the compressive diagonal (models
including C letter name). Despite vertical
cracks (models S-4 and S-5), the horizontal
cracks (models S-2 and S-3) could have a
great impact on the nonlinear behavior of
SPSW, Figure 13. For horizontal cracks with
a length of more than 300 mm, the wall
ruptures suddenly and for cracks longer than
1200 mm, the wall system is ruptured low
entering the nonlinear phase. This means that
the wall with such a crack cannot be
considered as a load-bearing ductile system.
Therefore, it can be inferred that horizontal
cracks are more critical than vertical cracks.
This phenomenon may be related to the
location of diagonal tension field burden of
load bearing.
Wall-Frame Shares of Story Shear
An alternative method to evaluate the
effectiveness of infill plates is to measure the
amount of absorbed story shear. The curves
presented in Figure 14, illustrate the amount
of shear forces carried by the infill plate in
various SPSWs having different initial
cracks. Figure 14, on the other hand, shows
the percentage contribution shares of the infill
plates at different drift ratio. The absorbed
shear forces are calculated by means of
integrating shear stresses across the width of
infill plates. Figure 15 shows a very high
contribution from the infills up to a drift ratio
of around 0.5%, where the surrounding
members experience their first yield points.
Thereafter, the curves start to rise a little until
that becomes horizontal at around the drift
ratio of 1.2%. Beyond the drift ratio of 1.2%,
the surrounding members mainly absorb
additional loading. It should be noted that,
due to the high in-plane strength of infill
plates, the load bearing capacity
corresponding to the drift ratio of 1.2% is
very close to the ultimate strength of the
system. In first stage of loading, the share of
infill plate is around 65% whereas in drift
ratio 0.5% decreases to around 40%.
Reduction of share of infill plate from lateral
load for bigger initial crack is more than
initial crack, and also this reduction is more
for horizontal small initial crack comparison
to vertical initial cracks.
Figure 15 also shows that the infill plates
are very active during the initial stages of
loading and absorbs a major part of the story
0
1000
2000
3000
4000
5000
0 0.5 1 1.5 2 2.5
Bas
e s
he
ar (
kN)
Drift ratio (%)
S-5T-240
S-5T-120
S-5T-60
S-5T-15
S-5T-7.5
0
1000
2000
3000
4000
5000
0 0.5 1 1.5 2 2.5
Bas
e s
he
ar (
kN)
Drift ratio (%)
S-5C-240
S-5C-120
S-5C-60
S-5C-30
S-5C-15
S-5C-7.5

Civil Engineering Infrastructures Journal, 50(2): 311 – 332, December 2017
325
shear. The curves in Figure 16 indicate that
the contribution share of the infill plates is
almost constant until the formation of
diagonal yield zones. After the development
of diagonal yield zones, the contribution of
shear infill plates gradually decreases and
after the drift ratio of 1.2%, that becomes
almost constant. This noted is true when
tearing of infill plate does not occur. On other
hand, the walls with long initial crack do
experience this process, especially initial
horizontal crack (models with Crack No. 4
and 5).
Figures 16a,b illustrate the contribution
shares of the infill plates and frames during
the loading history of SPSW models. The
figure shows that the infill plates absorb a
high percentage of story shears at the early
stages of loading. Upon the formation of
diagonal yield zones, the plates begin to lose
their effectiveness and frames become more
active. Again, after the drift ratio of 0.2%, the
frame and infill plats absorb almost constant
shares of loading. It should be mentioned that
the yield zones in the infill plates are very
narrow at the beginning; but gradually widen
to almost the entire surface of the wall.
Referring to Figures 16c,d, it can be seen that
initial vertical crack does not have significant
effect on shares of the infill plates and frame
during the loading history for drift ratio
higher than 1.2%. Nevertheless, in SPSWs
with horizontal crack, the initial crack leads
the wall to reduce the infill plate sharing.
(a) (b)
(c) (d)
Fig. 14. Percentage share of story shear by the infill plates; a) Cracks No. 4C, b) Cracks No. 4T, c) Cracks No. 2C, d)
Cracks No. 2T
40
45
50
55
60
65
-0.5 0.5 1.5 2.5
Pe
rce
nta
ge b
ase
sh
ear
(%
)
Drift angle (%)
P-4C-120P-4C-60P-4C-30
40
45
50
55
60
65
-0.5 0.5 1.5 2.5
Pe
rce
nta
ge b
ase
sh
ear
(%
)
Drift angle (%)
P-4T-120
P-4T-60
P-4T-30
P-4T-15
P-4T-7.5
40
45
50
55
60
65
0 0.5 1 1.5 2 2.5
Pe
rce
nta
ge b
ase
sh
ear
(%
)
Drift ratio (%)
P-2C-120
P-2C-60
P-2C-30
P-2C-15
P-2C-7.5
30
35
40
45
50
55
60
65
0 0.5 1 1.5 2 2.5
Pe
rce
nta
ge b
ase
sh
ear
(%
)
Drift ratio (%)
P-2T-240P-2T-120P-2T-60
P-2T-30

Broujerdian, V. et al.
326
models crack No. 2
models crack No. 4
Fig. 15. Percentage shear intakes by the infill and frame for small and long crack
(a)
(b)
(c) (d)
Fig. 16. Stiffness-Drift curve: a) S-2C models, b) S-2T models, c) S-4T models, d) S-4C models
30
40
50
60
70
-0.5 0.5 1.5 2.5
Pe
rce
nta
ge b
ase
sh
ear
(%
)
Drift ratio (%)
F-2C-120 P-2C-120
F-2C-7.5 P-2C-7.5
30
40
50
60
70
0 0.5 1 1.5 2 2.5
Pe
rce
nta
ge b
ase
sh
ear
(%
)
Drift ratio (%)
F-4C-120 P-4C-120
F-4C-7.5 P-4C-7.5
0
100
200
300
400
500
0 0.5 1 1.5 2 2.5
Stif
fne
ss (
kN/m
m)
Drift ratio (%)
S-2C-120
S-2C-60
S-2C-30
S-2C-15
S-2C-7.5
0
100
200
300
400
500
0 0.5 1 1.5 2 2.5
Stif
fne
ss (
kN/m
m)
Drift ratio (%)
S-2T-240
S-2T-120
S-2T-60
S-2T-30
S-2T-15
S-2T-7.5
0
50
100
150
200
250
300
350
400
450
0 0.5 1 1.5 2 2.5
Stif
fne
ss (
kN/m
m)
Drift ratio (%)
S-4T-120
S-4T-60
S-4T-30
S-4T-15
S-4T-7.5
0
50
100
150
200
250
300
350
400
450
0 0.5 1 1.5 2 2.5
Stif
fne
ss (
kN/m
m)
Drift ratio (%)
S-4C-120
S-4C-60
S-4C-30
S-4C-15
S-4C-7.5

Civil Engineering Infrastructures Journal, 50(2): 311 – 332, December 2017
327
Frame members of the bays containing
infill plates must provide adequate boundary
conditions for the plates to ensure full
yielding across the wall. Otherwise, only a
limited band in the wall plastifies prior to the
formation of plastic hinges in frame
members, and the system becomes less
ductile. However, after the development of
first yield points in the frame members, the
system gradually loses its efficiency to
withstand further stresses. In addition, once
plastic hinges are formed in the frame
members, the magnitude of stresses within
the plate remains constant. From the seismic
design point of view, minor earthquake loads
can be dissipated by the infill plates by
undergoing small inter-story drifts (< 0.1%).
In moderate earthquakes, the infill plates
experience widespread yielding, while the
frame members remain elastic. This is an
ideal choice since the structures remain in the
state of immediate occupancy, and if
necessary, the infill plates are easily
repairable. Under severe earthquakes,
however, the structure dissipates noticeable
energy, and plastic hinges are formed in
frame members. The structures may suffer
minor damages; but due to the high ductility,
they do not collapse.
Stiffness and Strength
Two parameters that are important in
elastic and inelastic zone are lateral stiffness
and lateral strength. Lateral stiffness curves
are utilized to measure the contribution share
of infill plates in both resisting the lateral
loads. The reduction of stiffness increases P-
Δ effect. In addition, Low amount of shear
strength increases the ductility demand and
possibility of structure demolition.
The stiffness curves of SPSWs with crack
No. 2 (and No. 3 is same as to it) and crack
No. 4 (and Crack No. 5 is same as to it) and
various infill initial crack length are given in
Figure 16. It should be noted that increasing
the initial crack decreases the initial lateral
stiffness, Table 3. Nevertheless, after the
appearance of diagonal yield zones, which
incidentally occur at similar drift ratios, the
curves tend to converge towards each other.
Table 3. Ductility, initial stiffness, ultimate strength of SPSW
Models μ Fu (kN) K (kN/mm)
S-2C-7.5 8.3 4906.38 478.89
S-2C-15 8.29 4906.42 478.79
S-2C-30 8.29 4903.2 478.31
S-2C-60 8.29 4888.65 476.85
S-2C-120 8.29 4826.63 470.71
S-2C-240 Elastic behavior 1645.1 438.36
S-2T-7.5 8.75 4900.26 504.61
S-2T-15 8.76 4893.68 504.44
S-2T-30 8.77 4882.03 503.63
S-2T-60 8.86 4802.87 500.86
S-2T-120 8.84 4698.89 488.84
S-2T-240 8.69 4509.38 461.13
S-4C-7.5 7.75 4914.83 447.86
S-4C-15 7.75 4912.92 447.74
S-4C-30 7.83 4860.158 447.53
S-4C-60 7.89 4817.97 446.97
S-4C-120 Elastic behavior 3092.42 444.29
S-4C-240 Elastic behavior 1372.98 427.08
S-4T-7.5 7.43 4912.82 429.41
S-4T-15 7.43 4910.26 429.41
S-4T-30 7.02 4770.46 393.74
S-4T-60 7.39 4507.33 391.61
S-4T-120 Around elastic behavior 4200.53 428.43
S-4T-240 Around elastic behavior 3782.47 354.10

Broujerdian, V. et al.
328
It is also observed that with the increase of
initial crack, the plateau between the first
yield and diagonal yield zones of the walls
fades away, and the system experiences
sharper loss of stiffness. After the occurrence
of the first yield points in frame members and
between the drift ratios of 0.5% and 1%,
infills become less effective and all stiffness
curves merge to the open frame curve, it is
highlighted in the C models than T models. In
other words, after the drift ratio of 1%, it is
only the frame that carries lateral loads. So,
initial crack does not have considerable effect
on stiffness of walls.
The calculated initial stiffness and
ultimate strength of cracked SPSWs are listed
as shown in Table 3. As it can be seen, small
initial crack length has very little effect on the
initial stiffness and ultimate strength of
systems. However, for cracks longer than
600 mm, both parameters show a significant
decrease.
The results also demonstrate that the infill
plates generally have their first yield at a drift
ratio of around 0.1%. With the propagation of
yield zones, beam ends and bottom of
columns plastify at a drift ratio of around 1%.
Top of columns, however, remain essentially
elastic due to the ``weak beam-strong
column'' design criteria. Therefore, enough
time is available to the system to develop
widespread plasticity before plastic hinges
are formed in the beams and columns. This is
to meet the capacity-design principles as
stated in the AISC design codes (AISC, 2007;
AISC, 2010) that system ductility shall be
primarily provided by plastic deformation of
the infill plates. Table 1 shows the measured
ductility of SPSWs with different initial
cracks. The ductility is calculated as depicted
in Figure 12. Based on the results given in
Table 1, the ductility of the SPSWs is almost
independent of the initial crack in T or C
zones but decreases with the horizontal crack
(crack No. 4) more than vertical cracks
(models with crack No. 2). It should be noted
that when the initial crack is bigger than 1200
mm, system has an elastic behavior that the
ductility is not defied.
Energy Absorption
One of the accurate ways of measuring
seismic performance of a structure relies on
energy dissipation. The structures with higher
capability in energy absorption can be
designed for smaller lateral forces. In the
present paper, the dissipated energy of
analyzed specimens is measured as the area
enclosed by load−displacement curve.
It can be seen with referring to the Table 4
and Figure 17 that by increasing the crack
length, the energy absorption of system is
decreased. Decreasing of energy absorption
capability in models with cracks T types is
much more than models with cracks C types.
This table shows that decreasing of energy
absorption due to small initial crack is
negligible. Energy absorption decreasing of
all models for T zone is little more than C
zone. Nevertheless, there is a considerable
difference between cracks No. 2 and cracks
No. 4 especially in T zones. The critical crack
is the crack on the T zones with length more
than 1.8% of the weld length. Table 4
compares energy absorption for walls with
central cracks. This comparison is obvious
because energy absorption of system has a
significant reduction of 0.9% to 79%.
Response Modification Factor (R Factor)
The calculated response modification
factors along with their components for the
wall with various cracks are listed in Table 5.
It shows that if there is a small crack only in
Fishplate connected to column (vertical
crack), the cracked steel shear walls can be
used in areas with high seismic risk and
ductile behavior expectation. Walls
containing horizontal cracks with a length of
nearly 15% of the wall plate can be used only
in low seismic risk areas and low ductility
expectation. For bigger cracks, the wall

Civil Engineering Infrastructures Journal, 50(2): 311 – 332, December 2017
329
cannot be regarded as a system of load
bearing seismic system since its behavior is
limited to the elastic region. It should be
noted that all these conclusions were drawn
with the assumption of non-growing crack.
According to the Table 5, sensitivity of the Ru
factor is based on horizontal crack than
vertical initial cracks. But, horizontal cracks
reduce the Ru factor. Cracks with a length of
less than 15% of the wall length have little
effect on the Rμ factor. Based on the results
given in Table 5, the Rμ of the SPSWs is
almost independent of the initial crack length
of the wall. Slight decreases of response
modification factor are derived from the
horizontal cracks.
Table 4. Ductility, initial stiffness, ultimate strength of SPSW
Initial Crack Length (mm) 75 150 300 600 1200 2400
Crack No. 2
C zone 363.26 363.53 363.19 362.04 358.01 4.44
Decreasing compared to S-
75 (%) 100 100 100 100 99 1
T zone 363,05 362.04 361.06 356.64 348.88 331.60
Decreasing compared to S-
75 (%) 100 99 98 96 91
Crack No. 4
C zone 363.73 363.87 360.16 357.44 297.85 2.71
Decreeing compared to S-75
(%) 1.00 1.00 0.99 0.98 0.82 0.01
T zone 363.79 333.22 221.21 90.86 61.13 49.49
Decreasing compared to S-
75 (%) 100 92 61 25 17 14
Models with
cracks T dived to
cracks C
Crack No. 2 1.00 1.00 0.99 0.98 0.97 82.9
Crack No. 4 1.00 0.91 0.62 0.25 0.21 20
Table 5. Modification factor
Rμ Ω Ru
S-2C-7.5 3.8 1.75 6.64
S-2C-15 3.8 1.75 6.65
S-2C-30 3.8 1.75 6.64
S-2C-60 3.8 1.64 6.25
S-2C-120 3.8 1.77 6.74
S-2C-240 Elastic behavior
S-2T-7.5 3.91 1.84 7.18
S-2T-15 3.91 1.85 7.23
S-2T-30 3.91 1.8 7.02
S-2T-60 3.94 1.85 7.30
S-2T-120 3.93 1.86 7.29
S-2T-240 3.88 1.98 7.67
S-4C-7.5 3.67 1.75 6.43
S-4C-15 3.67 1.75 6.43
S-4C-30 3.69 1.88 6.93
S-4C-60 3.71 1.86 6.91
S-4C-120 Elastic behavior
S-4C-240 Elastic behavior
S-4T-7.5 3.6 1.75 6.3
S-4T-15 3.45 1.75 6.03
S-4T-30 2.77 1.84 5.09
S-4T-60 1.87 1.74 3.26
S-4T-120 Elastic behavior
S-4T-240 Elastic behavior

Broujerdian, V. et al.
330
(a)
(b)
Fig. 17. Energy absorption of wall with; a) Cracks No. 2, b) Cracks No. 4
Comparison of Horizontal and Vertical
Crack
To evaluate the effect of crack type in the
case of non-growing condition, the seismic
parameters of the walls with horizontal and
vertical crack are listed in Table 6. The results
reveal that in long cracks, the horizontal
cracks are more critical than the vertical
cracks. The main reason is the failure of wall
with horizontal crack in the elastic region. In
the shorter edge cracks, stiffness, strength
and energy absorption has a greater amount.
CONCLUSIONS
In the present work, the effect of crack on the
seismic behavior of SPSW was investigated
and the following results are briefly
concluded:
- The results revealed that the horizontal
cracks located on the top or bottom of SPSW
have the same effect. In addition, it is the case
for the vertical cracks located at the left or
right of SPSW. Moreover, the horizontal
cracks (models S-2 and S-3) could have a
great impact on the nonlinear behavior of
SPSW in spite of the vertical cracks (models
S-4 and S-5).
- In all the models, the cracks located at the
tension diagonal field of plate (models
including “T” in their name) decrease the
strength and energy absorption more than the
crack on the compressive diagonal (models
including “C” in their name). The critical
crack is the crack on the T zones with length
more than 1.8% of the weld length. These
cracks reduce 0.9% to 79% of the energy
absorption of system. Energy absorption
decreasing of all models for T zone is a little
more than C zone. However, there is a
considerable difference between cracks No. 2
and cracks No. 4 especially in T zones.
Table 6. Comparison of vertical crack and horizontal crack
Crack
No. 4 Divided to
Crack No. 2
Initial Crack
Length (mm) 75 150 300 600 1200 2400
E C zone 1.00 1.00 0.99 0.99 0.83 0.61
T zone 1.00 0.92 0.61 0.25 0.18 0.15
K C zone 0.94 0.94 0.94 0.94 0.94 0.97
T zone 0.85 0.85 0.78 0.82 0.88 0.81
Fu C zone 1.00 1.00 0.99 0.99 0.64 0.83
T zone 1.00 1.00 0.98 0.96 0.89 0.80
0
100
200
300
400
7.5 15 30 60 120 240
E (k
N.m
)
S-2T
S-2C
0
100
200
300
400
7.5 15 30 60 120 240
E (k
N.m
)
4C
4T
Civil Engineering Infrastructures Journal, 50(2): 311 – 332, December 2017
331
- Frame members of the bays containing
infill plates must provide adequate boundary
conditions for the plates to ensure full
yielding across the wall. Otherwise, only a
limited band in the wall plastifies prior to the
formation of plastic hinges in frame members
and the system becomes less ductile. In
addition, the results also demonstrate that the
infill plates generally have their first yield at
a drift ratio of around 0.1%. With the
propagation of yield zones, beam ends and
the bottom of columns become plastic at a
drift ratio of around 1%.
- With the increase of initial crack, the
plateau between the first yield and diagonal
yield zones of the walls fades away, and the
system experiences sharper loss of stiffness.
After the occurrence of the first yield points
in frame members and between the drift ratios
of 0.5% and 1%, infills become less effective
and all stiffness curves merge to the open
frame curve, it is more highlight in the C
models than T models. In other words, after
the drift ratio of 1%, it is only the frame that
carries lateral loads. Therefore, initial crack
does not have considerable effect on stiffness
of walls.
REFERENCES
Abdollahzadeh, G.R., Kuchakzadeh, H. and
Mirzagoltabar, A.R. (2017). “Performance-based
plastic design of moment frame-steel plate shear
wall as a dual system”, Civil Engineering
Infrastructures Journal, 50(1), 21-34.
Abdollahzadeh, G. and Malekzadeh, H. (2013).
“Response modification factor of coupled steel
shear walls”, Civil Engineering Infrastructures
Journal, 46(1), 15-26.
AISC. (2007). Steel design guide 20, steel plate shear
walls, Chicago (IL), American Institute of Steel
Construction, Chicago.
AISC, ANSI/AISC 341-10, (2010). Seismic provisions
for structural steel buildings, American Institute of
Steel Construction.
Alinia, M., Hosseinzadeh, S. and Habashi, H. (2007).
“Numerical modelling for buckling analysis of
cracked shear panels”, Thin-walled Structure, 45,
1058–1067.
ANSYS. (2016). User manual, ANSYS, Inc.,
Canonsburg, PA.
ASCE, SEI/ASCE 7-10. (2010). Minimum design
loads for buildings and other structures. American
Society of Civil Engineers. Virginia.
Astaneh-Asl, A. (2001). Seismic behavior and design
of steel shear walls, S.S.E. Council, California.
Basler, K. (1961). ”Strength of plate girders in shear”,
Journal of Structural Division, ASCE, 128, 683-
719.
Belytschko, T., Chen, H., Xu, J. and Zi, G. (2003).
“Dynamic crack propagation based on loss of
hyperbolicity and a new discontinuous
enrichment”, International Journal for Numerical
Methods in Engineering, 58, 1873-1905.
Bert, C. and Devarakonda, K. (2003). “Buckling of
rectangular plates subjected to nonlinearly
distributed in-plane loading”, International
Journal of Solids and Structures, 40, 4097-4106.
Bonora, N, (2006). “A nonlinear CDM model for
ductile failure”, Engineering Fracture Mechanic,
58, 11-28.
Brighenti, R. (2005). “Buckling of cracked thin-plates
under tension or compression”, Thin-Walled
Structures, 43, 209-224.
Broujerdian, V., Ghamari, A. and Ghadami, A. (2016).
“An investigation into crack and its growth on the
seismic behavior of steel shear walls”, Thin-Walled
Structures, 101, 205-212.
Campilho, R., Banea, M., Chaves, F. and Da-Silva, L.
(2011). “Extended Finite Element method for
fracture characterization of adhesive joints in pure
mode I”, Computational Materials Science, 50,
1543-1549.
Driver, R., Kulak, G., Kennedy, D. and Elwi, A.
(1998). “Cyclic test of four-story steel plate shear
wall”, Journal of Structural Engineering, 124, 112-
120.
Dubina, D., and Dinu, F. (2014). “Experimental
evaluation of dual frame structures with thin-
walled steel panels”, Thin-Walled Structures, 78,
57-69.
Golewski, G., Golewski, P., and Sadowski, T. (2012).
“Numerical modelling crack propagation under
Mode II fracture in plain concretes containing
siliceous fly-ash additive using XFEM method”,
Computational Materials Science, 62, 75-78.
Guendel, M., Hoffmeister, B. and Feldmann, M.
(2011). “Experimental and numerical
investigations on steel shear walls for seismic
retrofitting”, Proceedings of the 8th International
Conference on Structural Dynamics, Belgium.
Hatami, F., Ghamari, A. and Rahai, A. (2012).
“Investigating the properties of steel shear walls
reinforced with carbon fiber polymers (CFRP)”,

Broujerdian, V. et al.
332
Journal of Constructional Steel Research, 70, 36-
42.
Hibbitt, H., Karlsson, B. and Sorensen, P. (2012).
ABAQUS theory manual, version 6.12, Pawtucket,
Rhode Island, USA.
Johnson, G.R., and Cook, W.H. (1983), “A
constitutive model and data for metals subjected to
large strains, high strain rates and high”,
Proceedings of the 7th International Symposium on
Ballistics, 21, 541-547
Nasirmanesh, A. and Mohammadi, S. (2017).
“Eigenvalue buckling analysis of cracked
functionally graded cylindrical shells in the
framework of the extended Finite Element
method”, Composite Structures, 159, 548-566.
Riks, E., Rankin, C. and Brogan, F. (1992). “The
buckling behavior of a central crack in a plate under
tension”, Engineering Fracture Mechanics, 43,
529-548.
Shaw, D. and Huang, Y. (1990). “Buckling behavior
of a central cracked thin plate under tension”,
Engineering Fracture Mechanics, 35, 1019-1027.
Shekastehband. B., Azaraxsh. A. and Showkati. H,
(2017), “Experimental and numerical study on
seismic behavior of LYS and HYS steel plate shear
walls connected to frame beams only”, Archives of
Civil and Mechanical Engineering, 17(1),154-168.
Sih, G. and Lee, Y. (1968). “Tensile and compressive
buckling of plates weakened by cracks”,
Theoretical and Applied Fracture Mechanics, 6,
129-138.
Simonsen, B. and Tornqvist, R. (2004). “Experimental
and numerical modelling of ductile crack
propagation in large-scale shell structures”, Marine
Structures, 17, 1-27.
Wang, Z., Zhou, S., Zhang, J., Wu, X. and Zhou, L.
(2012). “Progressive failure analysis of bolted
single-lap composite joint based on extended Finite
Element method”, Materials and Design, 37, 582-
588.
Xie, Y., Cao, P. and Liu, L. (2016). “Influence of crack
surface friction on crack initiation and propagation:
A numerical investigation based on extended Finite
Element method”, Computers and Geotechnics,
74, 1-14.