corneal thickness mapping by 3d swept-source anterior segment optical coherence tomography
TRANSCRIPT

Introduction
Pachymetry, the measurement of cor-neal thickness, is part of the clinical rou-
tine in the study of corneal anatomyand pathology, in the evaluation ofglaucoma risk and in the preliminaryphases of corneal and refractive surgery.
Ultrasound pachymetry (USP) isconsidered the gold standard tech-nique for the clinical evaluation ofcorneal thickness, and it has provengood reliability and repeatability. Themain limit of USP is its invasiveness,as it requires the ultrasound probe tocontact the eye causing patient’s dis-comfort, risk of infection and of epi-thelial damage. This also decreases theutility of USP in paediatric ophthal-mology and immediately after surgery.Moreover, USP is partially operator-dependent as it may be subject toerrors deriving from the deformationof the cornea, in case of excessivepressure during the examination, orfrom decentred or oblique positioningof the probe on the corneal surface.
Several noninvasive techniques to mea-sure corneal thickness are available, mainoptions being specular microscopy, veryhigh-frequency digital ultrasound, scan-ning slit tomography, Scheimpflug cam-era and optical coherence tomography(OCT) devices. OCT instruments allowin vivo, noncontact, high-definitionvisualization and measurement of theeye structures. OCT systems obtain cor-neal thickness values from the analysisof sectional images of the anterior seg-ment of the eye, after identification ofthe external and internal boundaries ofthe cornea. Corneal thickness measure-ments can be obtained both by retinalOCTs equipped with anterior segmentmodules or by dedicated anterior seg-ment OCTs (AS-OCT), which can visu-alize the entire anterior segment.
Corneal thickness mapping by3D swept-source anteriorsegment optical coherencetomographyAlberto Neri, Marianna Malori, Patrizia Scaroni,Rosachiara Leaci, Elisabetta Delfini and Claudio Macaluso
Ophthalmology, University Hospital of Parma, Parma, Italy
ABSTRACT.
Purpose: To assess accuracy and repeatability of central corneal thickness
(CCT) measurements obtained by swept-source anterior segment optical coher-
ence tomography (AS-OCT), spectral-domain retinal OCT with corneal mod-
ule and ultrasound pachymetry (USP), and to assess repeatability of
pachymetric mapping with AS-OCT.
Methods: 50 healthy volunteers were recruited. A single, experienced operator
analysed the right eye of each participant twice in the same session with AS-
OCT (‘corneal map’ routine), retinal OCT and USP. CCT measurements
were compared using repeated-measures analysis of variance, Bonferroni test,
Pearson correlation and Bland-Altman plots. Repeatability of thickness maps
and CCT measurements were assessed using Alpha of Cronbach, intraclass
correlation coefficient (ICC) and coefficient of repeatability.
Results: Mean CCT ± SD was 540 ± 28.9 lm for AS-OCT,
544 ± 29.5 lm for retinal OCT and 549.3 ± 31.7 lm for USP; the differ-
ences were statistically significant (p < 0.01). CCT measurements obtained
with the three instruments were highly correlated: r was 0.965 for AS-
OCT ⁄USP, 0.962 for retinal OCT ⁄USP and 0.984 for AS-OCT ⁄ retinal OCT
comparison. The repeatability of CCT measurements was higher for AS-OCT
than for the other devices (p < 0.001). Repeatability of pachymetric maps
was excellent (ICC = 0.999).
Conclusions: Pachymetric maps by swept-source AS-OCT showed excellent
repeatability. CCT measurements obtained by AS-OCT, USP and retinal
OCT were highly correlated although not identical.
Key words: agreement – anterior-segment OCT – corneal thickness – pachymetric map – repeat-
ability – swept-source OCT
Acta Ophthalmol.ª 2012 The Authors
Acta Ophthalmologica ª 2012 Acta Ophthalmologica Scandinavica Foundation
doi: 10.1111/j.1755-3768.2012.02453.x
Acta Ophthalmologica 2012
1

In the last years, OCTs have becomewidely used in the study of cornealand irideal pathologies, cataract andglaucoma. They can also perform atopographical analysis of the examinedcorneal tissue, obtaining pachymetricmaps (Li et al. 2006; Mohamed et al.2007; Li et al. 2008b; Li et al. 2010).Recently, spectral-domain (SD) AS-OCTs devices have been developed,showing improved resolution andhigher acquisition rates, in the sameway as it happened when SD retinalOCTs succeeded to time-domaindevices. Faster scan acquisition rates,in particular, are expected to reducethe artefacts because of eye movementsthat were the principal limitation fortime-domain AS-OCT to obtain topo-graphical analysis of the cornea, asmaps of both corneal curvature (Tanget al. 2006) and thickness (Li et al.2006, 2008a,b, 2010). Swept-sourceOCT is a particular form of spectral-domain OCT technology characterizedby high-speed acquisition (Yun et al.2003). A swept-source OCT prototypeallowing 3D imaging and biometry ofthe anterior segment of the eye wasstudied by Fukuda et al. (Fukudaet al. 2009, 2010).
Herein, we studied the accuracy andrepeatability of automated central cor-neal thickness (CCT) measurementsobtained by a commercially availableswept-source AS-OCT. CCT measure-ments obtained with AS-OCT werecompared with those obtained withUSP and retinal SD-OCT with cor-neal module. Moreover, the repeat-ability of pachymetric maps by swept-source AS-OCT was analysed.
Methods
All the participants in the study pro-vided informed consent and were trea-ted in accordance with the principles ofthe Declaration of Helsinki. The righteyes of fifty volunteers, with no oph-thalmic pathologies except mild refrac-tive errors, were included in the study.A single, experienced operator analy-sed all the included eyes with threedifferent devices: (i) a swept-sourceAS-OCT (CASIA-OCT�, produced byTomey Co., Nishi-Ku, Nagoya, Japan),(ii) a retinal OCT with corneal module(Cirrus-OCT�, produced by Zeiss Inc.,Oberkochen, Germany) and (iii) anultrasound pachymeter (AL-2000�,produced by Tomey Co., Japan).
All the measurements on each eyewere performed twice in a single ses-sion (maximum overall time 2 hr) toanalyse the repeatability of cornealthickness measurements.
Central corneal thickness measurements
and pachymetric maps by AS-OCT
CASIA-OCT� (produced by TomeyCo.) is a commercially available SDAS-OCT using a swept-source laseremitting light with wavelength centredat 1310 nm. Its main features are axialand transverse resolution, respectively,of 10 and 30 lm, scanning speed of30 000 A-scans ⁄ sec and a scan patternthat is widely customizable into a maxi-mal scanning width of 16 · 16 mm anda maximum depth of 6 mm in tissue.The AS-OCT is equipped with an auto-mated corneal topography routine,which was used in this study for theacquisition of corneal scans. The scanpattern consisted of 16 radial B-scan of10 · 4mm (512 A-scan for each line),centred on the corneal vertex (fixationaxis); centring during the scan acquisi-tion was automatically performed bythe device, while the subject was fixatingan internal aim. The acquisition time ofthe corneal topography routine is<0.3 seconds. The OCT software auto-matically identified the outer and innercorneal boundaries on each B-scanimage, allowing the operator to checkthe accuracy of corneal boundariesidentification on each line scan beforeproceeding to the analysis of data.
Quantitative analysis of data waspreceded by the correction of theOCT images for the optical effect ofthe corneal surface, which was auto-matically performed by the OCT soft-ware using an optical constant of1.389. The corrected images were thenautomatically analysed obtainingpachymetric maps consisting of cor-neal thickness values in 8192 points,corresponding to 512 A-scan · 16meridians). The CCT (corneal thick-ness at vertex) was indicated sepa-rately. Raw pachymetric maps andCCT values were finally exported forstatistical analysis.
Central corneal thickness measurements
by retinal optical coherence tomography
Cirrus-OCT� (produced by Zeiss Inc.)is a SD retinal OCT that is character-ized by a super-luminescent diode
(SLD) emitting light with wavelengthcentred on 840 nm. The axial andtransverse resolutions are 5 and15 lm, respectively, and the acquisi-tion rate is 27 000 A-scans ⁄ sec. CirrusOCT is equipped with anterior seg-ment analysis modes. The ‘High reso-lution anterior segment’ mode wasused in this study for corneal imaging.It consists of five horizontal line scansof 3 mm in width · 2 mm in depth,each B-scan consisting of 4096 A-scan. During the acquisition of thecorneal scans, the subjects were askedto stare at a fixation target within theOCT device, and the scans were man-ually centred at the corneal vertex.The orthogonality of the scans wasoptimized maximizing the vertexreflection of the OCT signal. Auto-mated signal quality report was usedto ensure the good quality of theacquired images. Inadequate scans(score<6 ⁄ 10) were discarded. Centralscans including the corneal vertexwere then analysed with a dedicatedfunction of the OCT software to assistthe measurement of CCT values. Anelectronic ruler was automaticallypositioned by the software along thefixation axis, and the operator identi-fied the inner and outer cornealboundaries.
Central corneal thickness measurements
by ultrasound pachymetry
Ultrasound pachymetry was obtainedby means of pachymeter AL-2000�
(produced by Tomey Co.) after topi-cal anaesthesia with oxybuprocaine0.4%. The tip of the ultrasound probewas placed directly in the centre ofthe cornea, creating a 90-� angle. USPfinal measurements consisted of themean of 5 measurements. USP mea-surements were always performed asthe last procedure to avoid alterationsof the corneal surface.
Statistical analysis
Statistical analysis was performedwith Microsoft Excel 2008 (Micro-soft� Co, Redmond, Washington,D.C., USA) and PASW Statistic soft-ware (version 18.0, SPSS, IBM� Co,Armonk, New York, USA). The Kol-mogorov–Smirnov test was prelimi-narily used to verify that all the datawere normally distributed and, hence,that parametric tests could be used. p
Acta Ophthalmologica 2012
2

values <0.05 were considered statisti-cally significant.
The paired t-test was used for singlecomparisons, while repeated-measuresanalysis of variance (anova) with theBonferroni correction was utilized formultiple comparisons. Bland–Altmangraphs were also used to comparemethods (Bland & Altman 1986). Cor-relation among the measures obtainedby the different devices was analysedusing the Pearson coefficient.
Repeatability of CCT measurementswas assessed using Alpha of Cron-bach, intraclass correlation coefficient(ICC) and coefficient of repeatability(CR = 1.96 · SD of differencesbetween repeated measurements). Therepeatability of pachymetric maps wassimilarly assessed using Alpha of Cron-bach, ICC and CR, comparing thethickness measurements of single corre-sponding points of the entire maps, ofthe thinnest corneal location and ofthree concentric zones: central (radius= 1.5 mm), paracentral (radius = 1.5–2.5 mm) and peripheral zone (radius= 2.5–4.5 mm). The repeatability wascompared between the differentdevices using a test designed to com-pare correlated variances in pairedsamples (Snedecor & Cochran 1967).
Results
Table 1 reports the results of the com-parison of CCT values obtained bymeans of AS-OCT, retinal OCT andUSP. Mean ± SD CCT values were540.4 ± 28.9, 544.2 ± 29.5 and 549.3± 31.7 lm for AS-OCT, retinal OCTand USP, respectively. While the corre-lation among the three devices wasexcellent (range of r was 0.962–0.984),CCT measurements performed by AS-OCT were statistically significantlylower as compared to CCT valuesobtained by retinal OCT, and both AS-OCT and retinal OCT measurementswere lower than USP. Fig. 1 shows
scatter plots and Bland–Altman graphsfor the comparisons among devices.
The repeatability of CCT measure-ments (Table 2) resulted statisticallysignificantly better for AS-OCT thanfor the other devices (p < 0.001),while no difference of repeatabilitywas found between retinal OCT andUSP (p = 0.60). Fig. 2 shows thescatter plots and Bland–Altmangraphs for the analysis of repeatabil-ity.
The analysis of automated cornealpachymetric maps obtained with theAS-OCT is reported in Table 3. Therepeatability of entire pachymetricmaps was excellent (ICC = 0.999). Atthe thinnest location, repeatability ofthickness values was excellent (ICC =0.9994, CR = 2.28 lm (0.44%)). Alsothe analysis of the three concentriczones of the pachymetric mapsshowed excellent repeatability withICC>0.998 and CR<6.12 lm(0.98%) in all cases, with a slight ten-dency of CR to increase from the cen-tral zone to periphery (Table 3).
Discussion
Corneal thickness measurement withanterior segment OCT has obviouspotential advantages over USP, as itis a fast and noncontact technique,and provides the possibility of cornealpachymetric map analysis, and it maybe less influenced by the presence ofinterface anomalies in the cornealstroma, for example following anterioror posterior lamellar keratoplasty orLASIK (Lyles & Cohen 2010).
As a consequence of the interest forthe technique, the accuracy andrepeatability of AS-OCT pachymetryhave been extensively studied in recentyears, to assess whether it could beutilized interchangeably with USP inclinical practice (Li et al. 2006, 2007;Mohamed et al. 2007; Zhao et al.2007; Kim et al. 2008; Li et al.
2008a,b; Sandler et al. 2008; Fukudaet al. 2009; Prakash et al. 2009; Pros-pero Ponce et al. 2009; Chen et al.2010; Ishibazawa et al. 2011).
Comparing the three methods formeasuring CCT, we found that therewas a high correlation among devices,and that AS-OCT and retinal OCTunderestimated the CCT measuresobtained with USP by 8.9 and 5.1 lm,respectively. Although small, these dif-ferences were statistically significant,consistently with previous literature(Li et al. 2006, 2007; Mohamed et al.2007; Zhao et al. 2007; Kim et al.2008; Li et al. 2008a,b; Sandleret al. 2008; Fukuda et al. 2009; Prak-ash et al. 2009; Prospero Ponce et al.2009; Chen et al. 2010; Ishibazawaet al. 2011). According to the overallresults reported by Ishibazawa et al.(Ishibazawa et al. 2011), OCT devicesin most cases underestimated CCT ascompared to USP by an amount thatwas variable from 2.0 to 26.3 lm,while a high correlation between OCTdevices and USP was found in allinstances (r ranging from 0.90 to0.98). Repeatability was also verygood in all the reported studies (ICCranging from 0.948 to 0.999).
Although minimal, the differencesfound in CCT values may be clinicallysignificant, especially in patientsundergoing corneal surgery. In fact,overestimation may lead to excessivethinning of the cornea during refrac-tive surgery, with possible subsequentectasia, or cause corneal perforationsduring relaxing incisions, radial kerat-otomy or partial thickness trephinationin lamellar keratoplasty procedures.Underestimation can cause the exclu-sion of eligible patients from other-wise possible refractive or surgicalprocedures. An error of 10% of cor-neal thickness measurements may alsohave influence on the clinical role ofpachymetry in the assessment of glau-coma risk (Gordon et al. 2002). On
Table 1. Comparison of central corneal thickness (CCT) measurements in 50 normal eyes between anterior segment optical coherence tomogra-
phy (AS-OCT), retinal optical coherence tomography OCT and ultrasound pachymetry (USP).
Repeated-measures anova AS-OCT Retinal OCT USP
Mean CCT ± SD 540.4 ± 28.9 lm 544.2 ± 29.5 lm 549.3 ± 31.7 lm
Pairwise comparisons Mean Difference ± SD 95% LOA Bonferroni test Pearson
AS-OCT versus USP )8.9 ± 8.4 lm )25.3 to 7.5 lm p = 0.013 r = 0.965 (p < 0.001)
Retinal OCT versus USP )5.1 ± 10.6 lm )25.9 to 15,7 p < 0.001 r = 0.962 (p < 0.001)
AS-OCT versus retinal OCT )3.8 ± 7.2 lm )17.8 to 10.3 lm p = 0.005 r = 0.984 (p < 0.001)
Acta Ophthalmologica 2012
3

the other hand, Reader and Saltzreported a maximum difference of49lm in CCT measurements obtainedwith different US pachymeters(Reader & Salz 1987), and a SD of31 lm for mean CCT measurementsin normal eyes has been reported by ameta-analysis (Doughty & Zaman
2000). These values are not inferior tothose found in the present study.
The exact reasons for the disparitybetween OCT and ultrasound pachy-metry remain unknown, but possibleexplanations may reside in the intrin-sically manual and contact nature ofthe method. Li et al. (2006) affirmed
that a possible reason for the differ-ence in pachymetric measurementsbetween USP and OCT systems couldbe the better centration and perpen-dicularity obtained by OCT devices. Aminor precision of any of these factorsmay in fact bias the USP measurementstowards higher values. This observa-tion is also appropriate in the presentwork, as centring and perpendicularityof thickness measurements is expectedto be highly precise in AS-OCTand ret-inal OCT, thanks to the presence inboth devices of internal targets for fixa-tion and of live-imaging systems thatallow alignment to be controlled dur-ing scan acquisition. Moreover, in theAS-OCT, the alignment procedure iscompletely automatized.
The repeatability of CCT measure-ments was very good for all devices, butit was statistically significantly better
Fig. 1. Scatter plots and Bland–Altman graphs for pairwise comparisons among devices measuring central corneal thickness.
Table 2. Analysis of repeatability of central corneal thickness measurements obtained by AS-
OCT, retinal OCT and ultrasound pachymetry (USP). Repeatability resulted significantly better
for anterior segment optical coherence tomography (AS-OCT) than for the other devices
(p < 0.001), while no difference of repeatability was found between retinal OCT and USP
(p = 0.60).
Repeatability AS-OCT Retinal OCT USP
Alpha of Cronbach 0.999 0.990 0.994
Intraclass correlation coefficient 0.998 0.980 0.985
Mean Difference ± SD 0.1 ± 1.79 lm )0.2 ± 6.0 lm )0.1 ± 5.5 lmCoefficient of repeatability
(% of mean of measures)
3.50 lm (0.65%) 11.69 lm (2.15%) 10.84 lm (1.97%)
Acta Ophthalmologica 2012
4
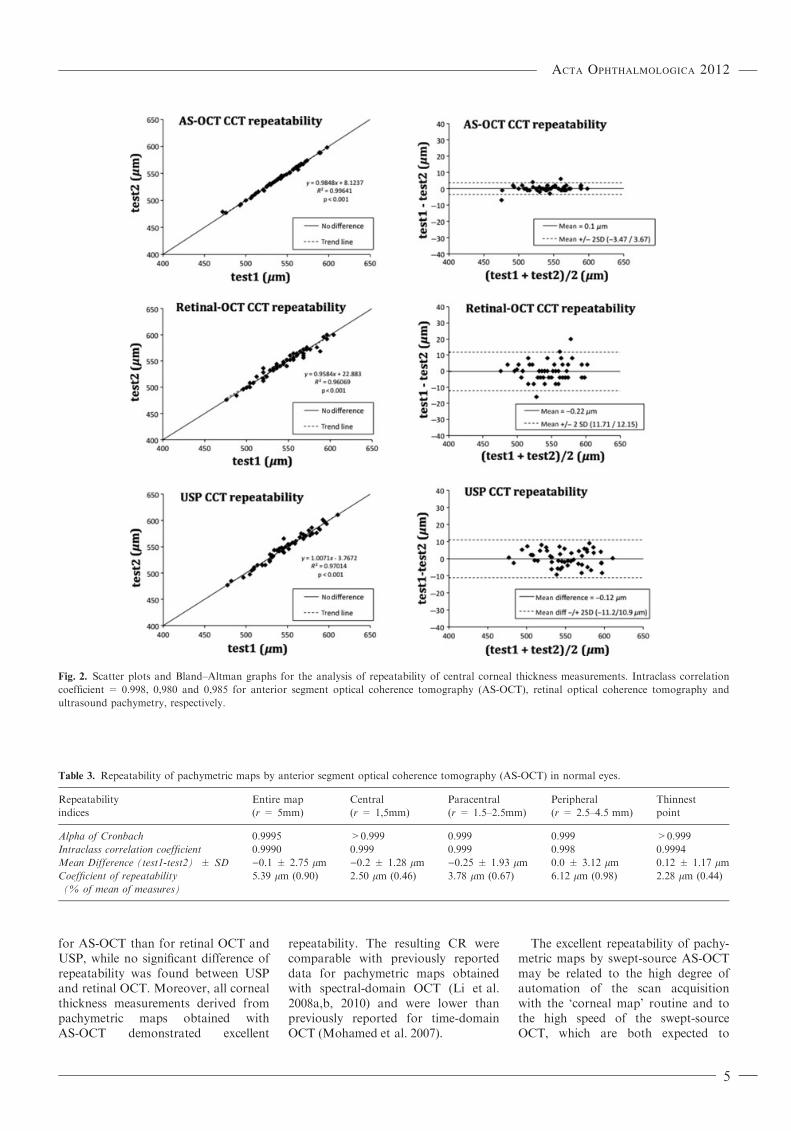
for AS-OCT than for retinal OCT andUSP, while no significant difference ofrepeatability was found between USPand retinal OCT. Moreover, all cornealthickness measurements derived frompachymetric maps obtained withAS-OCT demonstrated excellent
repeatability. The resulting CR werecomparable with previously reporteddata for pachymetric maps obtainedwith spectral-domain OCT (Li et al.2008a,b, 2010) and were lower thanpreviously reported for time-domainOCT (Mohamed et al. 2007).
The excellent repeatability of pachy-metric maps by swept-source AS-OCTmay be related to the high degree ofautomation of the scan acquisitionwith the ‘corneal map’ routine and tothe high speed of the swept-sourceOCT, which are both expected to
Fig. 2. Scatter plots and Bland–Altman graphs for the analysis of repeatability of central corneal thickness measurements. Intraclass correlation
coefficient = 0.998, 0,980 and 0,985 for anterior segment optical coherence tomography (AS-OCT), retinal optical coherence tomography and
ultrasound pachymetry, respectively.
Table 3. Repeatability of pachymetric maps by anterior segment optical coherence tomography (AS-OCT) in normal eyes.
Repeatability
indices
Entire map
(r = 5mm)
Central
(r = 1,5mm)
Paracentral
(r = 1.5–2.5mm)
Peripheral
(r = 2.5–4.5 mm)
Thinnest
point
Alpha of Cronbach 0.9995 >0.999 0.999 0.999 >0.999
Intraclass correlation coefficient 0.9990 0.999 0.999 0.998 0.9994
Mean Difference (test1-test2) ± SD )0.1 ± 2.75 lm )0.2 ± 1.28 lm )0.25 ± 1.93 lm 0.0 ± 3.12 lm 0.12 ± 1.17 lmCoefficient of repeatability
(% of mean of measures)
5.39 lm (0.90) 2.50 lm (0.46) 3.78 lm (0.67) 6.12 lm (0.98) 2.28 lm (0.44)
Acta Ophthalmologica 2012
5
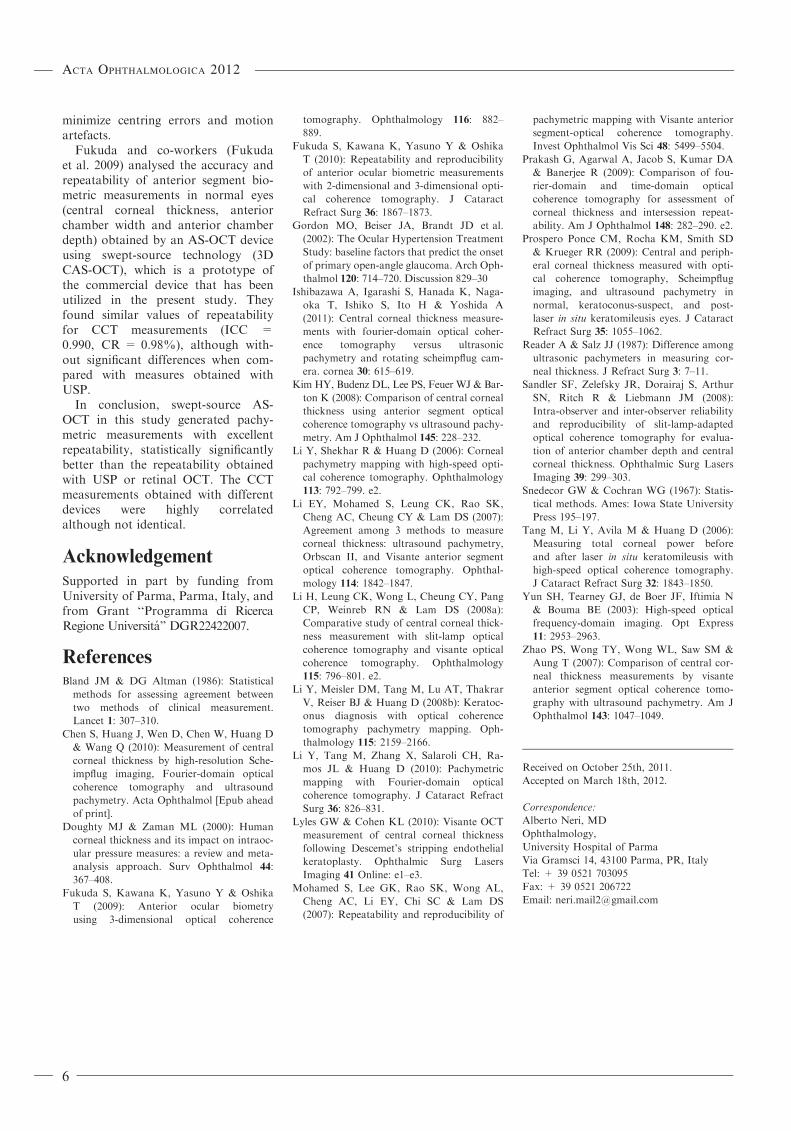
minimize centring errors and motionartefacts.
Fukuda and co-workers (Fukudaet al. 2009) analysed the accuracy andrepeatability of anterior segment bio-metric measurements in normal eyes(central corneal thickness, anteriorchamber width and anterior chamberdepth) obtained by an AS-OCT deviceusing swept-source technology (3DCAS-OCT), which is a prototype ofthe commercial device that has beenutilized in the present study. Theyfound similar values of repeatabilityfor CCT measurements (ICC =0.990, CR = 0.98%), although with-out significant differences when com-pared with measures obtained withUSP.
In conclusion, swept-source AS-OCT in this study generated pachy-metric measurements with excellentrepeatability, statistically significantlybetter than the repeatability obtainedwith USP or retinal OCT. The CCTmeasurements obtained with differentdevices were highly correlatedalthough not identical.
Acknowledgement
Supported in part by funding fromUniversity of Parma, Parma, Italy, andfrom Grant ‘‘Programma di RicercaRegione Universita’’ DGR22422007.
ReferencesBland JM & DG Altman (1986): Statistical
methods for assessing agreement between
two methods of clinical measurement.
Lancet 1: 307–310.
Chen S, Huang J, Wen D, Chen W, Huang D
& Wang Q (2010): Measurement of central
corneal thickness by high-resolution Sche-
impflug imaging, Fourier-domain optical
coherence tomography and ultrasound
pachymetry. Acta Ophthalmol [Epub ahead
of print].
Doughty MJ & Zaman ML (2000): Human
corneal thickness and its impact on intraoc-
ular pressure measures: a review and meta-
analysis approach. Surv Ophthalmol 44:
367–408.
Fukuda S, Kawana K, Yasuno Y & Oshika
T (2009): Anterior ocular biometry
using 3-dimensional optical coherence
tomography. Ophthalmology 116: 882–
889.
Fukuda S, Kawana K, Yasuno Y & Oshika
T (2010): Repeatability and reproducibility
of anterior ocular biometric measurements
with 2-dimensional and 3-dimensional opti-
cal coherence tomography. J Cataract
Refract Surg 36: 1867–1873.
Gordon MO, Beiser JA, Brandt JD et al.
(2002): The Ocular Hypertension Treatment
Study: baseline factors that predict the onset
of primary open-angle glaucoma. Arch Oph-
thalmol 120: 714–720. Discussion 829–30
Ishibazawa A, Igarashi S, Hanada K, Naga-
oka T, Ishiko S, Ito H & Yoshida A
(2011): Central corneal thickness measure-
ments with fourier-domain optical coher-
ence tomography versus ultrasonic
pachymetry and rotating scheimpflug cam-
era. cornea 30: 615–619.
Kim HY, Budenz DL, Lee PS, Feuer WJ & Bar-
ton K (2008): Comparison of central corneal
thickness using anterior segment optical
coherence tomography vs ultrasound pachy-
metry. Am J Ophthalmol 145: 228–232.
Li Y, Shekhar R & Huang D (2006): Corneal
pachymetry mapping with high-speed opti-
cal coherence tomography. Ophthalmology
113: 792–799. e2.
Li EY, Mohamed S, Leung CK, Rao SK,
Cheng AC, Cheung CY & Lam DS (2007):
Agreement among 3 methods to measure
corneal thickness: ultrasound pachymetry,
Orbscan II, and Visante anterior segment
optical coherence tomography. Ophthal-
mology 114: 1842–1847.
Li H, Leung CK, Wong L, Cheung CY, Pang
CP, Weinreb RN & Lam DS (2008a):
Comparative study of central corneal thick-
ness measurement with slit-lamp optical
coherence tomography and visante optical
coherence tomography. Ophthalmology
115: 796–801. e2.
Li Y, Meisler DM, Tang M, Lu AT, Thakrar
V, Reiser BJ & Huang D (2008b): Keratoc-
onus diagnosis with optical coherence
tomography pachymetry mapping. Oph-
thalmology 115: 2159–2166.
Li Y, Tang M, Zhang X, Salaroli CH, Ra-
mos JL & Huang D (2010): Pachymetric
mapping with Fourier-domain optical
coherence tomography. J Cataract Refract
Surg 36: 826–831.
Lyles GW & Cohen KL (2010): Visante OCT
measurement of central corneal thickness
following Descemet’s stripping endothelial
keratoplasty. Ophthalmic Surg Lasers
Imaging 41 Online: e1–e3.
Mohamed S, Lee GK, Rao SK, Wong AL,
Cheng AC, Li EY, Chi SC & Lam DS
(2007): Repeatability and reproducibility of
pachymetric mapping with Visante anterior
segment-optical coherence tomography.
Invest Ophthalmol Vis Sci 48: 5499–5504.
Prakash G, Agarwal A, Jacob S, Kumar DA
& Banerjee R (2009): Comparison of fou-
rier-domain and time-domain optical
coherence tomography for assessment of
corneal thickness and intersession repeat-
ability. Am J Ophthalmol 148: 282–290. e2.
Prospero Ponce CM, Rocha KM, Smith SD
& Krueger RR (2009): Central and periph-
eral corneal thickness measured with opti-
cal coherence tomography, Scheimpflug
imaging, and ultrasound pachymetry in
normal, keratoconus-suspect, and post-
laser in situ keratomileusis eyes. J Cataract
Refract Surg 35: 1055–1062.
Reader A & Salz JJ (1987): Difference among
ultrasonic pachymeters in measuring cor-
neal thickness. J Refract Surg 3: 7–11.
Sandler SF, Zelefsky JR, Dorairaj S, Arthur
SN, Ritch R & Liebmann JM (2008):
Intra-observer and inter-observer reliability
and reproducibility of slit-lamp-adapted
optical coherence tomography for evalua-
tion of anterior chamber depth and central
corneal thickness. Ophthalmic Surg Lasers
Imaging 39: 299–303.
Snedecor GW & Cochran WG (1967): Statis-
tical methods. Ames: Iowa State University
Press 195–197.
Tang M, Li Y, Avila M & Huang D (2006):
Measuring total corneal power before
and after laser in situ keratomileusis with
high-speed optical coherence tomography.
J Cataract Refract Surg 32: 1843–1850.
Yun SH, Tearney GJ, de Boer JF, Iftimia N
& Bouma BE (2003): High-speed optical
frequency-domain imaging. Opt Express
11: 2953–2963.
Zhao PS, Wong TY, Wong WL, Saw SM &
Aung T (2007): Comparison of central cor-
neal thickness measurements by visante
anterior segment optical coherence tomo-
graphy with ultrasound pachymetry. Am J
Ophthalmol 143: 1047–1049.
Received on October 25th, 2011.
Accepted on March 18th, 2012.
Correspondence:
Alberto Neri, MD
Ophthalmology,
University Hospital of Parma
Via Gramsci 14, 43100 Parma, PR, Italy
Tel: + 39 0521 703095
Fax: + 39 0521 206722
Email: [email protected]
Acta Ophthalmologica 2012
6