core planning improvement project
TRANSCRIPT

To improve core serviceability and core planning process and suggesting input parameters for implementation on SAP
Core Plannig Improvement Project
CONTENTS Objective of Research Project Introduction Analysis of Sales and Serviceability Findings Suggestions Implementation Conclusion Limitation and Future scope
Objective: To analyze core serviceability of Arvind Life Style Brands and to
determine the reason of lack in serviceability To modify core planning process using statistical tools and to
find out the input parameters required to implement core planning on SAP
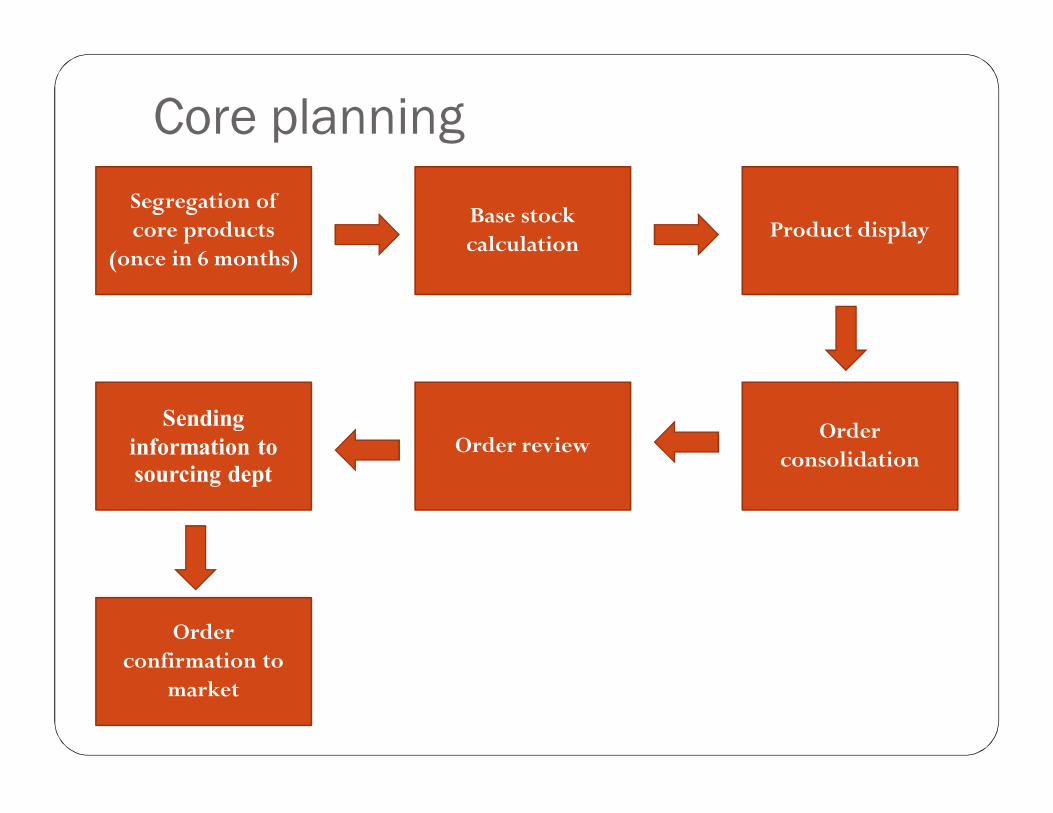
Core planningSegregation of core products
(once in 6 months)
Order confirmation to
market
Sending information to sourcing dept
Order review Order consolidation
Product displayBase stockcalculation

CONTENTS Objective of Research Project Introduction Analysis of Sales and Serviceability Findings Suggestions Implementation Conclusion Limitation and Future scope
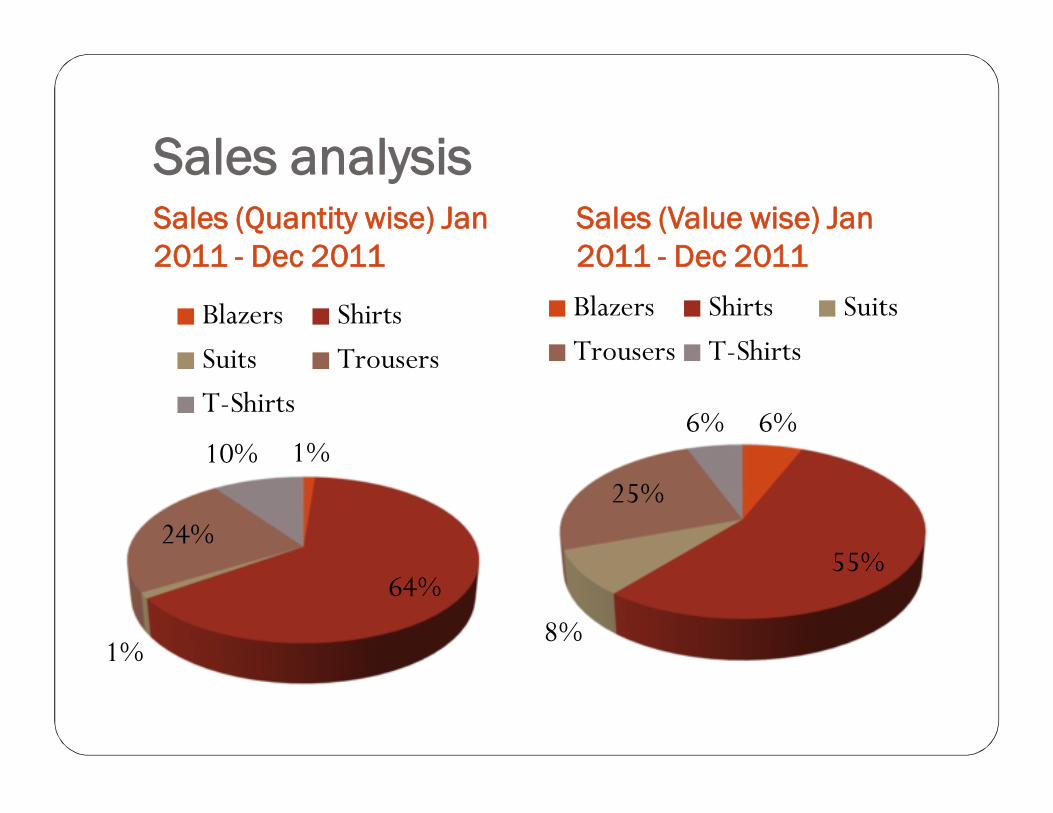
Sales analysisSales (Quantity wise) Jan 2011 - Dec 2011
Sales (Value wise) Jan 2011 - Dec 2011
1%
64%
1%
24%
10%
Blazers ShirtsSuits TrousersT-Shirts
6%
55%
8%
25%
6%
Blazers Shirts SuitsTrousers T-Shirts
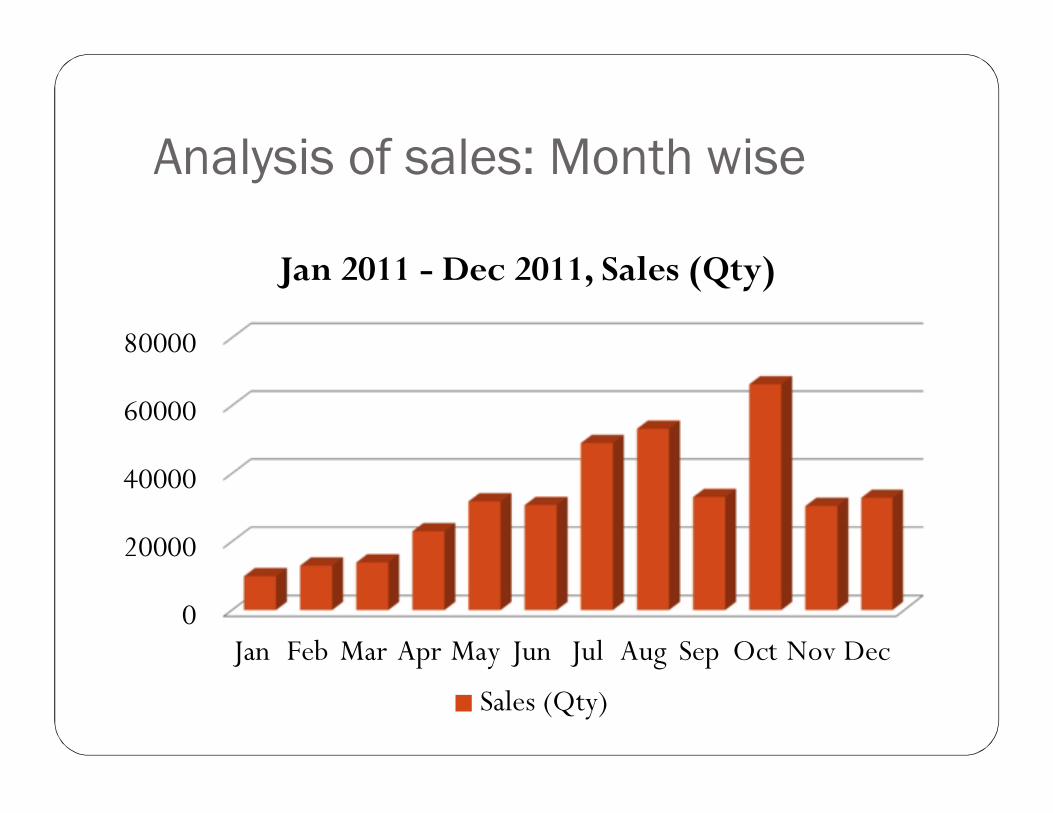
Analysis of sales: Month wise
0
20000
40000
60000
80000
Jan Feb Mar Apr May Jun Jul Aug Sep Oct Nov Dec
Jan 2011 - Dec 2011, Sales (Qty)
Sales (Qty)
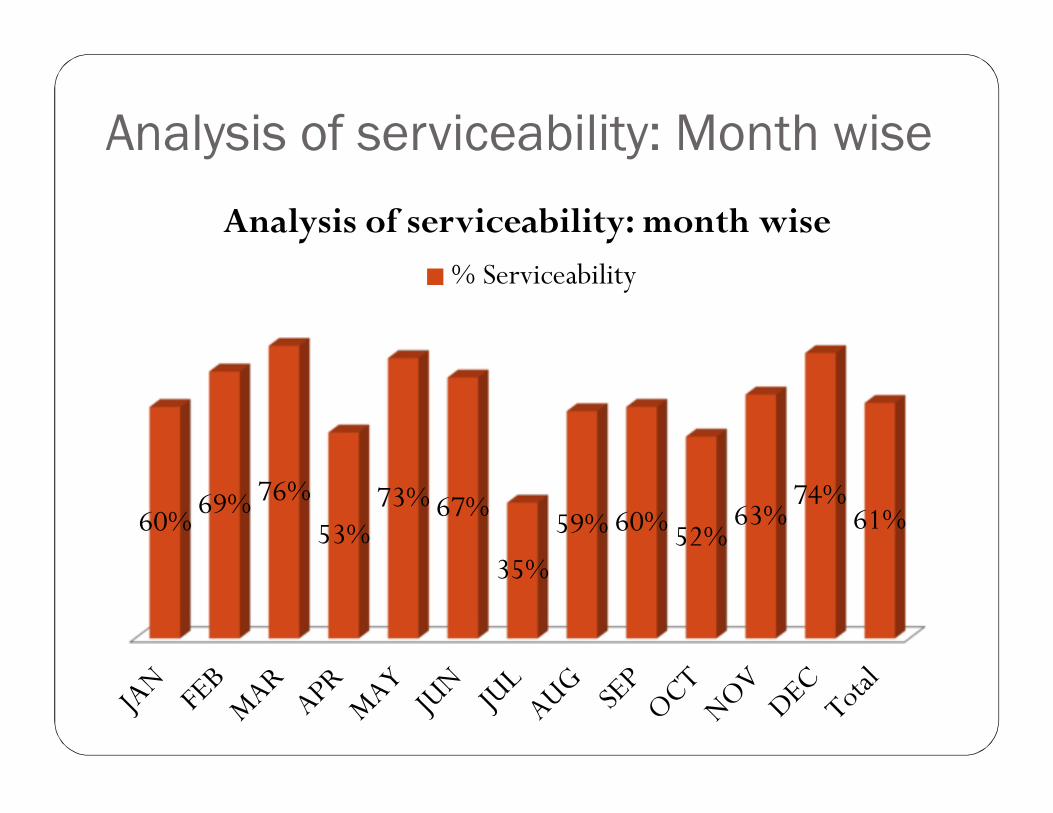
Analysis of serviceability: Month wise
60% 69% 76%53%
73% 67%
35%59% 60% 52%
63%74%
61%
Analysis of serviceability: month wise% Serviceability
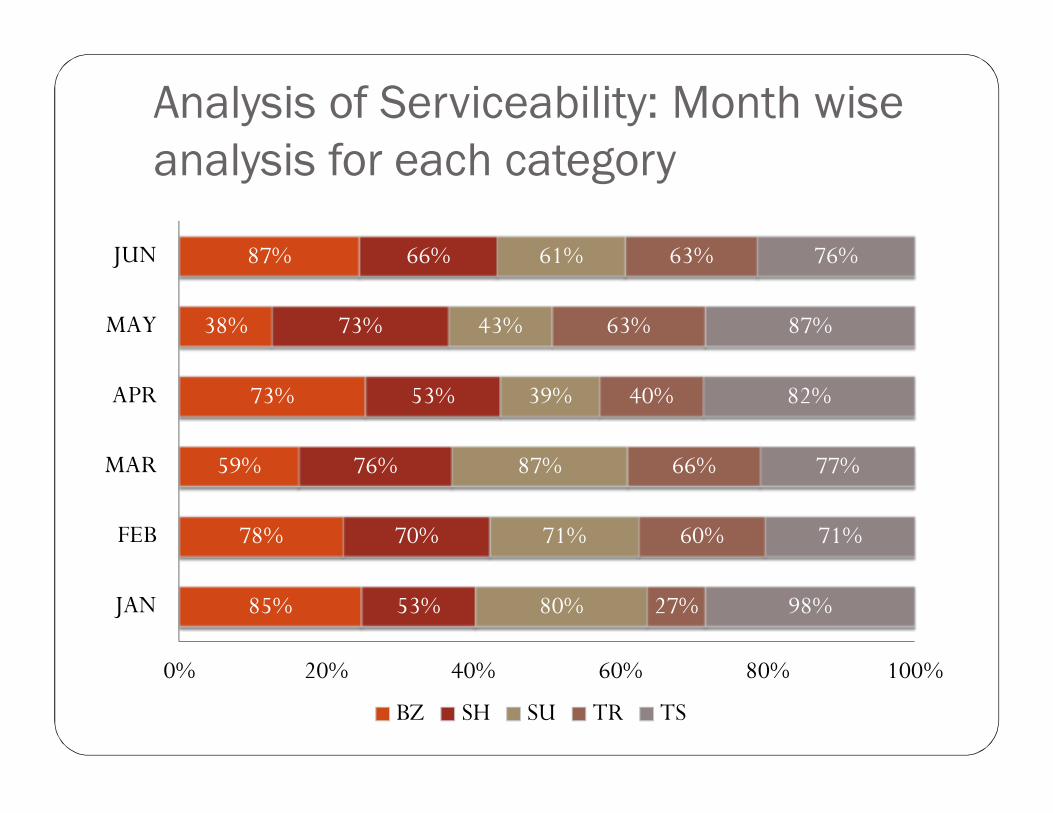
Analysis of Serviceability: Month wise analysis for each category
85%
78%
59%
73%
38%
87%
53%
70%
76%
53%
73%
66%
80%
71%
87%
39%
43%
61%
27%
60%
66%
40%
63%
63%
98%
71%
77%
82%
87%
76%
0% 20% 40% 60% 80% 100%
JAN
FEB
MAR
APR
MAY
JUN
BZ SH SU TR TS
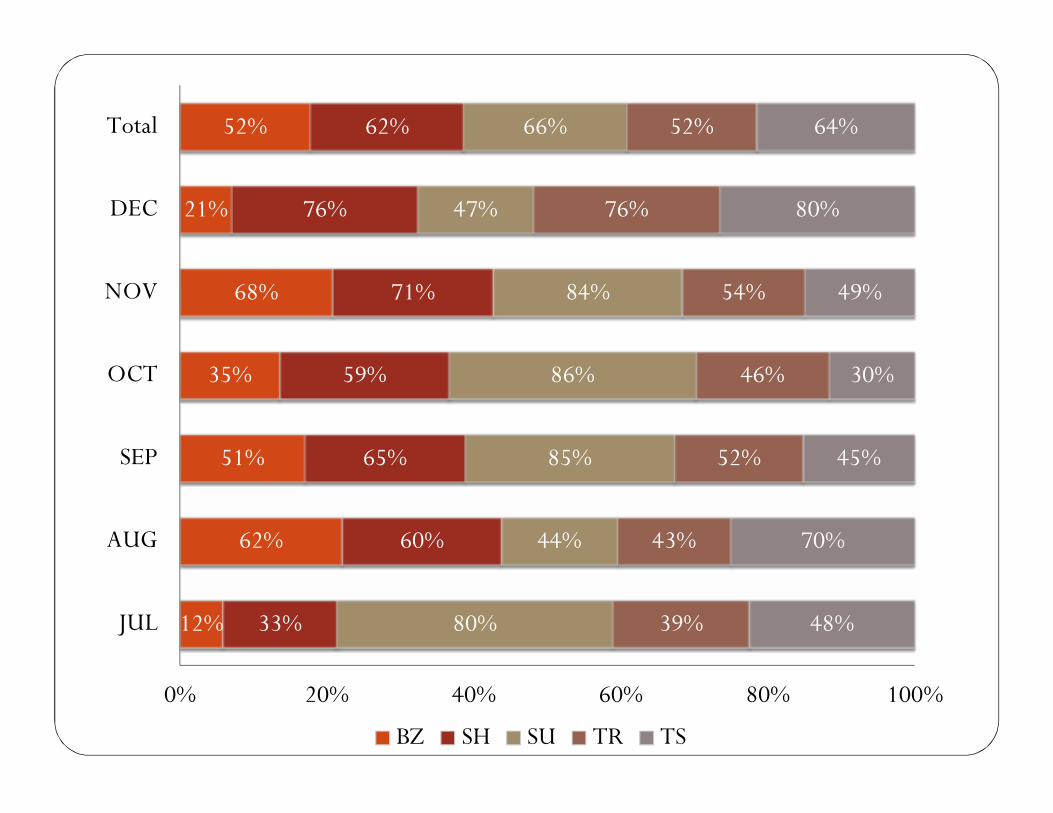
12%
62%
51%
35%
68%
21%
52%
33%
60%
65%
59%
71%
76%
62%
80%
44%
85%
86%
84%
47%
66%
39%
43%
52%
46%
54%
76%
52%
48%
70%
45%
30%
49%
80%
64%
0% 20% 40% 60% 80% 100%
JUL
AUG
SEP
OCT
NOV
DEC
Total
BZ SH SU TR TS
CONTENTS Objective of Research Project Company profile Introduction Analysis of Sales and Serviceability Findings Suggestions Implementation Conclusion Limitation and Future scope
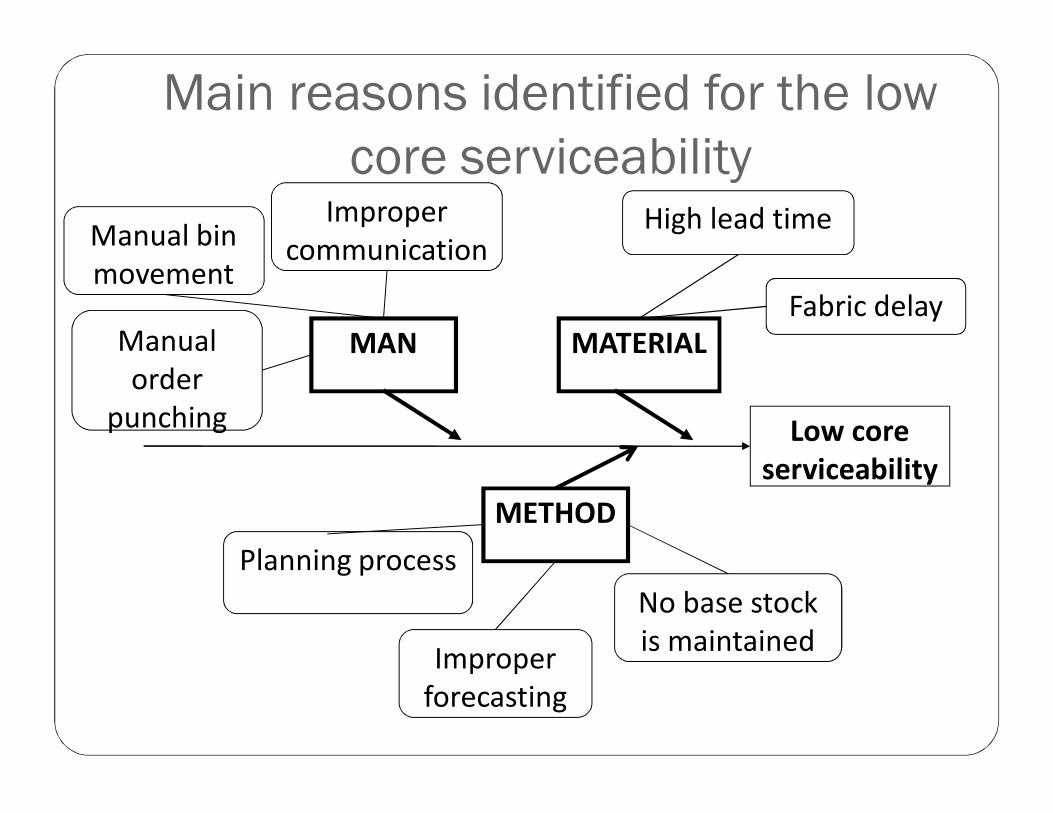
Main reasons identified for the low core serviceability
Low core serviceability
MAN MATERIAL
METHOD
Manual bin movement
Improper communication
Manual order
punching
Fabric delay
Planning process
High lead time
Improper forecasting
No base stock is maintained
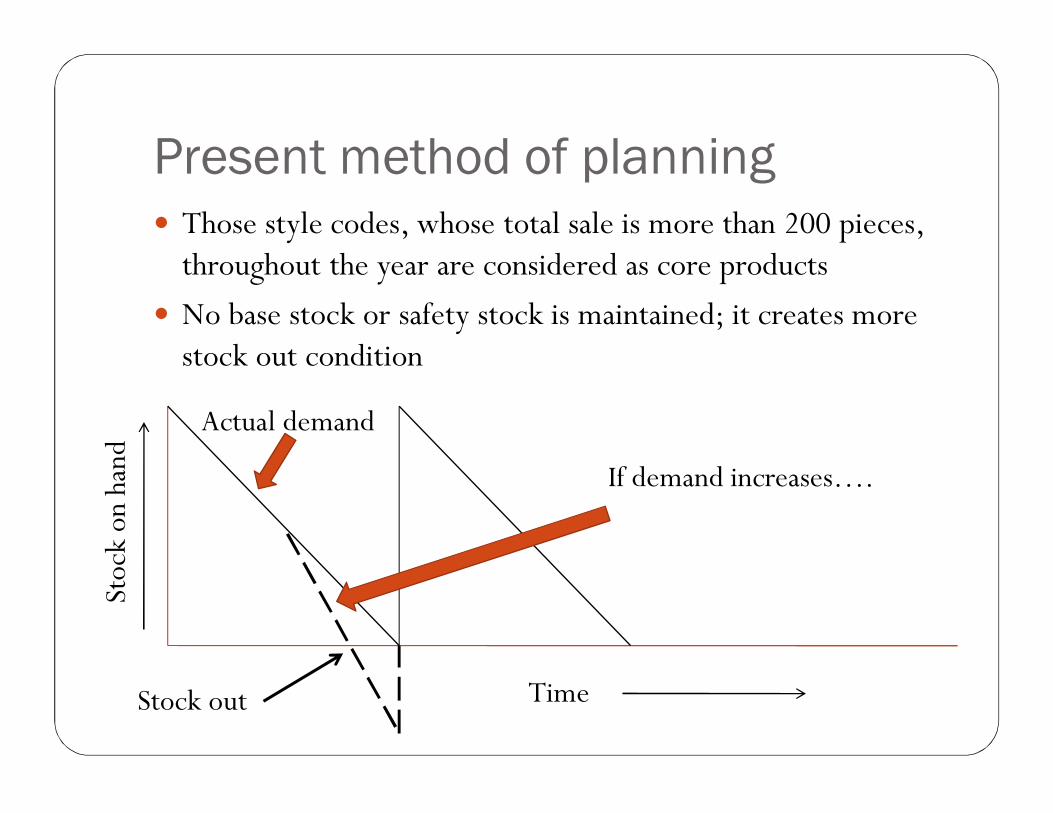
Present method of planning Those style codes, whose total sale is more than 200 pieces,
throughout the year are considered as core products No base stock or safety stock is maintained; it creates more
stock out condition
Stoc
k on
han
d
Time
If demand increases….
Actual demand
Stock out
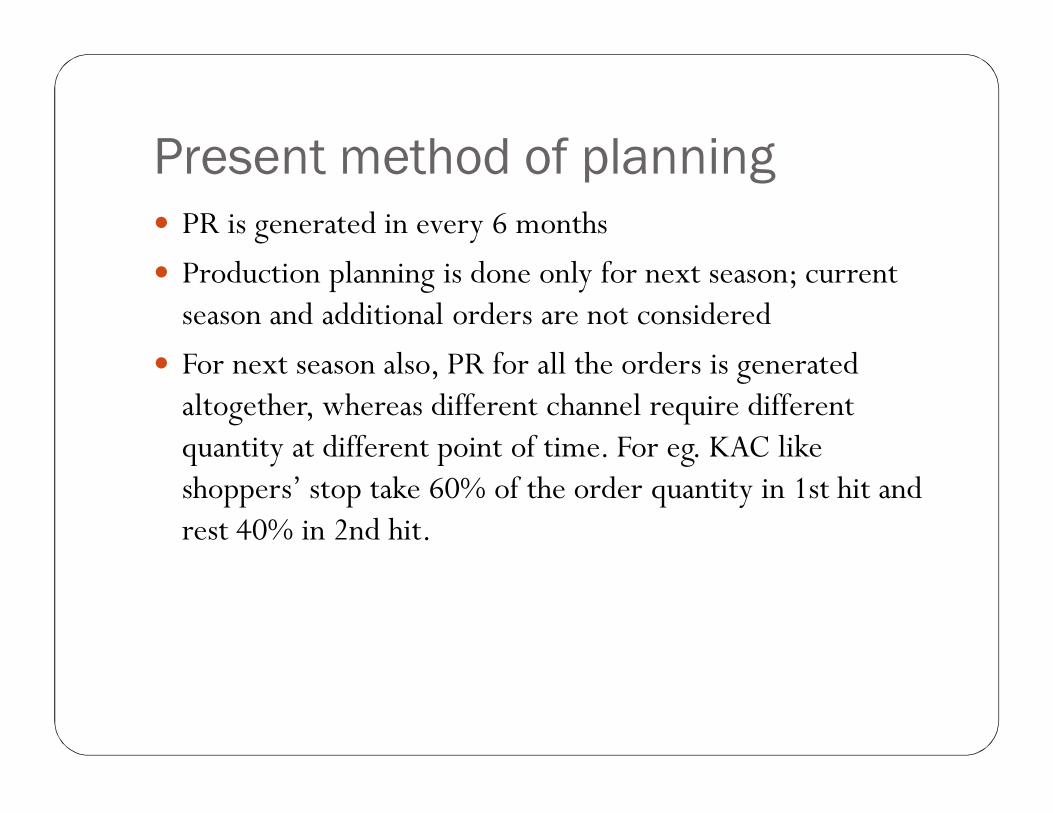
Present method of planning PR is generated in every 6 months Production planning is done only for next season; current
season and additional orders are not considered For next season also, PR for all the orders is generated
altogether, whereas different channel require different quantity at different point of time. For eg. KAC like shoppers’ stop take 60% of the order quantity in 1st hit and rest 40% in 2nd hit.

CONTENTS Objective of Research Project Company profile Introduction Analysis of Sales and Serviceability Findings Suggestions Implementation Conclusion Limitation and Future scope
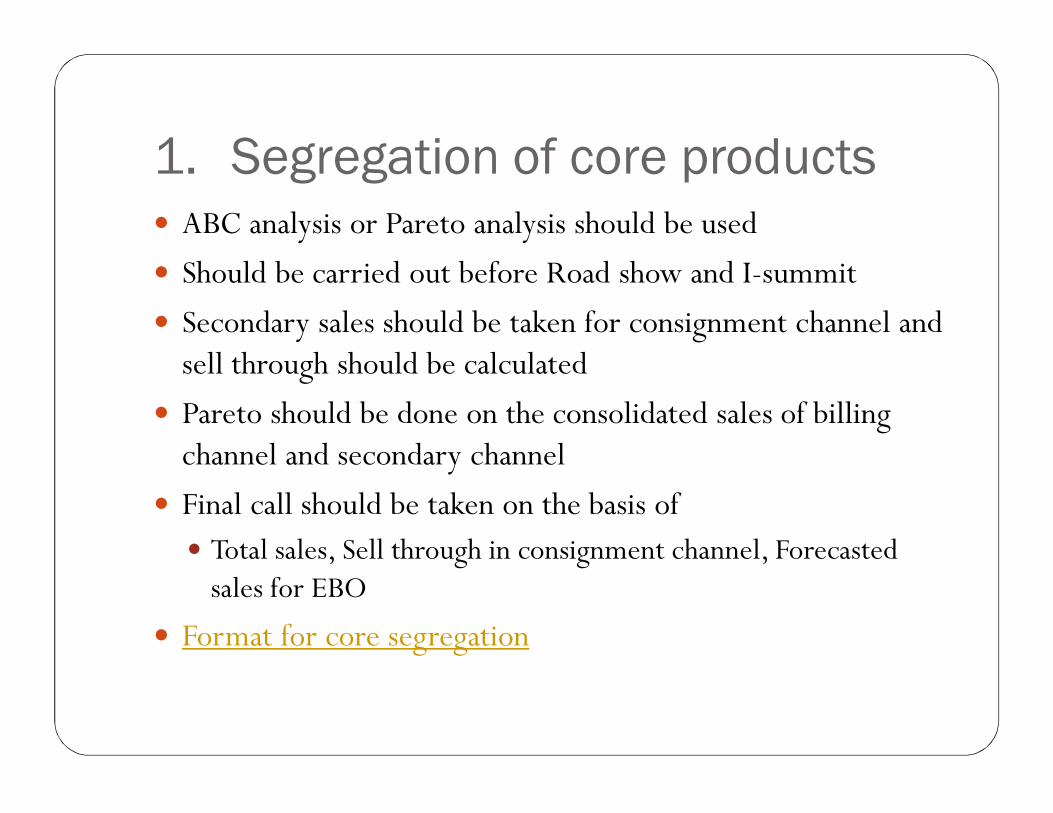
1. Segregation of core products ABC analysis or Pareto analysis should be used Should be carried out before Road show and I-summit Secondary sales should be taken for consignment channel and
sell through should be calculated Pareto should be done on the consolidated sales of billing
channel and secondary channel Final call should be taken on the basis of Total sales, Sell through in consignment channel, Forecasted
sales for EBO Format for core segregation
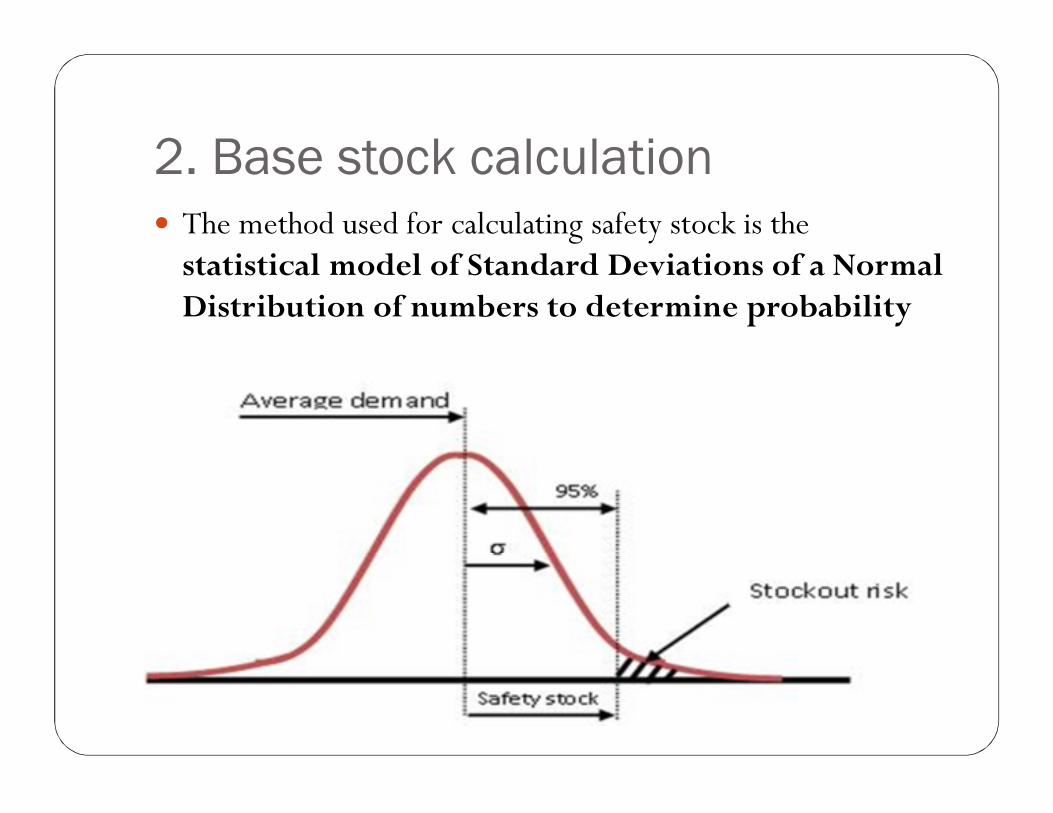
2. Base stock calculation The method used for calculating safety stock is the
statistical model of Standard Deviations of a Normal Distribution of numbers to determine probability
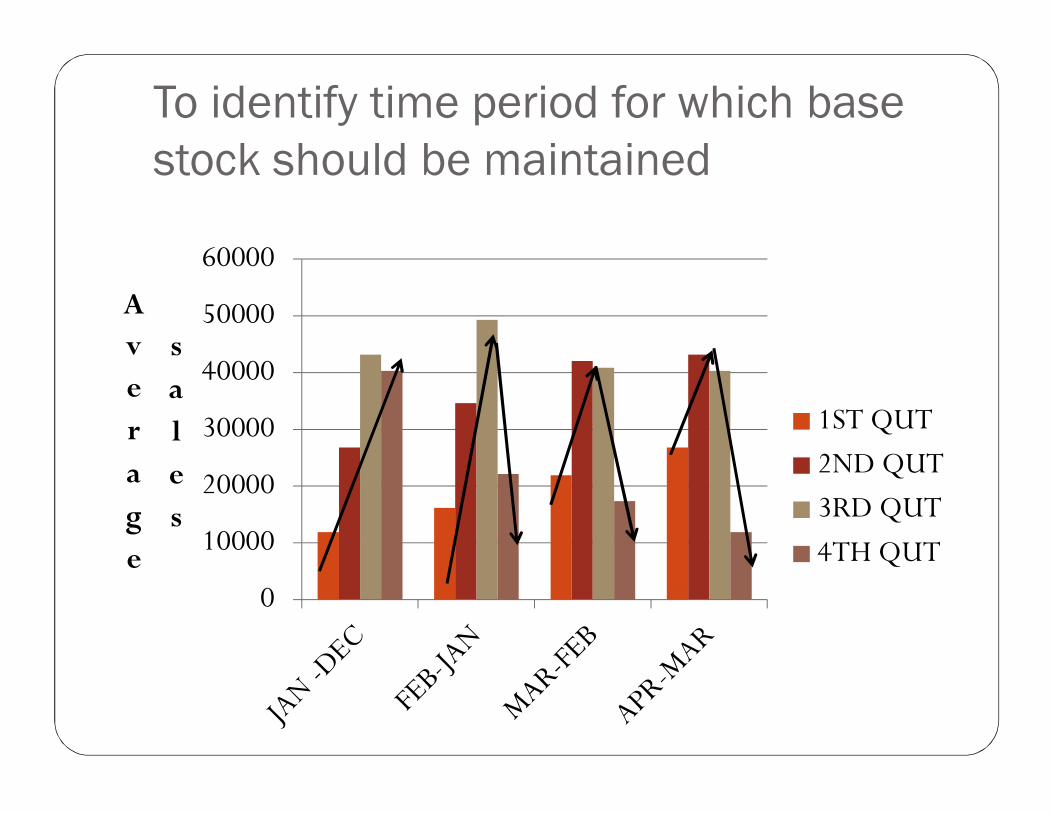
To identify time period for which base stock should be maintained
0
10000
20000
30000
40000
50000
60000Average
sales
1ST QUT2ND QUT3RD QUT4TH QUT
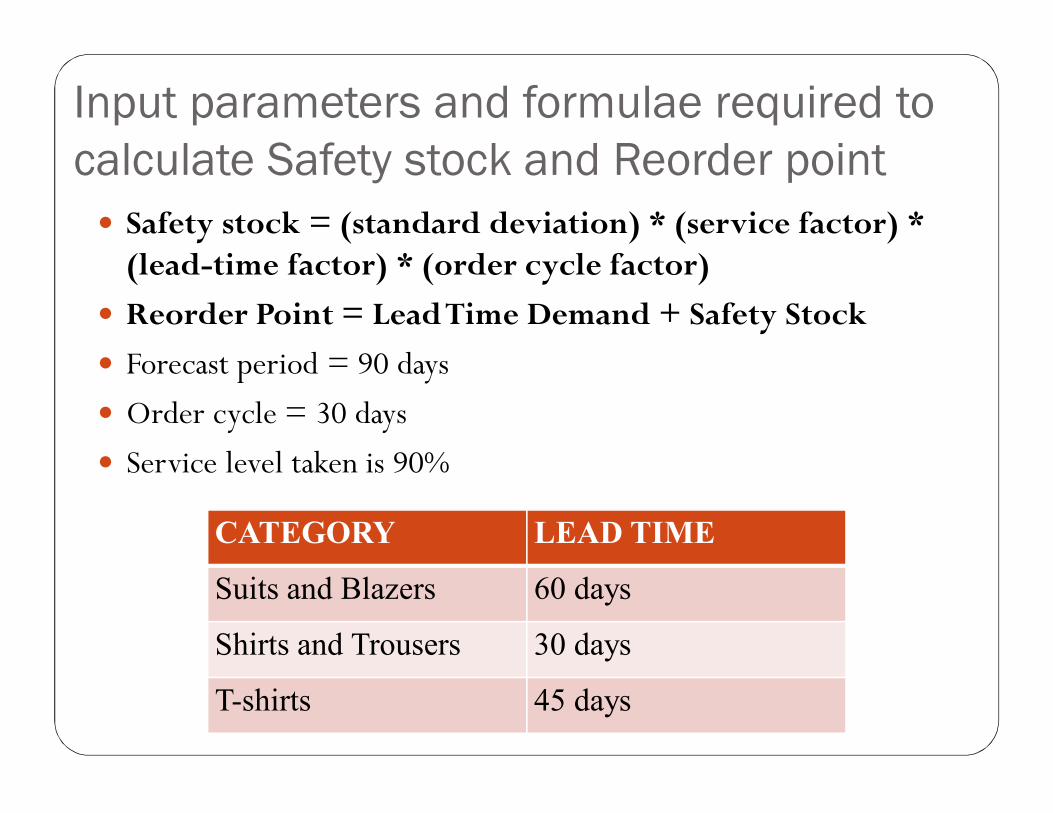
Input parameters and formulae required to calculate Safety stock and Reorder point Safety stock = (standard deviation) * (service factor) *
(lead-time factor) * (order cycle factor) Reorder Point = Lead Time Demand + Safety Stock Forecast period = 90 days Order cycle = 30 days Service level taken is 90%
CATEGORY LEAD TIME
Suits and Blazers 60 days
Shirts and Trousers 30 days
T-shirts 45 days
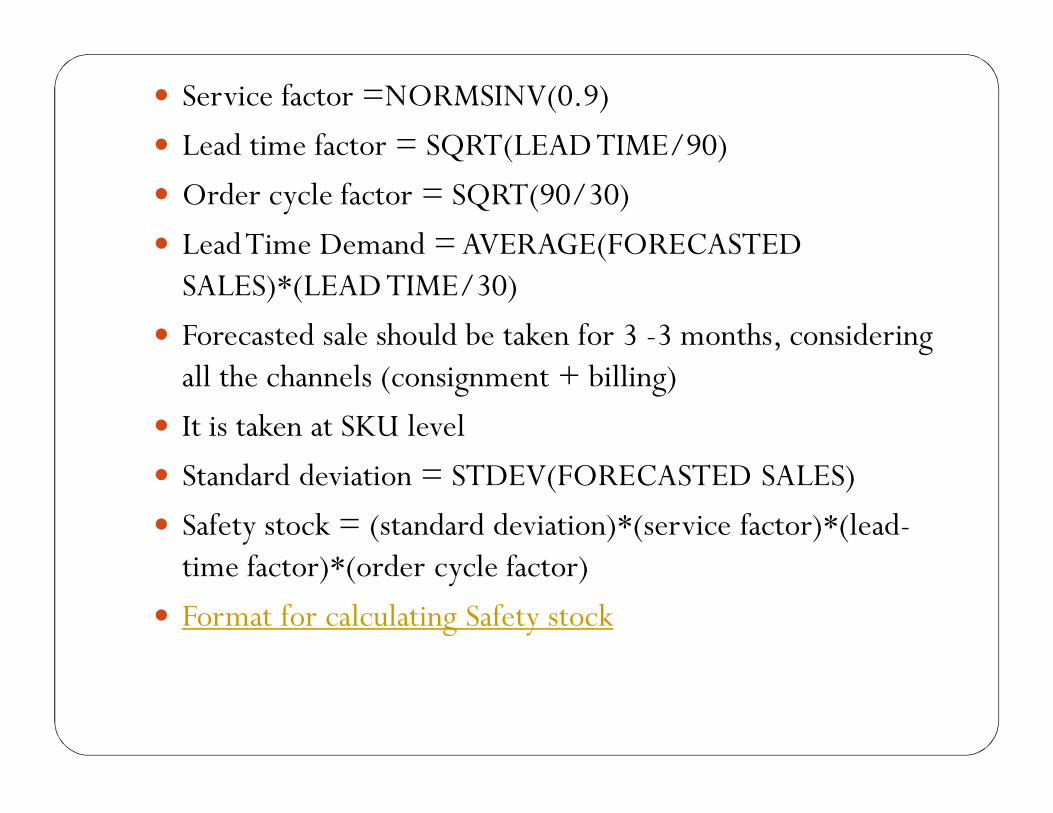
Service factor =NORMSINV(0.9) Lead time factor = SQRT(LEAD TIME/90) Order cycle factor = SQRT(90/30) Lead Time Demand = AVERAGE(FORECASTED
SALES)*(LEAD TIME/30) Forecasted sale should be taken for 3 -3 months, considering
all the channels (consignment + billing) It is taken at SKU level Standard deviation = STDEV(FORECASTED SALES) Safety stock = (standard deviation)*(service factor)*(lead-
time factor)*(order cycle factor) Format for calculating Safety stock
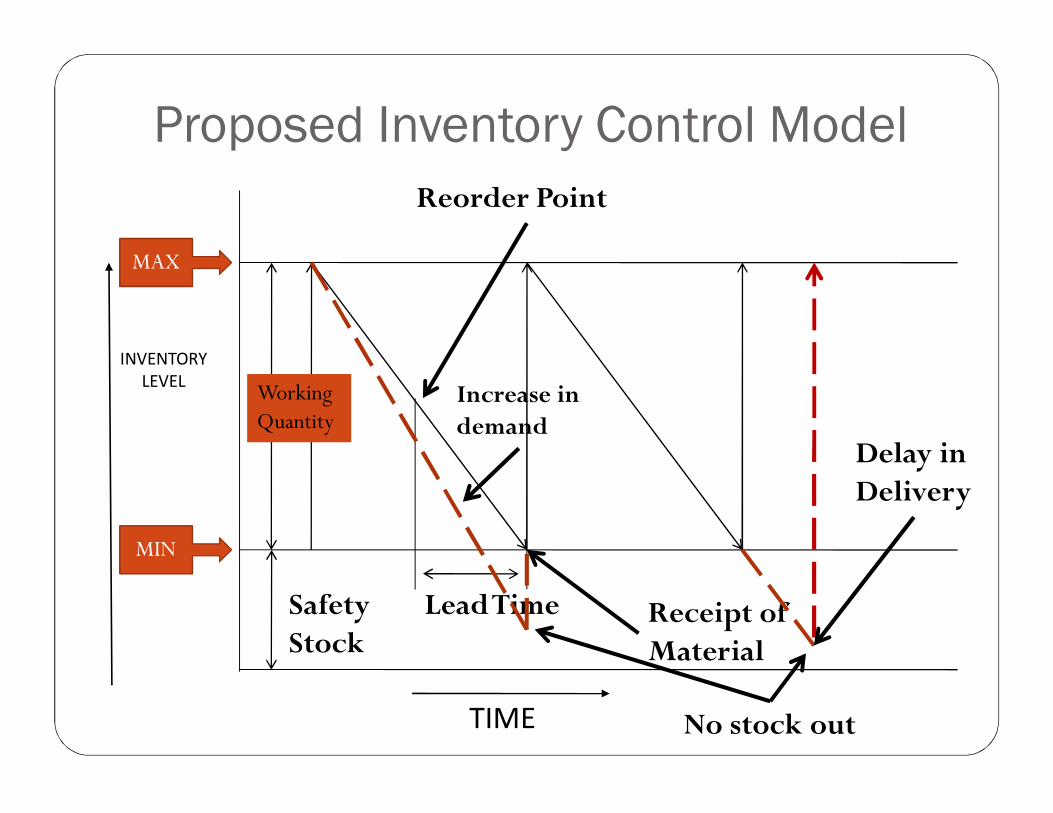
Proposed Inventory Control Model
INVENTORY LEVEL
TIME
MAX
MIN
Safety Stock
Working QuantityWorking Quantity
Lead Time Receipt of Material
Reorder Point
Increase in demand
Delay in Delivery
No stock out
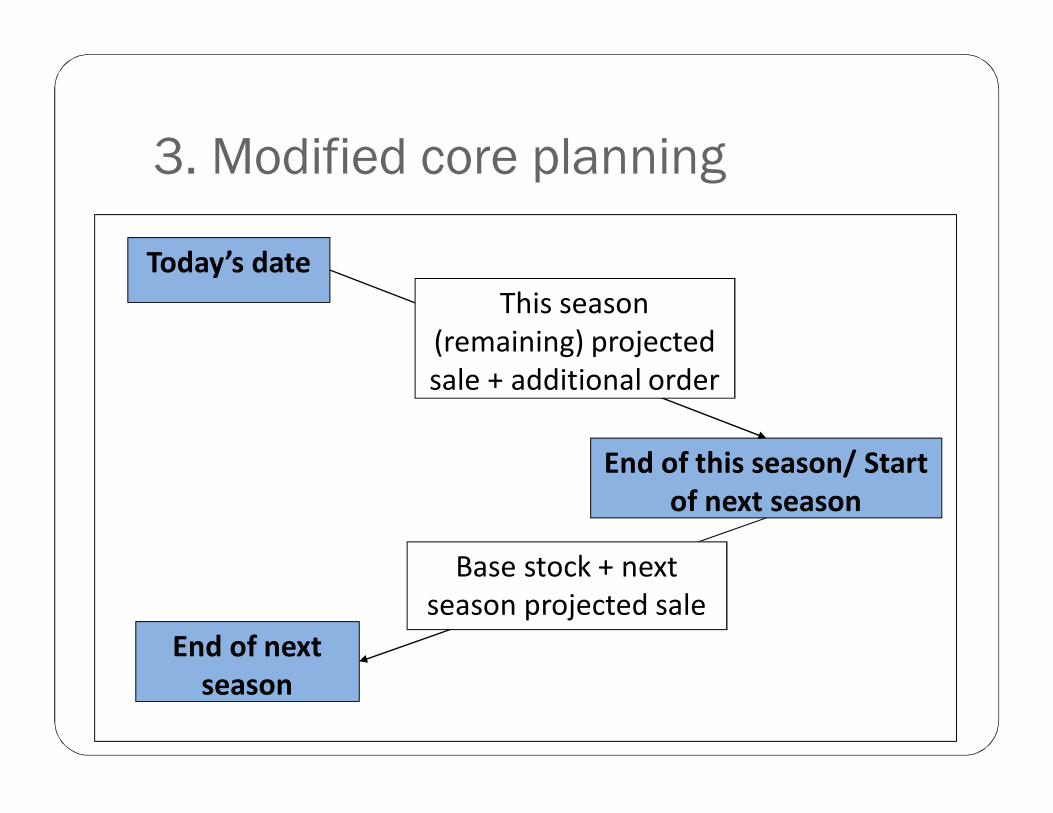
3. Modified core planning
Today’s date
End of this season/ Start of next season
End of next season
This season (remaining) projected sale + additional order
Base stock + next season projected sale
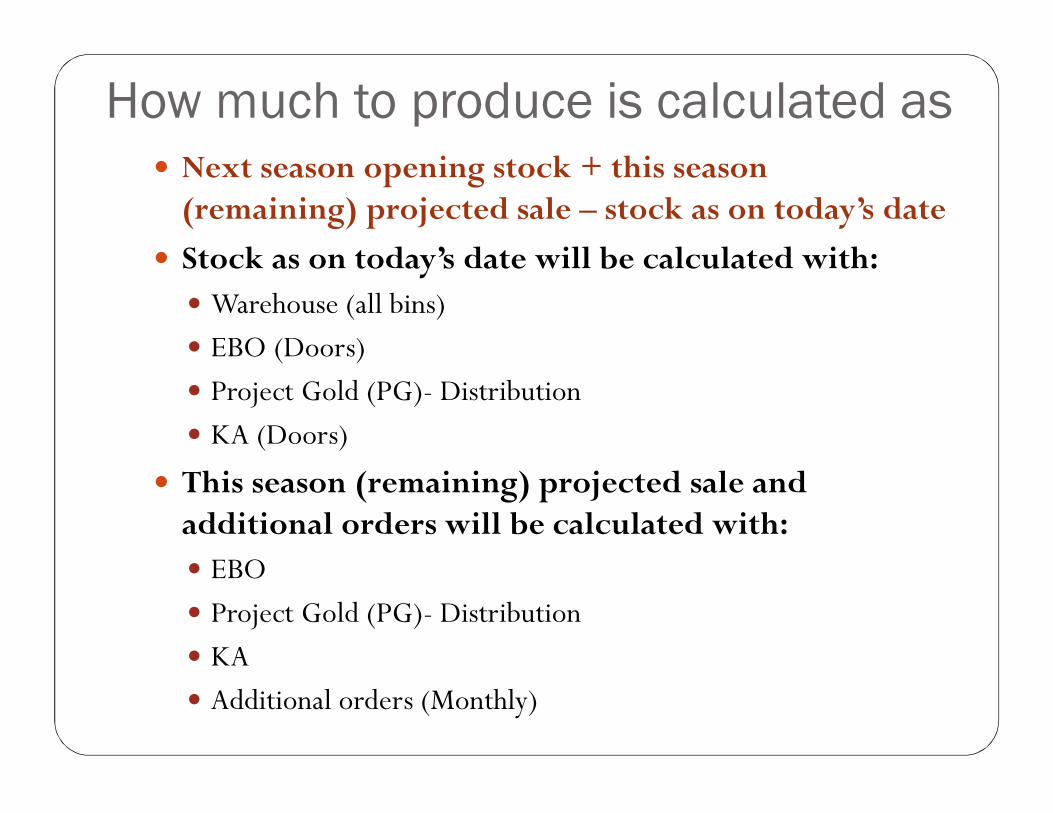
How much to produce is calculated as Next season opening stock + this season
(remaining) projected sale – stock as on today’s date Stock as on today’s date will be calculated with: Warehouse (all bins) EBO (Doors) Project Gold (PG)- Distribution KA (Doors)
This season (remaining) projected sale and additional orders will be calculated with: EBO Project Gold (PG)- Distribution KA Additional orders (Monthly)
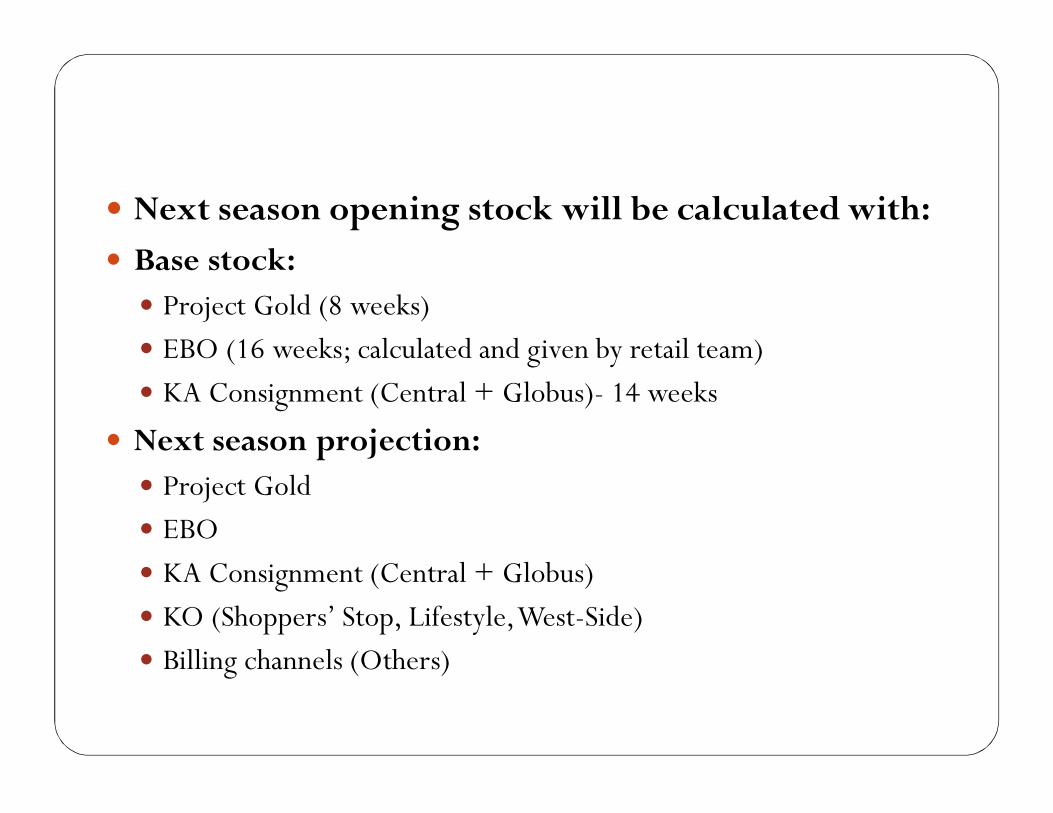
Next season opening stock will be calculated with: Base stock: Project Gold (8 weeks) EBO (16 weeks; calculated and given by retail team) KA Consignment (Central + Globus)- 14 weeks
Next season projection: Project Gold EBO KA Consignment (Central + Globus) KO (Shoppers’ Stop, Lifestyle, West-Side) Billing channels (Others)
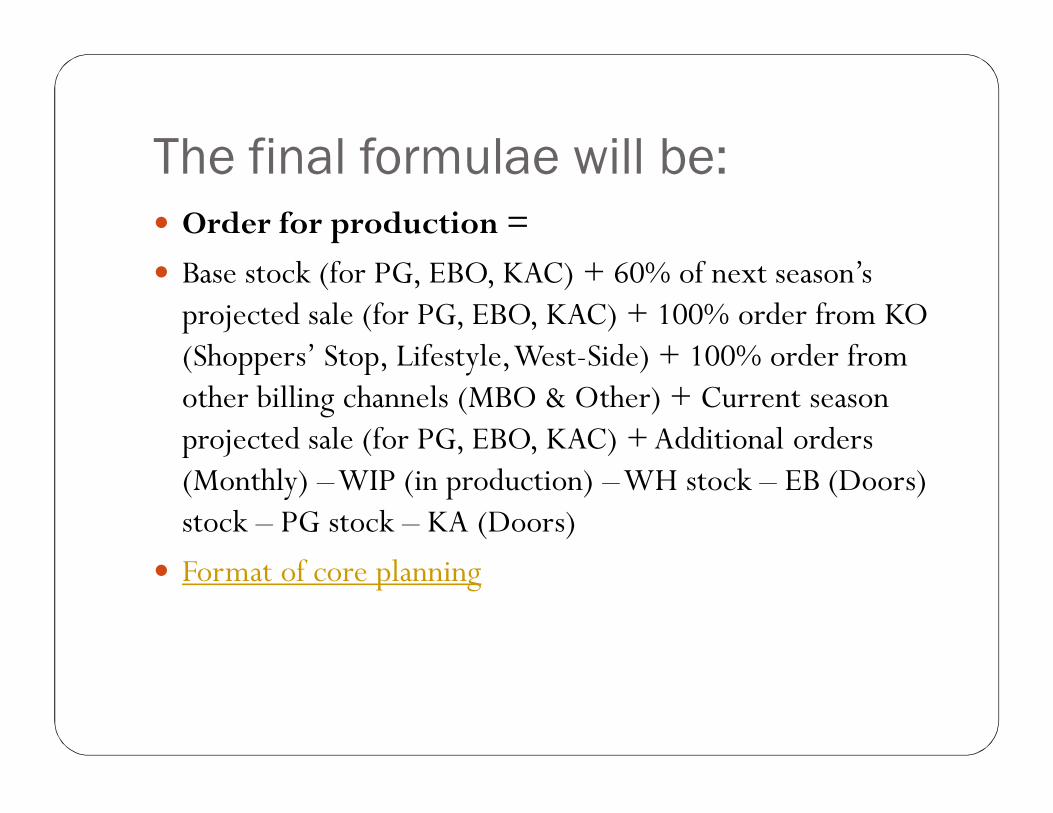
The final formulae will be: Order for production = Base stock (for PG, EBO, KAC) + 60% of next season’s
projected sale (for PG, EBO, KAC) + 100% order from KO (Shoppers’ Stop, Lifestyle, West-Side) + 100% order from other billing channels (MBO & Other) + Current season projected sale (for PG, EBO, KAC) + Additional orders (Monthly) –WIP (in production) –WH stock – EB (Doors) stock – PG stock – KA (Doors)
Format of core planning
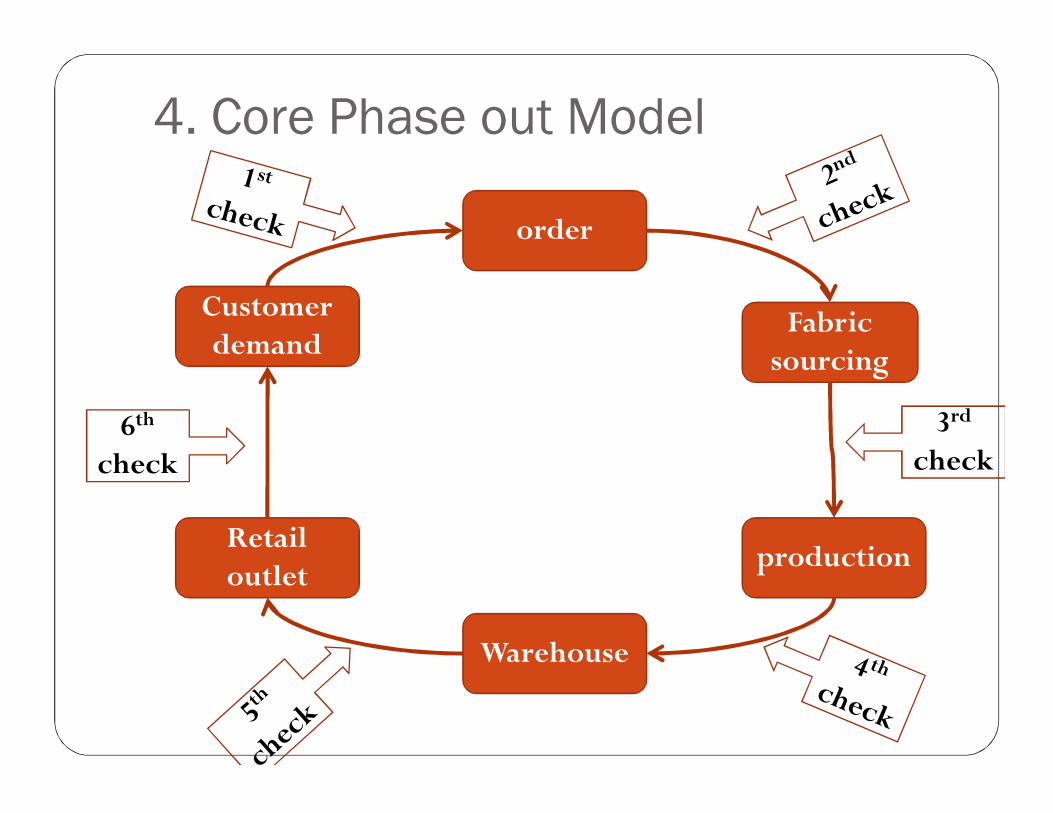
4. Core Phase out Model
order
Fabric sourcing
productionRetail outlet
Customer demand
Warehouse
6th
check3rd
check
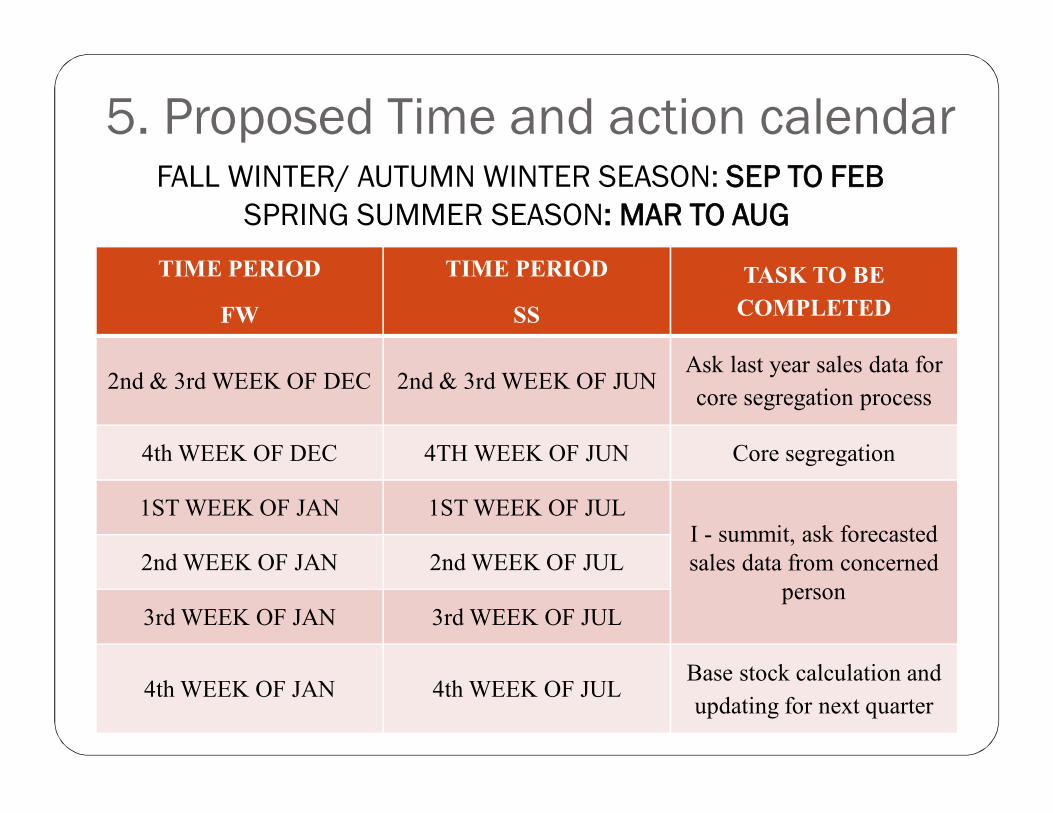
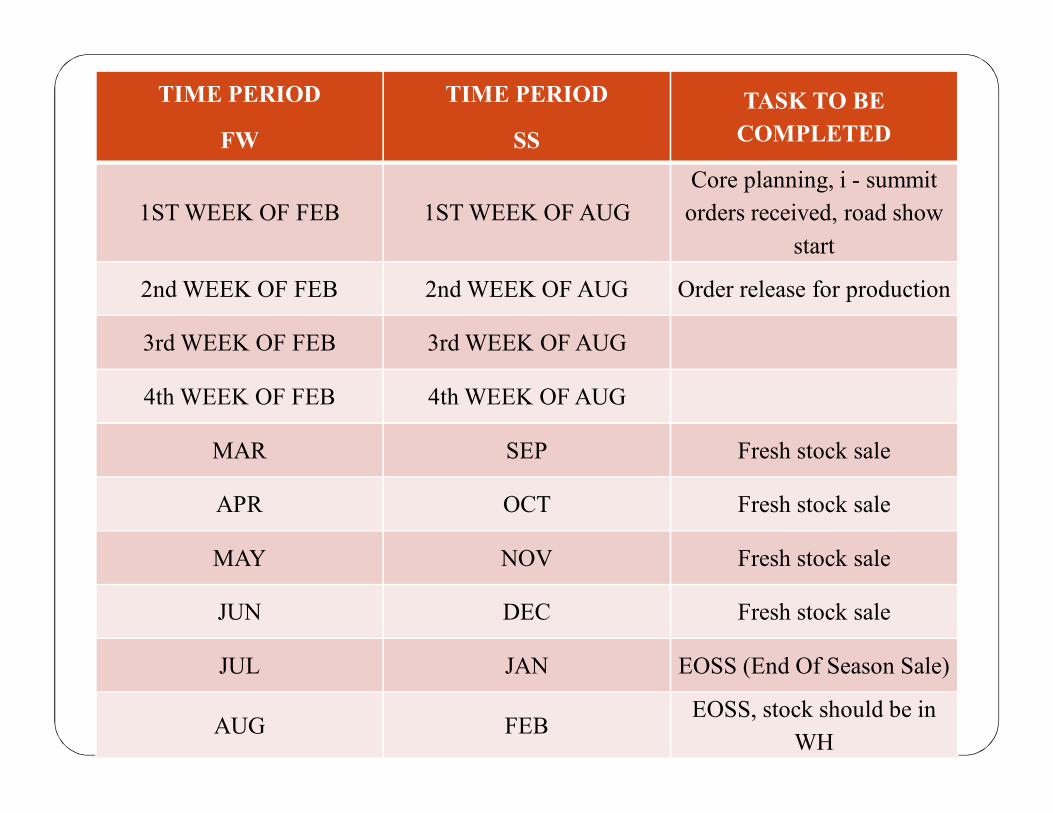
5. Proposed Time and action calendarFALL WINTER/ AUTUMN WINTER SEASON: SEP TO FEB
SPRING SUMMER SEASON: MAR TO AUG
TIME PERIOD
FW
TIME PERIOD
SS
TASK TO BE COMPLETED
2nd & 3rd WEEK OF DEC 2nd & 3rd WEEK OF JUNAsk last year sales data for core segregation process
4th WEEK OF DEC 4TH WEEK OF JUN Core segregation
1ST WEEK OF JAN 1ST WEEK OF JULI - summit, ask forecasted sales data from concerned
person2nd WEEK OF JAN 2nd WEEK OF JUL
3rd WEEK OF JAN 3rd WEEK OF JUL
4th WEEK OF JAN 4th WEEK OF JULBase stock calculation and updating for next quarter
TIME PERIOD
FW
TIME PERIOD
SSTASK TO BE
COMPLETED
1ST WEEK OF FEB 1ST WEEK OF AUGCore planning, i - summit
orders received, road show start
2nd WEEK OF FEB 2nd WEEK OF AUG Order release for production
3rd WEEK OF FEB 3rd WEEK OF AUG
4th WEEK OF FEB 4th WEEK OF AUG
MAR SEP Fresh stock sale
APR OCT Fresh stock sale
MAY NOV Fresh stock sale
JUN DEC Fresh stock sale
JUL JAN EOSS (End Of Season Sale)
AUG FEBEOSS, stock should be in
WH

CONTENTS Objective of Research Project Company profile Introduction Analysis of Sales and Serviceability Findings Suggestions Implementation Conclusion Limitation and Future scope
Implementation
Segregation of Core codes using Pareto Analysis
Base Stock calculation using Standard deviation formulae
Core planning, using modified format
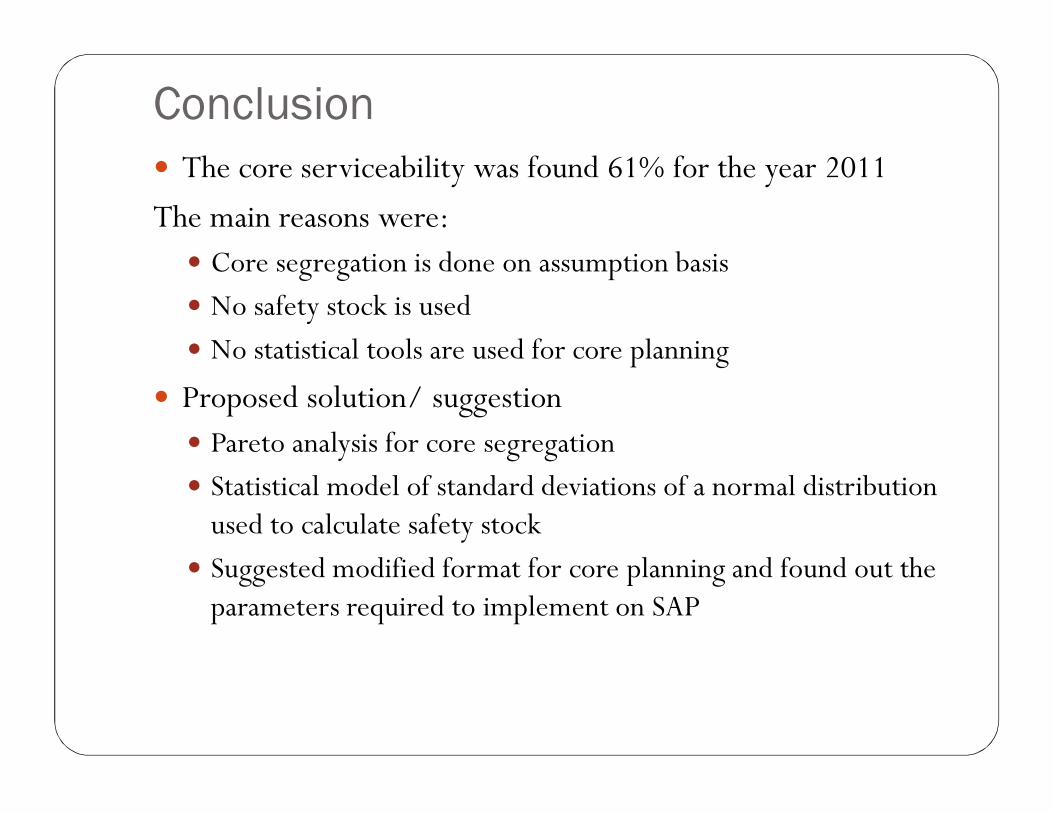
Conclusion The core serviceability was found 61% for the year 2011The main reasons were: Core segregation is done on assumption basis No safety stock is used No statistical tools are used for core planning
Proposed solution/ suggestion Pareto analysis for core segregation Statistical model of standard deviations of a normal distribution
used to calculate safety stock Suggested modified format for core planning and found out the
parameters required to implement on SAP