copolymerizing acrylonitrile and methyl acrylate by raft...
TRANSCRIPT
Copolymerizing Acrylonitrile and Methyl Acrylate by RAFT for Melt
Processing Applications: A Synthetic Investigation of the Effects of Chain
Transfer Agent, Initiator, Temperature, and Solvent
Susan A. Beck
Thesis submitted to the faculty of the Virginia Polytechnic Institute and State
University in partial fulfillment of the requirements for the degree of
Master of Science
In
Macromolecular Science and Engineering
S. Richard Turner, Chair
Judy S. Riffle
Donald G. Baird
Robert B. Moore
Sue J. Mecham
March 26, 2014
Blacksburg, Virginia
Keywords: Poly(acrylonitrile-co-methyl acrylate), RAFT
Copyright 2014, Susan A. Beck
Copolymerizing Acrylonitrile and Methyl Acrylate by RAFT for Melt Processing
Applications: A Synthetic Investigation of the Effects of Chain Transfer Agent,
Initiator, Temperature, and Solvent
Susan A. Beck
Abstract
Statistical copolymers of acrylonitrile (AN) and methyl acrylate (MA) were successfully
prepared and characterized using reversible addition-fragmentation chain transfer (RAFT)
copolymerization. A typical copolymer was charged with 15 wt. % MA content. This thesis
describes a systematic variation of the RAFT copolymerization variables to optimize this system.
In particular, the effects of chain transfer agent, initiator, temperature, and solvent on the
copolymer properties were studied.

iii
Dedication
I dedicate this thesis to my husband, Ben Beck. You are the love of my life and without your
support, this journey would have been an insurmountable challenge.
iv
Acknowledgements
I am indebted to my advisor, James E. McGrath, for his hard work, suggestions, and
encouragement. He always believed in me, and without his support, this thesis would have not
been possible. This research was funded by the National Science Foundation Division of
Materials Research Grant 1006630.
v
Table of Contents
Abstract ............................................................................................................................... ii
Dedication .......................................................................................................................... iii
Acknowledgements ............................................................................................................ iv
Table of Contents ................................................................................................................ v
List of Figures ................................................................................................................... vii
List of Tables ..................................................................................................................... ix
Chapter I: Introduction ........................................................................................................ 1
Chapter II: Literature Review ............................................................................................. 3
Acrylonitrile Copolymers and Fibers .......................................................................................... 3
Copolymerization of AN ............................................................................................................. 4
Melt Processing of PAN copolymers .......................................................................................... 6
Conventional and Controlled Free Radical Polymerization ........................................................ 7
Controlled Radical Polymerization ............................................................................................. 9
RAFT Polymerization ............................................................................................................... 10
Polymerization of acrylonitrile (AN) using RAFT ................................................................... 14
Thermal Characteristics of AN polymerized by RAFT ............................................................ 22
Conclusion of Published Synthetic Data ................................................................................... 26
Chapter III: Experimental ................................................................................................. 27
Materials .................................................................................................................................... 27
Copolymerization ...................................................................................................................... 27
Synthetic Variables ................................................................................................................... 28
Removal of RAFT End Group .................................................................................................. 28
Characterization ........................................................................................................................ 28
Chapter IV: Results and Discussion ................................................................................. 32
Characterization of Copolymers by 1H-NMR ........................................................................... 32
Measuring Monomer Conversion by 1H-NMR ......................................................................... 33
vi
Determination of End Groups and Mn using 1H-NMR ............................................................. 36
Investigation of Copolymerization Variables ........................................................................... 42
Effect of Solvent .................................................................................................................... 42
Effect of Concentration ......................................................................................................... 45
Effect of Initiator and Temperature ....................................................................................... 46
Effect of RAFT Chain Transfer Agent .................................................................................. 48
Qualitative Kinetic Information from 1H-NMR ........................................................................ 50
Molecular weight determination ............................................................................................... 54
Measuring Tg, Tm, and Td of RAFT PAN-co-MA materials ..................................................... 61
Chapter V: Conclusions .................................................................................................... 68
Chapter VI: Suggested Future Research ........................................................................... 69
References ......................................................................................................................... 71
vii
List of Figures
Figure 1. Synthesis of acrylonitrile (kPa) ....................................................................................... 3
Figure 2. Structures of comonomers ............................................................................................... 4
Figure 3. Relative reaction rates for comonomer addition.6 ........................................................... 4
Figure 4. Schematic representation of the primary reactions that occur during free-radical
polymerization of acrylonitrile. ...................................................................................................... 7
Figure 5. Plot of polymer molecular weight vs. monomer conversion for conventional and
controlled free-radical polymerization14
....................................................................................... 10
Figure 6. Mechanism of RAFT polymerization3 ......................................................................... 11
Figure 7. Generic structures for commonly used RAFT agents; R group is monomer specific .. 13
Figure 8. Mechanism of the pre-cross and cross termination reactions17
..................................... 14
Figure 9. Chain equilibration step of AN polymerized from PBuA macro-RAFT agent ............. 17
Figure 10. In situ generation of RAFT agent from disulfide22
.................................................... 19
Figure 11. Reaction scheme for RAFT group removal with AIBN31
........................................... 21
Figure 12. Thermograms from DSC of PAN pellets measured in (a) argon and (b) air at 10
K/min: (1) commercial PAN sample (Aldrich), (2) PAN synthesized via the polymerization of
AN in CO2, and (3) PAN synthesized in DMSO in the presence of MPTC. This image was taken
from Reference 25......................................................................................................................... 23
Figure 13. Thermograms from DSC of PAN pellets measured in (a) argon and (b) air at 10
K/min: PAN was synthesized via RAFT polymerization (1-3) in the presence of (1) METC, (2)
DBTC, and (3) MPTC and (4) in CO2 in the presence of DBTC. This image was copied from
Reference 25. ................................................................................................................................ 25
Figure 14. Typical 1H-NMR spectrum of the copolymerization reaction mixture. ...................... 33
Figure 15. Identification of the monomer peaks in a 1H-NMR spectrum. As the
copolymerization proceeds, the methoxy functionality remains constant, while the vinyl peaks
decrease. Reaction conditions: 85/15, 2165:235:3:1, CMDTC/ABCHN, 4.7M in DMSO ......... 34
Figure 16 1H-NMR of copolymer synthesized with CPDB at the CTA and AIBN as the initiator
(Table 4, Row 1). Reaction conditions: 85/15, 2165:235:3:1, 70ºC, 4.7 M in DMSO ................. 38
Figure 17 1H-NMR of copolymer synthesized with CPDB at the CTA and ABCHN as the
initiator (Table 4, Row 2). Reaction conditions: 85/15, 2165:235:3:1, 90ºC, 4.7 M in DMSO ... 39
Figure 18 1H-NMR of copolymer synthesized with CMDTC at the CTA and AIBN as the
initiator (Table 4, Row 3). Reaction conditions: 85/15, 2165:235:3:1, 70ºC, 4.7 M in DMSO ... 40
Figure 19 1H-NMR of copolymer synthesized with CMDTC at the CTA and ABCHN as the
initiator (Table 4, Row 4). Reaction conditions: 85/15, 2165:235:3:1, 80ºC, 4.7 M in DMSO ... 41
Figure 20. Monomer conversion over time in EC (•) and DMSO (■). Reaction conditions: AN
charged 80 wt%, 2400:3:1, CPDB/AIBN, 70ºC, 7.4M................................................................. 43
Figure 21. Anti-parallel dipolar bonding between a nitrile and ethylene carbonate .................... 44
Figure 22. Monomer conversion over time in EC (♦) and DMSO (■). Reaction conditions: AN
charged 85 wt%, 2400:3:1, CMDTC/AIBN, 80ºC, 4.7M ............................................................. 44
viii
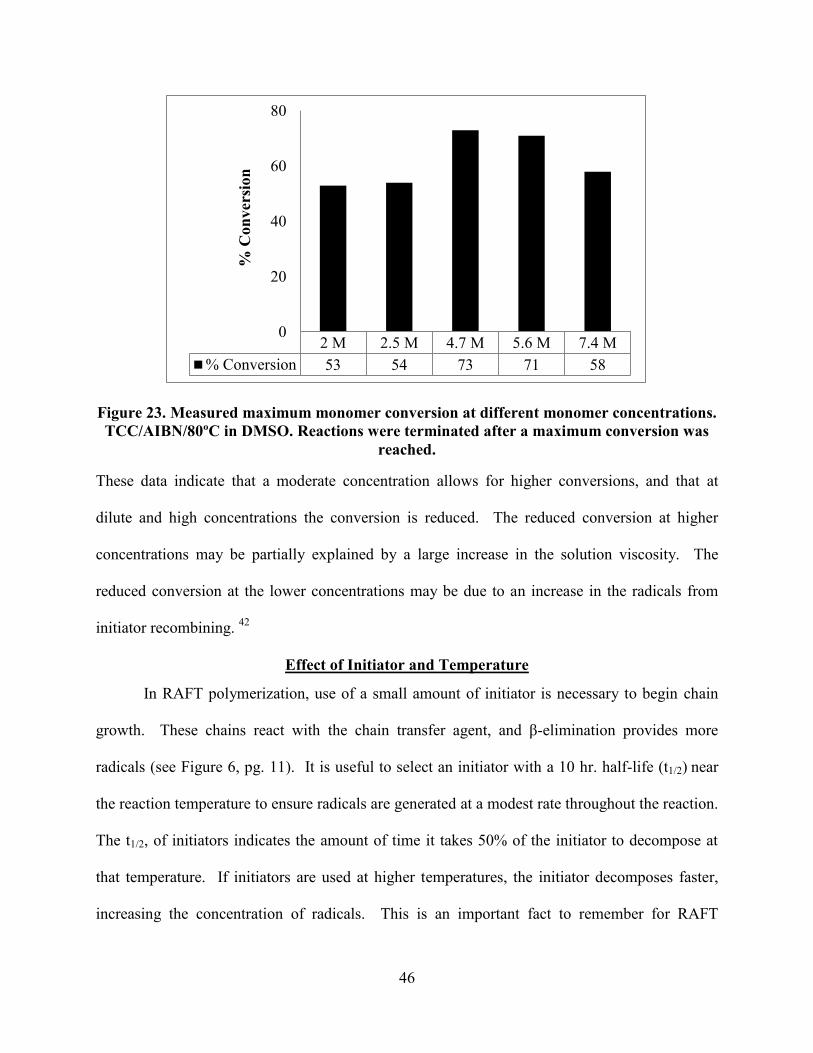
Figure 23. Measured maximum monomer conversion at different monomer concentrations.
TCC/AIBN/80ºC in DMSO. Reactions were terminated after a maximum conversion was
reached. ......................................................................................................................................... 46
Figure 24. Expected structure of copolymer synthesized by RAFT using CPDB and CMDTC as
the CTA ......................................................................................................................................... 49
Figure 25. Time vs. % monomer conversion measurements for RAFT copolymers using CPDB
as the CTA. Reaction conditions: 85/15, 2400:3:1, 4.7M ........................................................... 50
Figure 26. Time vs. % monomer conversion measurements for RAFT copolymers using
CMDTC as the CTA. Reaction conditions: 85/15, 2400:3:1, 4.7 M ............................................ 53
Figure 27. Example plot for intrinsic viscosity determination ..................................................... 55
Figure 28. Mathematical expression for molecular weights ......................................................... 55
Figure 29. (1) No chain transfer agent (2) dodecanethiol (3) CPDB. All reactions were run at
4.7M in DMSO at 80ºC with AIBN as the initiator. (2) and (3) used a 2400:3:1 M:CTA:I ratio. 57
Figure 30. Monomer conversion vs. time (♦) and Mn from universal calibration (□) from 1 to 5
hours. Reaction conditions: 85/15, 2400:3:1, CPDB/AIBN, 80ºC, 4.7M .................................... 60
Figure 31. SEC light scattering traces from the data in Figure 29. The numbers above the curve
represent the samples at time 1 through 5 hours. .......................................................................... 60
Figure 32. DSC of PAN-co-MA copolymers. Reaction conditions: 2400:3:1, CPDB/AIBN,
70ºC, 7.4M in EC. The Mw from LS was between 45000 and 50000 for these samples. ............ 62
Figure 33. Reduction of dithiobenzoate end group with Bu3SnH ................................................ 63
Figure 34. 1H-NMR of copolymer before (a) and after (b) removal of the dithiobenzoate end
group. ............................................................................................................................................ 63
Figure 35. SEC LS trace from before (1) and after (2) end group removal and molecular weight
data from universal calibration and light scattering ...................................................................... 64
Figure 36. DSC before (1) and after (2) end group removal. Conditions: 2nd
heat, 10ºC/min,
powder, exo down. ........................................................................................................................ 65
Figure 37. (1) 85/15, 2400:3:1, CPDB/AIBN, 80ºC in DMSO at 7.4 M (2) 85/15, 2400:3:1,
CMDTC/AIBN, 80ºC in DMSO at 4 M ....................................................................................... 66
Figure 38. Film melt pressed at 190ºC from an 82/18 PAN-co-MA. ........................................... 67
ix
List of Tables
Table 1. RAFT agents used for AN polymerization .................................................................... 15
Table 2. Schematic and chemical structures of polymerization components. .............................. 32
Table 3. End groups which can be derived from the CTA and initiator combination used. These
end groups should account for the majority of all the end groups. The groups that could be
identified by 1H-NMR were used to calculate a Mn value. ........................................................... 36
Table 4. The denominator for Equation 4. J, K, L, M, and N refer to end groups which can be
identified and integrated in 1H-NMR. .......................................................................................... 37
Table 5. AN/MA copolymer for the copolymers shown in Figures 16 through 19. ..................... 42
Table 6. Solvent effect on AN/MA copolymer with CPDB. ........................................................ 43
Table 7. Solvent effect on AN/MA copolymer with CMDTC. .................................................... 44
Table 8. Reported temperatures for 10 hour, 60 minute, and 10 minute t1/2 of AIBN and ABCHN.
....................................................................................................................................................... 47
Table 9. Experimentally measured % monomer conversion. Reaction conditions: 85/15,
2400:3:1, 4.7M .............................................................................................................................. 48
Table 10. Comparison of molecular weight data 1H-NMR, SEC, and intrinsic viscosity from
Table 9, Entries 1-9. ...................................................................................................................... 58
1
Chapter I: Introduction
Synthetic polymeric materials have had a significant impact in many aspects of our daily
lives. Polyacrylonitrile (PAN) homopolymers and copolymers with 85 wt% acrylonitrile (AN)
are known as acrylic fibers and were first introduced by DuPont in 1941 under the trade name
Orlon™.1 Acrylic polymers are important fiber forming materials which are used in many
applications ranging from clothing, outdoor fabrics, and purification membranes. These
materials are also used to make the precursor fibers for high yield carbon fiber. The worldwide
market for acrylic staple fiber production was at 1.9 million tons in 2008, and in addition, acrylic
production for carbon fiber has more than doubled from 30,000 tons to 61,000 tons in the past
six years.2
Acrylic fibers have excellent properties, however the production cost is significantly
higher compared to that of other synthetic fibers, such as polyester and nylon, and this has
caused a decline in the acrylic fiber market since the 1970s.1 This cost differential is due to the
requirement of producing fibers from solution processing, from which the solvent needs to be
collected and recycled.
In the past 20 years, there has been a surge of work in the area of controlled free radical
polymerization.3 A number of controlled free radical systems have been developed and as a
result homopolymers, statistical copolymers, and block copolymers with known end groups and
targeted molecular weights can all be generated under mild conditions. Despite the benefits, the
slow rate of polymerization and reduced monomer conversion, compared to conventional free
radical techniques, has limited the economic feasibility of these polymers.4
The controlled free radical technique that was employed in this work is RAFT (reversible
addition-fragmentation chain transfer) polymerization. The focus of this thesis is to examine the
viability of using RAFT copolymerization for producing acrylic fiber feed stocks that can be
2
spun by melt processing, a lower cost method than solution spinning for fiber formation. In this
work, the RAFT copolymerization conditions were systematically varied to observe differences
in the monomer conversion, molecular weight, comonomer content, and end groups. These
differences were shown to have a marked impact on the (co)polymerization rate and monomer
conversion, as well as on the degradation temperature and melting temperature. The synthetic
variables examined were the RAFT chain transfer agent (CTA), initiator, solvent, concentration
and temperature. The copolymers synthesized were typically charged with 85 wt. % AN
(acrylonitrile), however some of the materials that will be discussed were designed to have
higher or lower AN content. These materials were thoroughly characterized via different
polymer characterization methods, which will be discussed further in the Experimental Section.
3
Chapter II: Literature Review
Acrylonitrile Copolymers and Fibers
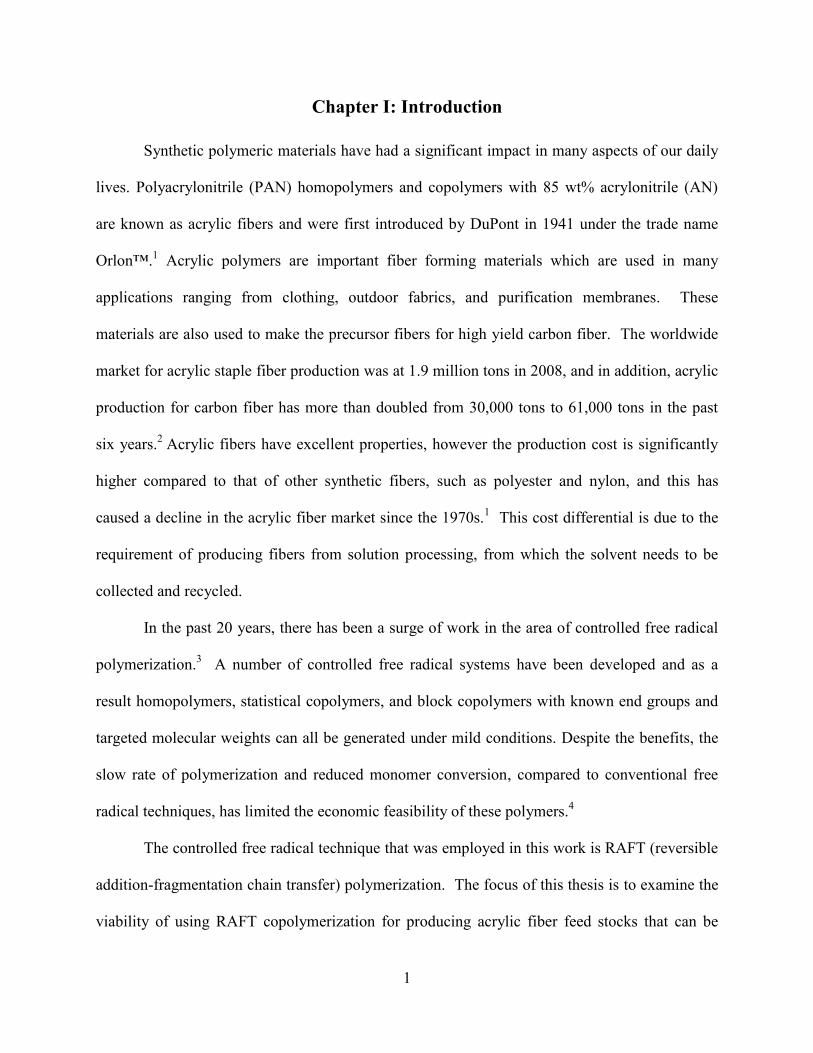
Acrylonitrile (AN) is an important commercial monomer which is primarily synthesized
via an ammoxidation called the Sohio process from propylene and ammonia5 (Figure 1).
Figure 1. Synthesis of acrylonitrile (kPa)
This monomer is a major component in synthetic rubbers like styrene-acrylonitrile copolymers
and acrylonitrile-butadiene-styrene terpolymers, and is also used in acrylic, modacrylic (35-85
wt% AN), and carbon fibers. Acrylic fibers, which are classified as (co)polymers with at least 85
wt. % AN, can be made through free radical and anionic polymerization. These polymers
typically have number average molecular weights (Mn) from 40-60 kg/mol and weight average
molecular weights (Mw) of 90-140 kg/mol.6 PAN (co)polymers for acrylic fiber are synthesized
using free radical polymerization, which has advantages over anionic polymerization techniques
including easy introduction of cationic dye sites and reduced side reactions. Aqueous dispersion
polymerization is the most popular technique for commercial production of these copolymers.6
Water is used as a dispersive phase and acts as a good heat sink to stabilize the exotherm of the
reaction. The copolymer beads can be isolated by vacuum filtration, dried, pelletized and stored
for future processing. Homogeneous free radical polymerization is also used for commercial
production. A major disadvantage of this approach is that reaction times are longer due to lower
4
monomer and radical concentrations. Also, solvents with high chain transfer constants must be
avoided for suitable molecular weights to be formed.
Copolymerization of AN
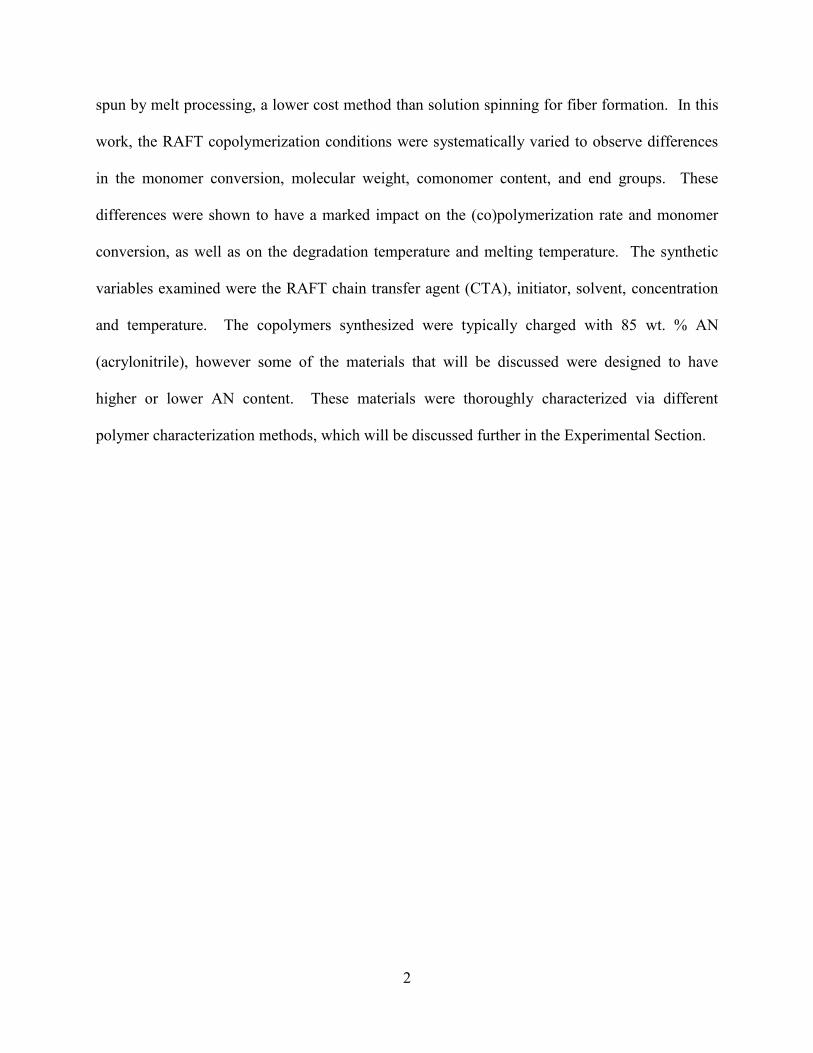
Acrylic fibers are rarely made from PAN homopolymer. The nitrile groups interact with
each other causing the polymer to be rigid and difficult to dissolve. The two comonomers that
are commonly incorporated with AN are methyl acrylate (MA) and vinyl acetate (VA)6 which
are shown in Figure 2.
Figure 2. Structures of comonomers
These comonomers are used because they disrupt the strong polar interactions between the
nitriles when statistically incorporated, improving solubility for solution processing and
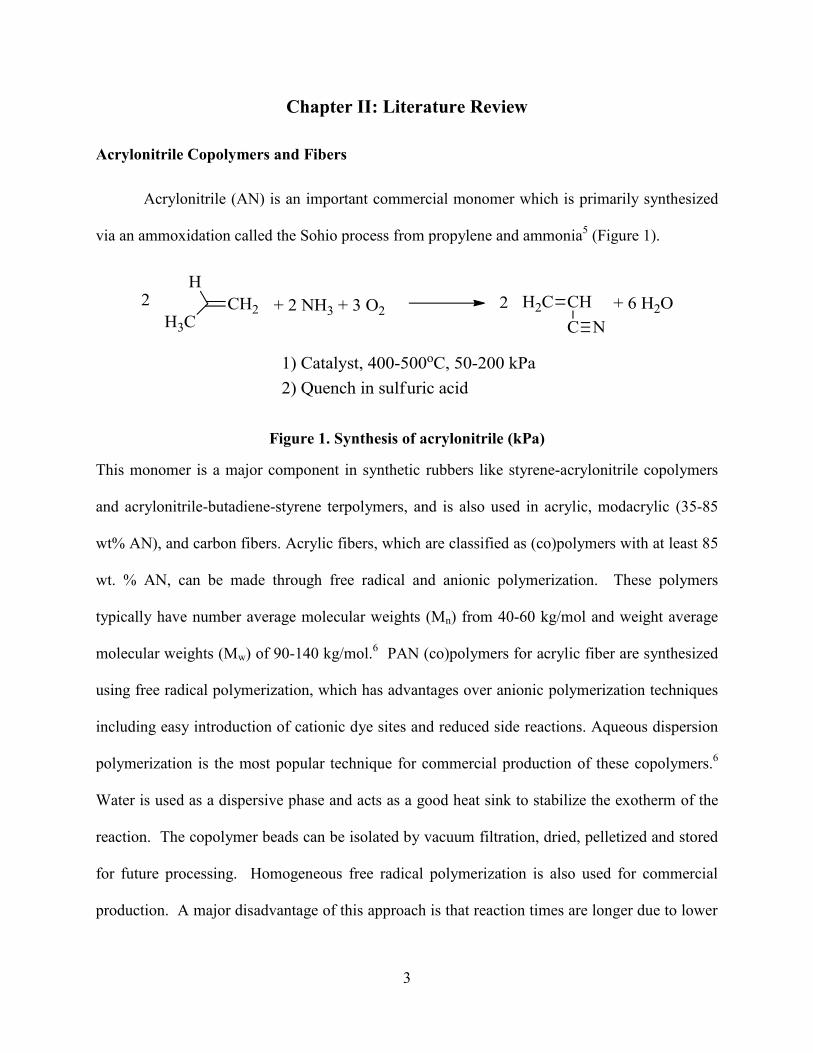
dyeability. The reactivity ratios, r1 and r2, of a monomer pair, M1 and M2, are determined by
considering the rate at which a monomer reacts with the growing polymer chain, Pn• (Figure 3).
Figure 3. Relative reaction rates for comonomer addition.6
Statistical copolymers are formed when the reactivity ratios are both close to one. This means
that neither monomer has a preference to react with itself or the other. When an r value is close
5
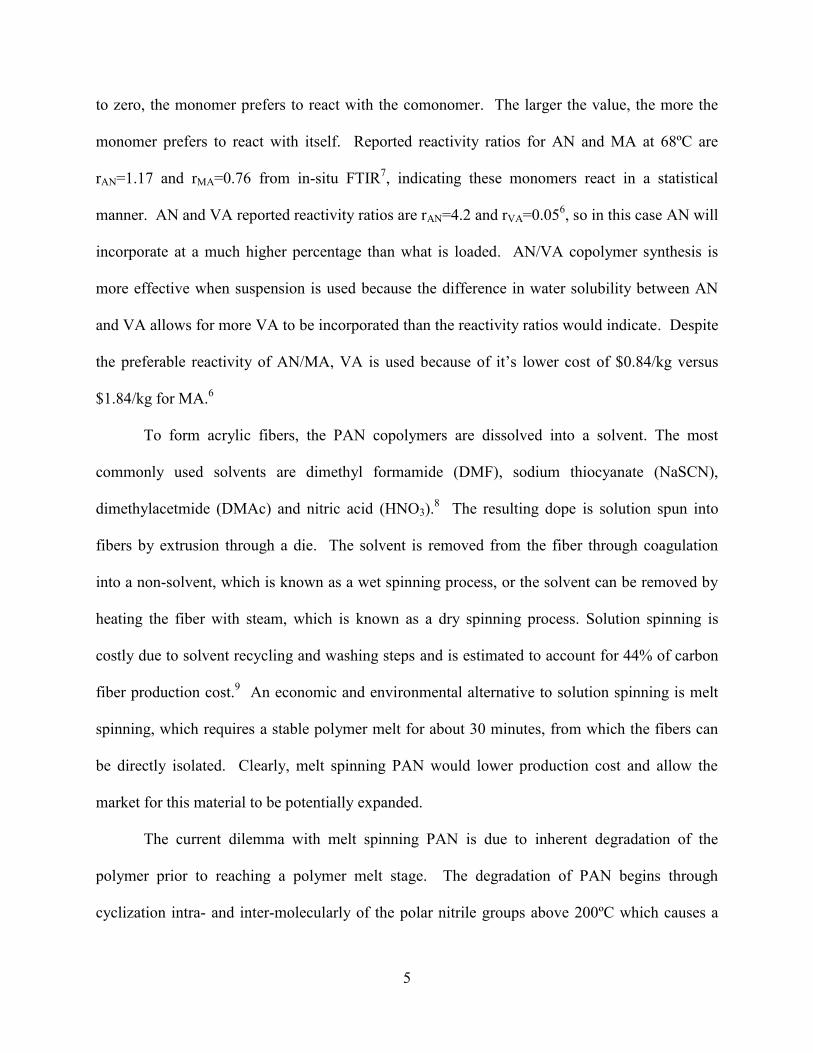
to zero, the monomer prefers to react with the comonomer. The larger the value, the more the
monomer prefers to react with itself. Reported reactivity ratios for AN and MA at 68ºC are
rAN=1.17 and rMA=0.76 from in-situ FTIR7, indicating these monomers react in a statistical
manner. AN and VA reported reactivity ratios are rAN=4.2 and rVA=0.056, so in this case AN will
incorporate at a much higher percentage than what is loaded. AN/VA copolymer synthesis is
more effective when suspension is used because the difference in water solubility between AN
and VA allows for more VA to be incorporated than the reactivity ratios would indicate. Despite
the preferable reactivity of AN/MA, VA is used because of it’s lower cost of $0.84/kg versus
$1.84/kg for MA.6
To form acrylic fibers, the PAN copolymers are dissolved into a solvent. The most
commonly used solvents are dimethyl formamide (DMF), sodium thiocyanate (NaSCN),
dimethylacetmide (DMAc) and nitric acid (HNO3).8 The resulting dope is solution spun into
fibers by extrusion through a die. The solvent is removed from the fiber through coagulation
into a non-solvent, which is known as a wet spinning process, or the solvent can be removed by
heating the fiber with steam, which is known as a dry spinning process. Solution spinning is
costly due to solvent recycling and washing steps and is estimated to account for 44% of carbon
fiber production cost.9 An economic and environmental alternative to solution spinning is melt
spinning, which requires a stable polymer melt for about 30 minutes, from which the fibers can
be directly isolated. Clearly, melt spinning PAN would lower production cost and allow the
market for this material to be potentially expanded.
The current dilemma with melt spinning PAN is due to inherent degradation of the
polymer prior to reaching a polymer melt stage. The degradation of PAN begins through
cyclization intra- and inter-molecularly of the polar nitrile groups above 200ºC which causes a
6
large increase in viscosity of the melt. The melting point of PAN has been measured by
differential scanning calorimetry (DSC) at fast heating rates to be around 320ºC.10
PAN typically
is produced with atactic stereochemistry10
, and likewise it has been proposed that interaction
between the polar nitrile groups form a long range order as opposed to conventional crystalline
domains. High polarity solvents are necessary to break up the interactions between nitrile groups
so the (co)polymer will dissolve and allow it to be solution processed into fibers. An alternative
approach is to incorporate an appropriate amount of comonomer to disrupt the interactions,
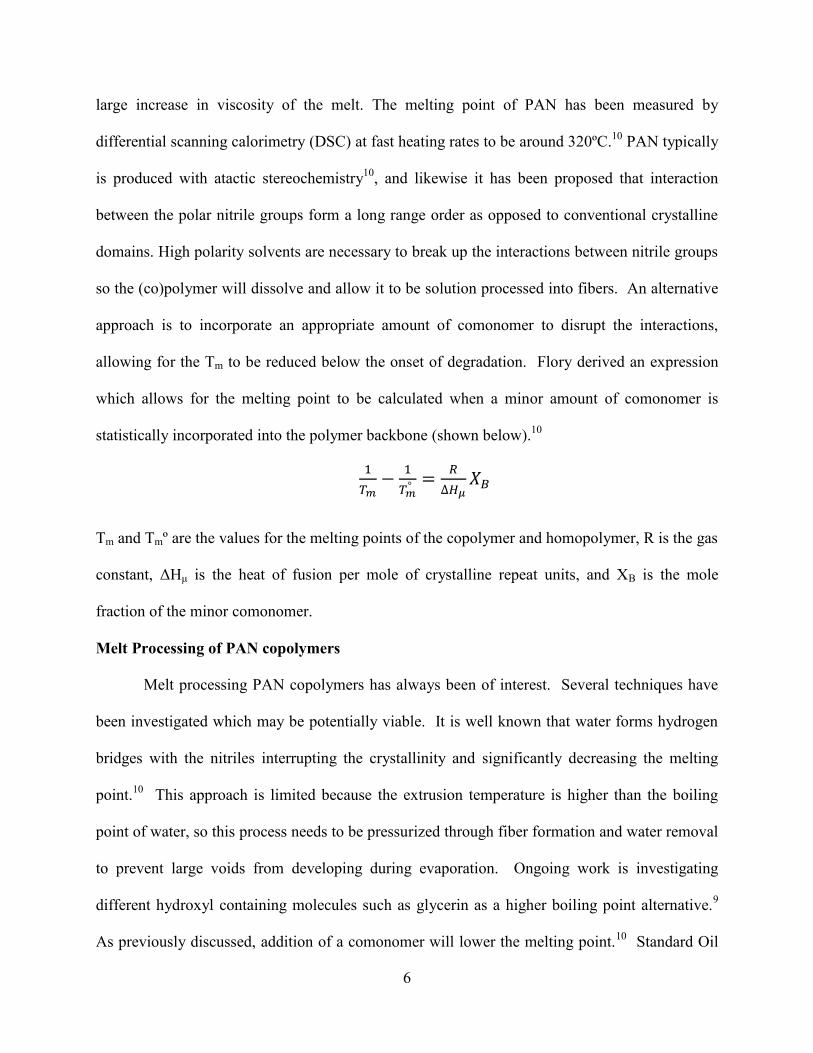
allowing for the Tm to be reduced below the onset of degradation. Flory derived an expression
which allows for the melting point to be calculated when a minor amount of comonomer is
statistically incorporated into the polymer backbone (shown below).10
Tm and Tmº are the values for the melting points of the copolymer and homopolymer, R is the gas
constant, ΔHμ is the heat of fusion per mole of crystalline repeat units, and XB is the mole
fraction of the minor comonomer.
Melt Processing of PAN copolymers
Melt processing PAN copolymers has always been of interest. Several techniques have
been investigated which may be potentially viable. It is well known that water forms hydrogen
bridges with the nitriles interrupting the crystallinity and significantly decreasing the melting
point.10
This approach is limited because the extrusion temperature is higher than the boiling
point of water, so this process needs to be pressurized through fiber formation and water removal
to prevent large voids from developing during evaporation. Ongoing work is investigating
different hydroxyl containing molecules such as glycerin as a higher boiling point alternative.9
As previously discussed, addition of a comonomer will lower the melting point.10
Standard Oil
7
of Ohio patented a process in 1997 for copolymerizing AN with a comonomer or comonomers
(including methyl styrene, styrene, methyl methacrylate, MA, and VA) to form copolymers with
up to 85 wt. % AN. It was reported that these copolymers impart melt stability over 30 minutes,
an adequate melt processing window.11
This concept was also shown by Bhanu et al., who
reported that materials with 88:12 mol% AN:MA have stable melt viscosities over thirty
minutes.12
Conventional and Controlled Free Radical Polymerization
As mentioned previously, PAN copolymers for acrylic fiber applications are typically
synthesized industrially using heterogeneous suspension or homogeneous solution free radical
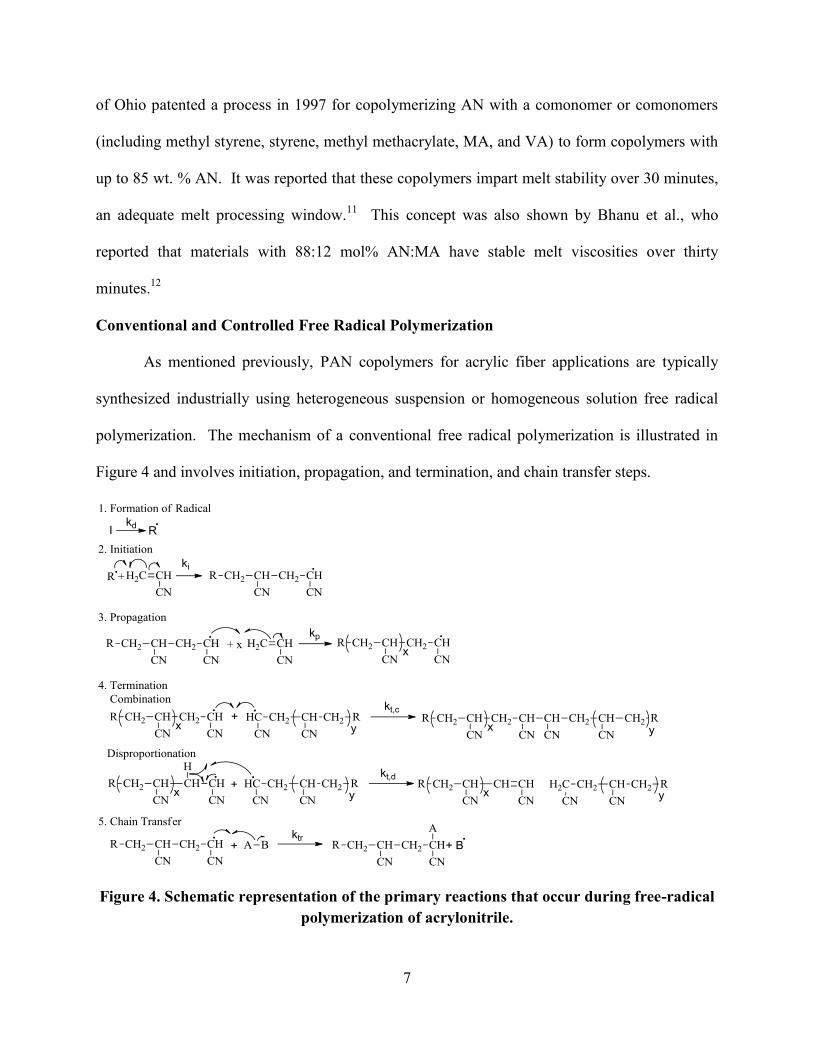
polymerization. The mechanism of a conventional free radical polymerization is illustrated in
Figure 4 and involves initiation, propagation, and termination, and chain transfer steps.
Figure 4. Schematic representation of the primary reactions that occur during free-radical
polymerization of acrylonitrile.
8
Free radical polymerization begins with an initiator species (I) which dissociates as a result of
heat or activation to produce at least one radical. The energy of this radical is high enough to
break the π bond in AN, initiating a polymer chain. The radical on the end of the polymer chain
continues by propagating to quickly form new bonds, leading to a high molecular weight
polymer. Termination occurs when a growing polymer chain reacts with another radical species,
such as another growing chain. The radicals from two active chains can combine through
combination or disproportionation, which results in two dead polymer chains. Chain transfer
reactions can also occur. These occur when a growing polymer chain interacts with another
species to form a dead chain and radical species which may or may not be able to initiate another
chain.13
If a high degree of chain transfer occurs which does not produce new initiator species,
then inhibition of the polymerization can occur.13
Chain transfer can occur with other growing
chains, monomer, solvent, or impurities. Chain transfer agents (CTAs) are often intentionally
added to the polymerization to help reduce the molecular weight and/or add functional end
groups. Each step has a unique rate constant shown in Figure 4 as kd, ki, kp, kt,c, kt,d and ktr. The
values for these rate constants are specific to the molecules involved and are also dependent on
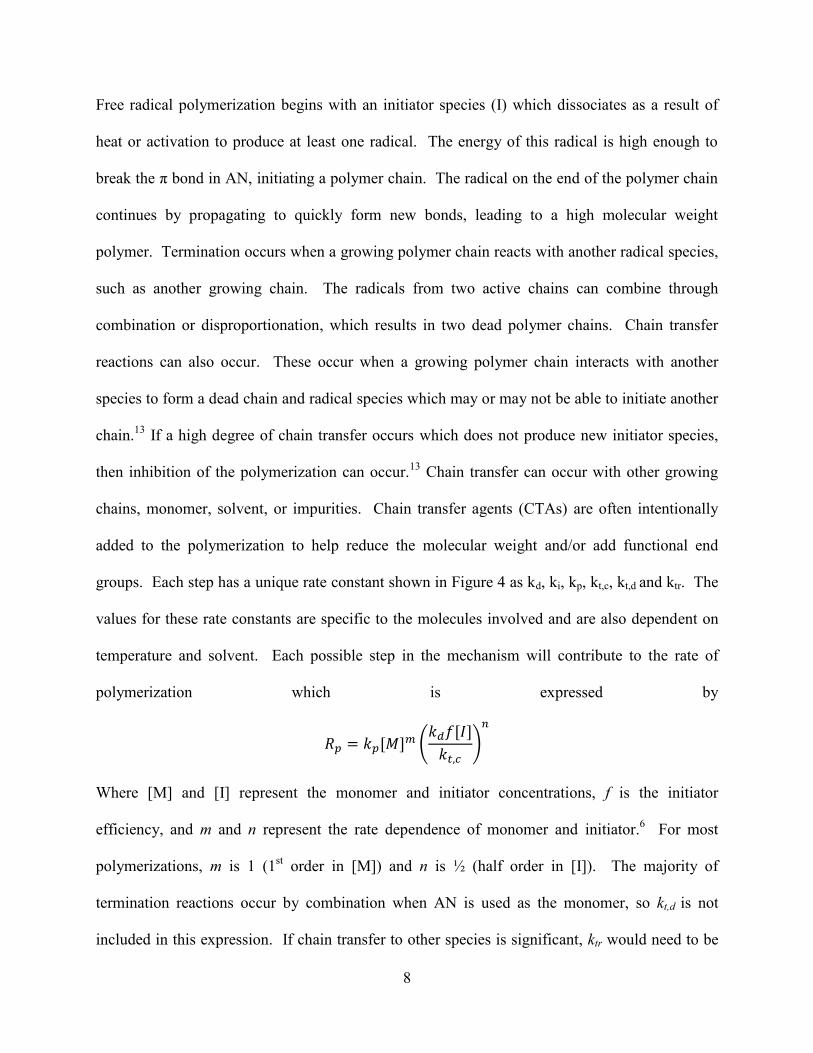
temperature and solvent. Each possible step in the mechanism will contribute to the rate of
polymerization which is expressed by
(
)
Where [M] and [I] represent the monomer and initiator concentrations, f is the initiator
efficiency, and m and n represent the rate dependence of monomer and initiator.6 For most
polymerizations, m is 1 (1st order in [M]) and n is ½ (half order in [I]). The majority of
termination reactions occur by combination when AN is used as the monomer, so kt,d is not
included in this expression. If chain transfer to other species is significant, ktr would need to be
9
incorporated into this expression. It is important to note that this rate expression is most
applicable to homogeneous systems, and use of a heterogeneous system can change the rate
significantly.
Controlled Radical Polymerization
A true living or controlled polymerization is defined as having no termination or side
reactions. The best example of this type of system is anionic polymerization. Controlled radical
polymerizations can have a small amount of termination, so they are not considered truly living.
However, controlled radical polymerizations do not require rigorous monomer purification like
living anionic polymerization, so a large amount of work has been done in controlled
polymerization because well-controlled materials can be made with less effort.
There are a handful of ways to perform controlled radical polymerization; however those
which allow for the most diversity are reversible addition-fragmentation chain transfer (RAFT)
polymerization and atom-transfer radical polymerization (ATRP). Each type of controlled free
radical polymerization proceeds via a distinct mechanism, but the control in each comes from
keeping the concentration of active radicals low. A low concentration of radicals means that
termination reactions are less statistically likely. Also, the active radicals only exist for long
enough to add a small amount of monomer units before returning to the dormant state. This
allows for the chain growth to be more uniform leading to lower polydispersities (PDIs). The
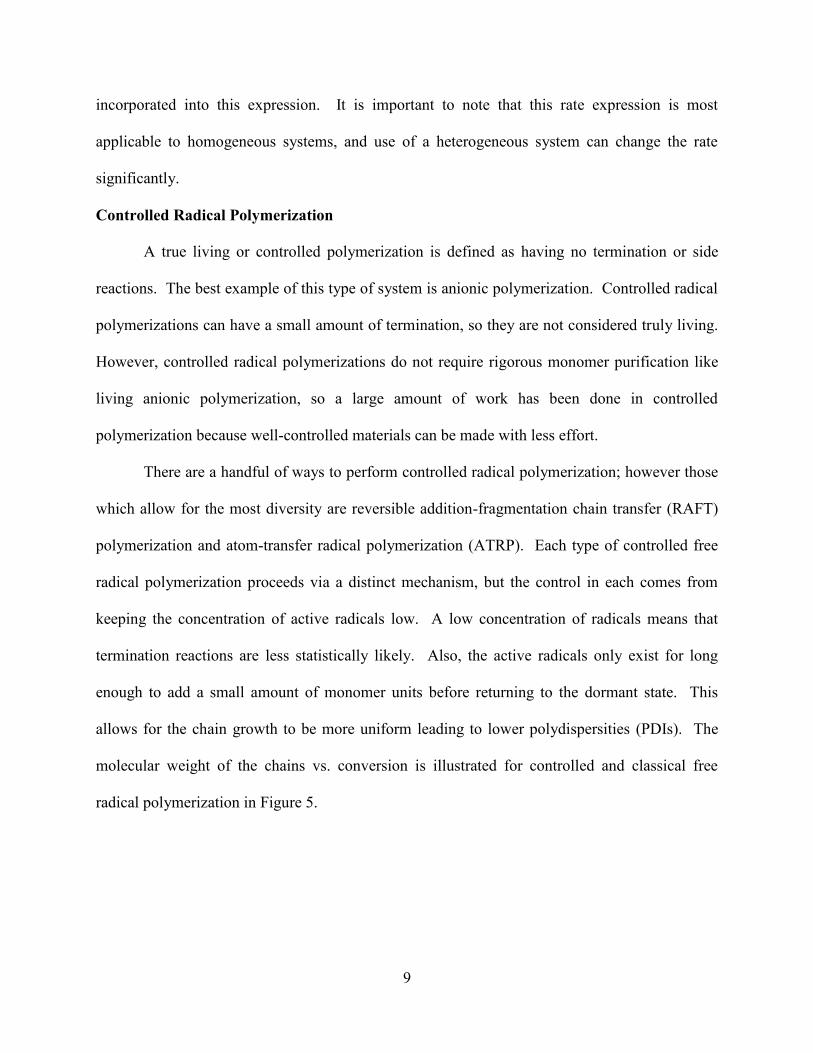
molecular weight of the chains vs. conversion is illustrated for controlled and classical free
radical polymerization in Figure 5.
10
Figure 5. Plot of polymer molecular weight vs. monomer conversion for conventional and
controlled free-radical polymerization14
In controlled polymerization, the low concentration of active radicals allows for uniform growth
of the chains. In conventional free radical systems, there is no dormant state for the radicals so
chain growth continues until a termination reaction occurs leading to a broader molecular weight
distribution.
RAFT Polymerization
Although there are instances of RAFT polymerization in the patent and open literature as
early as 1982, it did not become significant until 1998 when Moad, Rizzardo, Thang and
colleagues published that dithiobenzoates could be used as effective RAFT chain transfer agents
(CTAs).15
Since 1998, hundreds of RAFT agents have been designed and used to obtain “well-
controlled” polymers. Additionally, the kinetics, mechanism, and versatility of this
polymerization technique have been studied extensively.
11
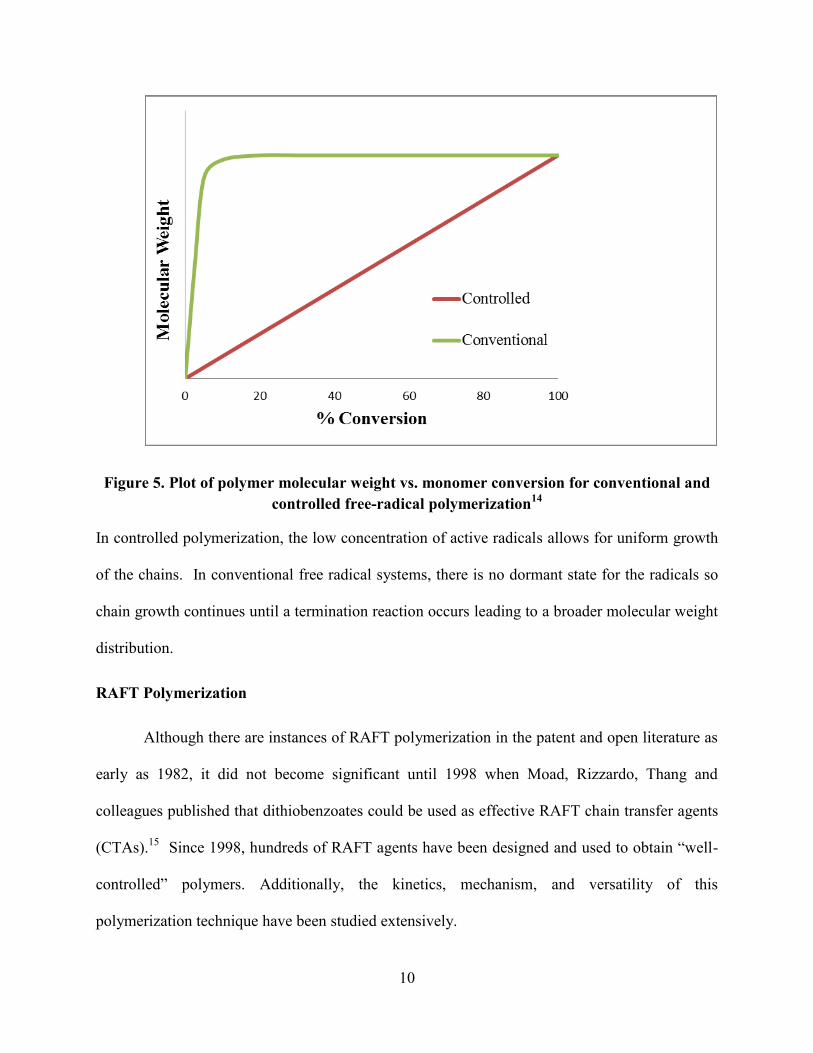
The accepted mechanism for RAFT polymerization involves initiation, propagation,
reversible chain transfer, chain equilibration, and termination steps. These steps are shown in
Figure 6.
Figure 6. Mechanism of RAFT polymerization3
The initiation step for RAFT polymerization is similar to that of conventional free radical
polymerization. Upon initiation, a small number of monomer units add to the chain before the
growing chain (P•n) adds to the RAFT agent at the C=S bond, forming a dormant radical species.
The R group fragments from the dormant radical species forming a stable polymer-RAFT agent
complex and R• initiates another polymer chain. Once the RAFT agent is consumed, an
equilibrium exists between the active polymer chains adding to the stable polymer-RAFT agent
and dormant polymer chains which are fragmenting. Due to the reversibility of the steps, the
expression for the kinetics of this polymerization is much different than a conventional free
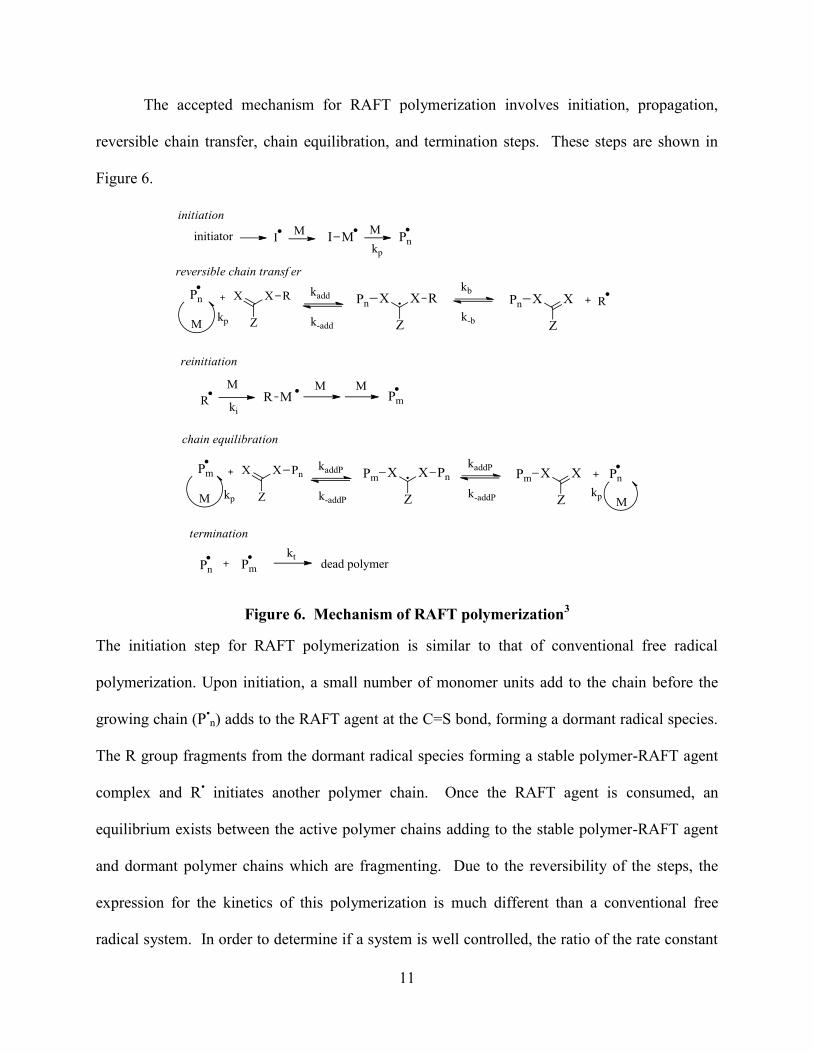
radical system. In order to determine if a system is well controlled, the ratio of the rate constant
12
of reversible chain transfer (ktr) and rate constant of polymerization (kp) is compared to obtain
the transfer constant (Ctr).3
When Ctr is near unity, the polymerization is considered to be well-controlled because the
monomer and CTA are being consumed at the same rate.
In order to minimize termination, the concentration of active polymer chains needs to be
low compared to the total number of chains. The selection of R on the CTA is important because
it must be able to initiate new chain growth faster than the propagation rate constant, so ki > kp.
The fragmentation rate of the polymer chains must be rapid enough to prevent the dormant
radical species from undergoing side reactions, such as branching or termination through
combination or disproportionation with another radical species. The fragmentation rate is largely
affected by substituent Z which stabilizes or destabilizes the dormant radical species.
Other factors to consider are the effect of the reaction conditions on the resulting
polymer. Changes in [CTA], [M (monomer)], [I (initiator)], solvent, temperature and level of
oxygen will lead to differences in the molecular weight and PDI, which in turn affect the overall
polymer properties of the given materials. In RAFT polymerization, the amount of initiator is
proportional to the concentration of chains without a RAFT end group in the final polymer
sample. A balance between polymerization rate, desired conversion, and desired control must be
established for different monomers, RAFT agents, and initiators.
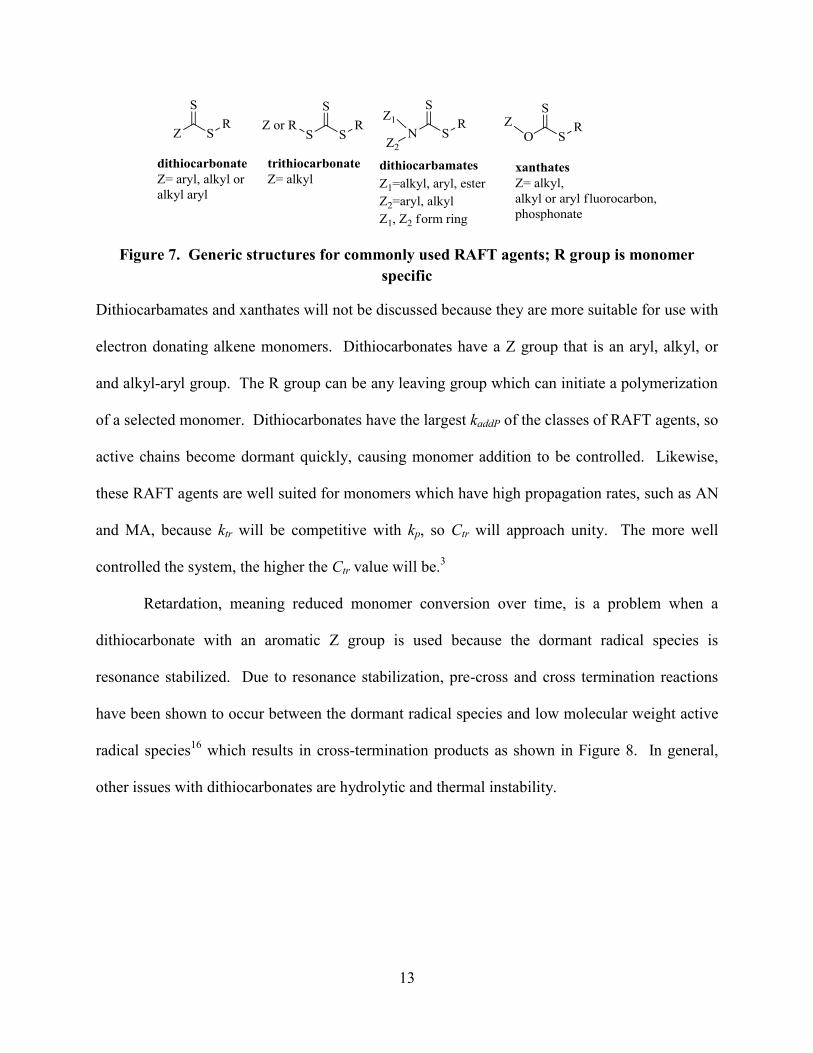
The majority of RAFT CTAs are based on the thiocarbonylthio functionality. There are
four distinct classes of small molecule RAFT agents as shown in Figure 7.
13
Figure 7. Generic structures for commonly used RAFT agents; R group is monomer
specific
Dithiocarbamates and xanthates will not be discussed because they are more suitable for use with
electron donating alkene monomers. Dithiocarbonates have a Z group that is an aryl, alkyl, or
and alkyl-aryl group. The R group can be any leaving group which can initiate a polymerization
of a selected monomer. Dithiocarbonates have the largest kaddP of the classes of RAFT agents, so
active chains become dormant quickly, causing monomer addition to be controlled. Likewise,
these RAFT agents are well suited for monomers which have high propagation rates, such as AN
and MA, because ktr will be competitive with kp, so Ctr will approach unity. The more well
controlled the system, the higher the Ctr value will be.3
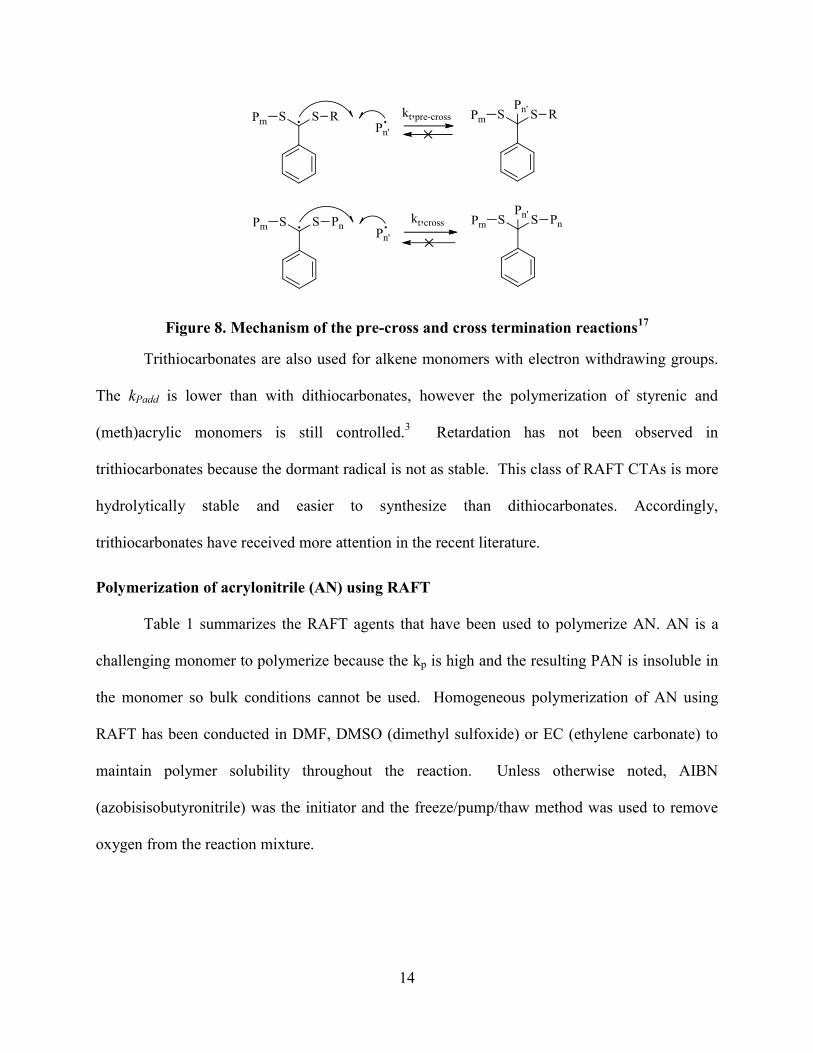
Retardation, meaning reduced monomer conversion over time, is a problem when a
dithiocarbonate with an aromatic Z group is used because the dormant radical species is
resonance stabilized. Due to resonance stabilization, pre-cross and cross termination reactions
have been shown to occur between the dormant radical species and low molecular weight active
radical species16
which results in cross-termination products as shown in Figure 8. In general,
other issues with dithiocarbonates are hydrolytic and thermal instability.
14
Figure 8. Mechanism of the pre-cross and cross termination reactions17
Trithiocarbonates are also used for alkene monomers with electron withdrawing groups.
The kPadd is lower than with dithiocarbonates, however the polymerization of styrenic and
(meth)acrylic monomers is still controlled.3 Retardation has not been observed in
trithiocarbonates because the dormant radical is not as stable. This class of RAFT CTAs is more
hydrolytically stable and easier to synthesize than dithiocarbonates. Accordingly,
trithiocarbonates have received more attention in the recent literature.
Polymerization of acrylonitrile (AN) using RAFT
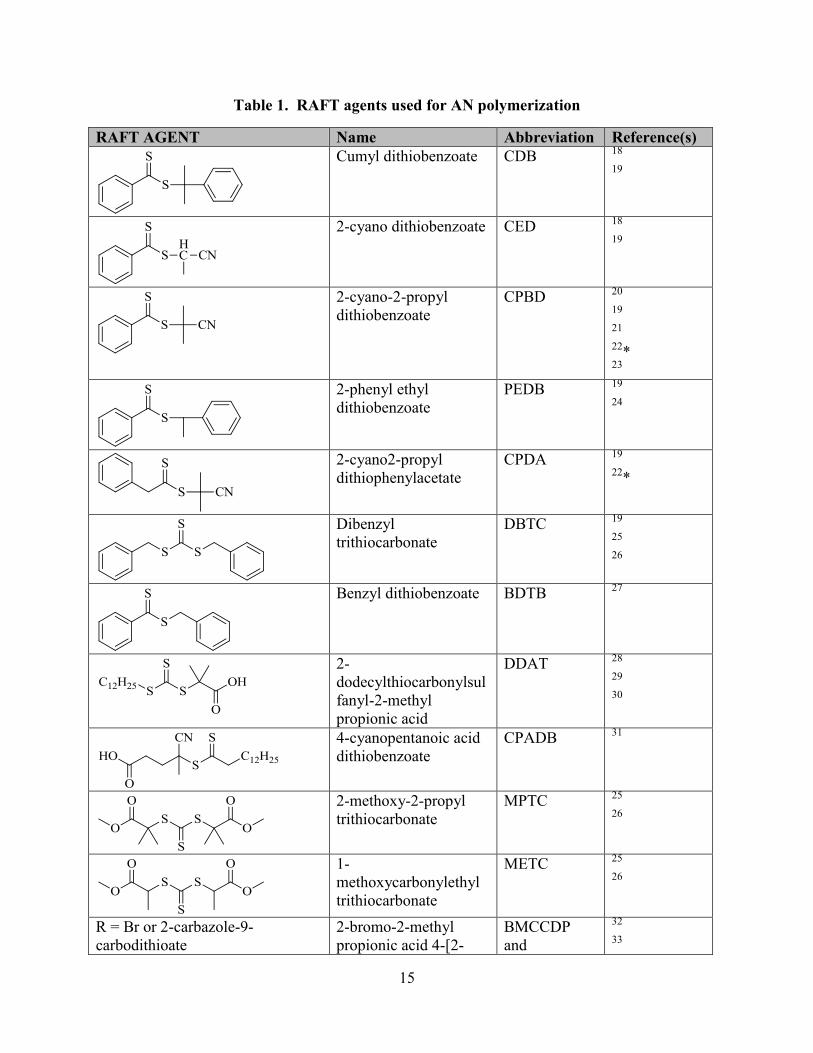
Table 1 summarizes the RAFT agents that have been used to polymerize AN. AN is a
challenging monomer to polymerize because the kp is high and the resulting PAN is insoluble in
the monomer so bulk conditions cannot be used. Homogeneous polymerization of AN using
RAFT has been conducted in DMF, DMSO (dimethyl sulfoxide) or EC (ethylene carbonate) to
maintain polymer solubility throughout the reaction. Unless otherwise noted, AIBN
(azobisisobutyronitrile) was the initiator and the freeze/pump/thaw method was used to remove
oxygen from the reaction mixture.
15
Table 1. RAFT agents used for AN polymerization
RAFT AGENT Name Abbreviation Reference(s)
Cumyl dithiobenzoate CDB 18
19
2-cyano dithiobenzoate CED 18
19
2-cyano-2-propyl
dithiobenzoate
CPBD 20
19
21
22
* 23
2-phenyl ethyl
dithiobenzoate
PEDB 19
24
2-cyano2-propyl
dithiophenylacetate
CPDA 19
22
*
Dibenzyl
trithiocarbonate
DBTC 19
25
26
Benzyl dithiobenzoate BDTB 27
2-
dodecylthiocarbonylsul
fanyl-2-methyl
propionic acid
DDAT 28
29
30
4-cyanopentanoic acid
dithiobenzoate
CPADB 31
2-methoxy-2-propyl
trithiocarbonate
MPTC 25
26
1-
methoxycarbonylethyl
trithiocarbonate
METC 25
26
R = Br or 2-carbazole-9-
carbodithioate
2-bromo-2-methyl
propionic acid 4-[2-
BMCCDP
and
32
33
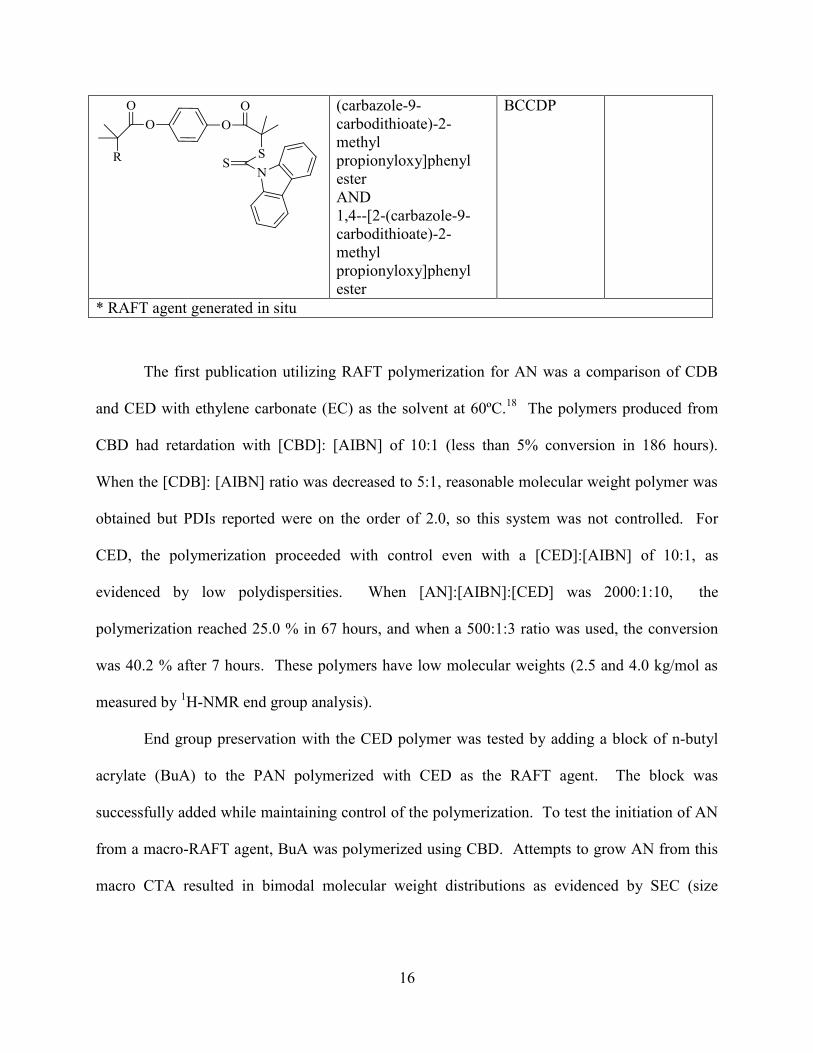
16
(carbazole-9-
carbodithioate)-2-
methyl
propionyloxy]phenyl
ester
AND
1,4--[2-(carbazole-9-
carbodithioate)-2-
methyl
propionyloxy]phenyl
ester
BCCDP
* RAFT agent generated in situ
The first publication utilizing RAFT polymerization for AN was a comparison of CDB
and CED with ethylene carbonate (EC) as the solvent at 60ºC.18
The polymers produced from
CBD had retardation with [CBD]: [AIBN] of 10:1 (less than 5% conversion in 186 hours).
When the [CDB]: [AIBN] ratio was decreased to 5:1, reasonable molecular weight polymer was
obtained but PDIs reported were on the order of 2.0, so this system was not controlled. For
CED, the polymerization proceeded with control even with a [CED]:[AIBN] of 10:1, as
evidenced by low polydispersities. When [AN]:[AIBN]:[CED] was 2000:1:10, the
polymerization reached 25.0 % in 67 hours, and when a 500:1:3 ratio was used, the conversion
was 40.2 % after 7 hours. These polymers have low molecular weights (2.5 and 4.0 kg/mol as
measured by 1H-NMR end group analysis).
End group preservation with the CED polymer was tested by adding a block of n-butyl
acrylate (BuA) to the PAN polymerized with CED as the RAFT agent. The block was
successfully added while maintaining control of the polymerization. To test the initiation of AN
from a macro-RAFT agent, BuA was polymerized using CBD. Attempts to grow AN from this
macro CTA resulted in bimodal molecular weight distributions as evidenced by SEC (size
17
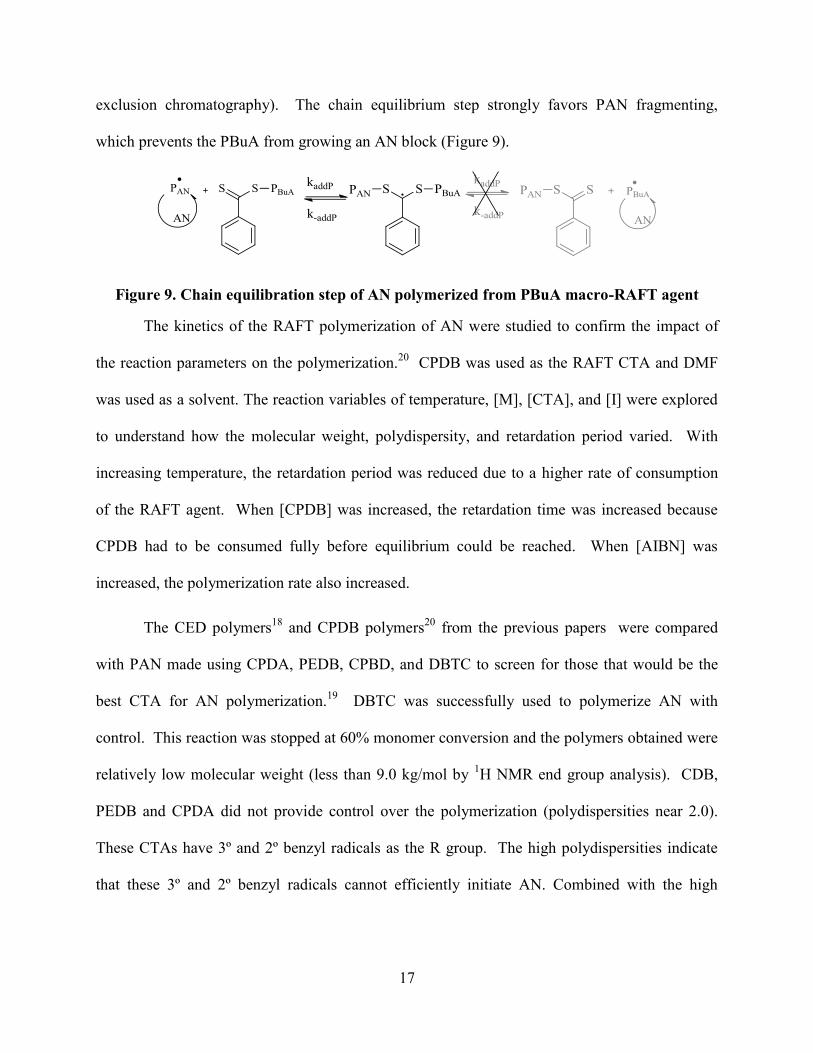
exclusion chromatography). The chain equilibrium step strongly favors PAN fragmenting,
which prevents the PBuA from growing an AN block (Figure 9).
Figure 9. Chain equilibration step of AN polymerized from PBuA macro-RAFT agent
The kinetics of the RAFT polymerization of AN were studied to confirm the impact of
the reaction parameters on the polymerization.20
CPDB was used as the RAFT CTA and DMF
was used as a solvent. The reaction variables of temperature, [M], [CTA], and [I] were explored
to understand how the molecular weight, polydispersity, and retardation period varied. With
increasing temperature, the retardation period was reduced due to a higher rate of consumption
of the RAFT agent. When [CPDB] was increased, the retardation time was increased because
CPDB had to be consumed fully before equilibrium could be reached. When [AIBN] was
increased, the polymerization rate also increased.
The CED polymers18
and CPDB polymers20
from the previous papers were compared
with PAN made using CPDA, PEDB, CPBD, and DBTC to screen for those that would be the
best CTA for AN polymerization.19
DBTC was successfully used to polymerize AN with
control. This reaction was stopped at 60% monomer conversion and the polymers obtained were
relatively low molecular weight (less than 9.0 kg/mol by 1H NMR end group analysis). CDB,
PEDB and CPDA did not provide control over the polymerization (polydispersities near 2.0).
These CTAs have 3º and 2º benzyl radicals as the R group. The high polydispersities indicate
that these 3º and 2º benzyl radicals cannot efficiently initiate AN. Combined with the high
18
propagation rate of AN, ineffective initiation caused the polymerization to proceed in an
uncontrolled manner.
To increase the degree of polymerization, the reaction conditions were investigated using
CPDB21
, which was shown to enhance control the degree of polymerization in a previous
reference.20
Solvent choice was the critical aspect to high conversion in this reaction. DMF,
DMSO and EC were compared at otherwise identical conditions at 60ºC and 90ºC, and it was
found that the monomer conversion for the reactions run in EC were higher. These differences
were attributed to the chain transfer ability of DMF and DMSO relative to EC. Polar interactions
between the carbonyl in EC and the nitrile of AN have been reported.34
This interaction may
begin to explain higher monomer conversion in EC compared to DMF and DMSO, but this
phenomenon needs to be studied further. The PDI of the polymers in EC was also improved
compared to the other solvents, and molecular weights up to 35 kg/mol were achieved.
An et al. also explored copolymerizing AN with several different comonomers, including
St, MA (methyl acrylate), MMA, BuA, and IA (itaconic acid). With 5 mol% incorporation of
any one of these comonomers with AN, the overall monomer conversion was reduced. Since the
AN radical propagates rapidly, addition of a slower propagating radical causes a reduction in the
rate of propagation.
In the references discussed so far,18,19,20
the monomer conversion plateaus off before
reaching high conversions. The polymerization temperature likely had an impact due to the half-
life (t1/2) of AIBN. As an example, the conversion versus time plot for the polymerizations done
at 90ºC leveled off at 70% conversion in three hours.21
Ideally, in the presence of a RAFT agent,
the radical level will stay at a steady state during the polymerization to consume monomer. The
t1/2 of AIBN has been reported as 23 minutes at 90ºC,35
and so the majority of the initiator has
19
decomposed within the first hour. Without radicals being produced, termination may cause the
radical concentration to decrease and the conversion to stop.
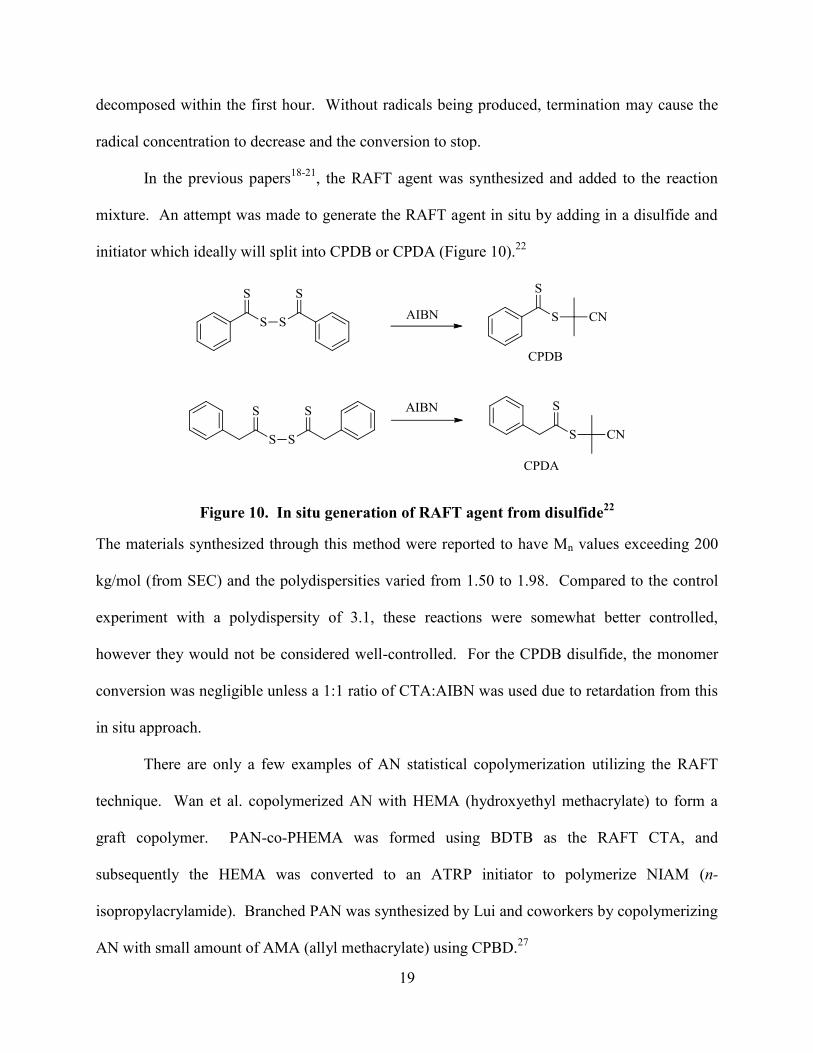
In the previous papers18-21
, the RAFT agent was synthesized and added to the reaction
mixture. An attempt was made to generate the RAFT agent in situ by adding in a disulfide and
initiator which ideally will split into CPDB or CPDA (Figure 10).22
Figure 10. In situ generation of RAFT agent from disulfide22
The materials synthesized through this method were reported to have Mn values exceeding 200
kg/mol (from SEC) and the polydispersities varied from 1.50 to 1.98. Compared to the control
experiment with a polydispersity of 3.1, these reactions were somewhat better controlled,
however they would not be considered well-controlled. For the CPDB disulfide, the monomer
conversion was negligible unless a 1:1 ratio of CTA:AIBN was used due to retardation from this
in situ approach.
There are only a few examples of AN statistical copolymerization utilizing the RAFT
technique. Wan et al. copolymerized AN with HEMA (hydroxyethyl methacrylate) to form a
graft copolymer. PAN-co-PHEMA was formed using BDTB as the RAFT CTA, and
subsequently the HEMA was converted to an ATRP initiator to polymerize NIAM (n-
isopropylacrylamide). Branched PAN was synthesized by Lui and coworkers by copolymerizing
AN with small amount of AMA (allyl methacrylate) using CPBD.27
20
Several articles have shown that PAN can be successfully initiated from a RAFT macro
CTA. Wan et al. used a macro AN to form a block copolymer with NIAM and a comb
copolymer through growing a block of HEMA then post-modifying the HEMA to an ATRP
initiator. The ATRP initiator was used to form NIAM grafts.28
Aquil and colleagues
synthesized poly(acrylic acid)-b-PAN using DMF as the RAFT CTA.23
Feng and colleagues
attached DDAT to the surface of a CdS nanoparticle and grew PAN from the surface.29
PSt was
grown from PEDB then a AN oligomer (2-5 units) was grown. The PSt-b-PAN was transformed
to PSt-b-poly(allyl amine) through reduction of the nitrile.24
PAN-b-PDMS
(poly(dimethylsiloxane)) was synthesized through modifying PDMS with DDAT at both ends.30
BMCCPD (monofunctional) and BCCPD (difunctional) RAFT agents were used to polymerize
high and low molecular weight PSt in the same pot. PSt was chain extended with AN, resulting
in a linear increase in the degree of polymerization and a corresponding shift in the SEC data
while a narrow polydispersity was maintained.32
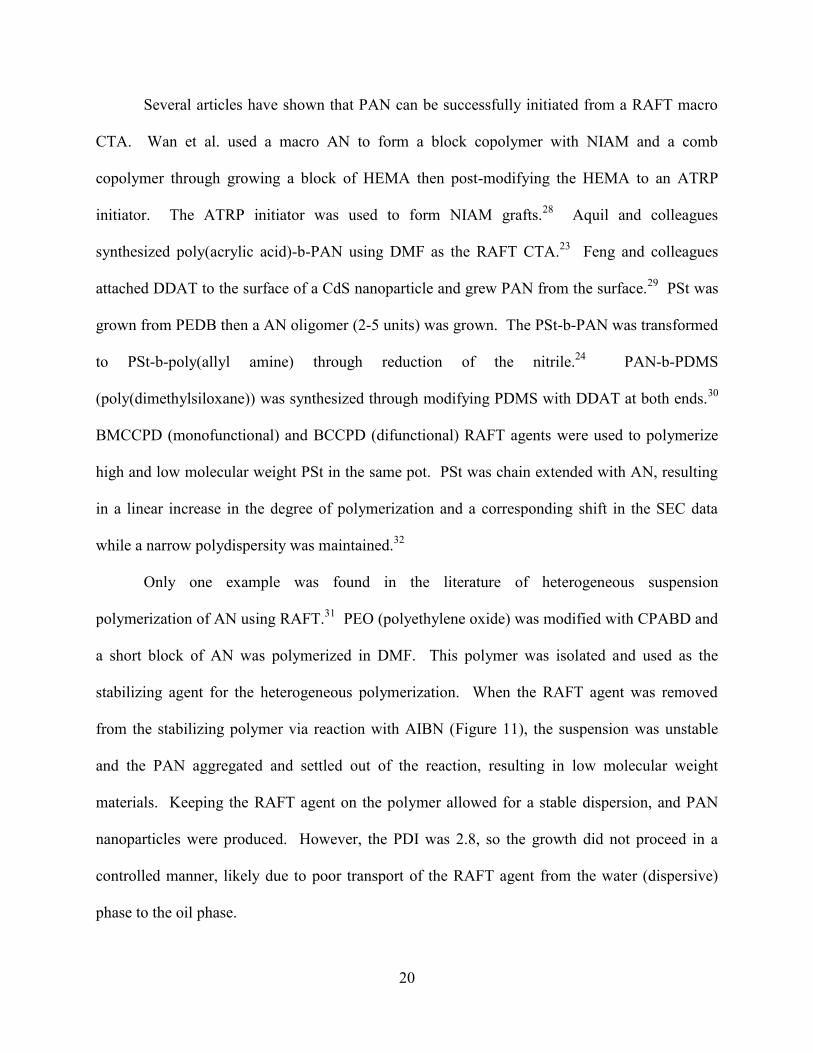
Only one example was found in the literature of heterogeneous suspension
polymerization of AN using RAFT.31
PEO (polyethylene oxide) was modified with CPABD and
a short block of AN was polymerized in DMF. This polymer was isolated and used as the
stabilizing agent for the heterogeneous polymerization. When the RAFT agent was removed
from the stabilizing polymer via reaction with AIBN (Figure 11), the suspension was unstable
and the PAN aggregated and settled out of the reaction, resulting in low molecular weight
materials. Keeping the RAFT agent on the polymer allowed for a stable dispersion, and PAN
nanoparticles were produced. However, the PDI was 2.8, so the growth did not proceed in a
controlled manner, likely due to poor transport of the RAFT agent from the water (dispersive)
phase to the oil phase.
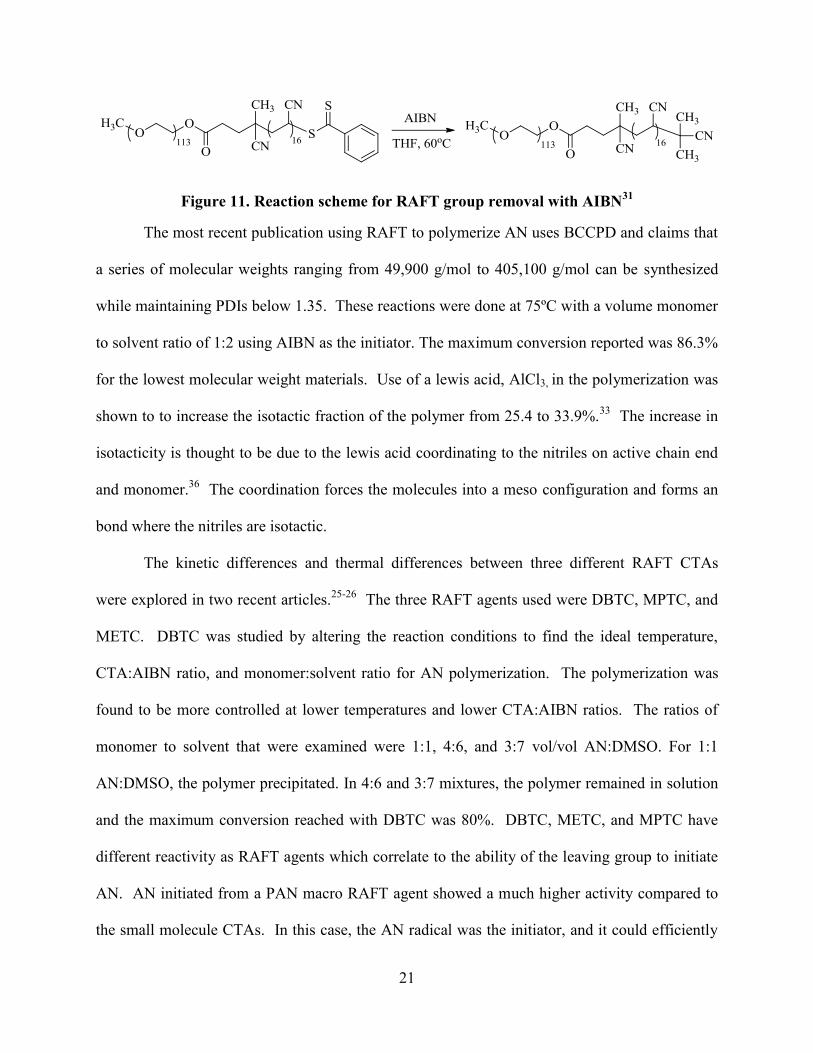
21
Figure 11. Reaction scheme for RAFT group removal with AIBN31
The most recent publication using RAFT to polymerize AN uses BCCPD and claims that
a series of molecular weights ranging from 49,900 g/mol to 405,100 g/mol can be synthesized
while maintaining PDIs below 1.35. These reactions were done at 75ºC with a volume monomer
to solvent ratio of 1:2 using AIBN as the initiator. The maximum conversion reported was 86.3%
for the lowest molecular weight materials. Use of a lewis acid, AlCl3, in the polymerization was
shown to to increase the isotactic fraction of the polymer from 25.4 to 33.9%.33
The increase in
isotacticity is thought to be due to the lewis acid coordinating to the nitriles on active chain end
and monomer.36
The coordination forces the molecules into a meso configuration and forms an
bond where the nitriles are isotactic.
The kinetic differences and thermal differences between three different RAFT CTAs
were explored in two recent articles.25-26
The three RAFT agents used were DBTC, MPTC, and
METC. DBTC was studied by altering the reaction conditions to find the ideal temperature,
CTA:AIBN ratio, and monomer:solvent ratio for AN polymerization. The polymerization was
found to be more controlled at lower temperatures and lower CTA:AIBN ratios. The ratios of
monomer to solvent that were examined were 1:1, 4:6, and 3:7 vol/vol AN:DMSO. For 1:1
AN:DMSO, the polymer precipitated. In 4:6 and 3:7 mixtures, the polymer remained in solution
and the maximum conversion reached with DBTC was 80%. DBTC, METC, and MPTC have
different reactivity as RAFT agents which correlate to the ability of the leaving group to initiate
AN. AN initiated from a PAN macro RAFT agent showed a much higher activity compared to
the small molecule CTAs. In this case, the AN radical was the initiator, and it could efficiently
22
reinitiate itself. Pressurized CO2 was also explored as a solvent for this polymerization via
RAFT and conventional free radical methods. However, since PAN is insoluble in CO2 the
polymer precipitated before a high degree of polymerization was achieved. 13
C-NMR was
conducted to determine tacticity differences between the CO2 and solution synthesized materials.
The methine carbon was assessed and the tacticity ratios were not significantly different between
methods of synthesis.
Thermal Characteristics of AN polymerized by RAFT
AN polymers synthesized by RAFT were examined in argon air using DSC (Differential
Scanning Calorimetry) to determine thermal characteristics.25-26
In PAN, degradation occurs
through two major processes, cyclization in inert atmosphere and cyclization and oxidative
degradation in air. AN synthesized with BTC as the RAFT agent was compared with a
commercially available PAN purchased from Sigma-Aldrich and a PAN sample polymerized in
CO2 (without CTA) (Figure 12).
23
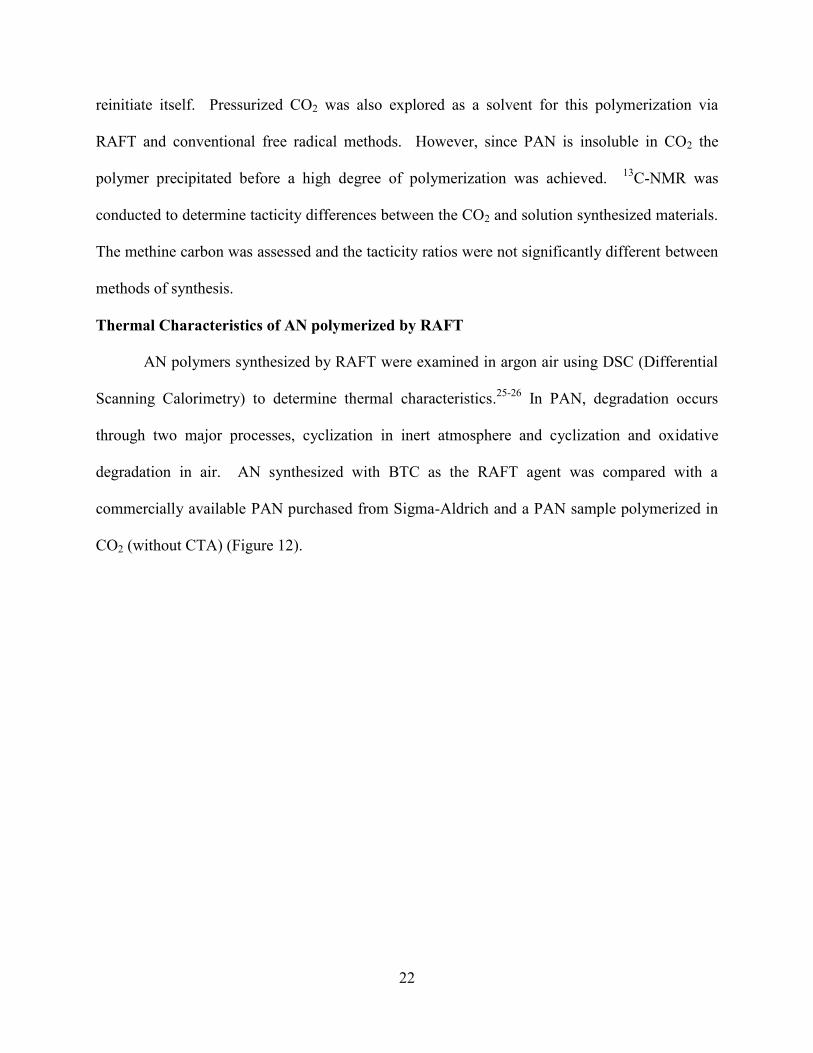
Figure 12. Thermograms from DSC of PAN pellets measured in (a) argon and (b) air at 10
K/min: (1) commercial PAN sample (Aldrich), (2) PAN synthesized via the polymerization
of AN in CO2, and (3) PAN synthesized in DMSO in the presence of MPTC. Chernikova,
E. V.; Poteryaeva, Z. A.; Belyaev, S. S.; Nifant’ev, I. E.; Shlyakhtin, A. V.; Kostina, Y. V.;
Cherevan, A. S.; Efimov, M. N.; Bondarenko, G. N.; Sivtsov, E. V., Polymer Science Series
B 2011, 53 (7-8), 391-403. Used under fair use, 2014.
In the RAFT sample (Figure 12, a, (3)) the degradation began at a lower temperature and
occurred over a broader temperature range with two maxima versus the commercial (Figure 12,
a, (1)) and CO2 synthesized samples (Figure 12, a, (2)) which had one maxima. In air (Figure
12, b), the exotherm was broader for all the samples and had different maxima, and the
maximum exotherm occurred at higher temperature due to oxidative degradation.

24
The exotherm produced in the commercial (Figure 12, b, (1)) and CO2 sample (Figure 12,
b, (2)) were much higher than that of the RAFT sample. This may be due the RAFT end group
degrading or leaving which may produce a radical on the polymer. This radical may kick off
premature crosslinking of the PAN sample.
The degradation profiles for four RAFT polymers of similar molecular weight were
compared by DSC (Figure 13).
25
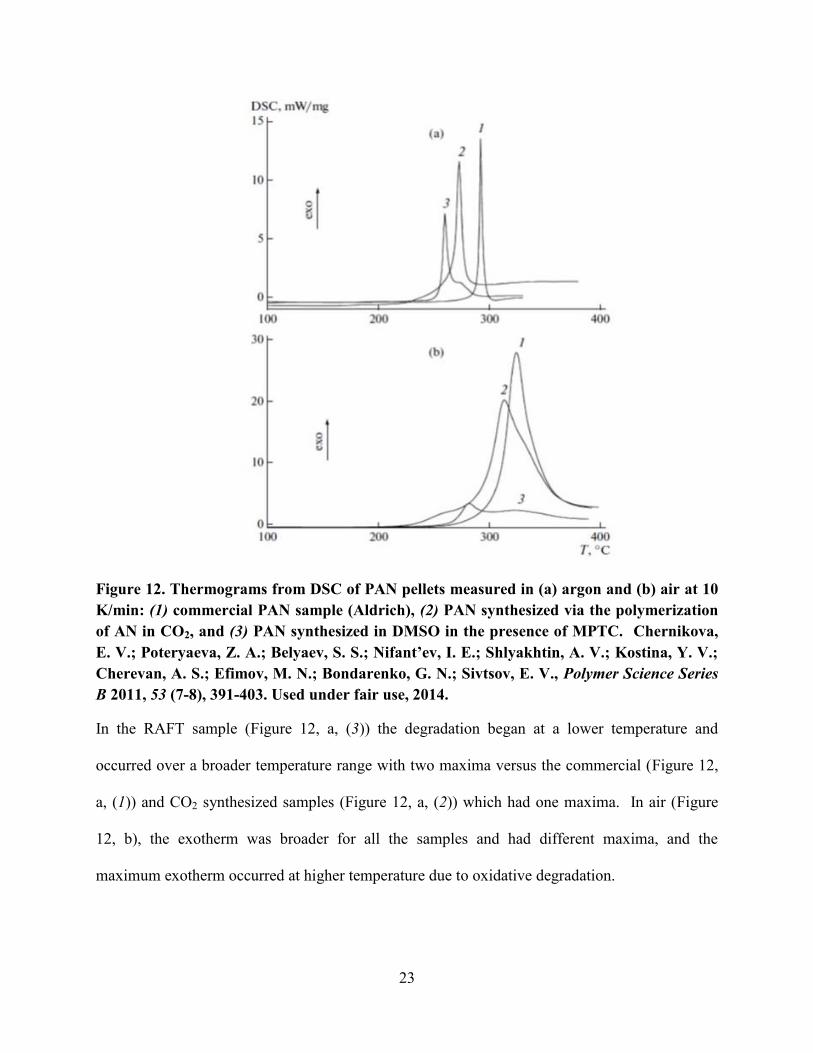
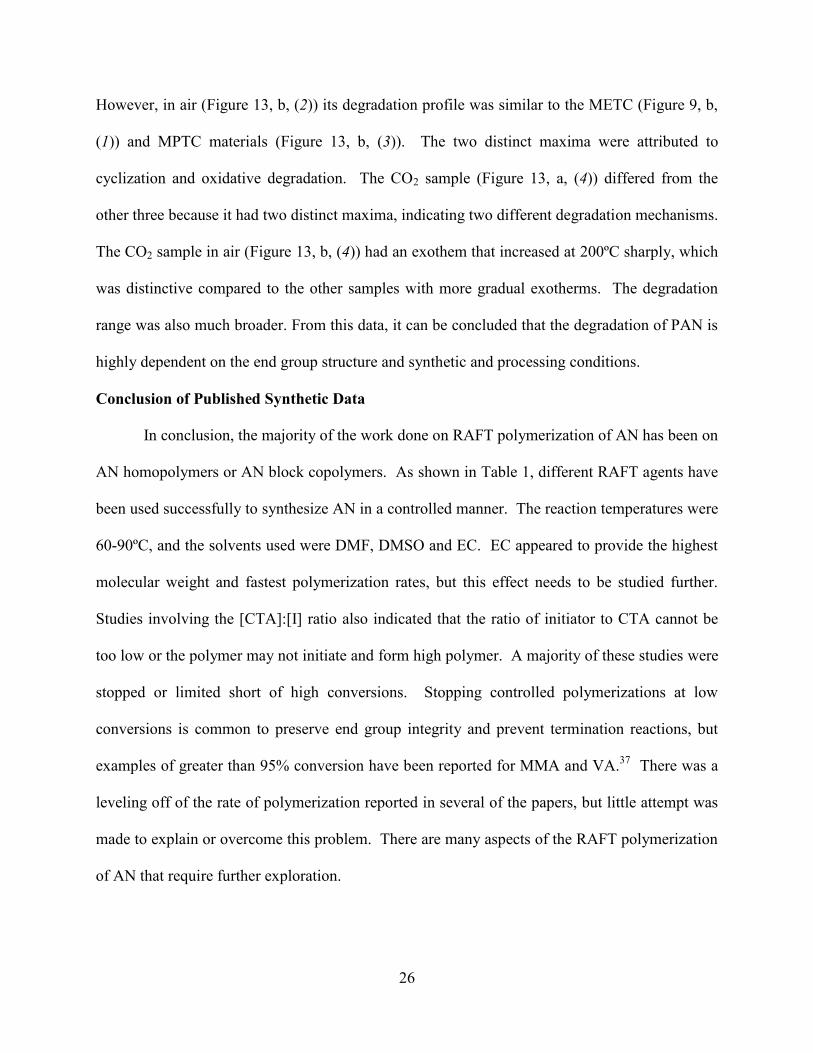
Figure 13. Thermograms from DSC of PAN pellets measured in (a) argon and (b) air at 10
K/min: PAN was synthesized via RAFT polymerization (1-3) in the presence of (1) METC,
(2) DBTC, and (3) MPTC and (4) in CO2 in the presence of DBTC. Chernikova, E. V.;
Poteryaeva, Z. A.; Belyaev, S. S.; Nifant’ev, I. E.; Shlyakhtin, A. V.; Kostina, Y. V.;
Cherevan, A. S.; Efimov, M. N.; Bondarenko, G. N.; Sivtsov, E. V., Polymer Science Series
B 2011, 53 (7-8), 391-403. Used under fair use, 2014.
The DSC degradation profile was clearly dependent on the end group structure as well as the
polymerization conditions. The polymers made with the METC (Figure 13, a and b, (1)) and
MPTC RAFT agents (Figure 13, a and b, (3)) had similar profiles in both the argon and air tests.
In argon, the BTC sample (Figure 13, a, (2)) began degrading after the other three samples.
26
However, in air (Figure 13, b, (2)) its degradation profile was similar to the METC (Figure 9, b,
(1)) and MPTC materials (Figure 13, b, (3)). The two distinct maxima were attributed to
cyclization and oxidative degradation. The CO2 sample (Figure 13, a, (4)) differed from the
other three because it had two distinct maxima, indicating two different degradation mechanisms.
The CO2 sample in air (Figure 13, b, (4)) had an exothem that increased at 200ºC sharply, which
was distinctive compared to the other samples with more gradual exotherms. The degradation
range was also much broader. From this data, it can be concluded that the degradation of PAN is
highly dependent on the end group structure and synthetic and processing conditions.
Conclusion of Published Synthetic Data
In conclusion, the majority of the work done on RAFT polymerization of AN has been on
AN homopolymers or AN block copolymers. As shown in Table 1, different RAFT agents have
been used successfully to synthesize AN in a controlled manner. The reaction temperatures were
60-90ºC, and the solvents used were DMF, DMSO and EC. EC appeared to provide the highest
molecular weight and fastest polymerization rates, but this effect needs to be studied further.
Studies involving the [CTA]:[I] ratio also indicated that the ratio of initiator to CTA cannot be
too low or the polymer may not initiate and form high polymer. A majority of these studies were
stopped or limited short of high conversions. Stopping controlled polymerizations at low
conversions is common to preserve end group integrity and prevent termination reactions, but
examples of greater than 95% conversion have been reported for MMA and VA.37
There was a
leveling off of the rate of polymerization reported in several of the papers, but little attempt was
made to explain or overcome this problem. There are many aspects of the RAFT polymerization
of AN that require further exploration.
27
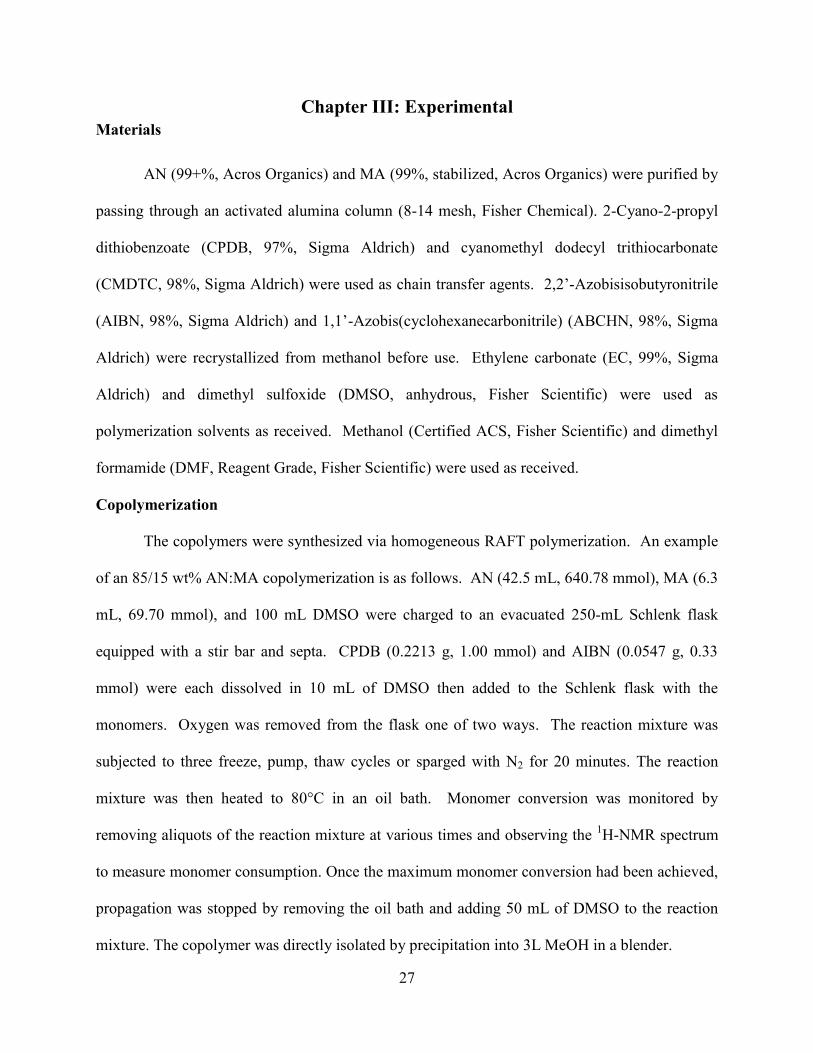
Chapter III: Experimental
Materials
AN (99+%, Acros Organics) and MA (99%, stabilized, Acros Organics) were purified by
passing through an activated alumina column (8-14 mesh, Fisher Chemical). 2-Cyano-2-propyl
dithiobenzoate (CPDB, 97%, Sigma Aldrich) and cyanomethyl dodecyl trithiocarbonate
(CMDTC, 98%, Sigma Aldrich) were used as chain transfer agents. 2,2’-Azobisisobutyronitrile
(AIBN, 98%, Sigma Aldrich) and 1,1’-Azobis(cyclohexanecarbonitrile) (ABCHN, 98%, Sigma
Aldrich) were recrystallized from methanol before use. Ethylene carbonate (EC, 99%, Sigma
Aldrich) and dimethyl sulfoxide (DMSO, anhydrous, Fisher Scientific) were used as
polymerization solvents as received. Methanol (Certified ACS, Fisher Scientific) and dimethyl
formamide (DMF, Reagent Grade, Fisher Scientific) were used as received.
Copolymerization
The copolymers were synthesized via homogeneous RAFT polymerization. An example
of an 85/15 wt% AN:MA copolymerization is as follows. AN (42.5 mL, 640.78 mmol), MA (6.3
mL, 69.70 mmol), and 100 mL DMSO were charged to an evacuated 250-mL Schlenk flask
equipped with a stir bar and septa. CPDB (0.2213 g, 1.00 mmol) and AIBN (0.0547 g, 0.33
mmol) were each dissolved in 10 mL of DMSO then added to the Schlenk flask with the
monomers. Oxygen was removed from the flask one of two ways. The reaction mixture was
subjected to three freeze, pump, thaw cycles or sparged with N2 for 20 minutes. The reaction
mixture was then heated to 80°C in an oil bath. Monomer conversion was monitored by
removing aliquots of the reaction mixture at various times and observing the 1H-NMR spectrum
to measure monomer consumption. Once the maximum monomer conversion had been achieved,
propagation was stopped by removing the oil bath and adding 50 mL of DMSO to the reaction
mixture. The copolymer was directly isolated by precipitation into 3L MeOH in a blender.
28
When EC was used as the solvent, the oxygen was removed using three freeze, pump,
thaw cycles because the viscosity of the reaction mixture would not allow for a good N2 purge.
The copolymer was isolated from the reaction mixture by precipitation into 3L of DI water at
80°C in a blender. After stirring overnight, the copolymer precipitate was filtered and dissolved
at 10 wt% in DMSO and reprecipitated into 3L MeOH. One additional re-precipitation was
carried out in MeOH to fully remove the ethylene carbonate. All the copolymers were dried
under reduced pressure at 100°C for 24 hrs. to remove any residual solvent.
Synthetic Variables
To better understand the copolymerization of AN and MA using RAFT
copolymerization, several different variables were systematically altered for investigation. These
variables were solvent, RAFT agent, free radical initiator, reaction temperature and
concentration.
Removal of RAFT End Group
A 250-mL Schlenk flask equipped with a magnetic stir bar was charged with 15 g of
PAN-co-MA (82/18 wt% AN:MA, Mn = 47800), AIBN (0.125 g, 0.75 mmol), Bu3SnH (1.091 g,
3.75 mmol), and 150 mL DMSO. The freeze, pump, thaw, blanket with N2 technique was
repeated three times to remove dissolved oxygen, and the reaction mixture was heated to 80°C in
an oil bath. After 3 hours, the copolymer was isolated by precipitation into 2L MeOH, filtered,
then dried under reduced pressure at 100ºC for 24 hours to remove any residual small
molecules.38
Characterization
Samples for 1H-NMR were prepared by dissolving 20 mg copolymer in 0.7 mL DMSO-
d6 (VWR). The 1H-NMR spectra were obtained using a Varian MR 400 MHz spectrometer with
29
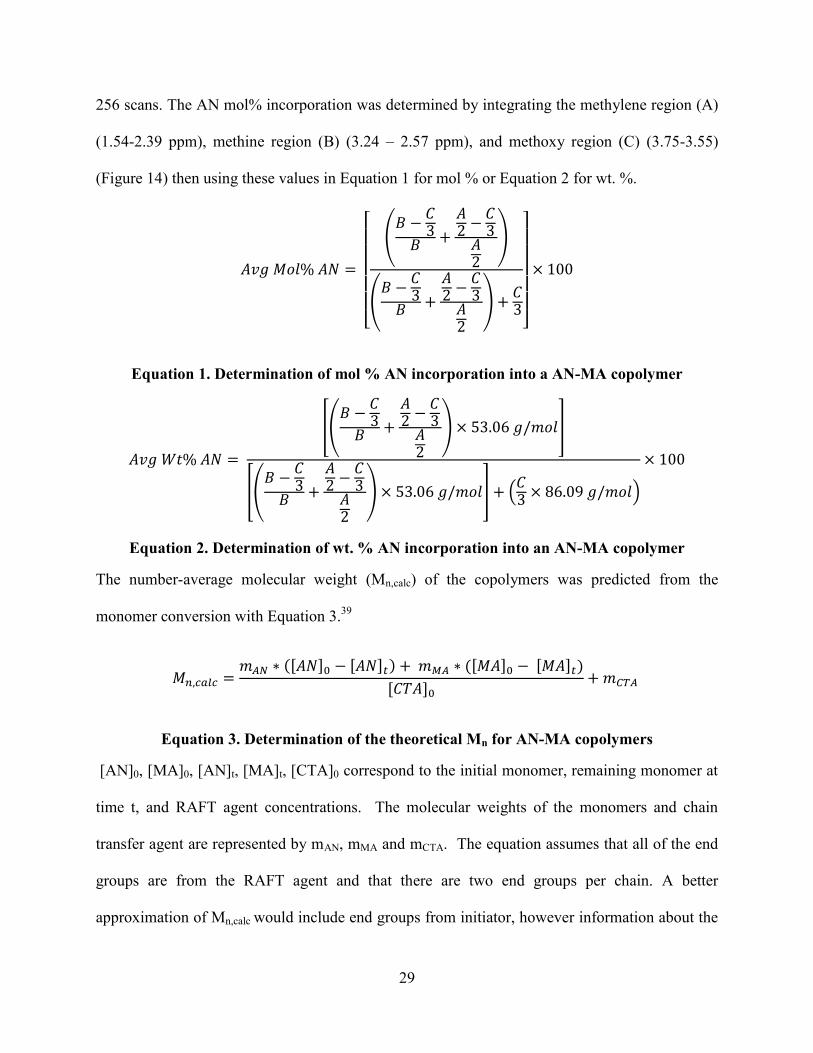
256 scans. The AN mol% incorporation was determined by integrating the methylene region (A)
(1.54-2.39 ppm), methine region (B) (3.24 – 2.57 ppm), and methoxy region (C) (3.75-3.55)
(Figure 14) then using these values in Equation 1 for mol % or Equation 2 for wt. %.
[
(
)
(
) ]
Equation 1. Determination of mol % AN incorporation into a AN-MA copolymer
[(
) ]
[(
) ] ( )
Equation 2. Determination of wt. % AN incorporation into an AN-MA copolymer
The number-average molecular weight (Mn,calc) of the copolymers was predicted from the
monomer conversion with Equation 3.39
( ) ( )
Equation 3. Determination of the theoretical Mn for AN-MA copolymers
[AN]0, [MA]0, [AN]t, [MA]t, [CTA]0 correspond to the initial monomer, remaining monomer at
time t, and RAFT agent concentrations. The molecular weights of the monomers and chain
transfer agent are represented by mAN, mMA and mCTA. The equation assumes that all of the end
groups are from the RAFT agent and that there are two end groups per chain. A better
approximation of Mn,calc would include end groups from initiator, however information about the
30
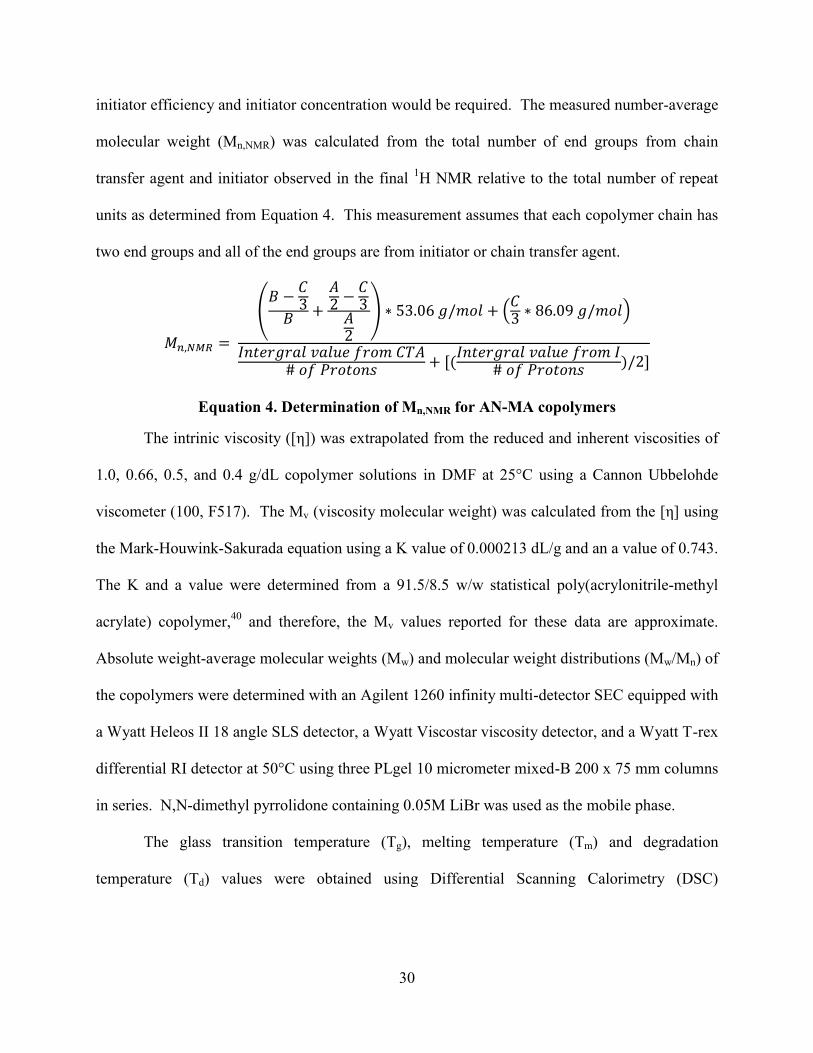
initiator efficiency and initiator concentration would be required. The measured number-average
molecular weight (Mn,NMR) was calculated from the total number of end groups from chain
transfer agent and initiator observed in the final 1H NMR relative to the total number of repeat
units as determined from Equation 4. This measurement assumes that each copolymer chain has
two end groups and all of the end groups are from initiator or chain transfer agent.
(
) ( )
(
)
Equation 4. Determination of Mn,NMR for AN-MA copolymers
The intrinic viscosity ([η]) was extrapolated from the reduced and inherent viscosities of
1.0, 0.66, 0.5, and 0.4 g/dL copolymer solutions in DMF at 25°C using a Cannon Ubbelohde
viscometer (100, F517). The Mv (viscosity molecular weight) was calculated from the [η] using
the Mark-Houwink-Sakurada equation using a K value of 0.000213 dL/g and an a value of 0.743.
The K and a value were determined from a 91.5/8.5 w/w statistical poly(acrylonitrile-methyl
acrylate) copolymer,40
and therefore, the Mv values reported for these data are approximate.
Absolute weight-average molecular weights (Mw) and molecular weight distributions (Mw/Mn) of
the copolymers were determined with an Agilent 1260 infinity multi-detector SEC equipped with
a Wyatt Heleos II 18 angle SLS detector, a Wyatt Viscostar viscosity detector, and a Wyatt T-rex
differential RI detector at 50°C using three PLgel 10 micrometer mixed-B 200 x 75 mm columns
in series. N,N-dimethyl pyrrolidone containing 0.05M LiBr was used as the mobile phase.
The glass transition temperature (Tg), melting temperature (Tm) and degradation
temperature (Td) values were obtained using Differential Scanning Calorimetry (DSC)
31
thermograms measured on a Thermal Analysis Q1000 instrument at 10°C/min using a heat (-20
to 150°C) /cool (150 to -20°C)/ heat (-20 to 300°C) cycle program.
To illustrate melt processability, approximately 2 grams of 82/18 wt% PAN-co-MA were
placed between two steel plates and melt pressed into a 4”x 4” film at 190ºC and 5000 psi using
a Carver hydraulic unit model 3912 press.
32
Chapter IV: Results and Discussion
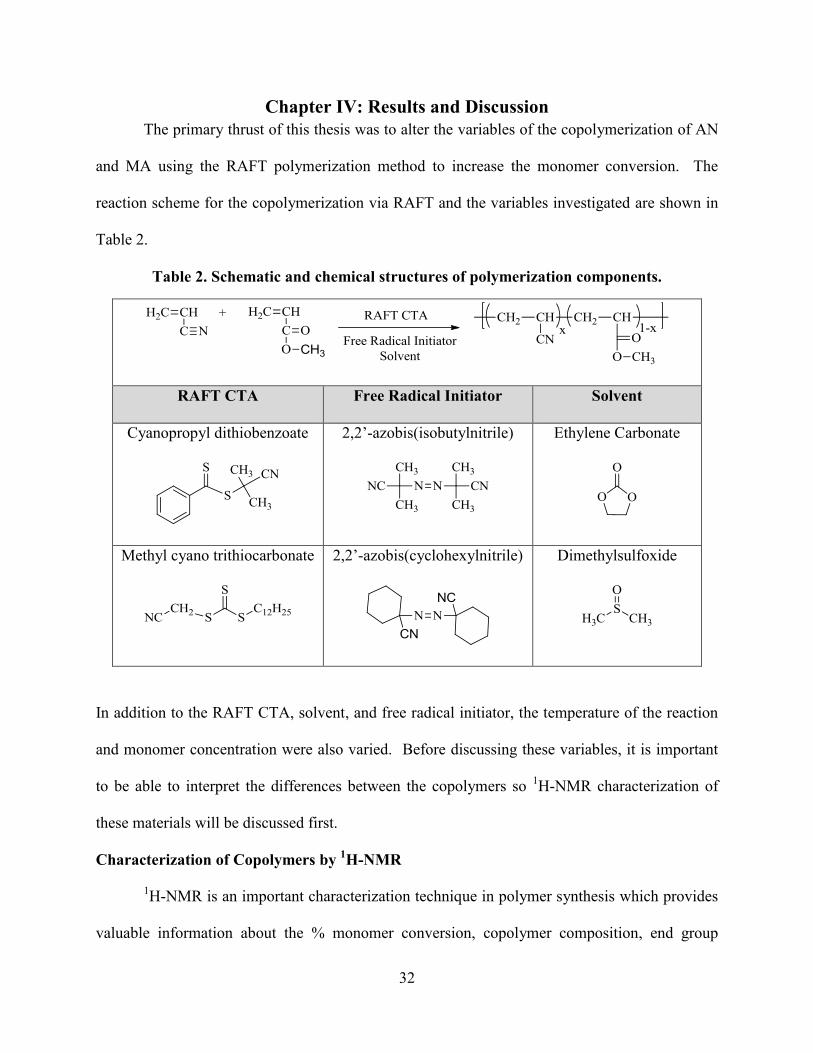
The primary thrust of this thesis was to alter the variables of the copolymerization of AN
and MA using the RAFT polymerization method to increase the monomer conversion. The
reaction scheme for the copolymerization via RAFT and the variables investigated are shown in
Table 2.
Table 2. Schematic and chemical structures of polymerization components.
RAFT CTA Free Radical Initiator Solvent
Cyanopropyl dithiobenzoate
2,2’-azobis(isobutylnitrile)
Ethylene Carbonate
Methyl cyano trithiocarbonate
2,2’-azobis(cyclohexylnitrile)
Dimethylsulfoxide
In addition to the RAFT CTA, solvent, and free radical initiator, the temperature of the reaction
and monomer concentration were also varied. Before discussing these variables, it is important
to be able to interpret the differences between the copolymers so 1H-NMR characterization of
these materials will be discussed first.
Characterization of Copolymers by 1H-NMR
1H-NMR is an important characterization technique in polymer synthesis which provides
valuable information about the % monomer conversion, copolymer composition, end group
33
concentrations, tacticity, purity, and kinetic information. In this work, the reaction conditions
were varied and 1H-NMR was the primary technique used to determine if there was an
improvement in the monomer conversion rate and maximum extent of conversion. The 1H-NMR
spectra taken during the copolymerization were used to determine % monomer conversion and
qualitative kinetic information, and the spectra taken of the final purified product was used to
determine copolymer composition, end group concentration, and a measured number average
molecular weight (Mn,NMR).
Measuring Monomer Conversion by 1H-NMR
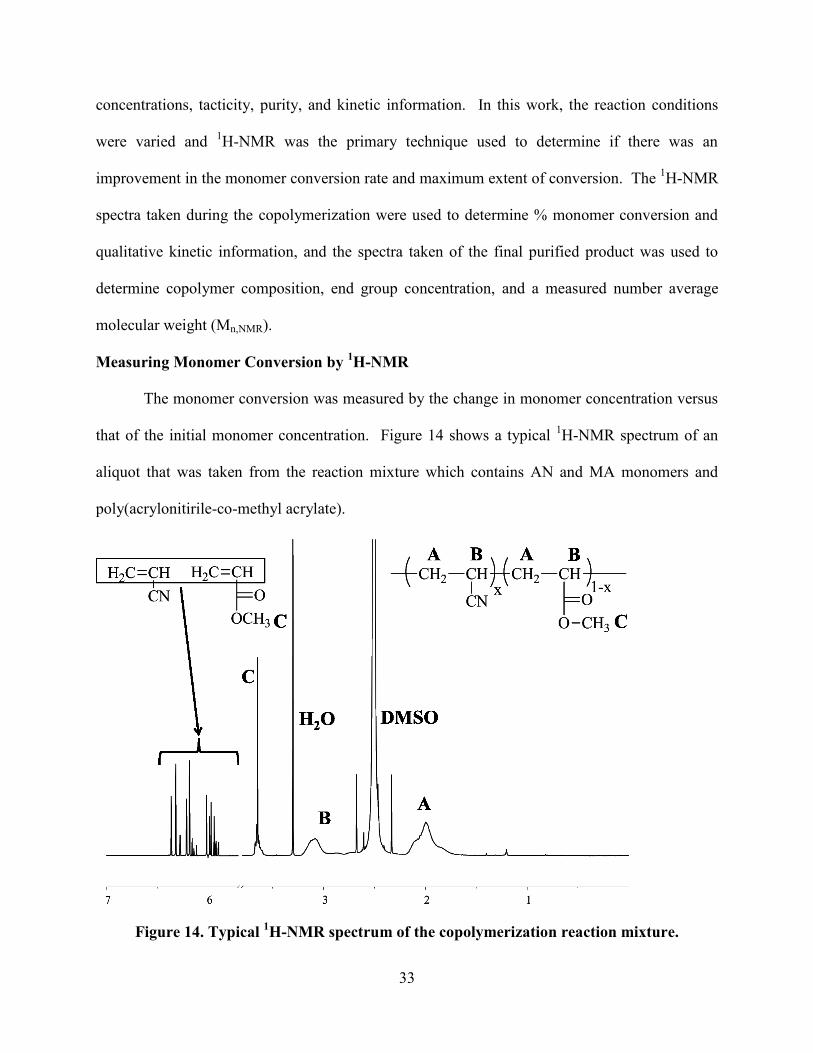
The monomer conversion was measured by the change in monomer concentration versus
that of the initial monomer concentration. Figure 14 shows a typical 1H-NMR spectrum of an
aliquot that was taken from the reaction mixture which contains AN and MA monomers and
poly(acrylonitirile-co-methyl acrylate).
Figure 14. Typical 1H-NMR spectrum of the copolymerization reaction mixture.
34
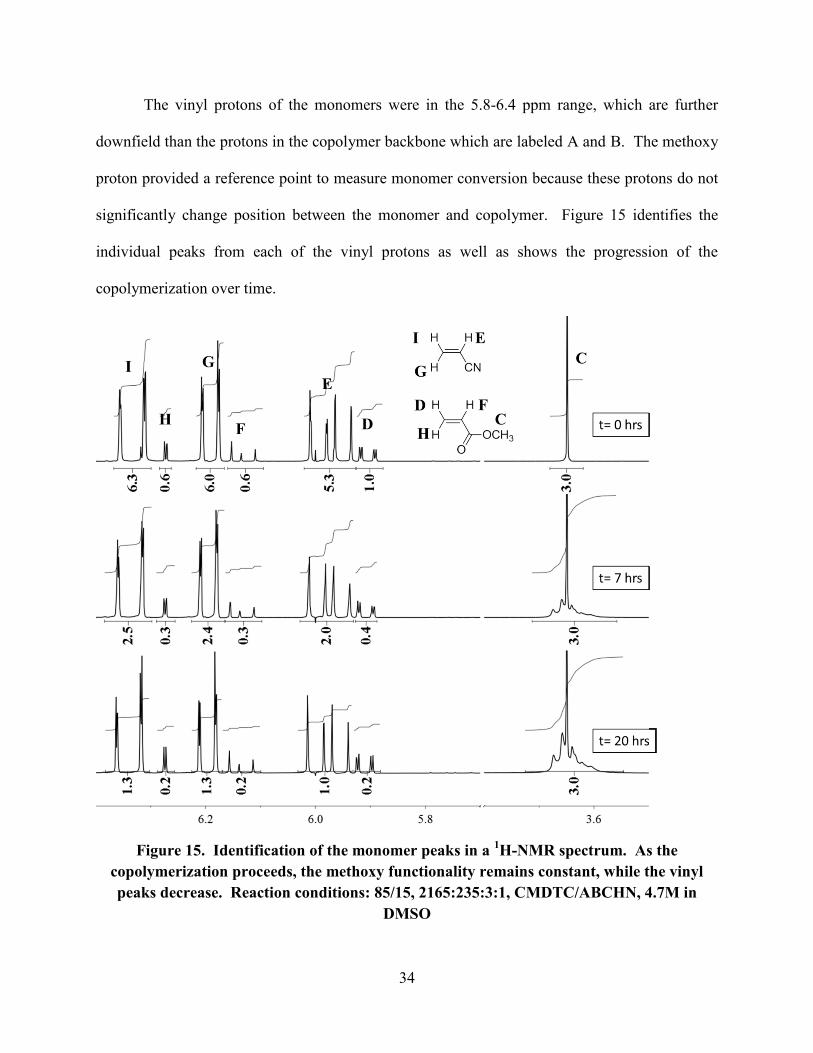
The vinyl protons of the monomers were in the 5.8-6.4 ppm range, which are further
downfield than the protons in the copolymer backbone which are labeled A and B. The methoxy
proton provided a reference point to measure monomer conversion because these protons do not
significantly change position between the monomer and copolymer. Figure 15 identifies the
individual peaks from each of the vinyl protons as well as shows the progression of the
copolymerization over time.
Figure 15. Identification of the monomer peaks in a 1H-NMR spectrum. As the
copolymerization proceeds, the methoxy functionality remains constant, while the vinyl
peaks decrease. Reaction conditions: 85/15, 2165:235:3:1, CMDTC/ABCHN, 4.7M in
DMSO
35
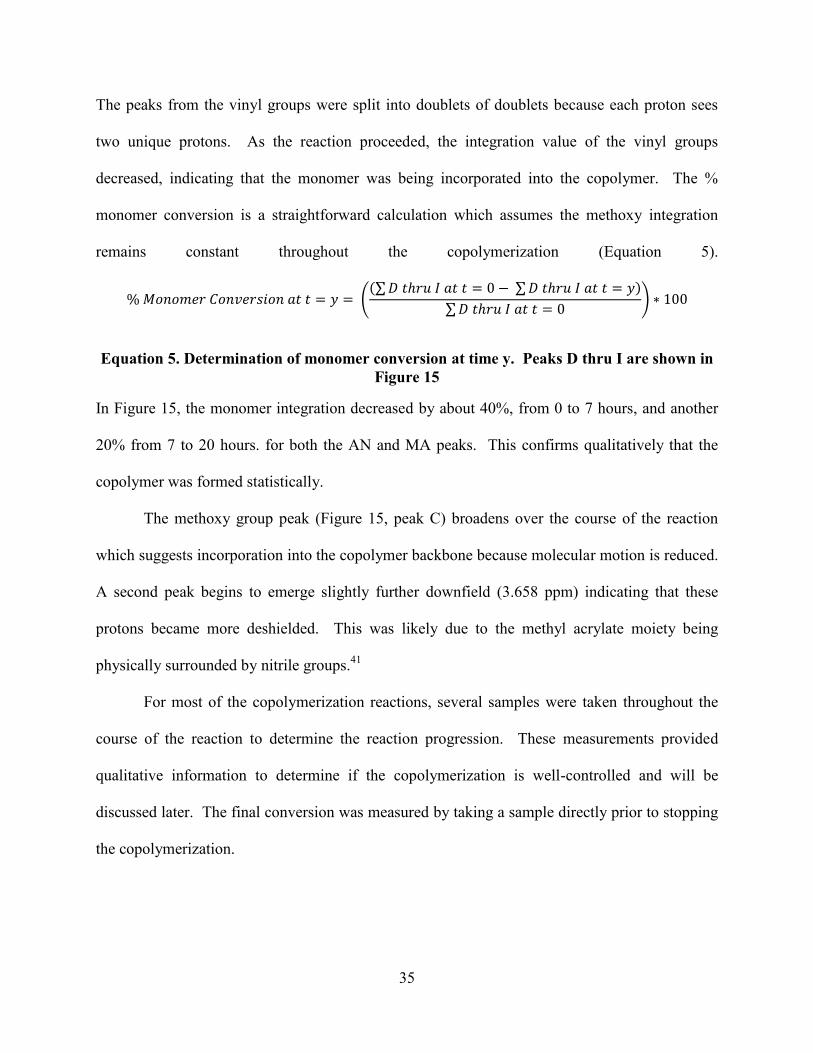
The peaks from the vinyl groups were split into doublets of doublets because each proton sees
two unique protons. As the reaction proceeded, the integration value of the vinyl groups
decreased, indicating that the monomer was being incorporated into the copolymer. The %
monomer conversion is a straightforward calculation which assumes the methoxy integration
remains constant throughout the copolymerization (Equation 5).
((∑ ∑ )
∑ )
Equation 5. Determination of monomer conversion at time y. Peaks D thru I are shown in
Figure 15
In Figure 15, the monomer integration decreased by about 40%, from 0 to 7 hours, and another
20% from 7 to 20 hours. for both the AN and MA peaks. This confirms qualitatively that the
copolymer was formed statistically.
The methoxy group peak (Figure 15, peak C) broadens over the course of the reaction
which suggests incorporation into the copolymer backbone because molecular motion is reduced.
A second peak begins to emerge slightly further downfield (3.658 ppm) indicating that these
protons became more deshielded. This was likely due to the methyl acrylate moiety being
physically surrounded by nitrile groups.41
For most of the copolymerization reactions, several samples were taken throughout the
course of the reaction to determine the reaction progression. These measurements provided
qualitative information to determine if the copolymerization is well-controlled and will be
discussed later. The final conversion was measured by taking a sample directly prior to stopping
the copolymerization.
36
Determination of End Groups and Mn using 1H-NMR
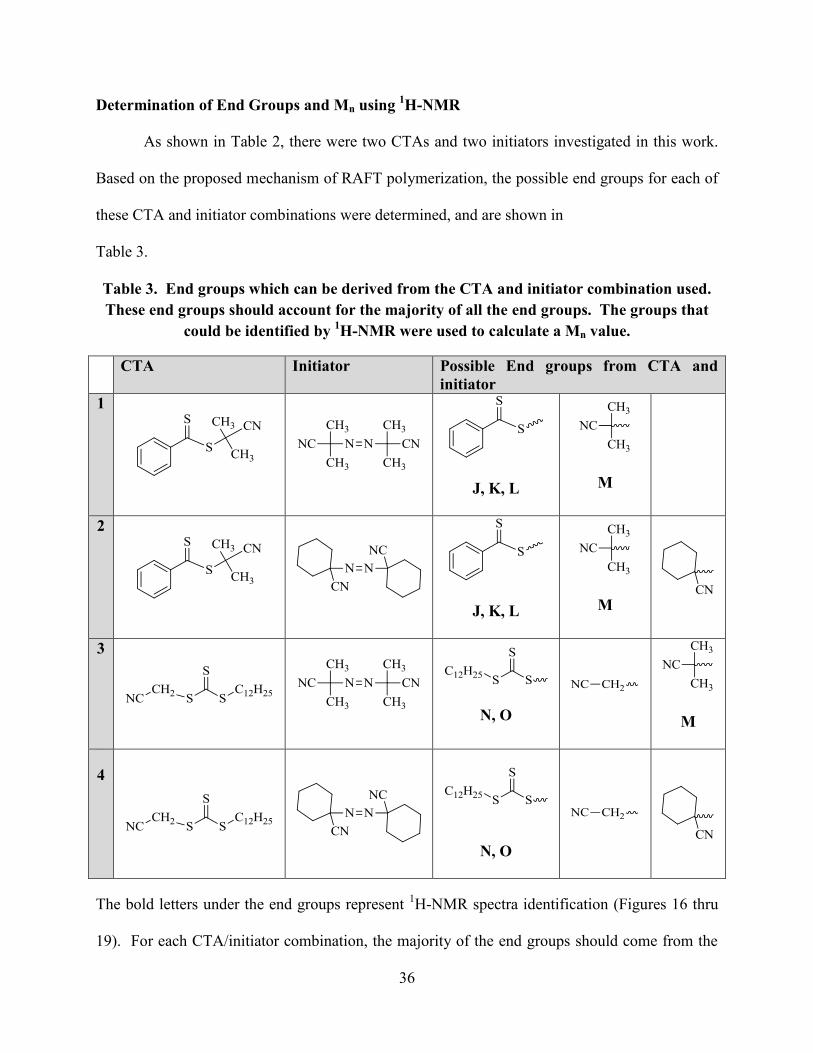
As shown in Table 2, there were two CTAs and two initiators investigated in this work.
Based on the proposed mechanism of RAFT polymerization, the possible end groups for each of
these CTA and initiator combinations were determined, and are shown in
Table 3.
Table 3. End groups which can be derived from the CTA and initiator combination used.
These end groups should account for the majority of all the end groups. The groups that
could be identified by 1H-NMR were used to calculate a Mn value.
CTA Initiator Possible End groups from CTA and
initiator
1
J, K, L
M
2
J, K, L
M
3
N, O
M
4
N, O
The bold letters under the end groups represent 1H-NMR spectra identification (Figures 16 thru
19). For each CTA/initiator combination, the majority of the end groups should come from the
37
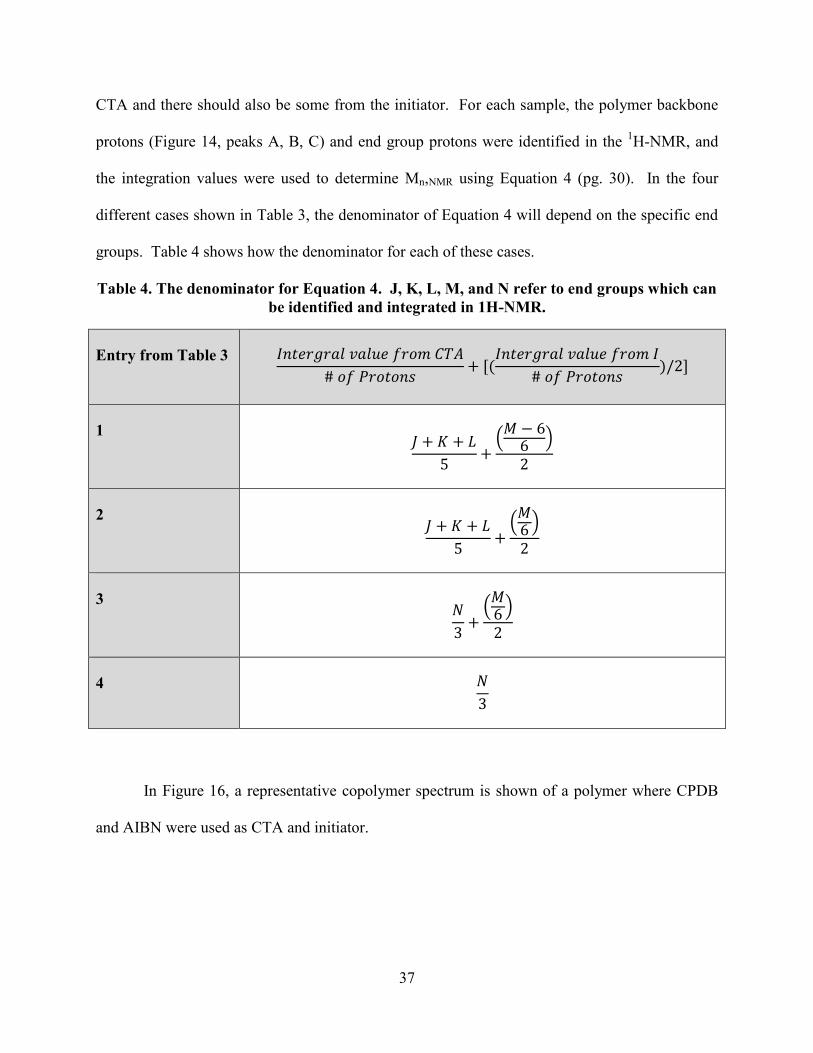
CTA and there should also be some from the initiator. For each sample, the polymer backbone
protons (Figure 14, peaks A, B, C) and end group protons were identified in the 1H-NMR, and
the integration values were used to determine Mn,NMR using Equation 4 (pg. 30). In the four
different cases shown in Table 3, the denominator of Equation 4 will depend on the specific end
groups. Table 4 shows how the denominator for each of these cases.
Table 4. The denominator for Equation 4. J, K, L, M, and N refer to end groups which can
be identified and integrated in 1H-NMR.
Entry from Table 3
(
)
1
(
)
2
( )
3
( )
4
In Figure 16, a representative copolymer spectrum is shown of a polymer where CPDB
and AIBN were used as CTA and initiator.
38
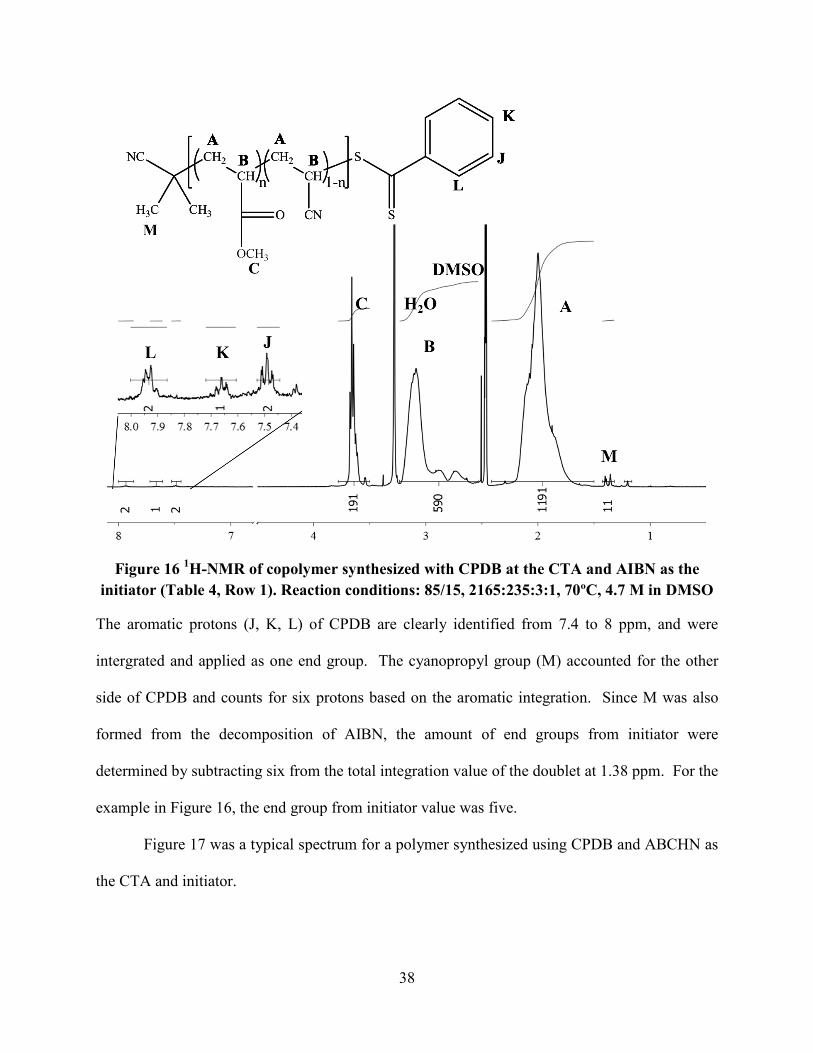
Figure 16 1H-NMR of copolymer synthesized with CPDB at the CTA and AIBN as the
initiator (Table 4, Row 1). Reaction conditions: 85/15, 2165:235:3:1, 70ºC, 4.7 M in DMSO
The aromatic protons (J, K, L) of CPDB are clearly identified from 7.4 to 8 ppm, and were
intergrated and applied as one end group. The cyanopropyl group (M) accounted for the other
side of CPDB and counts for six protons based on the aromatic integration. Since M was also
formed from the decomposition of AIBN, the amount of end groups from initiator were
determined by subtracting six from the total integration value of the doublet at 1.38 ppm. For the
example in Figure 16, the end group from initiator value was five.
Figure 17 was a typical spectrum for a polymer synthesized using CPDB and ABCHN as
the CTA and initiator.
39
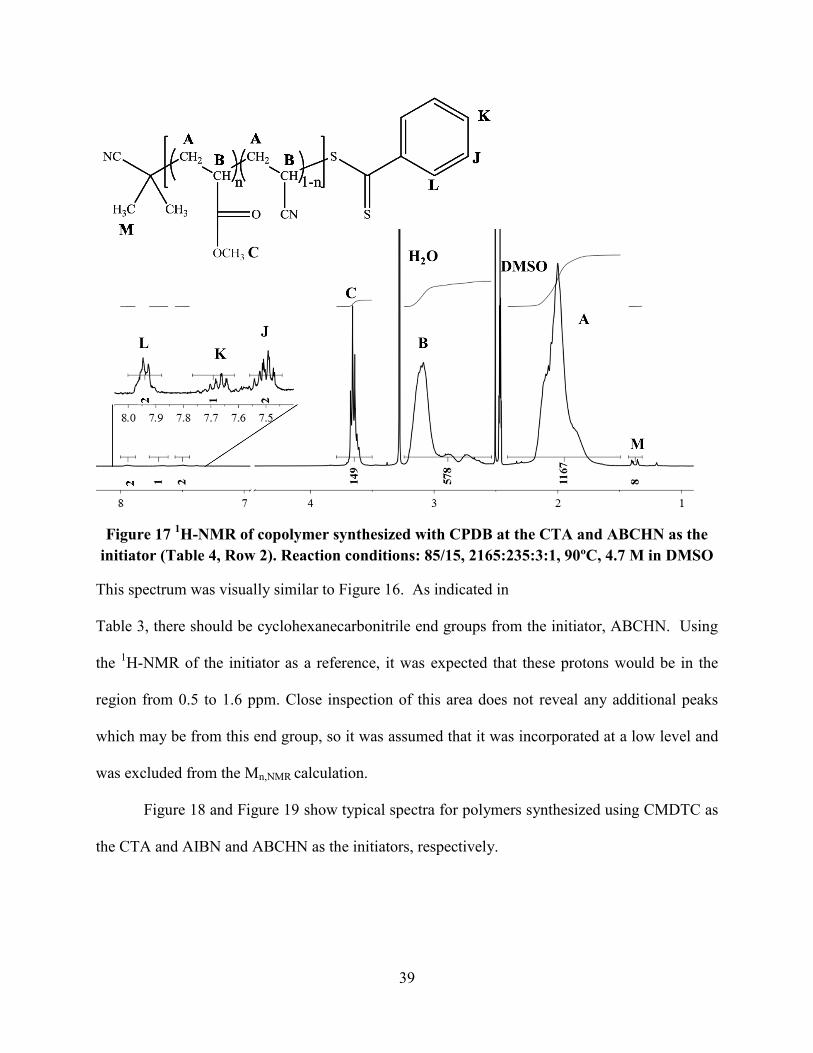
Figure 17 1H-NMR of copolymer synthesized with CPDB at the CTA and ABCHN as the
initiator (Table 4, Row 2). Reaction conditions: 85/15, 2165:235:3:1, 90ºC, 4.7 M in DMSO
This spectrum was visually similar to Figure 16. As indicated in
Table 3, there should be cyclohexanecarbonitrile end groups from the initiator, ABCHN. Using
the 1H-NMR of the initiator as a reference, it was expected that these protons would be in the
region from 0.5 to 1.6 ppm. Close inspection of this area does not reveal any additional peaks
which may be from this end group, so it was assumed that it was incorporated at a low level and
was excluded from the Mn,NMR calculation.
Figure 18 and Figure 19 show typical spectra for polymers synthesized using CMDTC as
the CTA and AIBN and ABCHN as the initiators, respectively.
40
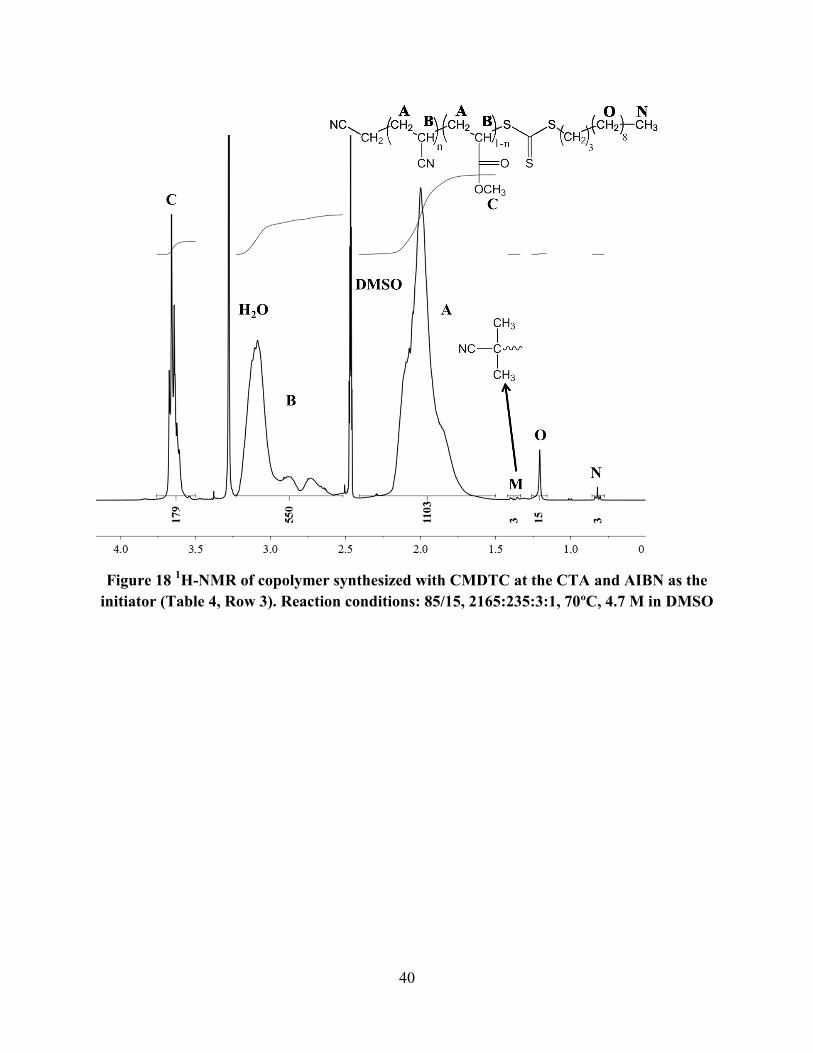
Figure 18 1H-NMR of copolymer synthesized with CMDTC at the CTA and AIBN as the
initiator (Table 4, Row 3). Reaction conditions: 85/15, 2165:235:3:1, 70ºC, 4.7 M in DMSO
41
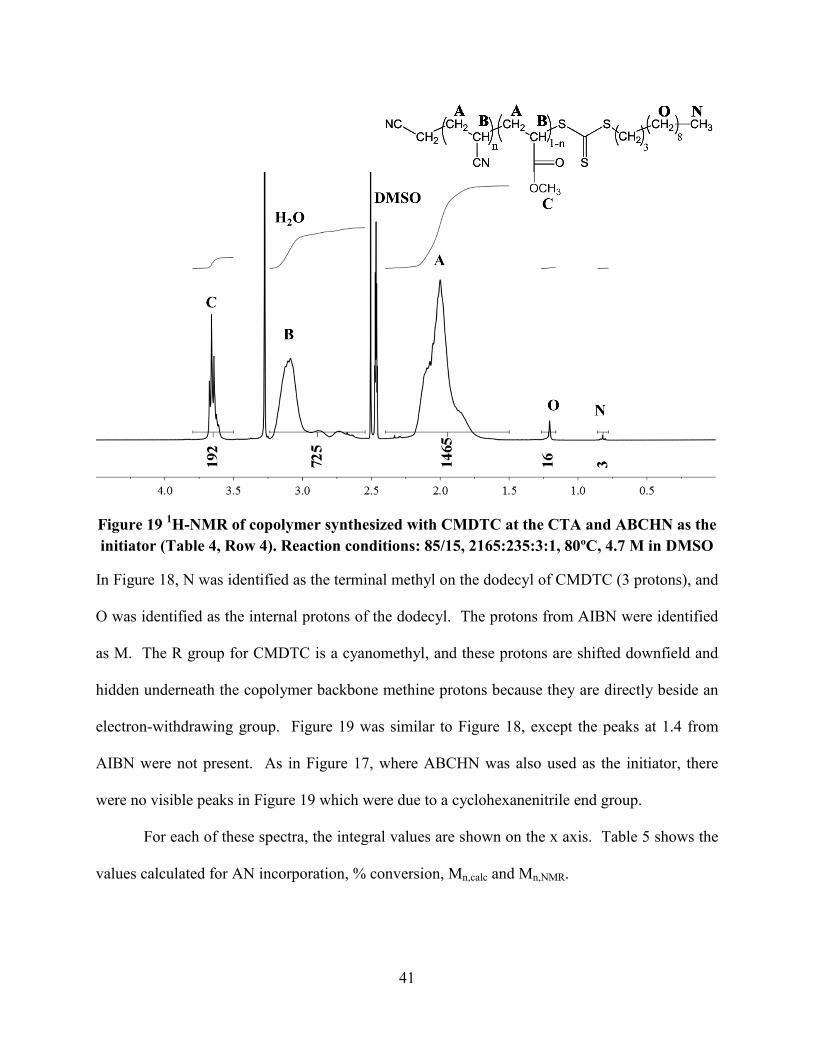
Figure 19 1H-NMR of copolymer synthesized with CMDTC at the CTA and ABCHN as the
initiator (Table 4, Row 4). Reaction conditions: 85/15, 2165:235:3:1, 80ºC, 4.7 M in DMSO
In Figure 18, N was identified as the terminal methyl on the dodecyl of CMDTC (3 protons), and
O was identified as the internal protons of the dodecyl. The protons from AIBN were identified
as M. The R group for CMDTC is a cyanomethyl, and these protons are shifted downfield and
hidden underneath the copolymer backbone methine protons because they are directly beside an
electron-withdrawing group. Figure 19 was similar to Figure 18, except the peaks at 1.4 from
AIBN were not present. As in Figure 17, where ABCHN was also used as the initiator, there
were no visible peaks in Figure 19 which were due to a cyclohexanenitrile end group.
For each of these spectra, the integral values are shown on the x axis. Table 5 shows the
values calculated for AN incorporation, % conversion, Mn,calc and Mn,NMR.
42
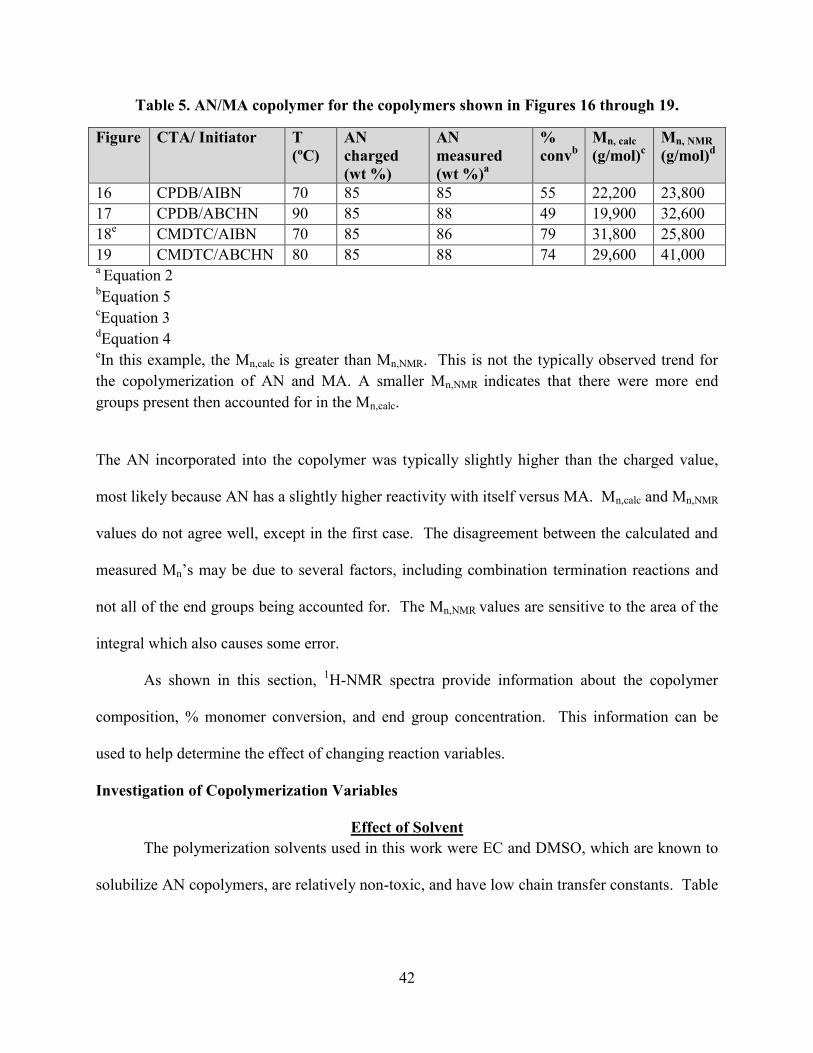
Table 5. AN/MA copolymer for the copolymers shown in Figures 16 through 19.
Figure CTA/ Initiator T
(ºC)
AN
charged
(wt %)
AN
measured
(wt %)a
%
convb
Mn, calc
(g/mol)c
Mn, NMR
(g/mol)d
16 CPDB/AIBN 70 85 85 55 22,200 23,800
17 CPDB/ABCHN 90 85 88 49 19,900 32,600
18e
CMDTC/AIBN 70 85 86 79 31,800 25,800
19 CMDTC/ABCHN 80 85 88 74 29,600 41,000 a Equation 2
bEquation 5
cEquation 3
dEquation 4
eIn this example, the Mn,calc is greater than Mn,NMR. This is not the typically observed trend for
the copolymerization of AN and MA. A smaller Mn,NMR indicates that there were more end
groups present then accounted for in the Mn,calc.
The AN incorporated into the copolymer was typically slightly higher than the charged value,
most likely because AN has a slightly higher reactivity with itself versus MA. Mn,calc and Mn,NMR
values do not agree well, except in the first case. The disagreement between the calculated and
measured Mn’s may be due to several factors, including combination termination reactions and
not all of the end groups being accounted for. The Mn,NMR values are sensitive to the area of the
integral which also causes some error.
As shown in this section, 1H-NMR spectra provide information about the copolymer
composition, % monomer conversion, and end group concentration. This information can be
used to help determine the effect of changing reaction variables.
Investigation of Copolymerization Variables
Effect of Solvent
The polymerization solvents used in this work were EC and DMSO, which are known to
solubilize AN copolymers, are relatively non-toxic, and have low chain transfer constants. Table
43
6 shows data for copolymerization using CPDB and AIBN for reactions where only the solvent
was varied.
Table 6. Solvent effect on AN/MA copolymer with CPDB.
Solvent CTA/I Temp % Conv Mn, calc Mn,NMR
EC CPDB/AIBN 70 70 28,200 32,000
DMSO CPDB/AIBN 70 55 22,200 24,000
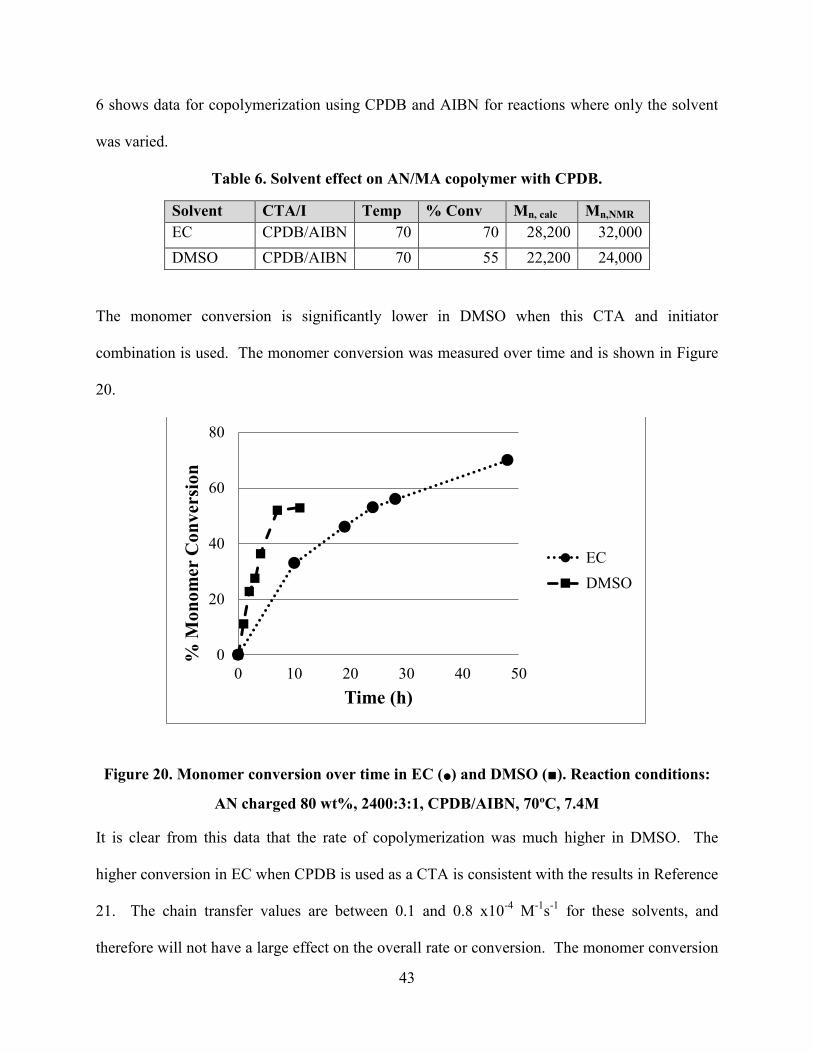
The monomer conversion is significantly lower in DMSO when this CTA and initiator
combination is used. The monomer conversion was measured over time and is shown in Figure
20.
Figure 20. Monomer conversion over time in EC (•) and DMSO (■). Reaction conditions:
AN charged 80 wt%, 2400:3:1, CPDB/AIBN, 70ºC, 7.4M
It is clear from this data that the rate of copolymerization was much higher in DMSO. The
higher conversion in EC when CPDB is used as a CTA is consistent with the results in Reference
21. The chain transfer values are between 0.1 and 0.8 x10⁻⁴
M-1
s-1
for these solvents, and
therefore will not have a large effect on the overall rate or conversion. The monomer conversion
0
20
40
60
80
0 10 20 30 40 50
% M
on
om
er C
on
ver
sio
n
Time (h)
EC
DMSO
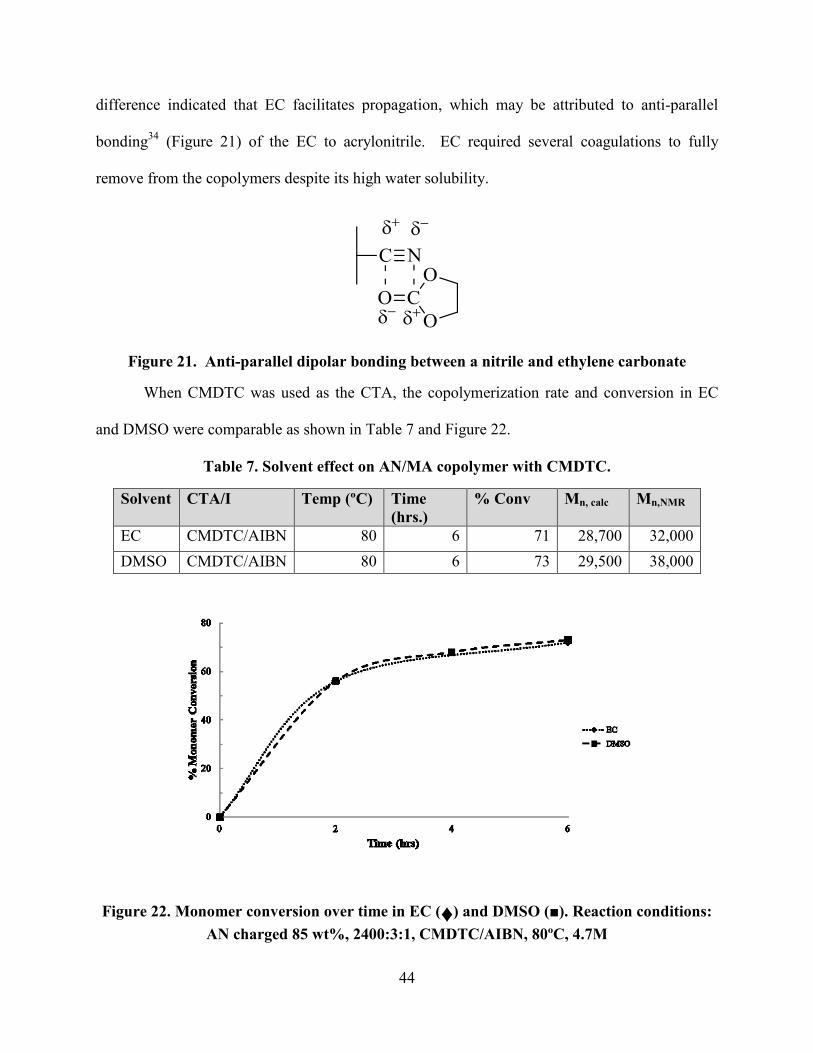
44
difference indicated that EC facilitates propagation, which may be attributed to anti-parallel
bonding34
(Figure 21) of the EC to acrylonitrile. EC required several coagulations to fully
remove from the copolymers despite its high water solubility.
Figure 21. Anti-parallel dipolar bonding between a nitrile and ethylene carbonate
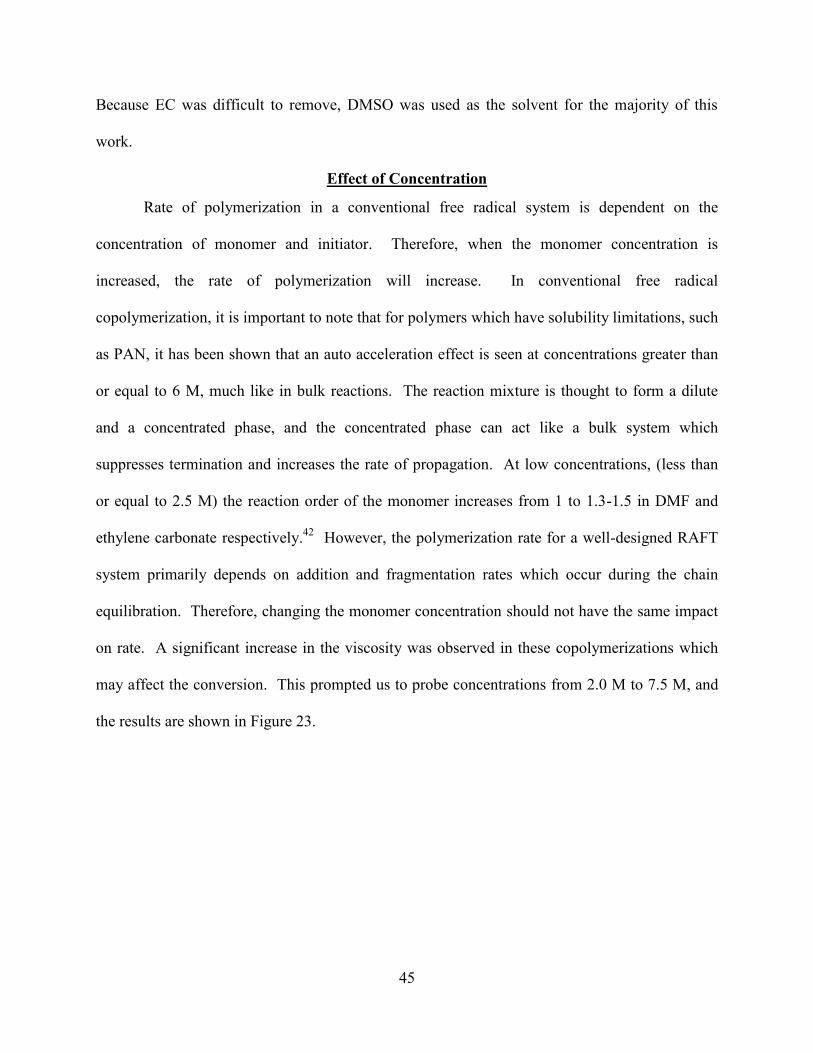
When CMDTC was used as the CTA, the copolymerization rate and conversion in EC
and DMSO were comparable as shown in Table 7 and Figure 22.
Table 7. Solvent effect on AN/MA copolymer with CMDTC.
Solvent CTA/I Temp (ºC) Time
(hrs.)
% Conv Mn, calc Mn,NMR
EC CMDTC/AIBN 80 6 71 28,700 32,000
DMSO CMDTC/AIBN 80 6 73 29,500 38,000
Figure 22. Monomer conversion over time in EC (♦) and DMSO (■). Reaction conditions:
AN charged 85 wt%, 2400:3:1, CMDTC/AIBN, 80ºC, 4.7M
45
Because EC was difficult to remove, DMSO was used as the solvent for the majority of this
work.
Effect of Concentration
Rate of polymerization in a conventional free radical system is dependent on the
concentration of monomer and initiator. Therefore, when the monomer concentration is
increased, the rate of polymerization will increase. In conventional free radical
copolymerization, it is important to note that for polymers which have solubility limitations, such
as PAN, it has been shown that an auto acceleration effect is seen at concentrations greater than
or equal to 6 M, much like in bulk reactions. The reaction mixture is thought to form a dilute
and a concentrated phase, and the concentrated phase can act like a bulk system which
suppresses termination and increases the rate of propagation. At low concentrations, (less than
or equal to 2.5 M) the reaction order of the monomer increases from 1 to 1.3-1.5 in DMF and
ethylene carbonate respectively.42
However, the polymerization rate for a well-designed RAFT
system primarily depends on addition and fragmentation rates which occur during the chain
equilibration. Therefore, changing the monomer concentration should not have the same impact
on rate. A significant increase in the viscosity was observed in these copolymerizations which
may affect the conversion. This prompted us to probe concentrations from 2.0 M to 7.5 M, and
the results are shown in Figure 23.
46
Figure 23. Measured maximum monomer conversion at different monomer concentrations.
TCC/AIBN/80ºC in DMSO. Reactions were terminated after a maximum conversion was
reached.
These data indicate that a moderate concentration allows for higher conversions, and that at
dilute and high concentrations the conversion is reduced. The reduced conversion at higher
concentrations may be partially explained by a large increase in the solution viscosity. The
reduced conversion at the lower concentrations may be due to an increase in the radicals from
initiator recombining. 42
Effect of Initiator and Temperature
In RAFT polymerization, use of a small amount of initiator is necessary to begin chain
growth. These chains react with the chain transfer agent, and β-elimination provides more
radicals (see Figure 6, pg. 11). It is useful to select an initiator with a 10 hr. half-life (t1/2) near
the reaction temperature to ensure radicals are generated at a modest rate throughout the reaction.
The t1/2, of initiators indicates the amount of time it takes 50% of the initiator to decompose at
that temperature. If initiators are used at higher temperatures, the initiator decomposes faster,
increasing the concentration of radicals. This is an important fact to remember for RAFT
2 M 2.5 M 4.7 M 5.6 M 7.4 M
% Conversion 53 54 73 71 58
0
20
40
60
80
% C
on
ver
sion
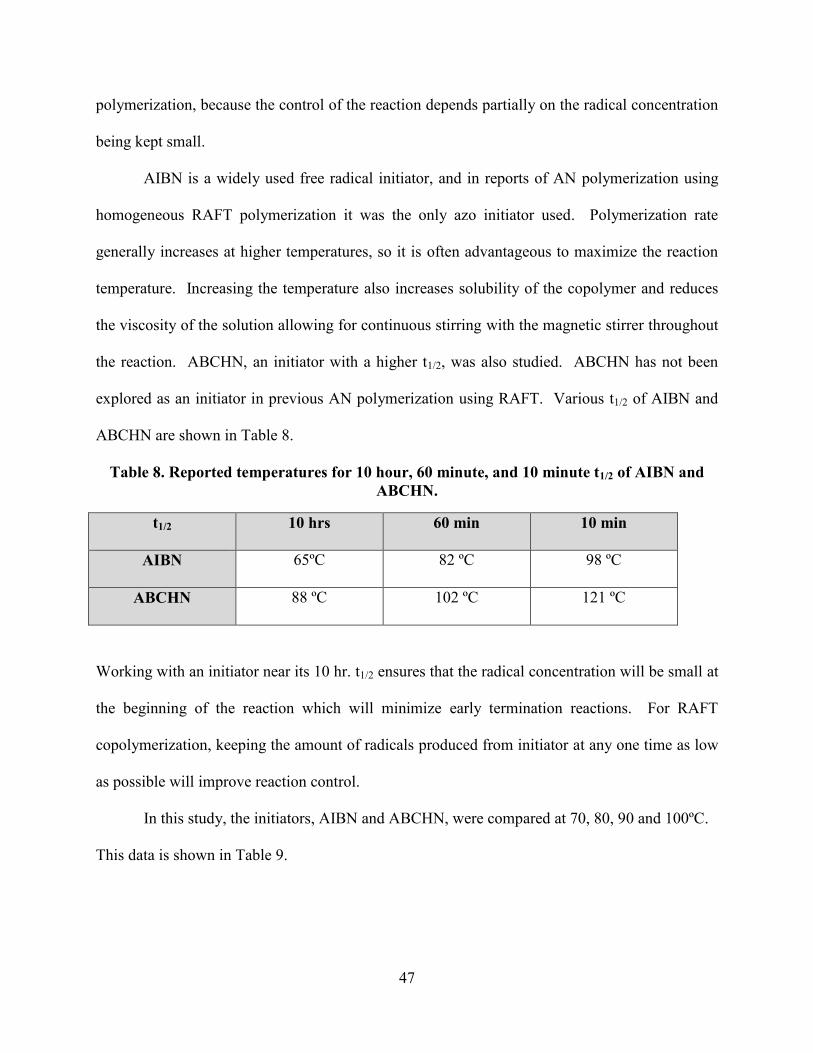
47
polymerization, because the control of the reaction depends partially on the radical concentration
being kept small.
AIBN is a widely used free radical initiator, and in reports of AN polymerization using
homogeneous RAFT polymerization it was the only azo initiator used. Polymerization rate
generally increases at higher temperatures, so it is often advantageous to maximize the reaction
temperature. Increasing the temperature also increases solubility of the copolymer and reduces
the viscosity of the solution allowing for continuous stirring with the magnetic stirrer throughout
the reaction. ABCHN, an initiator with a higher t1/2, was also studied. ABCHN has not been
explored as an initiator in previous AN polymerization using RAFT. Various t1/2 of AIBN and
ABCHN are shown in Table 8.
Table 8. Reported temperatures for 10 hour, 60 minute, and 10 minute t1/2 of AIBN and
ABCHN.
t1/2 10 hrs 60 min 10 min
AIBN 65ºC 82 ºC 98 ºC
ABCHN 88 ºC 102 ºC 121 ºC
Working with an initiator near its 10 hr. t1/2 ensures that the radical concentration will be small at
the beginning of the reaction which will minimize early termination reactions. For RAFT
copolymerization, keeping the amount of radicals produced from initiator at any one time as low
as possible will improve reaction control.
In this study, the initiators, AIBN and ABCHN, were compared at 70, 80, 90 and 100ºC.
This data is shown in Table 9.
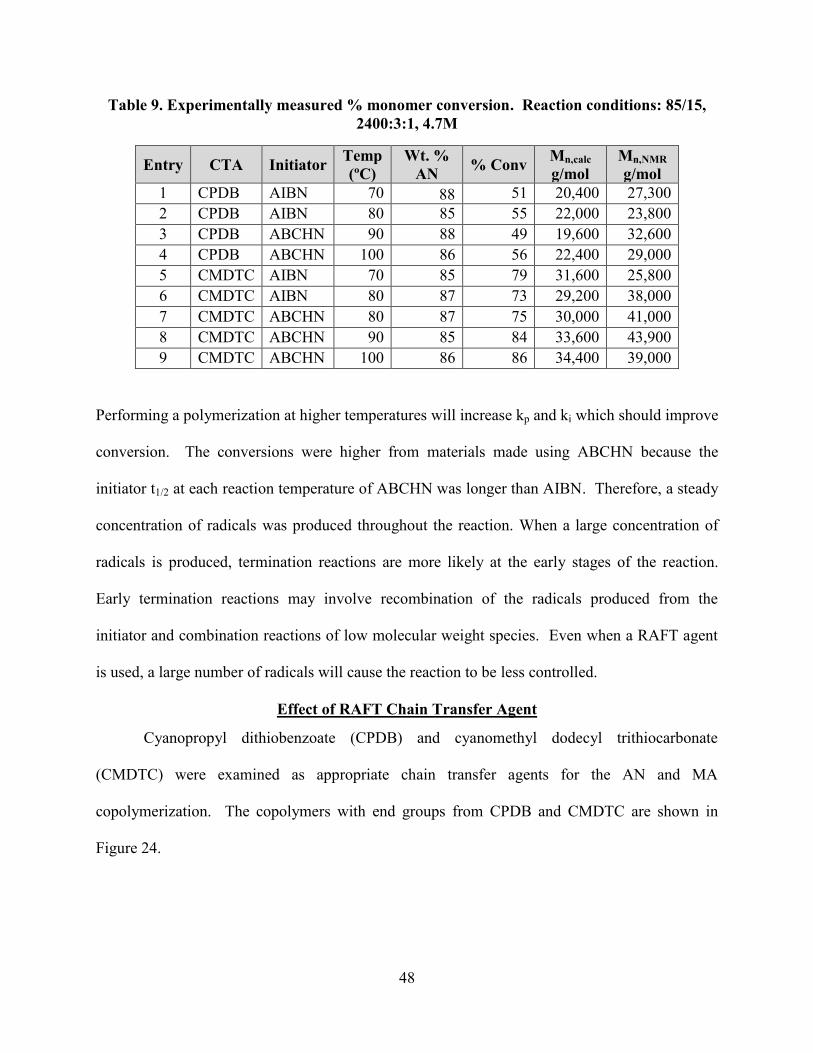
48
Table 9. Experimentally measured % monomer conversion. Reaction conditions: 85/15,
2400:3:1, 4.7M
Entry CTA Initiator Temp
(ºC)
Wt. %
AN % Conv
Mn,calc
g/mol
Mn,NMR
g/mol
1 CPDB AIBN 70 88
51 20,400 27,300
2 CPDB AIBN 80 85 55 22,000 23,800
3 CPDB ABCHN 90 88 49 19,600 32,600
4 CPDB ABCHN 100 86 56 22,400 29,000
5 CMDTC AIBN 70 85 79 31,600 25,800
6 CMDTC AIBN 80 87 73 29,200 38,000
7 CMDTC ABCHN 80 87 75 30,000 41,000
8 CMDTC ABCHN 90 85 84 33,600 43,900
9 CMDTC ABCHN 100 86 86 34,400 39,000
Performing a polymerization at higher temperatures will increase kp and ki which should improve
conversion. The conversions were higher from materials made using ABCHN because the
initiator t1/2 at each reaction temperature of ABCHN was longer than AIBN. Therefore, a steady
concentration of radicals was produced throughout the reaction. When a large concentration of
radicals is produced, termination reactions are more likely at the early stages of the reaction.
Early termination reactions may involve recombination of the radicals produced from the
initiator and combination reactions of low molecular weight species. Even when a RAFT agent
is used, a large number of radicals will cause the reaction to be less controlled.
Effect of RAFT Chain Transfer Agent
Cyanopropyl dithiobenzoate (CPDB) and cyanomethyl dodecyl trithiocarbonate
(CMDTC) were examined as appropriate chain transfer agents for the AN and MA
copolymerization. The copolymers with end groups from CPDB and CMDTC are shown in
Figure 24.
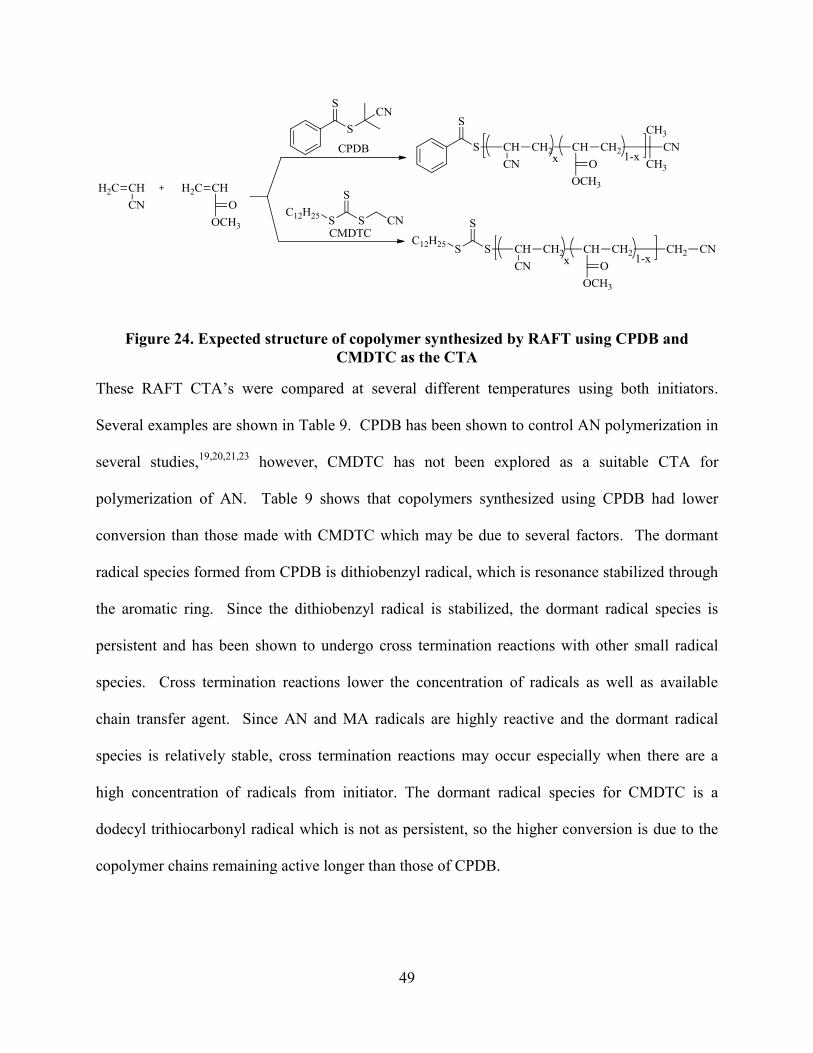
49
Figure 24. Expected structure of copolymer synthesized by RAFT using CPDB and
CMDTC as the CTA
These RAFT CTA’s were compared at several different temperatures using both initiators.
Several examples are shown in Table 9. CPDB has been shown to control AN polymerization in
several studies,19,20,21,23
however, CMDTC has not been explored as a suitable CTA for
polymerization of AN. Table 9 shows that copolymers synthesized using CPDB had lower
conversion than those made with CMDTC which may be due to several factors. The dormant
radical species formed from CPDB is dithiobenzyl radical, which is resonance stabilized through
the aromatic ring. Since the dithiobenzyl radical is stabilized, the dormant radical species is
persistent and has been shown to undergo cross termination reactions with other small radical
species. Cross termination reactions lower the concentration of radicals as well as available
chain transfer agent. Since AN and MA radicals are highly reactive and the dormant radical
species is relatively stable, cross termination reactions may occur especially when there are a
high concentration of radicals from initiator. The dormant radical species for CMDTC is a
dodecyl trithiocarbonyl radical which is not as persistent, so the higher conversion is due to the
copolymer chains remaining active longer than those of CPDB.
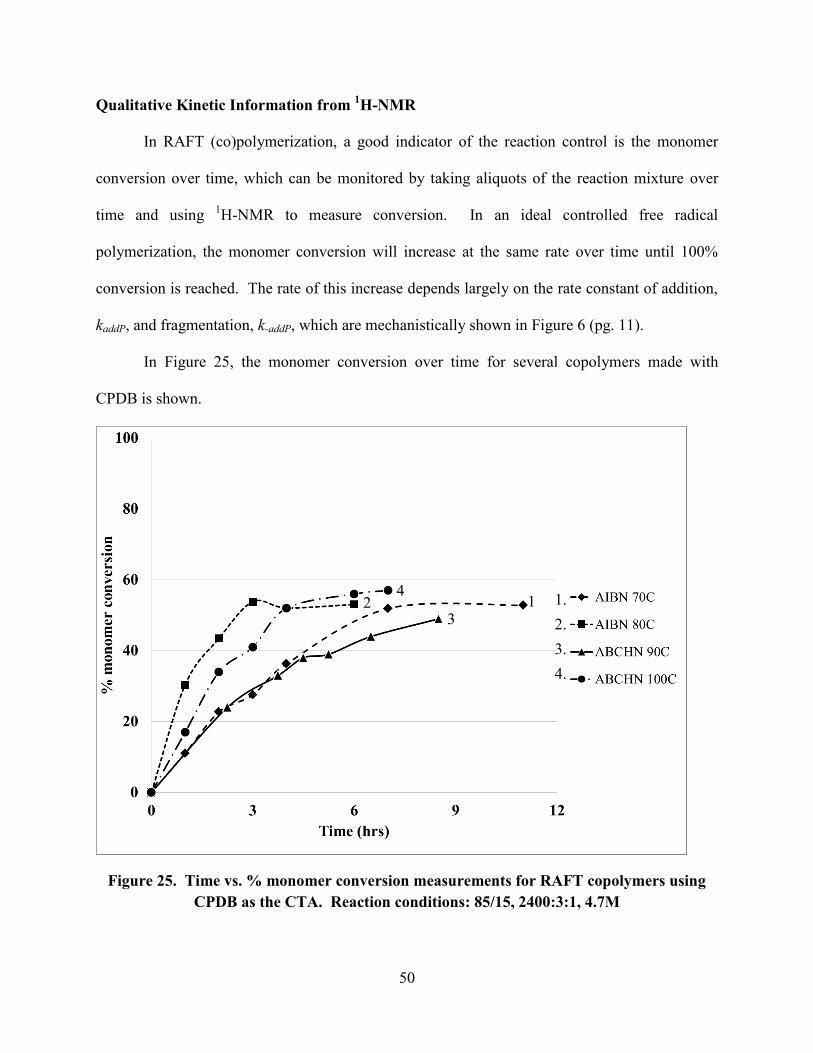
50
Qualitative Kinetic Information from 1H-NMR
In RAFT (co)polymerization, a good indicator of the reaction control is the monomer
conversion over time, which can be monitored by taking aliquots of the reaction mixture over
time and using 1H-NMR to measure conversion. In an ideal controlled free radical
polymerization, the monomer conversion will increase at the same rate over time until 100%
conversion is reached. The rate of this increase depends largely on the rate constant of addition,
kaddP, and fragmentation, k-addP, which are mechanistically shown in Figure 6 (pg. 11).
In Figure 25, the monomer conversion over time for several copolymers made with
CPDB is shown.
Figure 25. Time vs. % monomer conversion measurements for RAFT copolymers using
CPDB as the CTA. Reaction conditions: 85/15, 2400:3:1, 4.7M
1.
2.
3.
4.
1 2 3
4
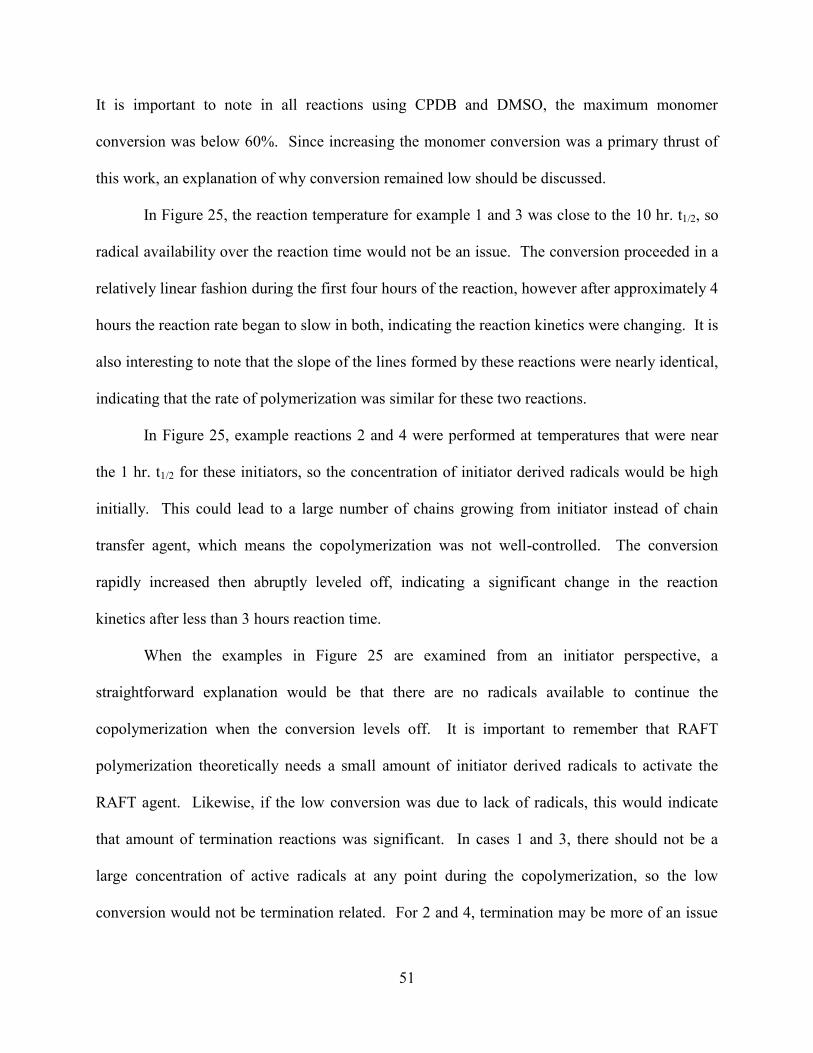
51
It is important to note in all reactions using CPDB and DMSO, the maximum monomer
conversion was below 60%. Since increasing the monomer conversion was a primary thrust of
this work, an explanation of why conversion remained low should be discussed.
In Figure 25, the reaction temperature for example 1 and 3 was close to the 10 hr. t1/2, so
radical availability over the reaction time would not be an issue. The conversion proceeded in a
relatively linear fashion during the first four hours of the reaction, however after approximately 4
hours the reaction rate began to slow in both, indicating the reaction kinetics were changing. It is
also interesting to note that the slope of the lines formed by these reactions were nearly identical,
indicating that the rate of polymerization was similar for these two reactions.
In Figure 25, example reactions 2 and 4 were performed at temperatures that were near
the 1 hr. t1/2 for these initiators, so the concentration of initiator derived radicals would be high
initially. This could lead to a large number of chains growing from initiator instead of chain
transfer agent, which means the copolymerization was not well-controlled. The conversion
rapidly increased then abruptly leveled off, indicating a significant change in the reaction
kinetics after less than 3 hours reaction time.
When the examples in Figure 25 are examined from an initiator perspective, a
straightforward explanation would be that there are no radicals available to continue the
copolymerization when the conversion levels off. It is important to remember that RAFT
polymerization theoretically needs a small amount of initiator derived radicals to activate the
RAFT agent. Likewise, if the low conversion was due to lack of radicals, this would indicate
that amount of termination reactions was significant. In cases 1 and 3, there should not be a
large concentration of active radicals at any point during the copolymerization, so the low
conversion would not be termination related. For 2 and 4, termination may be more of an issue
52
because of high radical concentrations. The chromatograms from SEC may be able to provide
insight if termination by combination is an issue since the materials will be higher molecular
weight, and this will be discussed later.
From a CTA perspective, the dormant radical of CPDB is a dithiobenzoate radical which
is highly resonance stabilized leading to a long lifetime due to a high kaddP compared to k-addP.
The long lifetime of the radical makes it prone to cross-termination reactions with other small
radical species (see Figure 8, pg. 14), causing retardation at the beginning of the
copolymerization which reduces the amount of RAFT agent and radicals. Radicals produced
from initiator throughout the reaction may react with the dormant radical species causing cross
termination and reaction slowing.
A third possibility for the reduced conversion with the use of the CPDB CTA is that the
active radical species did not persist for long enough to add another monomer especially as the
monomer concentration decreased and solution viscosity increased. This seems to be the most
logical explanation because the conversion slows gradually with a relatively large amount of
monomer remaining.
A reaction between CPDB and ABCHN at 80ºC failed to produce copolymer. At 80ºC,
this initiator is below its 10 hr. t1/2. This shows that kd of ABCHN at 80ºC does not produce
enough radicals to overcome retardation and begin propagation.
Figure 26 shows % monomer conversion vs. time when CMDTC is used as the RAFT
CTA.
53
Figure 26. Time vs. % monomer conversion measurements for RAFT copolymers using
CMDTC as the CTA. Reaction conditions: 85/15, 2400:3:1, 4.7 M
Monomer conversions of over 80% can be reached using CMDTC, however slowing or stopping
of the monomer conversion is still observed which is undesirable if 100% conversion is to be
reached. In Figure 26, example reactions 1, 3, and 4 were all performed at temperatures at or
below the 10 hr. t1/2 of the initiator. Examples 1 and 3 showed linear growth over time as
expected from the RAFT mechanism, but 4 grew quickly over a short time period. The fast
growth does not necessarily mean it was not controlled, but it speaks to the rapid kp of AN and
MA. At this temperature, the kp and ktr values may not be well balanced and propagation is
favored over equilibration despite a low radical concentration. In Figure 26, examples 2 and 5
were performed at temperatures near the 1 hr. t1/2, and as discussed previously it is not surprising
that the conversion is fast in these cases.
1.
2.
3.
4.
5.
1
2
3
4
5
54
Based on this data it is unknown what the most likely explanation is for the slowing of
the monomer conversion in the reactions which appear to be controlled, 1 and 3 (Figure 26). As
with CPDB, it again may be explained best by the active chains not persisting long enough to
continue propagation. The monomer conversion was higher than copolymers made with CPDB
because the kaddP is slower, so the copolymer chains were active for longer allowing for
propagation to continue for longer but high solution viscosity and decreasing monomer
concentration may stop the copolymerization.
The highest percent monomer conversion reached in this work was 86%, using CMDTC
and ABCHN at 100ºC. Monomer conversions up to 86.3%33
have been reported in the published
literature for an AN homopolymers synthesized by RAFT. However, incorporation of 5% MA as
a comonomer caused a reduced monomer conversion from 73.5% (AN homopolymer) to 46.3%
when the CPDB and AIBN were used as the CTA and initiator.21
Use of CMDTC and ABCHN
provides a much improved monomer conversion for this copolymerization.
Molecular weight determination
The viscosity of a polymer solution can be related to its viscosity molecular weight (Mv)
using the Mark-Houwink-Sakurada equation (Equation 6).
Equation 6. Mark-Houwink-Sakurada equation
where [η] is the intrinsic viscosity, and K and a are constants which depend on the polymer,
solvent and temperature. [η] is defined as the viscosity of the polymer in solution as it
approaches zero concentration. This is measured by extrapolation of the inherent and reduced
viscosities to zero concentration. The inherent and reduced viscosities are measured at several
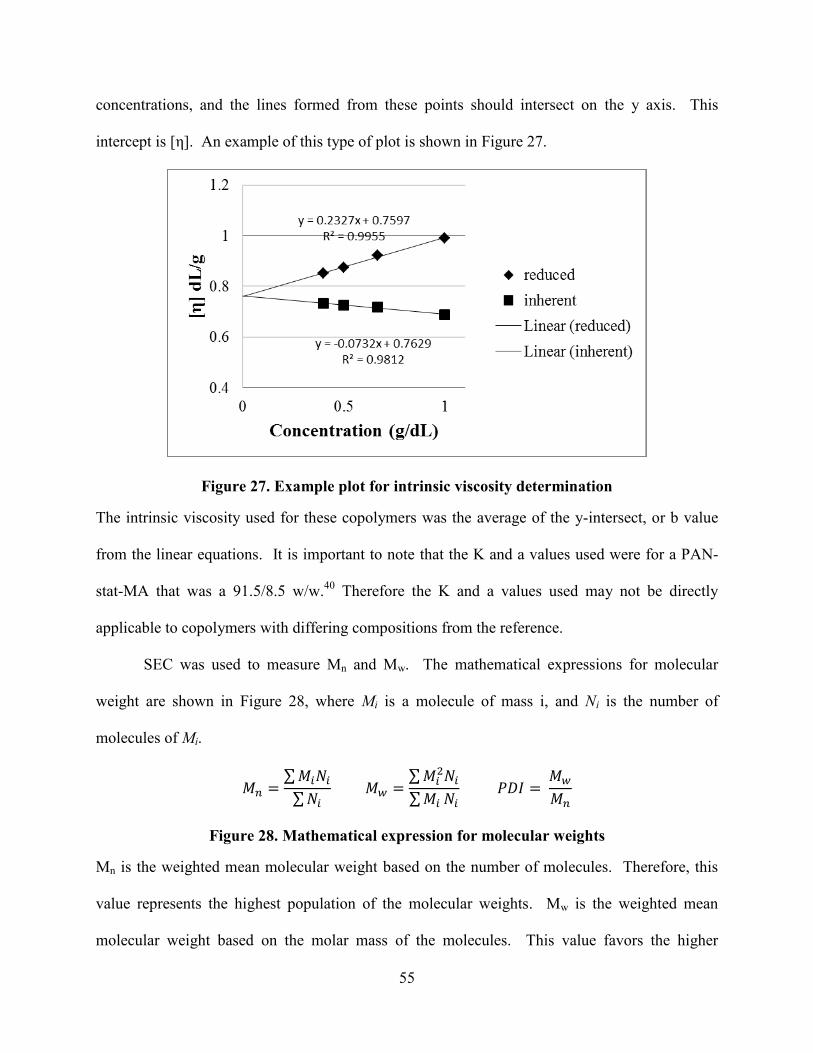
55
concentrations, and the lines formed from these points should intersect on the y axis. This
intercept is [η]. An example of this type of plot is shown in Figure 27.
Figure 27. Example plot for intrinsic viscosity determination
The intrinsic viscosity used for these copolymers was the average of the y-intersect, or b value
from the linear equations. It is important to note that the K and a values used were for a PAN-
stat-MA that was a 91.5/8.5 w/w.40
Therefore the K and a values used may not be directly
applicable to copolymers with differing compositions from the reference.
SEC was used to measure Mn and Mw. The mathematical expressions for molecular
weight are shown in Figure 28, where Mi is a molecule of mass i, and Ni is the number of
molecules of Mi.
∑
∑
∑
∑
Figure 28. Mathematical expression for molecular weights
Mn is the weighted mean molecular weight based on the number of molecules. Therefore, this
value represents the highest population of the molecular weights. Mw is the weighted mean
molecular weight based on the molar mass of the molecules. This value favors the higher
56
molecular weights. The PDI, or polydispersity, is a measure of the distribution of molecular
weights, and a value of 1 indicates that all the polymer chains are equal in length.
The stationary phase used in SEC is made of beads with different pore sizes. The pores
in the beads allow for separation of polymer molecules based on their hydrodynamic volume,
with higher molecular weights eluting first because they cannot penetrate into the pores of the
beads. As the polymer elutes, the molecular weight fractions flow through different detectors
which provide some information which can be used to determine molecular weight. For these
copolymers, three detectors were used, a refractive index (RI) detector, a viscosity detector, and
a light scattering (LS) detector. The RI detector measures the change in the refractive index
compared to that of the solvent. The viscosity detector provides information about the
concentration. The light scattering detector measures the scatter of polymer in solution vs. that
of the solvent.
For these copolymers, two different methods were used for molecular weight
measurement, universal calibration and light scattering. Based on narrow molecular weight
distribution polystyrene standards of known molecular weights, a universal calibration curve was
used to calculate Mn, Mw and PDI. The light scattering detector was used to measure the
absolute Mw based on a dn/dc value (the change in refractive index as the concentration changes)
of 0.0500.
Figure 29 shows the molecular weight data and chromatograms from SEC for PAN-co-
MA in which the chain transfer agent was varied.
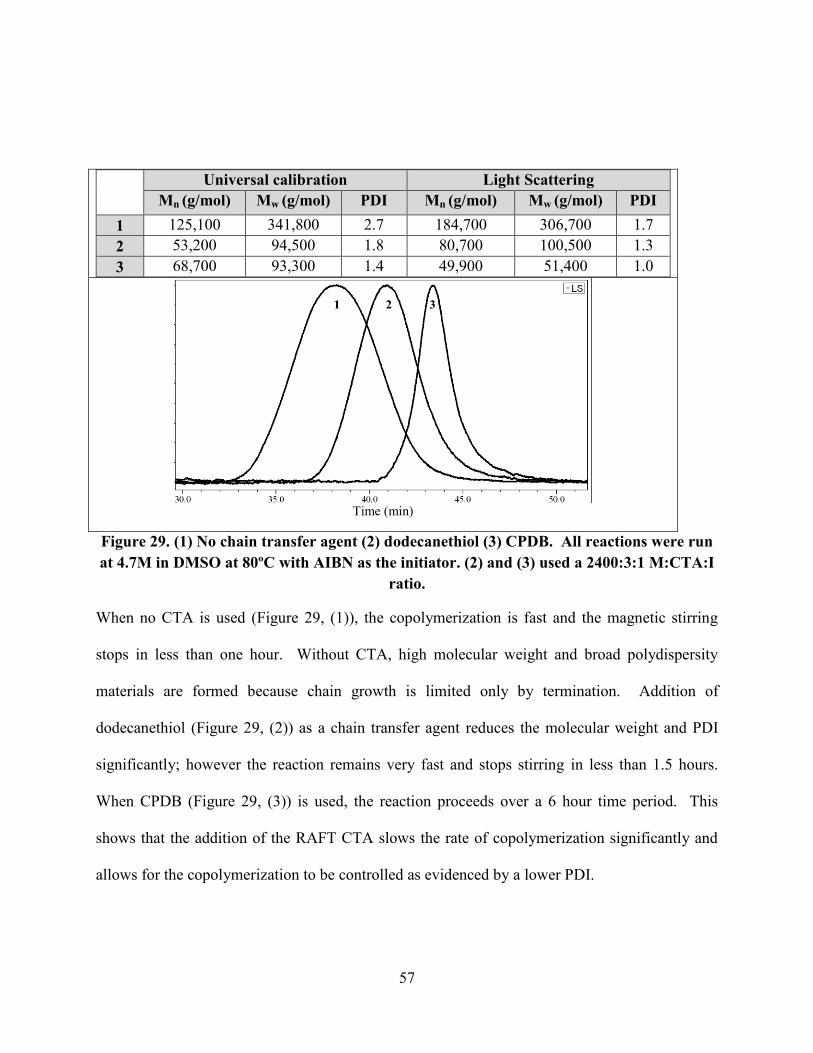
57
Universal calibration Light Scattering
Mn (g/mol) Mw (g/mol) PDI Mn (g/mol) Mw (g/mol) PDI
1 125,100 341,800 2.7 184,700 306,700 1.7
2 53,200 94,500 1.8 80,700 100,500 1.3
3 68,700 93,300 1.4 49,900 51,400 1.0
Time (min)
Figure 29. (1) No chain transfer agent (2) dodecanethiol (3) CPDB. All reactions were run
at 4.7M in DMSO at 80ºC with AIBN as the initiator. (2) and (3) used a 2400:3:1 M:CTA:I
ratio.
When no CTA is used (Figure 29, (1)), the copolymerization is fast and the magnetic stirring
stops in less than one hour. Without CTA, high molecular weight and broad polydispersity
materials are formed because chain growth is limited only by termination. Addition of
dodecanethiol (Figure 29, (2)) as a chain transfer agent reduces the molecular weight and PDI
significantly; however the reaction remains very fast and stops stirring in less than 1.5 hours.
When CPDB (Figure 29, (3)) is used, the reaction proceeds over a 6 hour time period. This
shows that the addition of the RAFT CTA slows the rate of copolymerization significantly and
allows for the copolymerization to be controlled as evidenced by a lower PDI.
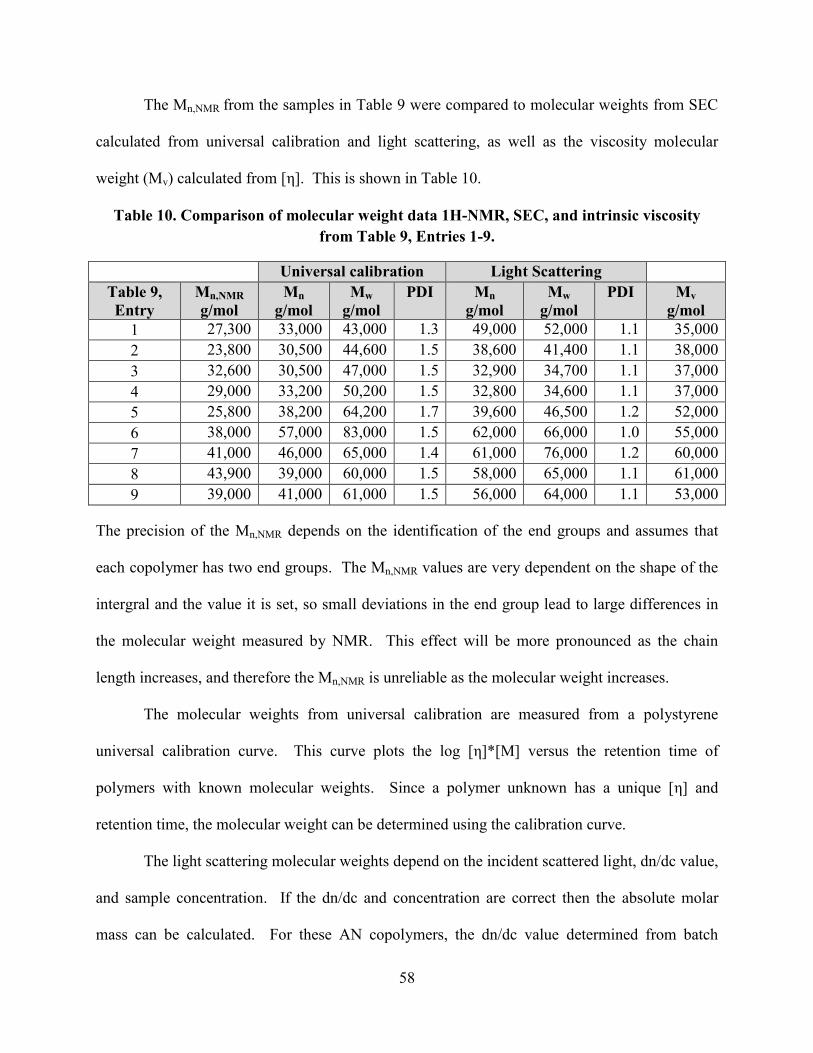
58
The Mn,NMR from the samples in Table 9 were compared to molecular weights from SEC
calculated from universal calibration and light scattering, as well as the viscosity molecular
weight (Mv) calculated from [η]. This is shown in Table 10.
Table 10. Comparison of molecular weight data 1H-NMR, SEC, and intrinsic viscosity
from Table 9, Entries 1-9.
Universal calibration Light Scattering
Table 9,
Entry
Mn,NMR
g/mol
Mn
g/mol
Mw
g/mol
PDI Mn
g/mol
Mw
g/mol
PDI
Mv
g/mol
1 27,300 33,000 43,000 1.3 49,000 52,000 1.1 35,000
2 23,800 30,500 44,600 1.5 38,600 41,400 1.1 38,000
3 32,600 30,500 47,000 1.5 32,900 34,700 1.1 37,000
4 29,000 33,200 50,200 1.5 32,800 34,600 1.1 37,000
5 25,800 38,200 64,200 1.7 39,600 46,500 1.2 52,000
6 38,000 57,000 83,000 1.5 62,000 66,000 1.0 55,000
7 41,000 46,000 65,000 1.4 61,000 76,000 1.2 60,000
8 43,900 39,000 60,000 1.5 58,000 65,000 1.1 61,000
9 39,000 41,000 61,000 1.5 56,000 64,000 1.1 53,000
The precision of the Mn,NMR depends on the identification of the end groups and assumes that
each copolymer has two end groups. The Mn,NMR values are very dependent on the shape of the
intergral and the value it is set, so small deviations in the end group lead to large differences in
the molecular weight measured by NMR. This effect will be more pronounced as the chain
length increases, and therefore the Mn,NMR is unreliable as the molecular weight increases.
The molecular weights from universal calibration are measured from a polystyrene
universal calibration curve. This curve plots the log [η]*[M] versus the retention time of
polymers with known molecular weights. Since a polymer unknown has a unique [η] and
retention time, the molecular weight can be determined using the calibration curve.
The light scattering molecular weights depend on the incident scattered light, dn/dc value,
and sample concentration. If the dn/dc and concentration are correct then the absolute molar
mass can be calculated. For these AN copolymers, the dn/dc value determined from batch
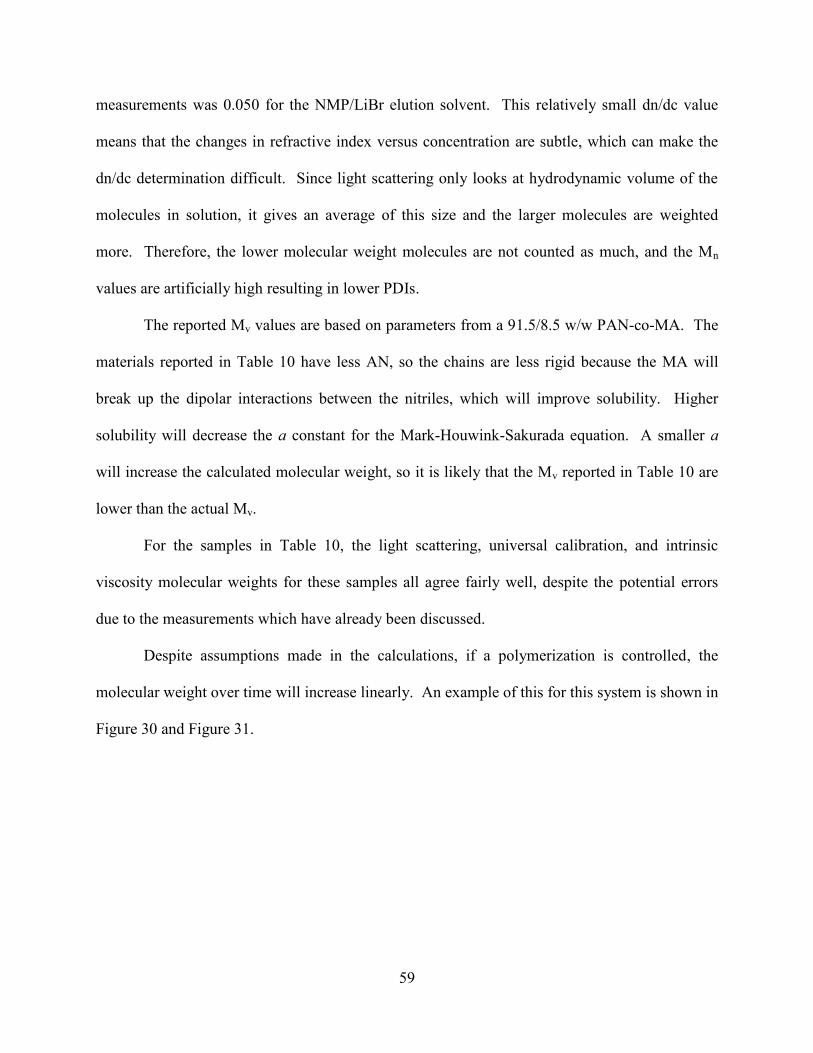
59
measurements was 0.050 for the NMP/LiBr elution solvent. This relatively small dn/dc value
means that the changes in refractive index versus concentration are subtle, which can make the
dn/dc determination difficult. Since light scattering only looks at hydrodynamic volume of the
molecules in solution, it gives an average of this size and the larger molecules are weighted
more. Therefore, the lower molecular weight molecules are not counted as much, and the Mn
values are artificially high resulting in lower PDIs.
The reported Mv values are based on parameters from a 91.5/8.5 w/w PAN-co-MA. The
materials reported in Table 10 have less AN, so the chains are less rigid because the MA will
break up the dipolar interactions between the nitriles, which will improve solubility. Higher
solubility will decrease the a constant for the Mark-Houwink-Sakurada equation. A smaller a
will increase the calculated molecular weight, so it is likely that the Mv reported in Table 10 are
lower than the actual Mv.
For the samples in Table 10, the light scattering, universal calibration, and intrinsic
viscosity molecular weights for these samples all agree fairly well, despite the potential errors
due to the measurements which have already been discussed.
Despite assumptions made in the calculations, if a polymerization is controlled, the
molecular weight over time will increase linearly. An example of this for this system is shown in
Figure 30 and Figure 31.
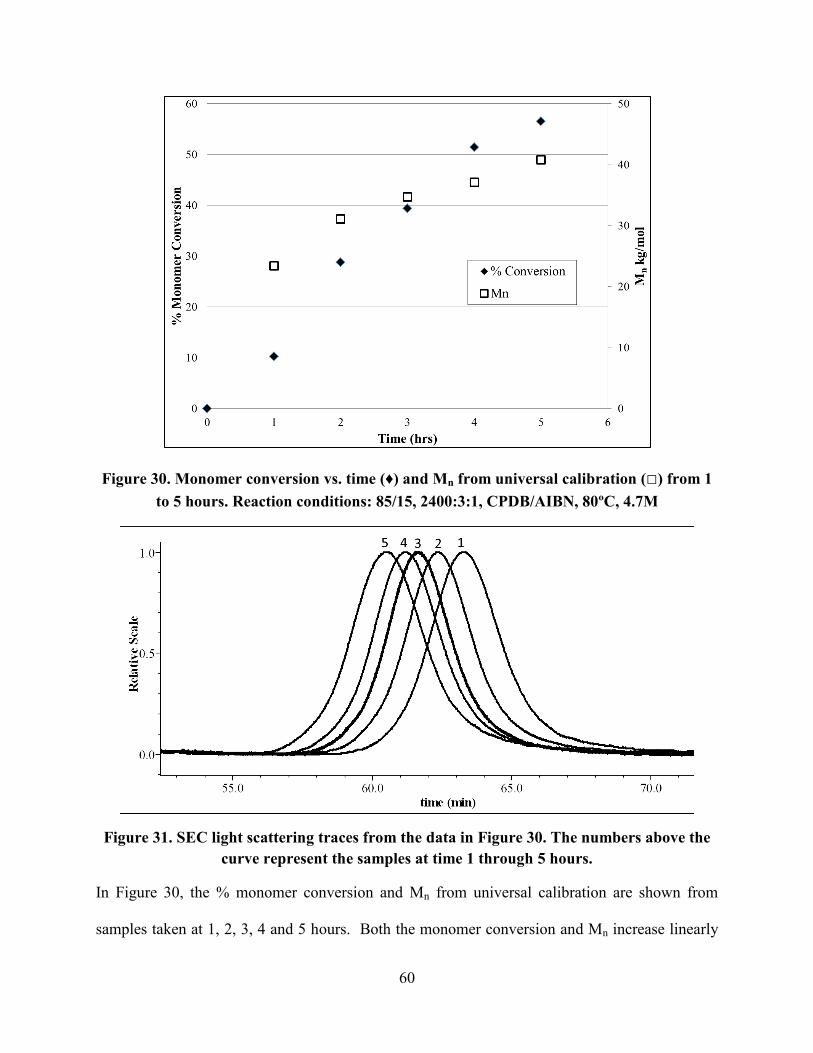
60
Figure 30. Monomer conversion vs. time (♦) and Mn from universal calibration (□) from 1
to 5 hours. Reaction conditions: 85/15, 2400:3:1, CPDB/AIBN, 80ºC, 4.7M
Figure 31. SEC light scattering traces from the data in Figure 30. The numbers above the
curve represent the samples at time 1 through 5 hours.
In Figure 30, the % monomer conversion and Mn from universal calibration are shown from
samples taken at 1, 2, 3, 4 and 5 hours. Both the monomer conversion and Mn increase linearly
61
over this time frame as expected for a controlled copolymerization. Figure 31 shows the SEC
traces from light scattering. The retention time of the copolymer decreased as the reaction
proceeded, indicating that higher molecular weight materials were eluted. This data indicates
that the copolymerization was controlled.
Measuring Tg, Tm, and Td of RAFT PAN-co-MA materials
Differential scanning calorimetry (DSC) was used to measure the Tg, Tm, and Td of PAN-
co-MA materials. DSC measures the change in the sample enthalpy over time, dH/dt, over a set
temperature program, dT/dt. This will give the specific heat capacity, dH/dT, which is related to
transition temperatures. Tg is the temperature where the amorphous regions of the polymer
change from glassy to rubbery. This transition is caused by an increase in segmental motion of
the copolymer, and causes a step change increase in the heat capacity. Tm is the temperature
where the crystalline portion of the polymer begins to melt. This produces an endothermic peak
that will increase in area as the crystalline fraction of the copolymer increases.14
Td is the
temperature where chain degradation begins. This process is exothermic.
For copolymers, the Fox equation43
(Equation 7) can be used to predict the Tg using the
homopolymer values, Tg,1 and Tg,2, if the weight fraction is known.
Equation 7. Fox equation; Tg values are in K
Figure 32 shows DSC thermograms and the transition temperatures for a series of copolymers
with AN incorporation that varies from 82/18 to 95/5 AN:MA.
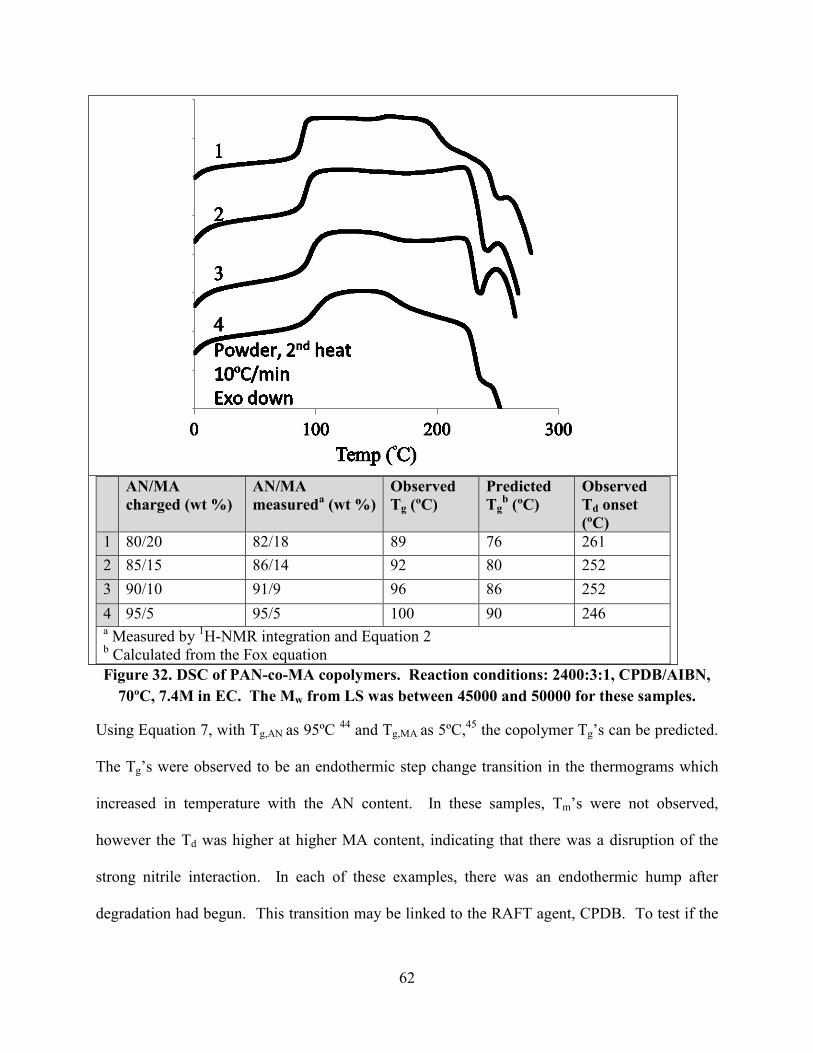
62
AN/MA
charged (wt %)
AN/MA
measureda (wt %)
Observed
Tg (ºC)
Predicted
Tgb (ºC)
Observed
Td onset
(ºC)
1 80/20 82/18 89 76 261
2 85/15 86/14 92 80 252
3 90/10 91/9 96 86 252
4 95/5 95/5 100 90 246 a Measured by
1H-NMR integration and Equation 2
b Calculated from the Fox equation
Figure 32. DSC of PAN-co-MA copolymers. Reaction conditions: 2400:3:1, CPDB/AIBN,
70ºC, 7.4M in EC. The Mw from LS was between 45000 and 50000 for these samples.
Using Equation 7, with Tg,AN as 95ºC 44
and Tg,MA as 5ºC,45
the copolymer Tg’s can be predicted.
The Tg’s were observed to be an endothermic step change transition in the thermograms which
increased in temperature with the AN content. In these samples, Tm’s were not observed,
however the Td was higher at higher MA content, indicating that there was a disruption of the
strong nitrile interaction. In each of these examples, there was an endothermic hump after
degradation had begun. This transition may be linked to the RAFT agent, CPDB. To test if the
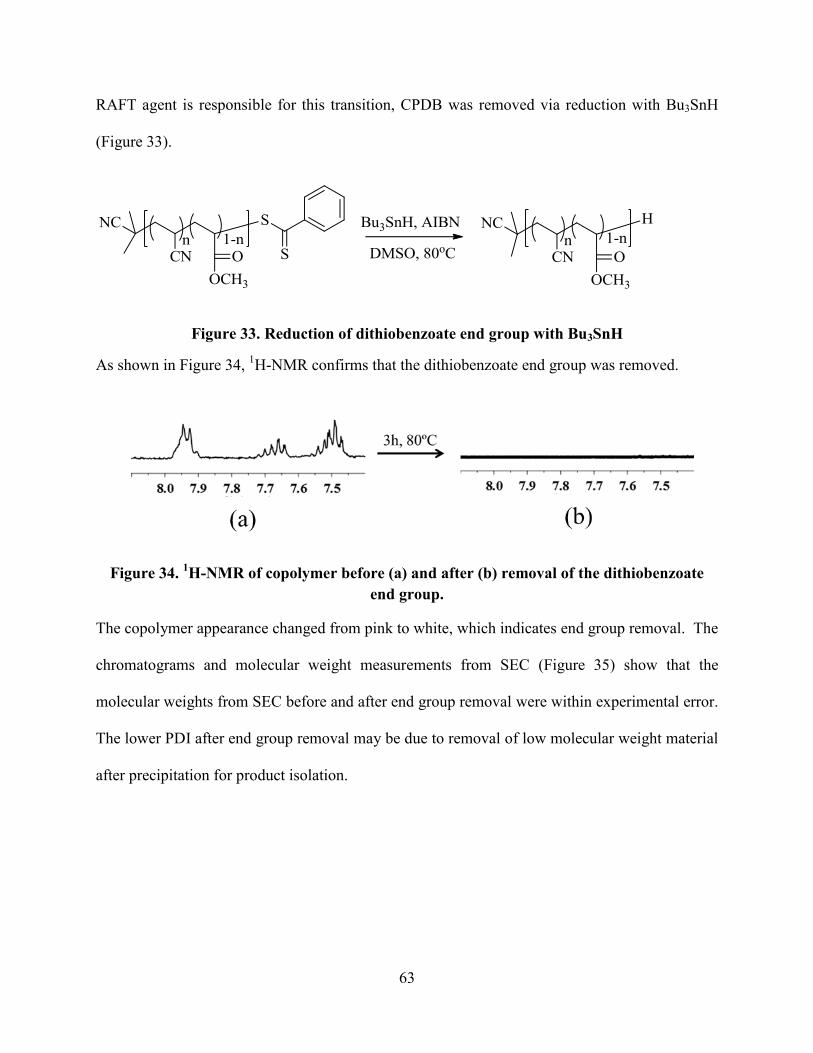
63
RAFT agent is responsible for this transition, CPDB was removed via reduction with Bu3SnH
(Figure 33).
Figure 33. Reduction of dithiobenzoate end group with Bu3SnH
As shown in Figure 34, 1H-NMR confirms that the dithiobenzoate end group was removed.
Figure 34. 1H-NMR of copolymer before (a) and after (b) removal of the dithiobenzoate
end group.
The copolymer appearance changed from pink to white, which indicates end group removal. The
chromatograms and molecular weight measurements from SEC (Figure 35) show that the
molecular weights from SEC before and after end group removal were within experimental error.
The lower PDI after end group removal may be due to removal of low molecular weight material
after precipitation for product isolation.
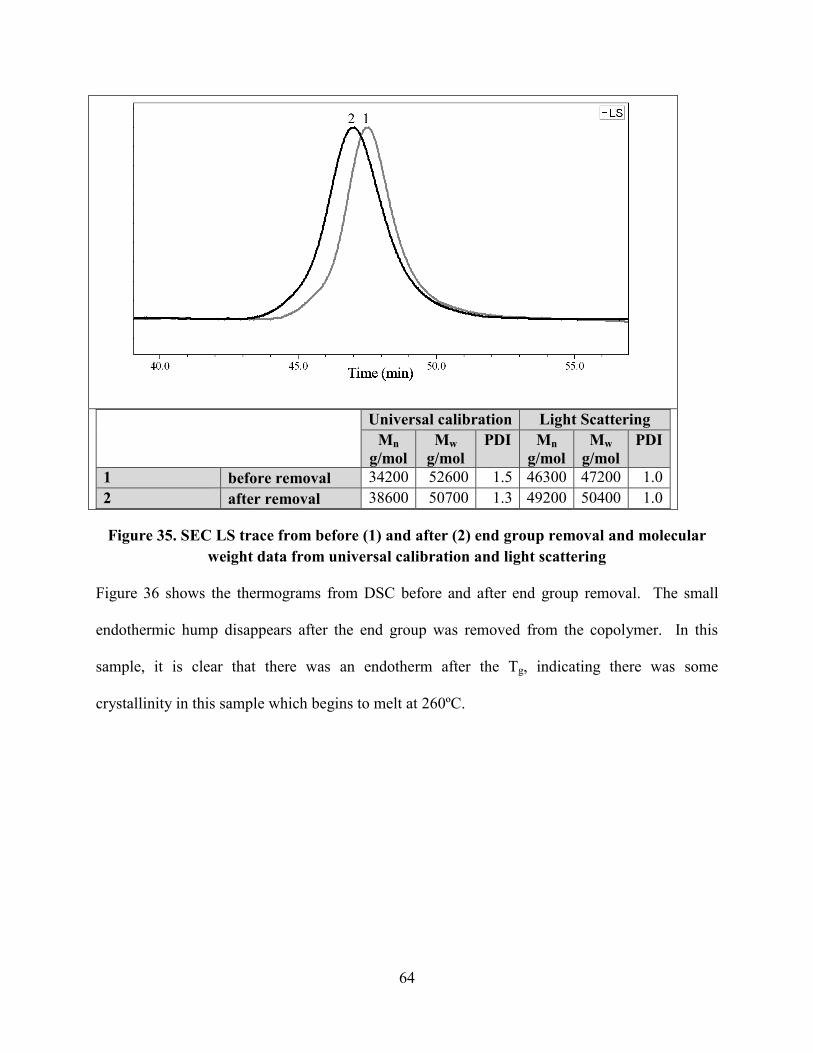
64
Universal calibration Light Scattering
Mn
g/mol
Mw
g/mol
PDI Mn
g/mol
Mw
g/mol
PDI
1 before removal 34200 52600 1.5 46300 47200 1.0
2 after removal 38600 50700 1.3 49200 50400 1.0
Figure 35. SEC LS trace from before (1) and after (2) end group removal and molecular
weight data from universal calibration and light scattering
Figure 36 shows the thermograms from DSC before and after end group removal. The small
endothermic hump disappears after the end group was removed from the copolymer. In this
sample, it is clear that there was an endotherm after the Tg, indicating there was some
crystallinity in this sample which begins to melt at 260ºC.
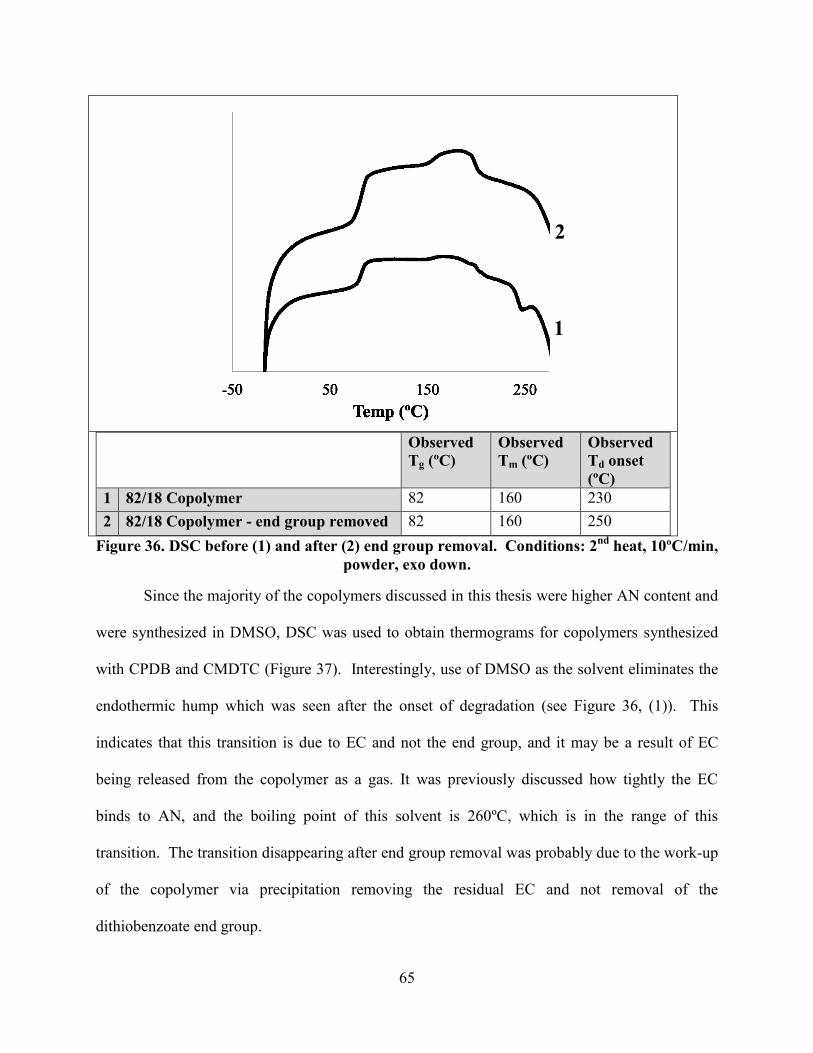
65
Observed
Tg (ºC)
Observed
Tm (ºC)
Observed
Td onset
(ºC)
1 82/18 Copolymer 82 160 230
2 82/18 Copolymer - end group removed 82 160 250
Figure 36. DSC before (1) and after (2) end group removal. Conditions: 2nd
heat, 10ºC/min,
powder, exo down.
Since the majority of the copolymers discussed in this thesis were higher AN content and
were synthesized in DMSO, DSC was used to obtain thermograms for copolymers synthesized
with CPDB and CMDTC (Figure 37). Interestingly, use of DMSO as the solvent eliminates the
endothermic hump which was seen after the onset of degradation (see Figure 36, (1)). This
indicates that this transition is due to EC and not the end group, and it may be a result of EC
being released from the copolymer as a gas. It was previously discussed how tightly the EC
binds to AN, and the boiling point of this solvent is 260ºC, which is in the range of this
transition. The transition disappearing after end group removal was probably due to the work-up
of the copolymer via precipitation removing the residual EC and not removal of the
dithiobenzoate end group.
1
2
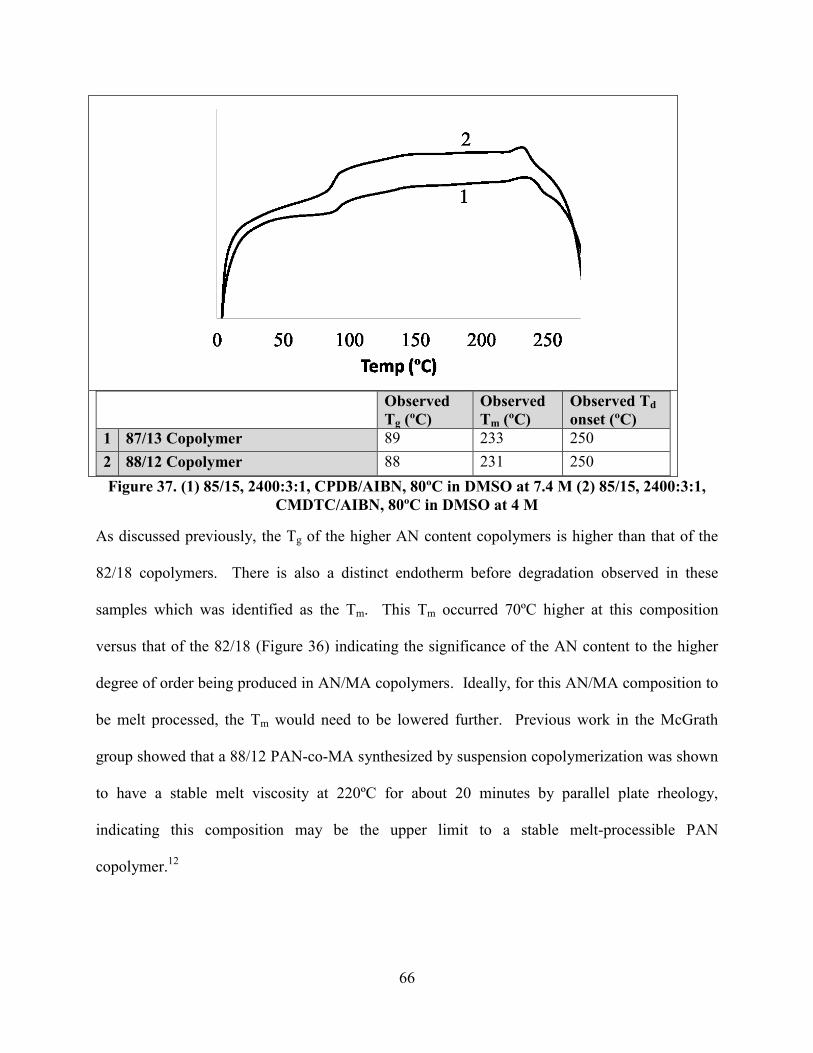
66
Observed
Tg (ºC)
Observed
Tm (ºC)
Observed Td
onset (ºC)
1 87/13 Copolymer 89 233 250
2 88/12 Copolymer 88 231 250
Figure 37. (1) 85/15, 2400:3:1, CPDB/AIBN, 80ºC in DMSO at 7.4 M (2) 85/15, 2400:3:1,
CMDTC/AIBN, 80ºC in DMSO at 4 M
As discussed previously, the Tg of the higher AN content copolymers is higher than that of the
82/18 copolymers. There is also a distinct endotherm before degradation observed in these
samples which was identified as the Tm. This Tm occurred 70ºC higher at this composition
versus that of the 82/18 (Figure 36) indicating the significance of the AN content to the higher
degree of order being produced in AN/MA copolymers. Ideally, for this AN/MA composition to
be melt processed, the Tm would need to be lowered further. Previous work in the McGrath
group showed that a 88/12 PAN-co-MA synthesized by suspension copolymerization was shown
to have a stable melt viscosity at 220ºC for about 20 minutes by parallel plate rheology,
indicating this composition may be the upper limit to a stable melt-processible PAN
copolymer.12
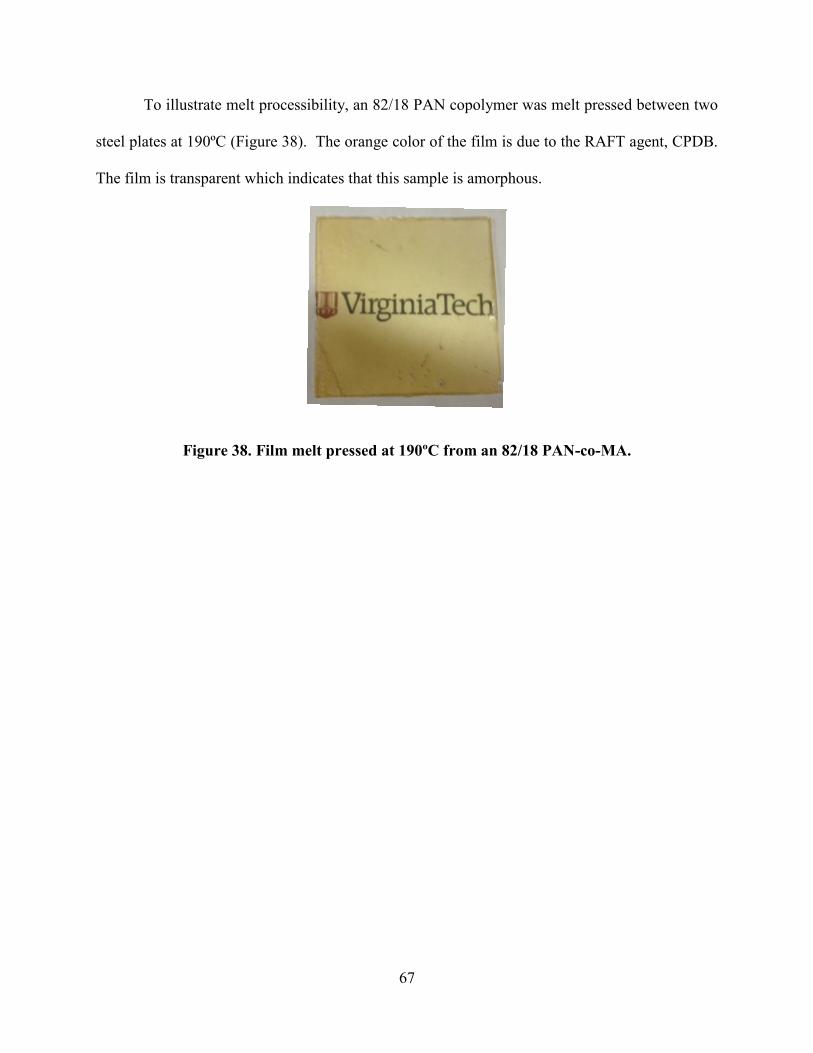
67
To illustrate melt processibility, an 82/18 PAN copolymer was melt pressed between two
steel plates at 190ºC (Figure 38). The orange color of the film is due to the RAFT agent, CPDB.
The film is transparent which indicates that this sample is amorphous.
Figure 38. Film melt pressed at 190ºC from an 82/18 PAN-co-MA.
68
Chapter V: Conclusions
Two RAFT agents, CPDB and CMDTC, were successfully used to synthesize high
molecular weight AN/MA copolymers, as evidenced by the SEC and IV data. Use of these
RAFT agents, along with the initiators AIBN and ABCHN, produced PAN-co-MA with PDIs
below or equal to the copolymers made using conventional free radical polymerization. EC and
DMSO were determined to be suitable solvents for the copolymerization reactions, and monomer
concentrations close to 4.7 M had the best percent monomer conversion. The percent monomer
conversion generally increased as the reaction temperature was increased. Based on the kinetic
data, the overall rate of the copolymerization was higher when CMDTC was used as the RAFT
CTA. Use of CMDTC also had higher percent monomer conversion versus that of CPDB. The
highest monomer conversion, 86%, was achieved at 100ºC when CMDTC and ABCHN were
used as the CTA and initiator for the copolymerization.
Thermal analysis showed that the Tg, Tm, and Td are reduced upon incorporation of
greater amounts of MA. Removal of the dithiobenzoate RAFT end group did not produce a
significant change in the thermal transitions. A Tm was seen in an 88/12 wt% AND 82/18 wt%
PAN-co-MA at approxmatly 230ºC and 160ºC, respectively. In the 82/18 wt% PAN-co-MA, the
Tm was eliminated or sufficiently low for the copolymer to be melt-pressed into a film.
69
Chapter VI: Suggested Future Research
The study reported in this thesis involving the copolymerization of AN and MA by RAFT
polymerization could be further refined by assessing higher ratios of RAFT CTA to initiator,
such as 5:1 or 10:1, while keeping the total monomer concentration the same. This would
decrease the amount of initiator derived end groups and should provide more control in the
polymerization. In this work, monomer conversions up to 85% were reached. It would be useful
to do rigorous kinetic measurements to determine rate of polymerization, conversion, and
control. Since higher temperatures generally resulted in higher conversions, use of an initiator
with a higher temperature half-life may help to improve the conversion without adding an excess
amount of radicals. However, to maintain control of the copolymerization at higher
temperatures, use of a dithiocarbonate may be necessary. Selection of a dithiocarbonate that is
not benzyl stabilized may provide improved conversions and copolymer control. Also,
copolymerization of vinyl acetate with AN using RAFT should also be investigated since it is
used in many commercial applications as the comonomer due to reduced cost over MA.
Further research could be done on the PAN-co-MA materials synthesized in this thesis to
determine if melt processibility is viable by using thermal characterization to determine in the Tm
is below 200ºC. If melt processibility seems to be a viable option, use of capillary or parallel
plate rheology can be used to determine melt-stability. If the Tm is above 200ºC, addition of a
plasticizer may allow for the Tm to be lowered to below 200ºC.
Once melt processibility is determined, an additional area of research would be to
compare the melt-processible PAN-co-MA materials synthesized by RAFT with copolymers
made using conventional free radical polymerization to determine if there is an advantage to
using RAFT copolymerization. Since most of the commercial PAN copolymers are made using
70
suspension copolymerization, using suspension to make the RAFT copolymers may provide
more insight into the viability and adaptability of using controlled over conventional materials.
71
References
1. Gadecki, F. A., Acrylic Fiber Technology and Applications. Marcel Dekker, Inc.: New
York, New York, 1995.
2. Aizenhtein, E. M., Fibre Chemistry 2009, 41 (5), 281-293.
3. Moad, G.; Rizzardo, E.; Thang, S. H., In Polymer Science: A Comprehensive Review,
Matyjaszewski, K., Ed. Elsevier: 2012; Vol. 3, pp 181-225, and references therein.
4. Destarac, M., Macromolecular Reaction Engineering 2010, 4 (3-4), 165-179.
5. Limberg, C., The SOHIO Process as an Inspiration for Molecular Organometallic
Chemistry. In Organometallic Oxidation Catalysis, Meyer, F.; Limberg, C., Eds. Springer
Berlin Heidelberg: 2007; Vol. 22, pp 79-95.
6. Wade, B.; Knorr, R., Acrylic Fiber Technology and Applications. Marcel Dekker,
Inc: New York, New York, 1995.
7. Wiles, K. B.; Bhanu, V. A.; Pasquale, A. J.; Long, T. E.; McGrath, J. E., Journal of
Polymer Science, Part A: Polymer Chemistry 2004, 42, 2994-3001.
8. Robert R. Matzke, J., Acrylic Fiber Technology and Applications. Marcel Dekker,
Inc.: New York, New York, 1995.
9. Brito Junior, C. A. R.; Pardini, L. C.; Alves, N. P.; Fleming, R. R.; Zavecz, I. C.
PAN Fibers Obtained by Extrusion Process using Glycerin as Plasticizer
http://www.quimlab.com.br/pdf/congresso_carbono_carlos.pdf (accessed April 14,2014).
10. Frushour, B. G., Acrylic Fiber Technology and Applications. Marcel Dekker, Inc.:
New York, New York, 1995.
11. Smierciak, R. C.; Jr., E. W.; Ball, L. E. Process for making a high nitrile
multipolymer prepared from acrylonitrile and olefinically unsaturated monomers.
5,618,901, April 8, 1997.
12. Bhanu, V. A.; Rangarajan, P.; Wiles, K.; Bortner, M.; Sankarpandian, M.;
Godshall, D.; Glass, T. E.; Banthia, A. K.; Yang, J.; Wilkes, G.; Baird, D.; McGrath, J. E.,
Polymer 2002, 43, 4841-4850.
13. Moad, G., Radical Polymerization. In Polymer Science: A Comprehensive Review,
Matyjaszewski, K.; Moller, M., Eds. Elsevier: 2012; Vol. 3, pp 59-118.
14. Odian, G., Principles of Polymerization. John Wiley & Sons: 2004.
15. Chiefari, J.; Chong, Y. K.; Ercole, F.; Krstina, J.; Jeffery, J.; Le, T. P. T.;
Mayadunne, R. T. A.; Meijs, G. F.; Moad, C. L.; Moad, G.; Rizzardo, E.; Thang, S. H.,
Macromolecules 1998, 31, 5559-5562.
16. Ting, S. R. S.; Davis, T. P.; Zetterlund, P. B., Macromolecules 2011, 44, 4187-4193.
17. Barner-Kowollik, C.; Buback, M.; Charleux, B.; Coote, M. L.; Drache, M.; Fukuda,
T.; Goto, A.; Klumperman, B.; Lowe, A. B.; McLeary, J. B.; Moad, G.; Monteiro, M. J.;
Sanderson, R. D.; Tonge, M. P.; Vana, P., Journal of Polymer Science Part A: Polymer
Chemistry 2006, 44 (20), 5809-5831.
18. Tang, C.; Kowalewski, T.; Matyjaszewski, K., Macromolecules 2003, 36, 8587-8589.
19. Liu, X.-H.; Zhang, G.-B.; Lu, X.-F.; Liu, J.-Y.; Pan, D.; Li, Y.-S., Journal of
Polymer Science Part A: Polymer Chemistry 2006, 44 (1), 490-498.
20. An, Q.; Qian, J.; Yu, L.; Luo, Y.; Liu, X., Journal of Polymer Science Part A:
Polymer Chemistry 2005, 43 (9), 1973-1977.
21. Liu, X.-H.; Li, Y.-G.; Lin, Y.; Li, Y.-S., Journal of Polymer Science Part A: Polymer
Chemistry 2007, 45 (7), 1272-1281.
72
22. Liu, X.-h.; Zhang, G.-b.; Li, B.-x.; Bai, Y.-g.; Pan, D.; Li, Y.-s., European Polymer
Journal 2008, 44 (4), 1200-1208.
23. Aqil, A.; Detrembleur, C.; Gilbert, B.; Jerome, R.; Jerome, C., Chemistry of
Materials 2007, 19, 2150-2154.
24. Carlson, J. S.; Hill, M. R.; Young, T.; Costanzo, P. J., Polymer Chemistry 2010, 1 (9),
1423.
25. Chernikova, E. V.; Poteryaeva, Z. A.; Belyaev, S. S.; Sivtsov, E. V., Russian Journal
of Applied Chemistry 2011, 84 (6), 1031-1039.
26. Chernikova, E. V.; Poteryaeva, Z. A.; Belyaev, S. S.; Nifant’ev, I. E.; Shlyakhtin, A.
V.; Kostina, Y. V.; Cherevan, A. S.; Efimov, M. N.; Bondarenko, G. N.; Sivtsov, E. V.,
Polymer Science Series B 2011, 53 (7-8), 391-403.
27. Liu, X.-H.; Zhang, G.-B.; Li, B.-X.; Bai, Y.-G., Journal of Applied Polymer Science
2009, 114 (1), 663-670.
28. Wan, L.-S.; Lei, H.; Ding, Y.; Fu, L.; Li, J.; Xu, Z.-K., Journal of Polymer Science
Part A: Polymher Cemistry 2009, 47, 92-102.
29. Feng, M.; Chen, Y.; Gu, L.; He, N.; Bai, J.; Lin, Y.; Zhan, H., European Polymer
Journal 2009, 45, 1058-1064.
30. Yue, Z.; Wang, D. X.; Liu, J. Q.; Zhang, J.; Feng, S. Y., Chinese Chemical Letters
2012, 23 (8), 989-992.
31. Kim, J. S.; Jeon, H. J.; Lee, K. M.; Im, J. N.; Youk, J. H., Fibers and Polymers 2010,
11 (2), 153-157.
32. Qin, J.; Zhang, L.; Jiang, H.; Zhu, J.; Zhang, Z.; Zhang, W.; Zhou, N.; Cheng, Z.;
Zhu, X., Chemistry 2012, 18 (19), 6015-21.
33. Niu, S.; Zhang, L.; Zhu, J.; Zhang, W.; Cheng, Z.; Zhu, X., Journal of Polymer
Science, Part A: Polymer Chemistry 2013, 51, 1197-1204.
34. Bashir, Z.; Church, S. P.; Price, D. M., 1993, Acta Polymer (44), 211-218.
35. Brandrup, J. I., Edmund H.; Grulke, Eric A.; Abe, Akihiro; Bloch, Daniel R. , II.
Polymerization and Depolymerization: Decomposition Rates of Free Radical Initiators. In
Polymer Handbook [Online] John Wiley & Sons: 1999, 2005.
36. Lutz, J.-F.; Neugebauer, D.; Matyjaszewski, K., Journal of the American Chemical
Society 2003, 125, 6986-6993.
37. Moad, G.; Rizzardo, E.; Thang, S. H. A Micro Review of Reversible
Addition/Fragmentation Chain Transfer (RAFT) Polymerization Controlled Radical
Polymerization Guide: RAFT, ATRP, NMP [Online], 2012, p. 19-26.
38. Chong, Y. K.; Moad, G.; Rizzardo, E.; Thang, S. H., Macromolecules 2007, 40, 4446-
4455.
39. Niu, S.; Zhang, L.; Zhu, J.; Zhang, W.; Cheng, Z.; Zhu, X., Journal of Polymer
Science, Part A: Polymer Chemistry 2012, 51, 1197-1204.
40. Kurata, M.; Tsunashima, Y., Viscosity- Molecular Weight Relationships and
Unperturbed Dimensions of Linear Chain Molecules. In Polymer Handbook, Brandup, J.;
Immergut, E. H.; Grulke, E. A.; Abe, A.; Bloch, D. R., Eds. John Wiley & Sons: 1999;
2005; p 68.
41. Brar, A. S.; Goyal, A. K.; Hooda, S., Pure Applied Chemisty 2009, 81 (3), 389-415.
42. Vidotto, G.; Crosato-Arnaldi, A.; Talamini, G., Polymerization of Acrylonitirile in
the Presence of Different Solvents. Die Makromolekulare Chemie 1969, 122, 91-104.
43. Hiemenz, P.; Lodge, T., Polymer Chemistry. CRC Press: Boca Raton, FL, 2007.
73
44. Andrews, R. J.; Grulke, E. A., Glass Transition Temperatures of Polymers. In
Polymer Handbook, Brandup, J. I., E. H.; Grulke, E. A.; Abe, A.; Bloch, D. R., Ed. John
Wiley & Sons: 1999; 2005; p 253.
45. Andrews, R. J.; Grulke, E. A., Glass Transition Temperature of Polymers. In
Polymer Handbook, Brandup, J. I., E. H.; Grulke, E. A.; Abe, A.; Bloch, D. R., Ed. John
Wiley & Sons: 1999, 2005; p 200.