coordinates and graphs in the plane. coordinate plane x-axis y-axis origin
TRANSCRIPT
Coordinates and Graphsin the Plane
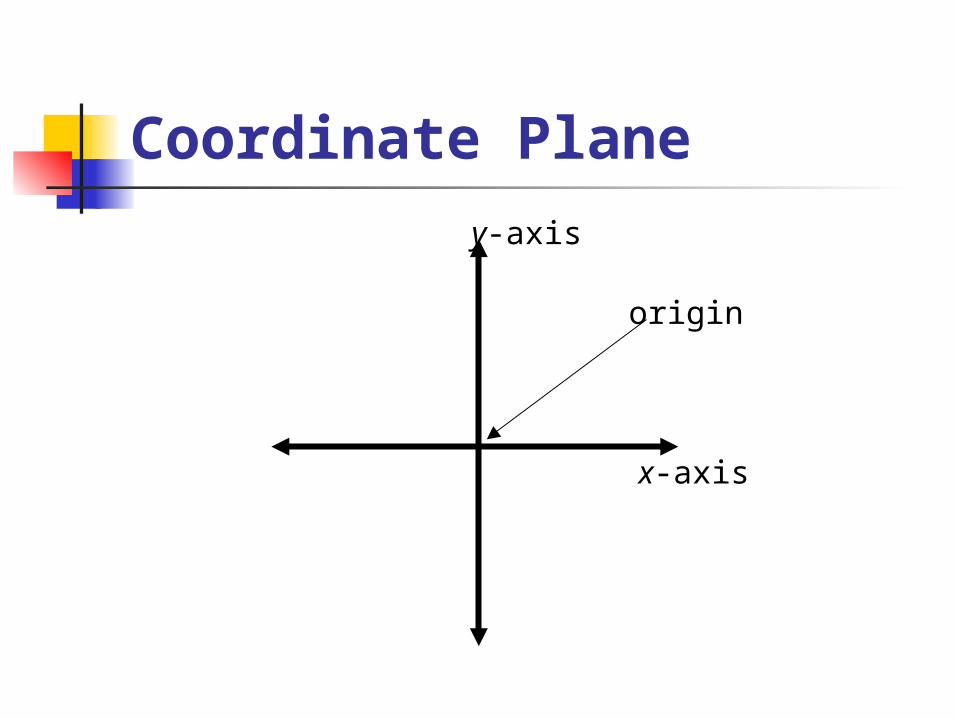
Coordinate Plane
x-axis
y-axis
origin
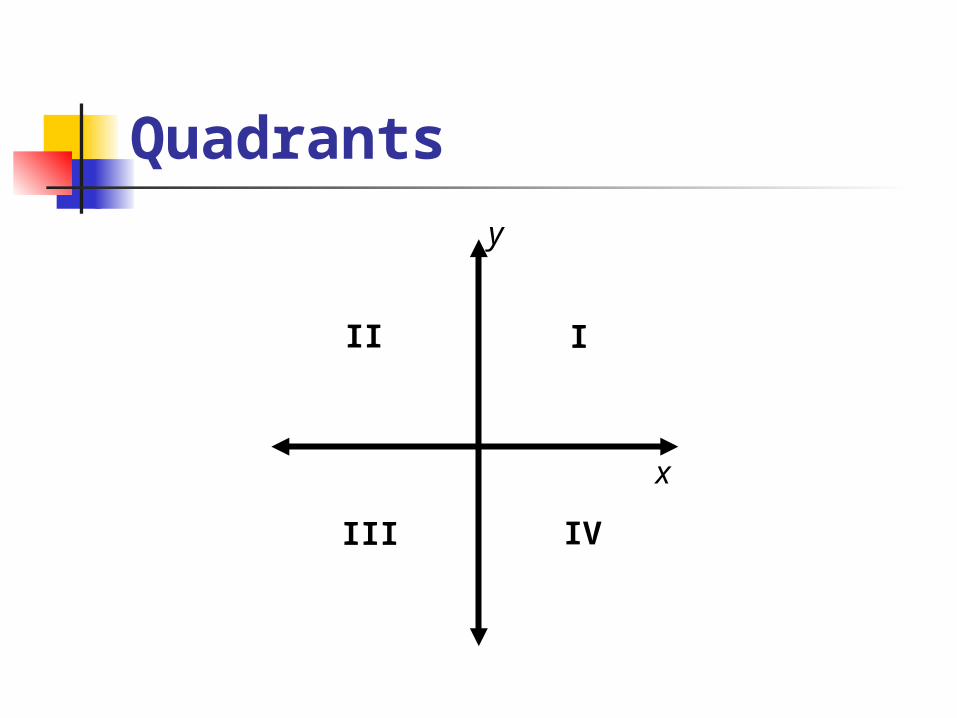
Quadrants
x
y
III
III IV
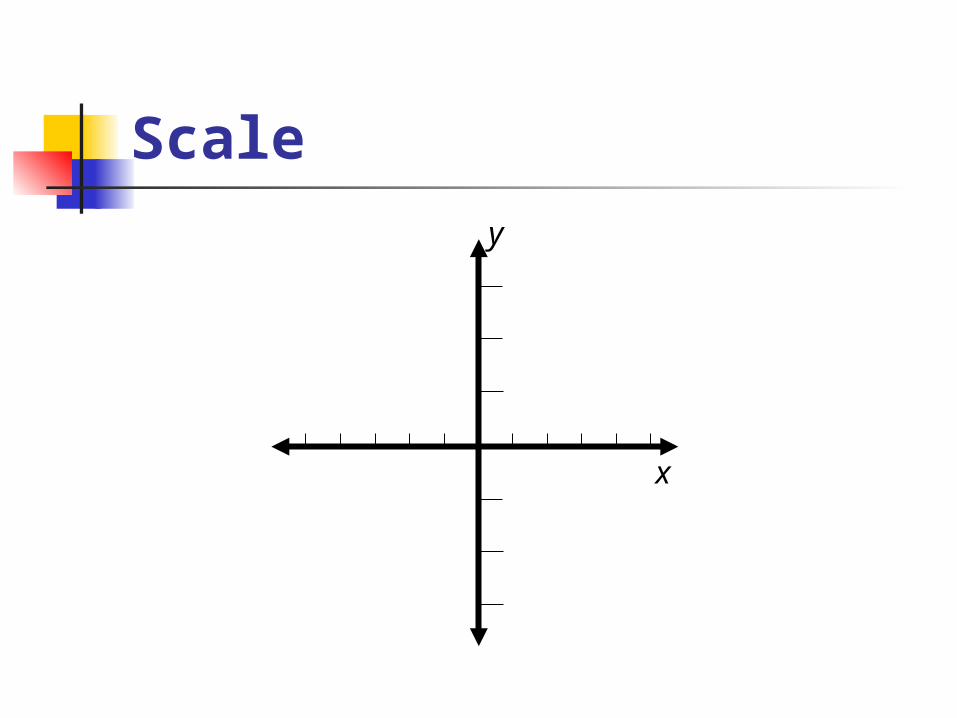
Scale
x
y
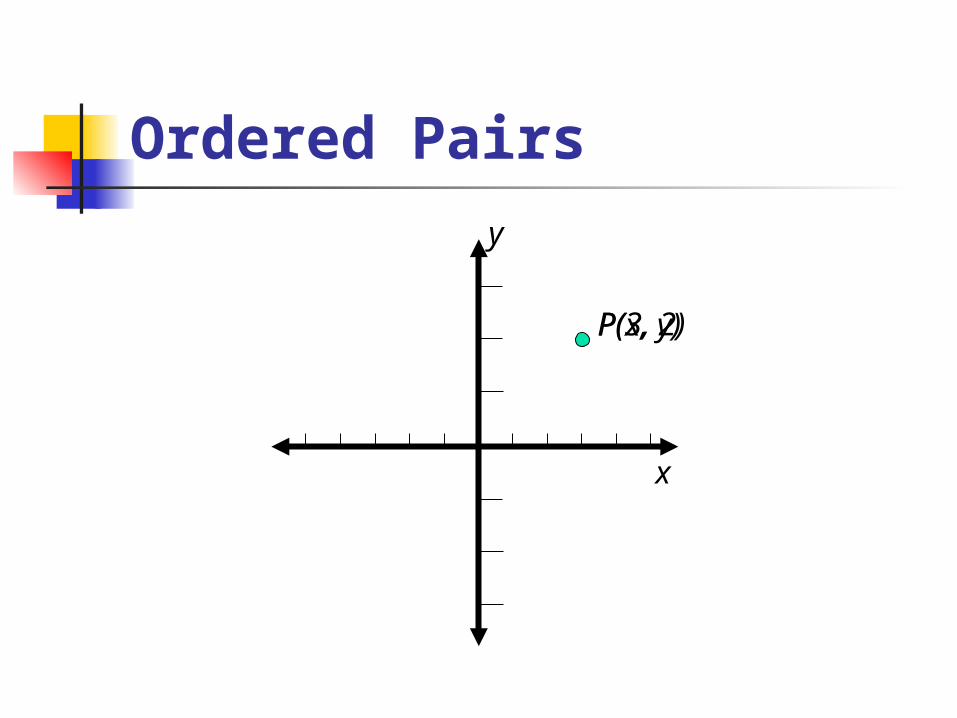
P(x, y)P(3, 2)
Ordered Pairs
x
y
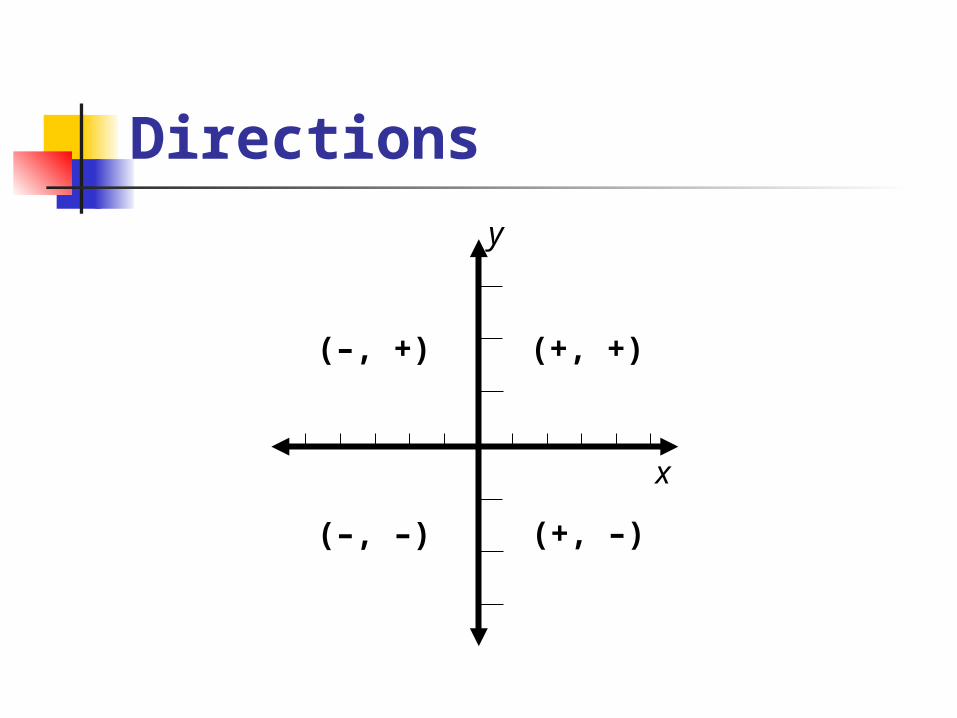
Directions
x
y
(+, +)(–, +)
(–, –) (+, –)
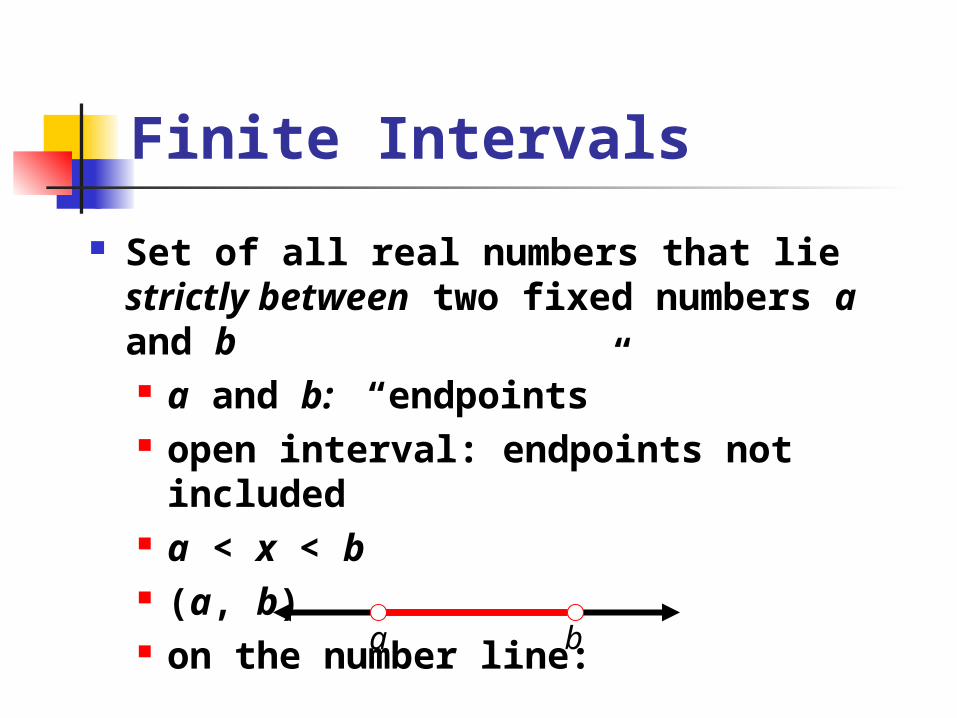
Finite Intervals
Set of all real numbers that lie strictly between two fixed numbers a and b a and b: “endpoints” open interval: endpoints not
included a < x < b (a, b) on the number line:a b
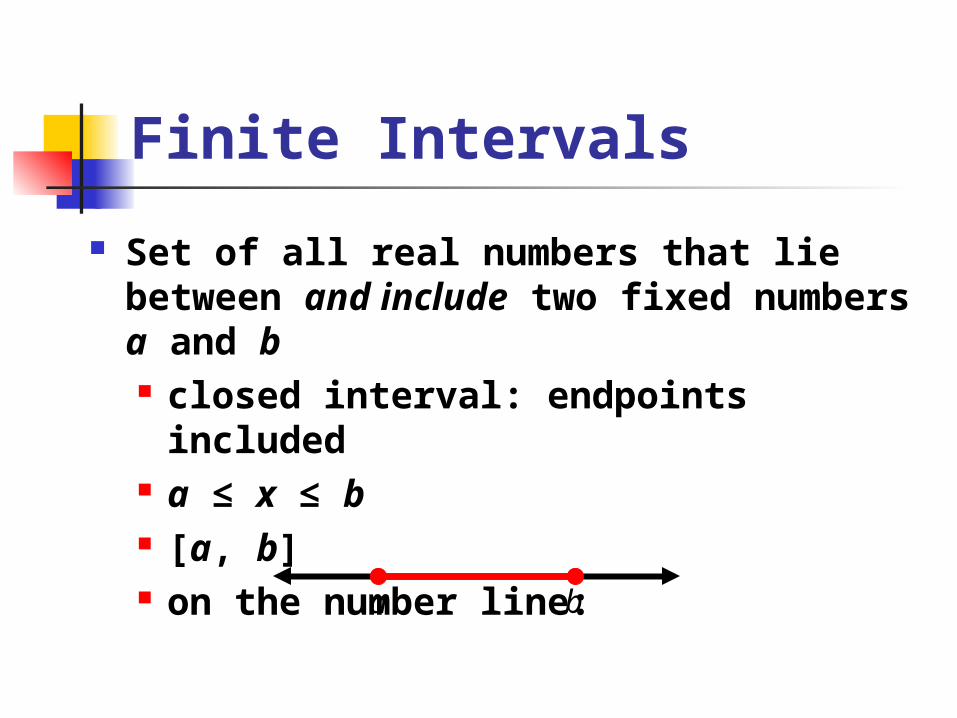
Finite Intervals
Set of all real numbers that lie between and include two fixed numbers a and b closed interval: endpoints included a ≤ x ≤ b [a, b] on the number line:
a b
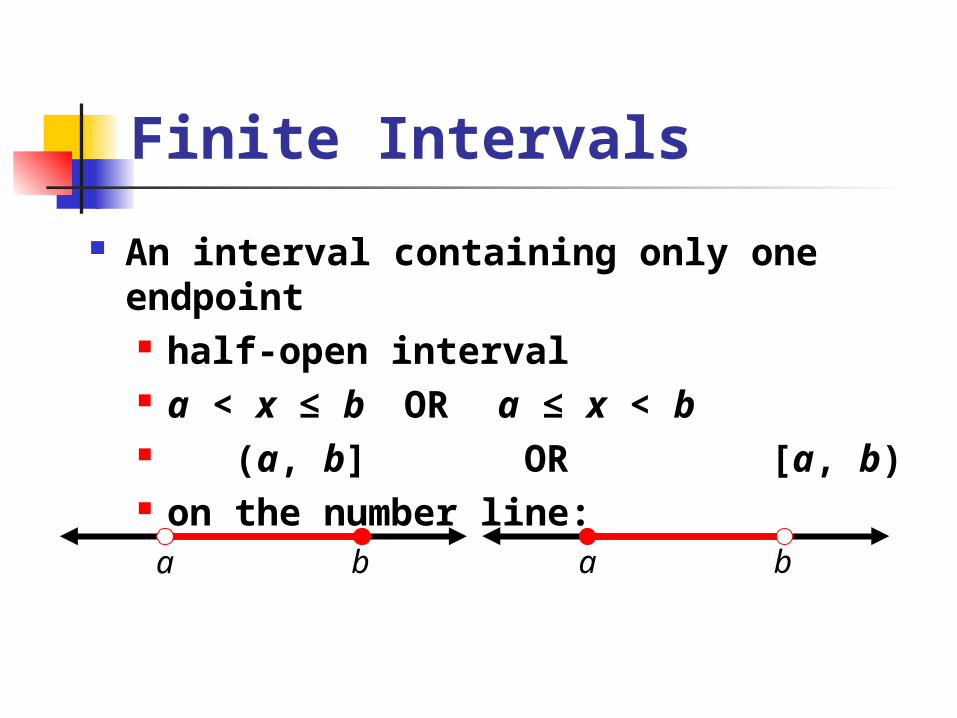
Finite Intervals
An interval containing only one endpoint half-open interval a < x ≤ b OR a ≤ x < b (a, b] OR [a, b) on the number line:
a b a b
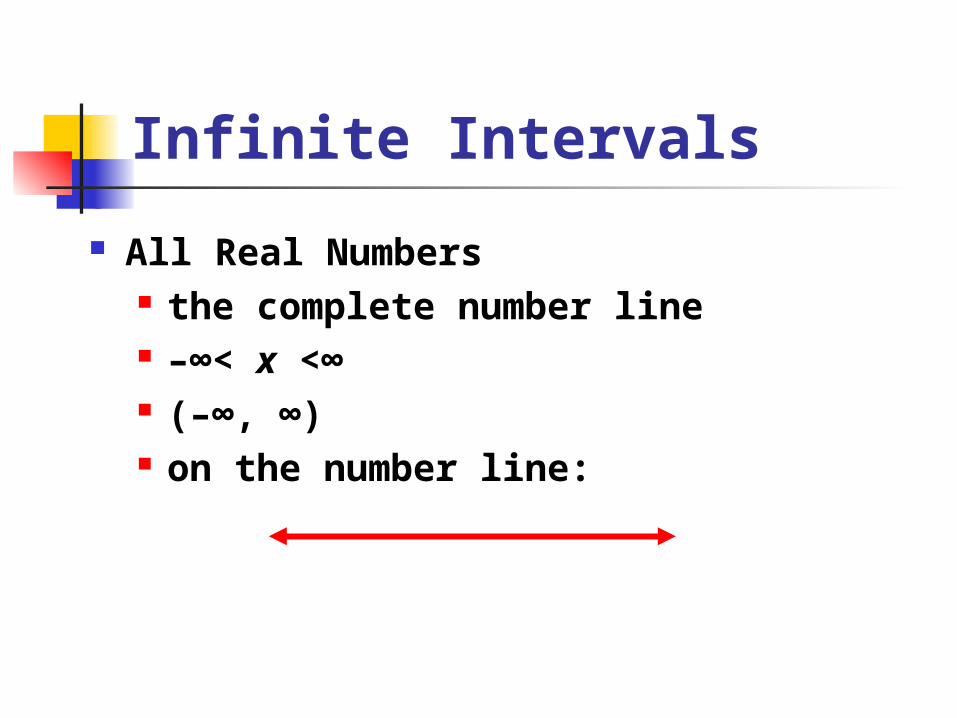
Infinite Intervals
All Real Numbers the complete number line –∞< x <∞ (–∞, ∞) on the number line:
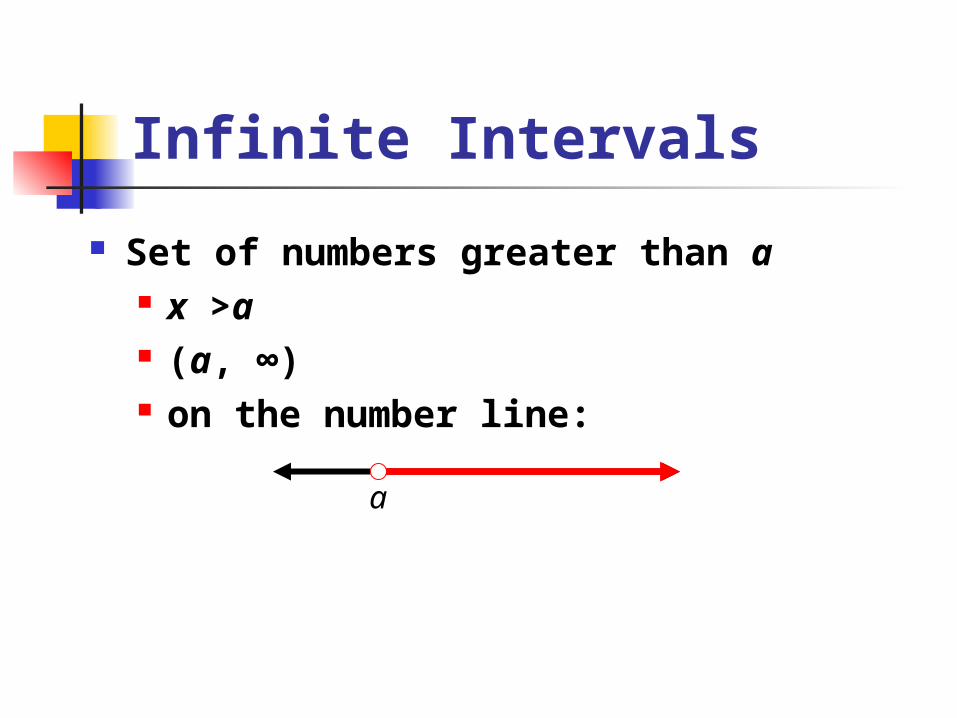
Infinite Intervals
Set of numbers greater than a x >a (a, ∞) on the number line:
a
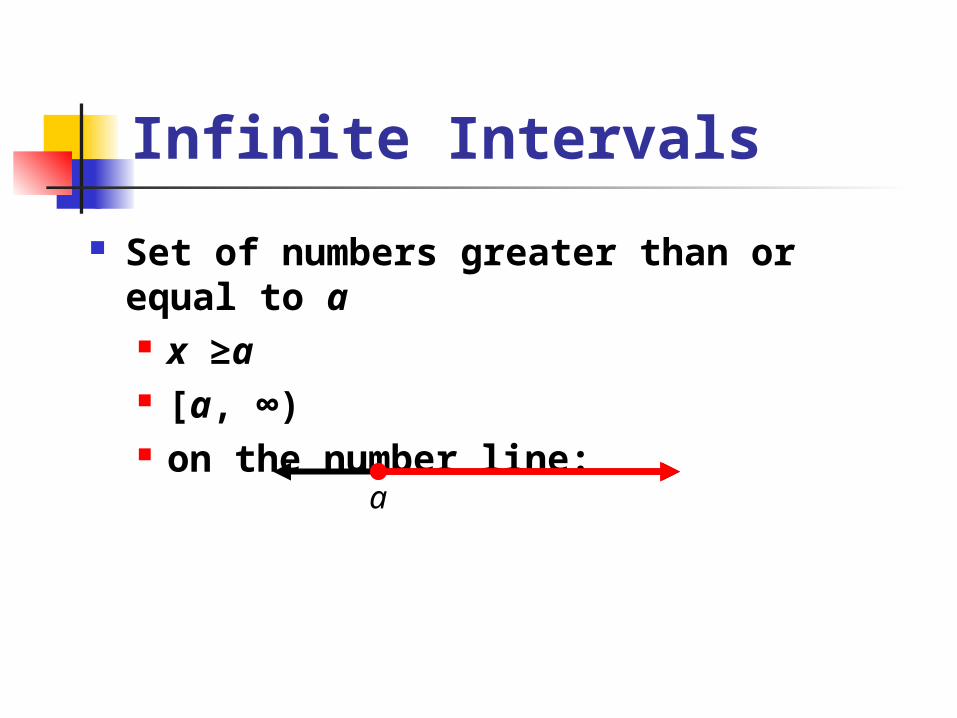
Infinite Intervals
Set of numbers greater than or equal to a x ≥a [a, ∞) on the number line:
a
Infinite Intervals
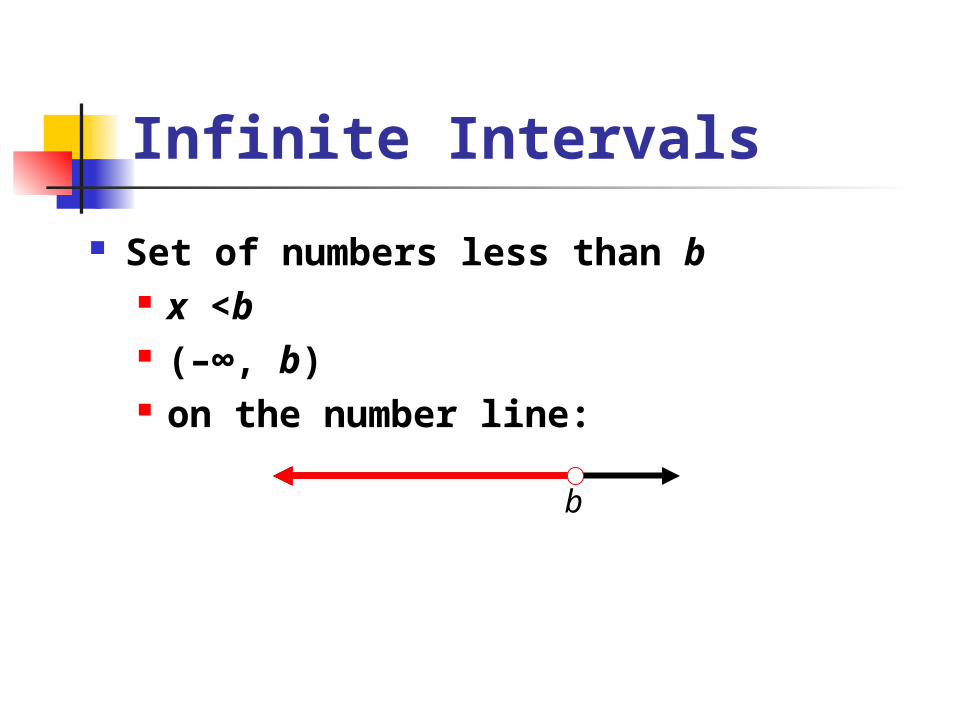
Set of numbers less than b x <b (–∞, b) on the number line:
b
Infinite Intervals
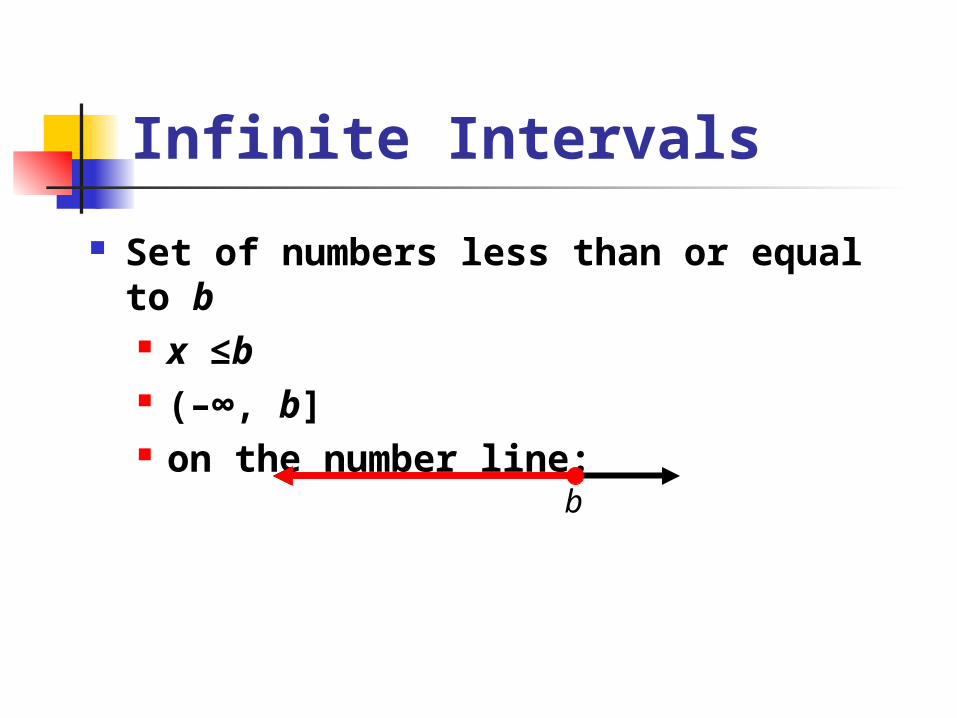
Set of numbers less than or equal to b x ≤b (–∞, b] on the number line:
b
A Viewing Windowon the Coordinate Plane
Points in the coordinate plane that correspond to a set of ordered pairs is a graph of the set.
The graph represents a small portion of the coordinate plane. “Viewing Window” or “View”
Graphs by Hand
Make a table of xy-pairs that fit the equation
Sketch coordinate axes with scales that will fit the points in your table
Plot the points (x, y) from the table Sketch a smooth curve through the
plotted points Label the curve with its equation
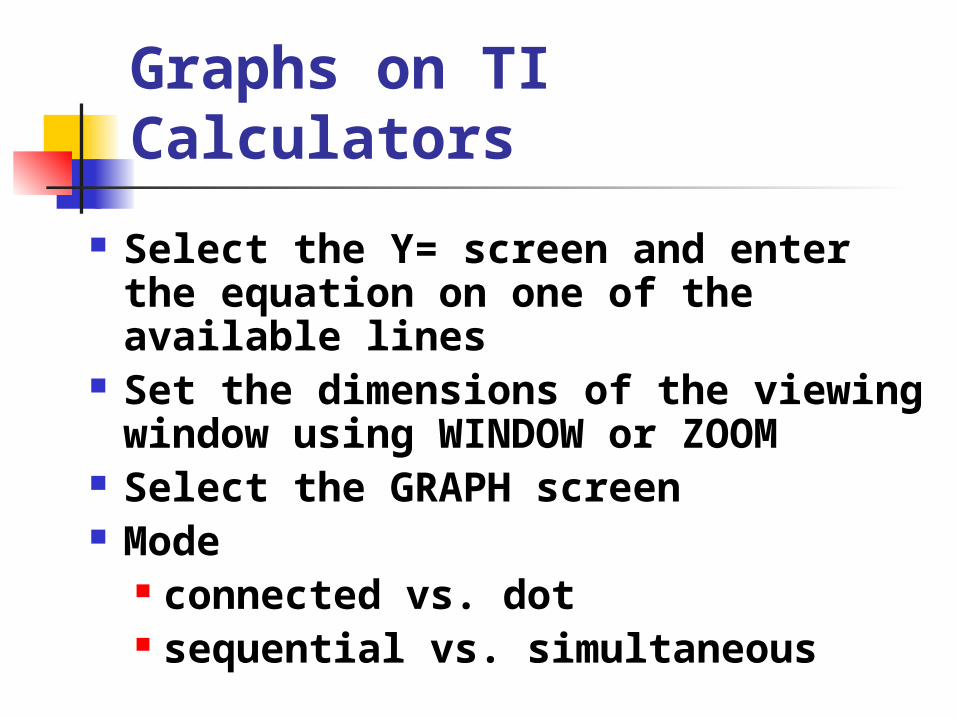
Graphs on TI Calculators
Select the Y= screen and enter the equation on one of the available lines
Set the dimensions of the viewing window using WINDOW or ZOOM
Select the GRAPH screen Mode
connected vs. dot sequential vs. simultaneous
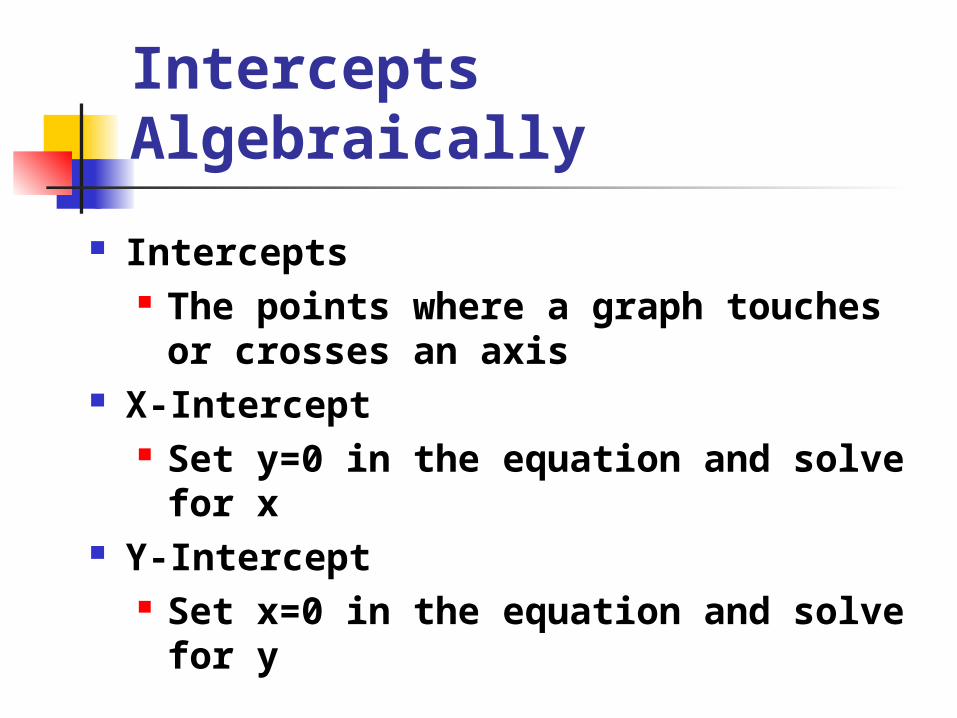
Intercepts Algebraically
Intercepts The points where a graph touches
or crosses an axis X-Intercept
Set y=0 in the equation and solve for x
Y-Intercept Set x=0 in the equation and solve
for y
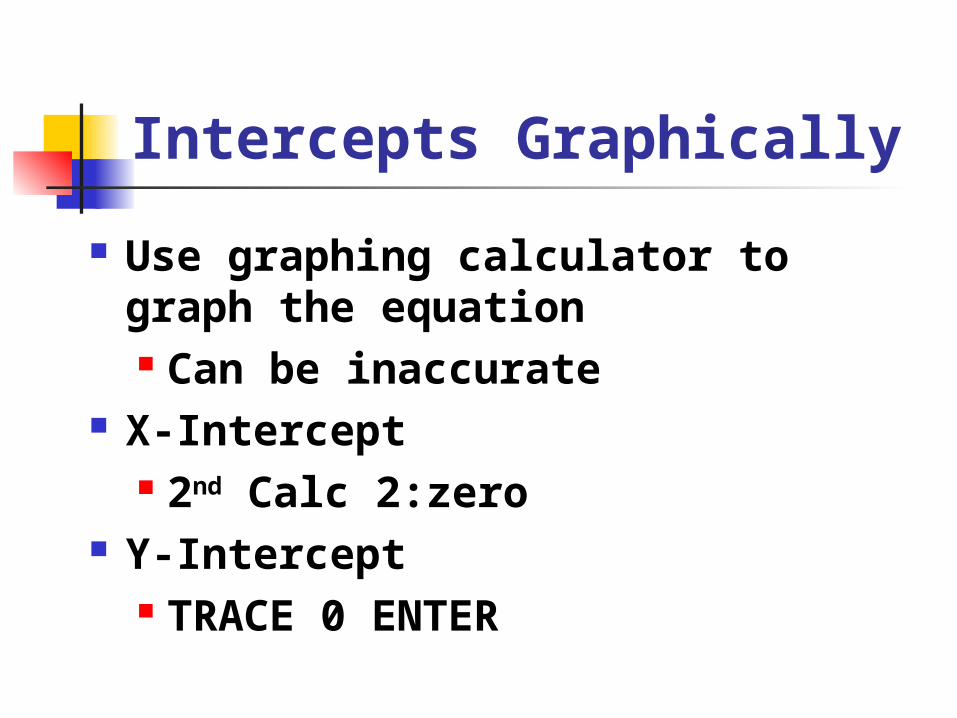
Intercepts Graphically
Use graphing calculator to graph the equation Can be inaccurate
X-Intercept 2nd Calc 2:zero
Y-Intercept TRACE 0 ENTER