conversion of tallgrass prairie to woodland: consequences for carbon and nitrogen cycling
TRANSCRIPT
BioOne sees sustainable scholarly publishing as an inherently collaborative enterprise connecting authors,nonprofit publishers, academic institutions, research libraries, and research funders in the common goal ofmaximizing access to critical research.
Conversion of Tallgrass Prairie to Woodland:Consequences for Carbon and Nitrogen CyclingAuthor(s): R. L. Mcculley and R. B. JacksonSource: The American Midland Naturalist, 167(2):307-321. 2012.Published By: University of Notre DameDOI: http://dx.doi.org/10.1674/0003-0031-167.2.307URL: http://www.bioone.org/doi/full/10.1674/0003-0031-167.2.307
BioOne (www.bioone.org) is a nonprofit, online aggregation of coreresearch in the biological, ecological, and environmental sciences. BioOneprovides a sustainable online platform for over 170 journals and bookspublished by nonprofit societies, associations, museums, institutions, andpresses.
Your use of this PDF, the BioOne Web site, and all posted and associatedcontent indicates your acceptance of BioOne’s Terms of Use, available atwww.bioone.org/page/terms_of_use.
Usage of BioOne content is strictly limited to personal, educational, andnon-commercial use. Commercial inquiries or rights and permissionsrequests should be directed to the individual publisher as copyright holder.
Conversion of Tallgrass Prairie to Woodland: Consequences forCarbon and Nitrogen Cycling
R. L. MCCULLEY1
Department of Biology, Duke University, Durham, North Carolina 27708
AND
R. B. JACKSONNicholas School of the Environment and Earth Sciences, Duke University, Durham, North Carolina 27708
ABSTRACT.—Woody plant encroachment and proliferation in grasslands is occurringworldwide and has significant but variable effects on ecosystem processes, including primaryproduction, litter decomposition, and N cycling. In mesic systems, recent reports suggestaboveground net primary production (ANPP) is stimulated by grass-to-woodland conversion;however, significant losses of soil C may accompany this land cover change in theseenvironments. This study aimed to quantify how changes in plant production inputs (bothabove- and belowground), litter decomposition, and N cycling may feed back to reduce soil Cpools in a mesic tallgrass prairie in central Texas, USA, that has undergone grass-to-woodlandconversion over the past 60–70 y. Belowground net primary production (BNPP) in woodlandwas half that of adjacent grassland, and contrary to recent reports, no significant differencesin ANPP between the two vegetation types were observed. Decomposition rates of above-ground woody and grass material were surprisingly similar. However, higher N concentrationsin woodland leaves and stems meant woodland received more than 33 the amount of N vialitterfall than adjacent grassland, and woody litter mineralized N when decomposing, whilegrassland litter tended to retain it. Losses of soil C accompanying grass-to-woodland con-version at this site (woodland soil C was ,20% less than that of adjacent grassland) may bethe result of both reduced BNPP inputs to the soil C pool and increased rates of N cyclingstimulating soil organic matter decomposition. Given that the processes controlling whethergrasslands accrue or lose C and N when they are replaced by woody species vary across timeand depend on the species involved and the biotic and edaphic conditions and managementhistory of the site, more complex models that incorporate these parameters may be requiredto understand and predict when gains and losses of C will accompany vegetation change.
INTRODUCTION
Worldwide, grassland is being converted to woodland via either direct planting of woodyplantations in grasslands or indirectly from alterations in climate or land use (e.g., grazingand fire regimes), which promote woody plant encroachment and proliferation in grass-lands (Archer et al., 1995; Jackson et al., 2002; Briggs et al., 2005; Jackson et al., 2007).Regardless of the mechanism, such alterations in land cover impact many ecological pro-cesses. The effect this vegetation change has on ecosystem nutrient cycling and storage hasbeen a major research focus for decades (e.g., Schlesinger et al., 1990). Interest in this topicremains high because conversion of grassland to woodland is occurring extensivelyworldwide, with implications for both current and future human land use (Archer et al.,2001). Furthermore, this vegetation change has the potential to sequester significantamounts of carbon (C) from the atmosphere into ecosystem pools (Pacala et al., 2001).
1 Corresponding author’s Present address: Department of Plant & Soil Sciences, N-222D Ag. Sci.North, University of Kentucky, Lexington 40546; Telephone: (859) 257-6388; FAX: (859) 323-1952;e-mail: [email protected]
Am. Midl. Nat. (2012) 167:307–321
307
Recent studies indicate that aboveground net primary production (ANPP) increases withwoody plant encroachment and proliferation in mesic grasslands (Harcombe et al., 1993;Reich et al., 2001; Hughes et al., 2006; Knapp et al., 2008). These large increases in plantproduction are likely to promote C accumulation over time, and increases in aboveground Cpools (biomass and litter) are frequently reported at mesic sites undergoing woodlandconversion (Hibbard et al., 2001; Jackson et al., 2002; McKinley and Blair, 2008). However,the response of belowground C pools, especially soil C, to this vegetation change has beenharder to predict (Wessman et al., 2004). Woody plant encroachment and proliferation ingrasslands can result in soil C accumulation (Boutton et al., 1998; Archer et al., 2001;Brantley and Young, 2010), no net change (McCarron et al., 2003; Smith and Johnson, 2003;Hughes et al., 2006), or loss (Jackson et al., 2002). Interestingly, mesic systems, where ANPPis thought to be most stimulated by grass-to-woodland conversion (Knapp et al., 2008), arealso where soil C losses are more commonly observed with woody encroachment andplantation forestry (Guo and Gifford, 2002; Jackson et al., 2002).
How might woody plant dominance in mesic grasslands reduce soil C pools? There areseveral possible explanations: (1) Belowground net primary production (BNPP), a moredirect source of C to soil pools than ANPP, may be reduced under woody plants (therebyreducing C inputs to soil C pools; Steinaker and Wilson, 2005); and/or (2) Woody plantdominance, through many possible mechanisms, may stimulate soil organic matterdecomposition, for instance through changes in nitrogen (N) availability (Brantley andYoung, 2008; Kirschbaum et al., 2008), alterations in microclimate (Vetaas, 1992), detritivoreand microbial communities (Waldrop and Firestone, 2004), and/or a soil ‘priming’ effect(Fontaine et al., 2004).
The literature on woody plant encroachment and proliferation in grasslands containsmany site-specific studies where one or more of these possible controlling factors on soil Cgain or loss have been measured (e.g., Wessman et al., 2004). However, the majority ofresearch has been done in xeric systems where either gains or no net change in soil nutrientpools have been observed (e.g., Hibbard et al., 2001; Lett et al., 2004; Smith and Johnson,2004; Hughes et al., 2006; McClaran et al., 2008; McKinley and Blair, 2008). In an effort toidentify some of the potential mechanisms governing soil C loss with woody plantproliferation in wetter grasslands, we measured plant inputs of C and N (ANPP and BNPP)and litter decomposition losses within a paired tallgrass prairie and adjacent woodland sitein the southern Great Plains of North America shown previously to have experienced soil Closses with grass-to-woodland conversion (Jackson et al., 2002). We hypothesized that whileANPP might be higher in woody than grass-dominated areas at this site, woodland BNPPwould be significantly lower than native grassland. In addition, given that some studies haveshown grass-to-woodland conversion in mesic habitats increases N availability (Wilson andKleb, 1996; Reich et al., 2001; McCulley et al., 2004; Brantley and Young, 2008), combinedwith the fact that a potential N-fixing species [Prosopis glandulosa; (Johnson and Mayeux,1990)] is dominant at this site, we hypothesized that N inputs via plant production wouldbe greater in the woodland than the grassland. Finally, despite higher N inputs in thewoodland, we predicted that alterations in litter chemistry (e.g., more lignin/woodycontributions) in the woodland would result in woody litter decomposing more slowly thangrass material, as has been observed at other sites (Kochy and Wilson, 1997; Norris et al.,2001). These production and decomposition trends might mean that over time C pools areshifted from primarily belowground in grassland to aboveground in woodland (into plantmaterial and a developing litter layer; Jackson et al., 2002). Increasing N availability canstimulate decomposition of relatively labile material but may retard decomposition of
308 THE AMERICAN MIDLAND NATURALIST 167(2)
recalcitrant litter or soil organic matter pools (Knorr et al., 2005). If soil C at this site isrelatively labile in nature, the observed reductions in soil C pools that accompany woodyplant establishment and dominance in this mesic grassland ecosystem might be the result ofboth reductions in belowground C inputs and increases in N input and availability, whichmay stimulate organic matter decomposition and loss.
MATERIALS & METHODS
SITE DESCRIPTION
We conducted this study in central Texas at the USDA-ARS field station near the city ofRiesel, (31u299N, 96u539W), where annual precipitation is 896 mm (41 y mean on site) andmean annual temperature is 18.9 C. The annual precipitation at the site was 903 mm and1171 mm for study years, 2003 and 2004, respectively. Using historical aerial photographs,supplemented with personal landowner accounts, we identified a location where native,uncultivated tallgrass prairie existed adjacent to (within 100 m) an uncultivated area thatwas originally grassland but that has become dominated by woody plant species (mesquite,Prosopis glandulosa, and others) over time, presumably due to changes in land management(e.g., cessation of mowing and burning). Carbon stable isotope signatures of the soil in thewoodland confirm that the site was previously dominated by C4 vegetation (i.e., grasses:Jackson et al., 2002). We established a 30 m 3 30 m plot in each vegetation type based onsimilarities in soil type (Heiden clay; Udic Haplusterts) and topography [relatively flat (1–3% slopes) upland landscape positions].
The native grassland site has been managed as a hay pasture for many years and contains aplant community considered representative of native, remnant tallgrass prairie. Dominantgrassland plant species included: Schizachyrium scoparium, Sorghastrum nutans, Desmanthusillinoensis, and Arnoglossum plantagineum (Polley et al., 2007). Long-term management of thesite consists of annual Jun. mowing followed by hay removal, but the site receives nofertilizer applications. During the year of sampling, the grassland was hayed in Jun. of 2003(and material was removed), immediately before this study began.
In contrast, the woodland has not been actively managed in .60 y and is dominated byseven woody species [Table 1; taxonomy according to (Diggs et al., 1999)]. Herbaceousvegetation in the woodland was relatively sparse and patchily distributed in the understory.An inventory of the woodland plot was performed in Sept. 2003 and consisted of recordingthe basal diameter of all live stems with dbh (diameter at breast height) .5 cm andcounting the number of saplings .50 cm tall but with dbh ,5 cm by species. Prosopis
TABLE 1.—Woodland vegetation characteristics. The basal diameter of all stems .5 cm dbh (diameterat breast height) and the number of understory saplings (taller than 50 cm but with dbh ,5 cm) foundin the 30 m 3 30 m plot were recorded by species in Sept. 2003. Basal diameter data were converted tobasal area for each stem and species (total woody basal area for the stand was 18.4 m2 ha21)
Species name Proportion of total basal area (%) Number of understory saplings
Prosopis glandulosa 53.1 0Gleditsia triacanthos 24.9 147Celtis laevigata 13.0 153Ulmus crassifolia 4.2 143Melia azedarach 2.4 0Sideroxylon lanuginosum 1.9 31Zanthoxylum hirsutum 0.6 0
2012 MCCULLEY & JACKSON: GRASSLAND-TO-WOODLAND C & N CYCLING 309
glandulosa was the dominant woody species at the site comprising .50% of the woody basalarea (Table 1), although the two individuals with the largest basal diameters (33 and 34 cm)were both Gleditsia triacanthos. No Prosopis saplings were encountered in the woodlandunderstory, suggesting this species may eventually be replaced by other co-occurring species.Using regression equations derived from Prosopis stands from a relatively nearby site(,400 km from Riesel) to relate basal diameter to age, the Prosopis stems measured in thisstudy were 18–70 y old (Hughes et al., 2006). Using the oldest year in common of the threeoldest trees [the method employed by Hughes et al. (2006)], stand age was estimated at 61 yold, which is in line with estimates from aerial photographs that indicate trees were presenton site before 1941 (at least 62 y old at the time this study was conducted).
SOIL NUTRIENT POOLS
To verify changes in soil C and N pools with grass-to-woodland conversion at this site, weused a hydraulic soil probe to take ten 120 cm deep soil cores (4.0 cm i.d.) from randomlocations within each of the two 30 m 3 30 m plots in the grassland and the woodland inJun. of 2003. We used only non-compacted soil cores (n 5 8 and 5, for grassland andwoodland, respectively) for the following analyses. We sectioned the soil into five depthincrements: 0–10, 10–30, 30–60, 60–90, 90–120 cm. We air-dried and sieved (2 mm) thesoils, removing root fragments by hand. The soil was weighed and a sub-sample used forgravimetric water determinations. Bulk density was calculated as the water- and root-freemass of the soil divided by the volume. Additional sub-samples were ball-milled to powder,acid-treated to remove inorganic C from these marine sediment derived soils using a vapormethod (Harris et al., 2001), and analyzed for % C on a CE Instruments NC 2100 elementalanalyzer (ThermoQuest Italia). Percent N was determined in a similar manner, except onun-acidified samples, as acidification has been shown to alter measured N concentrations(Ryba and Burgess, 2002).
PLANT NUTRIENT INPUTS
We measured aboveground production (ANPP) using two techniques: peak standing cropin the grassland and litter tray collections in the woodland. We clipped five 50 3 50 cmquadrats in Sept. 2003, which gave us an estimate of aboveground grassland productionsince the Jun. 2003 haying event. We then clipped eight 50 3 50 cm quadrats in late Aug.2004, and subtracted the Sept. 2003 average biomass from the individual Aug. 2004 quadratbiomass data for aboveground grassland production estimates (Sept. 2003–Aug. 2004).Although the peak standing crop technique may be less accurate than more frequentsampling methods that track changes in live and standing dead material throughout theyear, it gives accurate results in humid temperate grassland systems, such as the sitemeasured in this study (Scurlock et al., 2002). We coupled this once-a-year grasslandsampling scheme with litter collections that occurred every 2–3 mo from 10 trays (34 cm 3
50 cm each) placed randomly throughout the woodland site. Trays were installed Jul. 2003,and all material in them (e.g., seed pods, leaves, twigs, etc.) was collected in Sept. and Nov.2003 and in Feb., May, Jun., and Sept. 2004. For the annual total woody litter productionestimates, we summed the Nov. 2003 (which included Oct. and Nov. litter) through Sept.2004 values. We also clipped four 50 3 50 cm quadrats in the woodland in late Aug. 2004 forestimates of understory herbaceous production. The average biomass and elementalcontent of this understory vegetation (on a g m22 basis) was added to that of the woodylitter production estimates to derive total woodland aboveground production values. Wewere unable to estimate wood production on the main trunk and limbs of the trees in thisstudy; however, we checked our litter tray productivity estimates with allometry-derived
310 THE AMERICAN MIDLAND NATURALIST 167(2)
aboveground productivity equations developed for Prosopis stands at a nearby site (Hugheset al., 2006) and found surprising similarity between the two (see Results for more details).Other studies have also shown that annual radial growth of woody stems accounts for a smallproportion of aboveground tree litter production (,5%, Stienaker and Wilson, 2005).
Harvested litter and biomass was oven-dried for 5 d (50 C) and weighed. The entiresample was ground in a cyclone mill, and a sub-sample was then ball milled and analyzed forC and N content on the same elemental analyzer used for the soil analysis. We calculatedthe nitrogen use efficiency (NUE) of both vegetation types as the aboveground plantproduction (g m22) divided by the amount of N in litterfall (a.k.a., the N contained in theAug. harvest period for the grassland and the combined total of the litter collections for thewoodland).
We used a modified root in-growth technique to measure belowground production inboth the grassland and woodland systems (Lauenroth, 2000). In Jul. 2003, we excavatedeight randomly placed 0–30 cm deep holes in both the grassland and woodland sites using abucket augur (11 cm i.d.). We refilled these holes with root-free silty clay soil (Austin soilseries containing 1.84% organic C and 0.16% N) collected from a nearby site. We collectedroot in-growth samples in Sept. 2003, Jun. 2004, and Sept. 2004, by driving a 4 cm i.d. soilcorer into the center of the excavated hole and extracting one 0–30 cm depth increment.After each sample extraction, more root-free soil was used to fill the holes.
Extracted root in-growth samples were oven-dried (5 d at 50 C) for storage andtransportation purposes. Within 6 mo of field collection, roots were removed using aflotation and hand-picking procedure, where DI water was added to sub-samples of each0–30 cm core to soften the soil and was then sorted and picked until all root segments.2 mm in length were extracted from the total core. The roots were then dried, weighed,ground in a ball mill, and analyzed for C and N content. Samples that contained enoughmass were further subdivided for ash determination (combusted at 500 C for 5 h in a mufflefurnace). Belowground production values were calculated as the ash-corrected sum of theJun. and Sept. 2004 sampling dates.
LITTER DECOMPOSITION
We measured decomposition rates of the dominant vegetation in both the grassland andwoodland using litterbags filled with aboveground plant material collected in Sept. 2003.Aboveground material in the grassland was collected by clipping five 50 3 50 cm randomlyplaced quadrats. All clipped material was dried (5 d at 50 C), cut into 2–4 cm pieces withgrass shears, and mixed well throughout litterbag construction. For the woodland, weremoved ,1 m long healthy limbs from the dominant species. These limbs were sectionedinto smaller pieces, dried (5 d at 50 C), and then separated into leaf and wood components(by species). Small (,2-cm diameter) twigs and stems were cut into discs and small pieces.Although we did not use senesced material for our decomposition experiment, litter bagC:N ratios (51 for grassland and 25 for woodland) were reflective of overall above- andbelowground production C:N differences between the two litter types (averaged above- andbelowground C:N values were 72 vs. 32 for grassland and woodland, respectively; Fig. 2).
Litterbags (10 3 10 cm2) constructed of fiberglass-nylon mesh (1 3 2 mm2 openings)were packed with 3.79 g of material. Both grassland and woody litterbags contained amixture of species present in each site. The grassland bags were constructed from the well-mixed composite clipped material. Woody litterbags contained a mixture of the dominantspecies leaf and wood material based on the proportion of total basal diameter covered byeach species (Table 1; material from species with ,3% basal area coverage was notincluded) and from a previous study in Prosopis-dominated woodland that showed litterfall
2012 MCCULLEY & JACKSON: GRASSLAND-TO-WOODLAND C & N CYCLING 311
was 60% leaf material and 40% wood (McCulley, 1998). We assumed a 60/40 leaf-to-woodlitter production ratio for all woody species.
A reciprocal transplant experimental design was used with the litterbags to determine ifdifferences in microclimate or decomposer communities between the two vegetation typeswere important in controlling litter decomposition rates. Grass and woody litterbags (n 5 66of each) were randomly placed on the soil surface in Nov. 2003 in both the grassland andwoodland locations and were harvested in Feb., May, Jun., and Sept. 2004 (4–6 litterbags ofeach grass and woody litter type were randomly collected per location and harvest date).Initial mass and elemental content was determined from litterbags (n 5 8 and 9 for grass andwoody bags, respectively) taken to the field in Nov. 2003 but brought immediately back to thelab. Initial and harvested litterbags were dried (5 d at 50 C); litter was removed from the bagsand weighed. We ground the material using a cyclone and ball mill and determined C, N,and ash content using previously described methods. Because litterbag samples can ac-cumulate significant quantities of soil over time, we also soil-corrected our C & N litter values(Hunt et al., 1999). We calculated the decomposition constant [on a mass (k, y21) and carbon(kc, y21) basis] over the study period by fitting the following equation to the data:
ln Xt=Xoð Þ~{kt
where Xt and Xo are the ash-free mass or carbon content of the litter at the final samplingperiod (Sept. 2004; t 5 0.83 y21) and time 0 (Nov. 2003) (Olson, 1963). In order to evaluatedifferences in N dynamics, we calculated the ratio of N remaining in the litter at each harvestperiod to that of the initial litter (on a mass basis; Nt/No).
STATISTICAL ANALYSES
We used several statistical approaches to assess the effect of grassland conversion to wood-land on the measured parameters. Because depth increments within individual soil coresare correlated, we ran a multivariate analysis of variance (MANOVA) test using a generallinear model (SAS, 1996) to determine vegetation type differences in the soil profile % C, %
N, and bulk density data. For the total 120-cm-deep soil profile C and N content (g C or Nm22) and the above- and belowground production data, we utilized a simple paired t-testprocedure employing the Satterthwaite variance calculation to test for differences betweenvegetation types. To assess litter and habitat type effects on litter decomposition rates (k andkc) and N dynamics accompanying decomposition, we ran a repeated-measures mixedmodel using harvest date, litter type (grass or woody material), and location (incubatedin grassland or woodland) as fixed effects and the rep (litter type 3 location) effect as arepeated component. For all statistics, individual soil cores, quadrats, litter collection trays,and/or litter bags from each vegetation type were considered replicates. Ideally, multiplepaired sites of woodland and adjacent grassland would have been identified and used asreplicates in this study; however, in this geographic region (an area where intensiveagriculture has historically and still is widely practiced), finding adjacent sites of unplowednative grassland and .50 y old mesquite dominated woodland was not possible. Normalityand equality of variance assumptions were checked prior to analyses of all datasets, andappropriate transformations and/or selection of statistical methods were made accordingly.
RESULTS
SOIL NUTRIENT POOLS
Consistent with previous sampling at this site (Jackson et al., 2002), total soil C pools werereduced in woodland compared to adjacent grassland by ,20% (Fig. 1). This trend, while
312 THE AMERICAN MIDLAND NATURALIST 167(2)
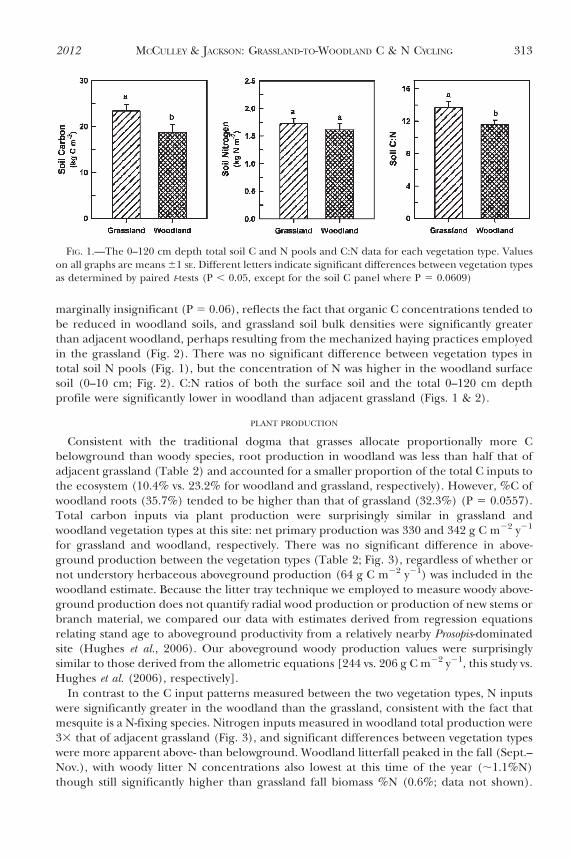
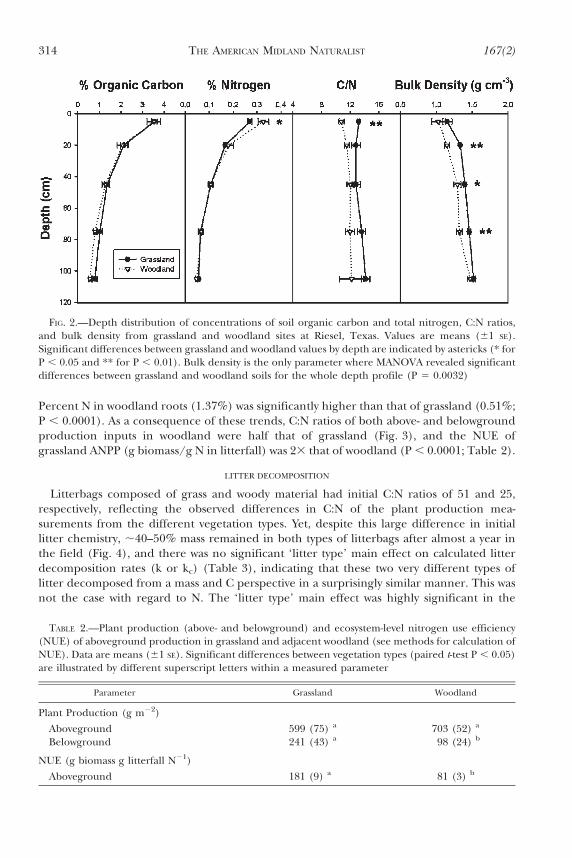
marginally insignificant (P 5 0.06), reflects the fact that organic C concentrations tended tobe reduced in woodland soils, and grassland soil bulk densities were significantly greaterthan adjacent woodland, perhaps resulting from the mechanized haying practices employedin the grassland (Fig. 2). There was no significant difference between vegetation types intotal soil N pools (Fig. 1), but the concentration of N was higher in the woodland surfacesoil (0–10 cm; Fig. 2). C:N ratios of both the surface soil and the total 0–120 cm depthprofile were significantly lower in woodland than adjacent grassland (Figs. 1 & 2).
PLANT PRODUCTION
Consistent with the traditional dogma that grasses allocate proportionally more Cbelowground than woody species, root production in woodland was less than half that ofadjacent grassland (Table 2) and accounted for a smaller proportion of the total C inputs tothe ecosystem (10.4% vs. 23.2% for woodland and grassland, respectively). However, %C ofwoodland roots (35.7%) tended to be higher than that of grassland (32.3%) (P 5 0.0557).Total carbon inputs via plant production were surprisingly similar in grassland andwoodland vegetation types at this site: net primary production was 330 and 342 g C m22 y21
for grassland and woodland, respectively. There was no significant difference in above-ground production between the vegetation types (Table 2; Fig. 3), regardless of whether ornot understory herbaceous aboveground production (64 g C m22 y21) was included in thewoodland estimate. Because the litter tray technique we employed to measure woody above-ground production does not quantify radial wood production or production of new stems orbranch material, we compared our data with estimates derived from regression equationsrelating stand age to aboveground productivity from a relatively nearby Prosopis-dominatedsite (Hughes et al., 2006). Our aboveground woody production values were surprisinglysimilar to those derived from the allometric equations [244 vs. 206 g C m22 y21, this study vs.Hughes et al. (2006), respectively].
In contrast to the C input patterns measured between the two vegetation types, N inputswere significantly greater in the woodland than the grassland, consistent with the fact thatmesquite is a N-fixing species. Nitrogen inputs measured in woodland total production were33 that of adjacent grassland (Fig. 3), and significant differences between vegetation typeswere more apparent above- than belowground. Woodland litterfall peaked in the fall (Sept.–Nov.), with woody litter N concentrations also lowest at this time of the year (,1.1%N)though still significantly higher than grassland fall biomass %N (0.6%; data not shown).
FIG. 1.—The 0–120 cm depth total soil C and N pools and C:N data for each vegetation type. Valueson all graphs are means 61 SE. Different letters indicate significant differences between vegetation typesas determined by paired t-tests (P , 0.05, except for the soil C panel where P 5 0.0609)
2012 MCCULLEY & JACKSON: GRASSLAND-TO-WOODLAND C & N CYCLING 313
Percent N in woodland roots (1.37%) was significantly higher than that of grassland (0.51%;P , 0.0001). As a consequence of these trends, C:N ratios of both above- and belowgroundproduction inputs in woodland were half that of grassland (Fig. 3), and the NUE ofgrassland ANPP (g biomass/g N in litterfall) was 23 that of woodland (P , 0.0001; Table 2).
LITTER DECOMPOSITION
Litterbags composed of grass and woody material had initial C:N ratios of 51 and 25,respectively, reflecting the observed differences in C:N of the plant production mea-surements from the different vegetation types. Yet, despite this large difference in initiallitter chemistry, ,40–50% mass remained in both types of litterbags after almost a year inthe field (Fig. 4), and there was no significant ‘litter type’ main effect on calculated litterdecomposition rates (k or kc) (Table 3), indicating that these two very different types oflitter decomposed from a mass and C perspective in a surprisingly similar manner. This wasnot the case with regard to N. The ‘litter type’ main effect was highly significant in the
FIG. 2.—Depth distribution of concentrations of soil organic carbon and total nitrogen, C:N ratios,and bulk density from grassland and woodland sites at Riesel, Texas. Values are means (61 SE).Significant differences between grassland and woodland values by depth are indicated by astericks (* forP , 0.05 and ** for P , 0.01). Bulk density is the only parameter where MANOVA revealed significantdifferences between grassland and woodland soils for the whole depth profile (P 5 0.0032)
TABLE 2.—Plant production (above- and belowground) and ecosystem-level nitrogen use efficiency(NUE) of aboveground production in grassland and adjacent woodland (see methods for calculation ofNUE). Data are means (61 SE). Significant differences between vegetation types (paired t-test P , 0.05)are illustrated by different superscript letters within a measured parameter
Parameter Grassland Woodland
Plant Production (g m22)
Aboveground 599 (75) a 703 (52) a
Belowground 241 (43) a 98 (24) b
NUE (g biomass g litterfall N21)
Aboveground 181 (9) a 81 (3) b
314 THE AMERICAN MIDLAND NATURALIST 167(2)
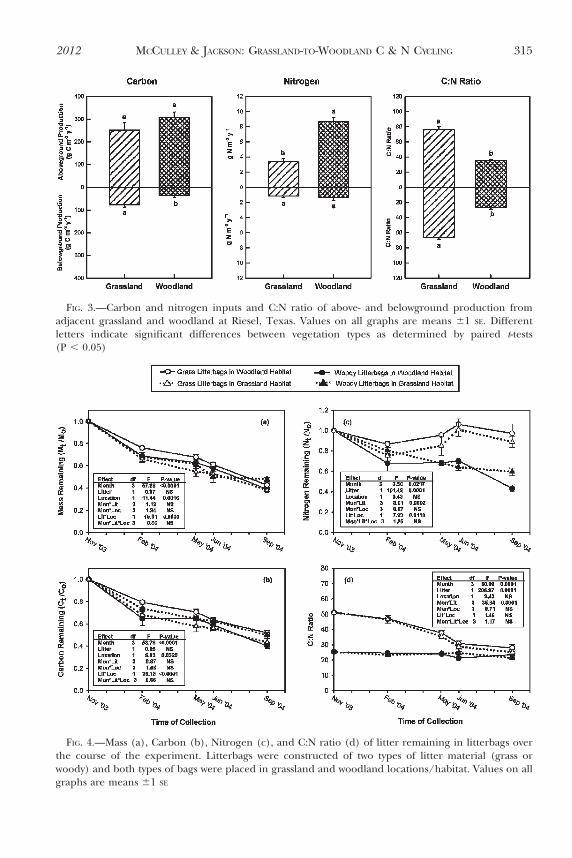
FIG. 3.—Carbon and nitrogen inputs and C:N ratio of above- and belowground production fromadjacent grassland and woodland at Riesel, Texas. Values on all graphs are means 61 SE. Differentletters indicate significant differences between vegetation types as determined by paired t-tests(P , 0.05)
FIG. 4.—Mass (a), Carbon (b), Nitrogen (c), and C:N ratio (d) of litter remaining in litterbags overthe course of the experiment. Litterbags were constructed of two types of litter material (grass orwoody) and both types of bags were placed in grassland and woodland locations/habitat. Values on allgraphs are means 61 SE
2012 MCCULLEY & JACKSON: GRASSLAND-TO-WOODLAND C & N CYCLING 315
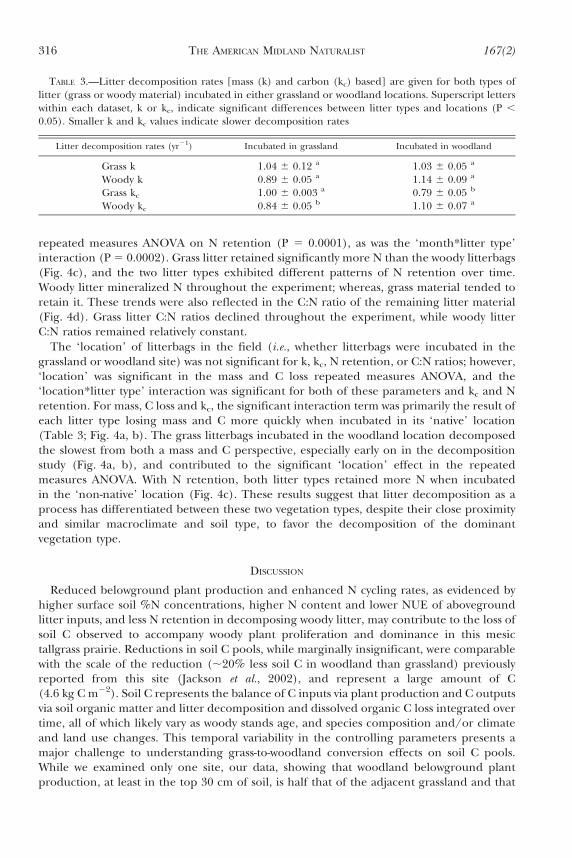
repeated measures ANOVA on N retention (P 5 0.0001), as was the ‘month*litter type’interaction (P 5 0.0002). Grass litter retained significantly more N than the woody litterbags(Fig. 4c), and the two litter types exhibited different patterns of N retention over time.Woody litter mineralized N throughout the experiment; whereas, grass material tended toretain it. These trends were also reflected in the C:N ratio of the remaining litter material(Fig. 4d). Grass litter C:N ratios declined throughout the experiment, while woody litterC:N ratios remained relatively constant.
The ‘location’ of litterbags in the field (i.e., whether litterbags were incubated in thegrassland or woodland site) was not significant for k, kc, N retention, or C:N ratios; however,‘location’ was significant in the mass and C loss repeated measures ANOVA, and the‘location*litter type’ interaction was significant for both of these parameters and kc and Nretention. For mass, C loss and kc, the significant interaction term was primarily the result ofeach litter type losing mass and C more quickly when incubated in its ‘native’ location(Table 3; Fig. 4a, b). The grass litterbags incubated in the woodland location decomposedthe slowest from both a mass and C perspective, especially early on in the decompositionstudy (Fig. 4a, b), and contributed to the significant ‘location’ effect in the repeatedmeasures ANOVA. With N retention, both litter types retained more N when incubatedin the ‘non-native’ location (Fig. 4c). These results suggest that litter decomposition as aprocess has differentiated between these two vegetation types, despite their close proximityand similar macroclimate and soil type, to favor the decomposition of the dominantvegetation type.
DISCUSSION
Reduced belowground plant production and enhanced N cycling rates, as evidenced byhigher surface soil %N concentrations, higher N content and lower NUE of abovegroundlitter inputs, and less N retention in decomposing woody litter, may contribute to the loss ofsoil C observed to accompany woody plant proliferation and dominance in this mesictallgrass prairie. Reductions in soil C pools, while marginally insignificant, were comparablewith the scale of the reduction (,20% less soil C in woodland than grassland) previouslyreported from this site (Jackson et al., 2002), and represent a large amount of C(4.6 kg C m22). Soil C represents the balance of C inputs via plant production and C outputsvia soil organic matter and litter decomposition and dissolved organic C loss integrated overtime, all of which likely vary as woody stands age, and species composition and/or climateand land use changes. This temporal variability in the controlling parameters presents amajor challenge to understanding grass-to-woodland conversion effects on soil C pools.While we examined only one site, our data, showing that woodland belowground plantproduction, at least in the top 30 cm of soil, is half that of the adjacent grassland and that
TABLE 3.—Litter decomposition rates [mass (k) and carbon (kc) based] are given for both types oflitter (grass or woody material) incubated in either grassland or woodland locations. Superscript letterswithin each dataset, k or kc, indicate significant differences between litter types and locations (P ,
0.05). Smaller k and kc values indicate slower decomposition rates
Litter decomposition rates (yr21) Incubated in grassland Incubated in woodland
Grass k 1.04 6 0.12 a 1.03 6 0.05 a
Woody k 0.89 6 0.05 a 1.14 6 0.09 a
Grass kc 1.00 6 0.003 a 0.79 6 0.05 b
Woody kc 0.84 6 0.05 b 1.10 6 0.07 a
316 THE AMERICAN MIDLAND NATURALIST 167(2)
aboveground litter C deposition and decomposition rates are similar between the twovegetation types, suggests that woodland soil C pools are unlikely to increase in the nearfuture, and they may continue to decline. Similar to prior studies (e.g., Jackson et al., 2002),these results suggest that ecosystem C storage is shifting aboveground in the conversion ofgrassland-to-woodland at this site. It is likely that woody species have deeper root productionthan was quantified in this study (30 cm). Additional work at the site with stable C isotopeshas shown significant woody plant contributions to soil organic C pools to ,2 m in depthbut not below (Jackson et al., 2002); however, both this prior work and our study indicatethat despite these deeper woody plant root contributions, total soil organic C pools at depthare similar between grassland and woodland sites.
Reduced belowground production in woodland compared to grassland, as we measuredhere, is consistent with previous studies showing greater root biomass in grass dominatedsystems (Jackson et al., 1996). Though our BNPP values are considerably lower than thosereported for prairie and adjacent aspen forests in Canada (Steinaker and Wilson, 2005),both our study and that of Steinaker and Wilson (2005) found no significant difference inthe amount of N in BNPP between the vegetation types but measured 33 larger N inputs viaANPP in woodlands than adjacent grassland. Alterations in N cycling have been implicatedas a potential mechanism enhancing plant invasions, such as trees moving into grassland(Laungani and Knops, 2009). Increased rates of N cycling with woody plant dominance ingrasslands has been reported for several woody species: mesquite (Prosopis glandulosa,Schlesinger and Pilmanis, 1998; Hibbard et al., 2001), aspen (Populus tremuloides, Wilson andKleb, 1996), oaks (Quercus spp., Reich et al., 2001), and wax myrtle (Morella cerifera, Brantleyand Young, 2008). Some of these species, including the dominant tree in our study,mesquite (Prosopis), are capable of forming symbiotic N-fixing associations with variousmicrobes (Johnson and Mayeux, 1990; Brantley and Young, 2008). In the case of oaks (andpotentially junipers), reductions in fire frequency that typically co-occur when these woodyspecies invade grassland may reduce N volatilization losses and lead to a gradual build up ofN pools and eventual increases in N availability in developing woodlands (Reich et al., 2001;McKinley and Blair, 2008). Although we did not assess N-fixation in the mesquite present atour site, elevated %N in surface soils, lower C:N ratios throughout the soil profile, higher%N in both roots and aboveground litter, lower aboveground NUE, and less N retained indecomposing litter, all suggest that N is more available and cycling more quickly in the wood-land at this site. Enhanced N availability can have varying effects on litter and soil organicmatter decomposition, depending on the chemistry of the material being degraded, overallnutrient availability at the site, and the type of microbes involved in the process (Janssens et al.,2010). It is probable that enhanced N availability directly or indirectly alters ecosystemprocesses that ultimately control soil C pools (Kirschbaum et al., 2008). Additional processoriented studies that further explore these possibilities at this site seem warranted.
The fact that aboveground litter decomposition rates were similar, on a mass and C lossbasis, between the two vegetation types was surprising; given the large and significantdifferences in initial C:N ratios of the litter. This result contradicts basic decompositiontheory that higher C:N litter should decompose more slowly than lower C:N material (Aerts,1997), and differs from previous work that has shown grass litter decomposes more quicklythan juniper and aspen litter (Kochy and Wilson, 1997; Norris et al., 2001). We did notmeasure lignin content of our litter, and given that wood was included in our woody litterbags, it is possible that higher lignin content in woody litter bags interacted with lowerC:N ratios to keep overall decomposition rates similar between the two litter types. Thesignificant ‘location’ effect in the repeated measures ANOVA for mass and C loss concurs
2012 MCCULLEY & JACKSON: GRASSLAND-TO-WOODLAND C & N CYCLING 317
with prior studies on this subject that decomposition tends to occur more rapidly in grass-dominated systems (Kochy and Wilson, 1997; Norris et al., 2001). However, it is notable thatthis ‘location’ effect was primarily driven by the slow rate of grass litter decomposition inwoodland and was not observed in the statistical analysis of k or kc parameters, perhapssuggesting that differences in decomposition rates between the two vegetation type lo-cations were not that strong. We did not quantify differences in biotic (arthropod or micro-bial) communities or environmental conditions between the two vegetation types, but suchdifferences may have contributed to the observed result that each litter type tended todecompose more rapidly when incubated in the ‘native’ habitat/location. Interactionsbetween litter quality and habitat-specific biota and microclimate may promote similar litterdecomposition rates in grassland and woodland at this site.
Perhaps the most surprising result of our study is that ANPP was similar in our grasslandand woodland sites. This finding differs markedly from recent reports of dramatic increasesin ANPP accompanying woody plant dominance in other mesic grasslands of North America(Knapp et al., 2008). According to the Knapp et al. (2008) regression of mean annual pre-cipitation versus increases in ANPP with woody plant dominance in grassland, we shouldhave seen ,800 g m22 more production in the woodland than grassland at our site. Instead,we measured ,100 g m22 difference between the two, which was not significantly differentfrom zero. While our measured woodland ANPP value is within the range reported in Knappet al. (2008) for other mesquite dominated sites, our grassland ANPP is significantly higherthan the mesic grasslands included in that work. Yet, our grassland ANPP data agree withother independent estimates of ANPP at this Riesel, TX location (Polley et al., 2007) and arewithin the range of other humid temperate grasslands worldwide (Scurlock et al., 2002).Riesel occurs in the ‘Blackland Prairie’ of Texas, an area characterized by high clay, deep,fertile soils, warm temperatures, and relatively high rainfall (Smeins and Diamond, 1983).The large amount of grassland ANPP at this site may be the product of both the abioticconditions and the relatively low intensity haying management practices employed. It ispossible that ANPP between the two vegetation types may have differed more in unusuallydry or wet years. It seems likely that differences in abiotic and edaphic conditions, agesof the woody stands, species involved, and/or management practices of the various sitesaccount for this discrepancy between our work and that of Knapp et al. (2008).
Effects of woody plant encroachment and proliferation in grassland on ecosystemprocesses can be significant and vary over time and on a site-by-site basis. This variability isprobably related to differences in species characteristics (of both the woody invaders andthe grassland species they are invading) and the abiotic and edaphic conditions andmanagement history of the sites. More complicated, multifactor models, that take theseparameters into account, may be required to accurately represent changes in ecosystemparameters that accompany woody plant encroachment and proliferation in a variety ofgrassland systems and to help develop a better understanding of when gains and losses of Cwill accompany this type of vegetation change.
Acknowledgments.—The USDA-ARS Grassland Soil and Water Research Laboratory in Temple, TXgenerously provided access to the grassland field site and lab space and equipment necessary for theresearch. We thank Mrs. Adeline Finski of Riesel, TX for allowing us access to the woodland site. Wethank Anne Gibson, Kate Budd, Will Cook, Jim Nelson, Hyrum Johnson, and Wayne Polley for theirinput and assistance throughout this project. This work was supported with funds provided by theUSDA-National Research Initiative (#2005-35101-17371) and the Kentucky Agricultural ExperimentStation (KY006045) to R.L.M. and Department of Energy’s National Institute of Global EnvironmentalChange and National Institute for Climate Change Research awards to R.B.J.
318 THE AMERICAN MIDLAND NATURALIST 167(2)
LITERATURE CITED
AERTS, R. 1997. Climate, leaf litter chemistry and leaf litter decomposition in terrestrial ecosystems: atriangular relationship. Oikos, 79:439–449.
ARCHER, S., D. S. SCHIMEL AND E. A. HOLLAND. 1995. Mechanisms of shrubland expansion: Land use,climate or CO2? Climat. Change, 29:91–99.
———, T. W. BOUTTON AND K. HIBBARD. 2001. Trees in grasslands: biogeochemical consequences ofwoody plant expansion, p. 115–138. In: E. D. Schulze, M. Heimann, S. Harrison, E. A. Holland,J. Lloyd, I. Prentice and D. S. Schimel (eds.). Global Biogeochemical Cycles in the ClimateSystem. Academic Press, San Diego, California.
BOUTTON, T. W., S. ARCHER, A. J. MIDWOOD, S. F. ZITZER AND R. BOL. 1998. d13C values of soil organiccarbon and their use in documenting vegetation change in a subtropical savanna ecosystem.Geoderma, 82:5–41.
BRANTLEY, S. T. AND D. R. YOUNG. 2008. Shifts in litterfall and dominant nitrogen sources after expansionof shrub thickets. Oecologia, 155:337–345.
——— AND ———. 2010. Shrub expansion stimulates soil C and N storage along a coastal soilchronosequence. Glob. Change Biol., 16:2052–2061.
BRIGGS, J. M., A. K. KNAPP, J. M. BLAIR, J. L. HEISLER, G. A. HOCH, M. S. LETT AND J. K. MCCARRON. 2005. Anecosystem in transition: Causes and consequences of the conversion of mesic grassland toshrubland. BioScience, 55:243–254.
DIGGS, G., B. LIPSCOMB AND R. O’KENNON. 1999. Shinners and Mahler’s Illustrated Flora of North CentralTexas Botanical Research Institute of Texas. Fort Worth, Texas.
FONTAINE, S., G. BARDOUX, D. BENEST, B. VERDIER, A. MARIOTTI AND L. ABBADIE. 2004. Mechanisms of thepriming effect in a savannah soil amended with cellulose. Soil Sci. Soc. Am. J., 68:125–131.
GUO, L. B. AND R. M. GIFFORD. 2002. Soil carbon stocks and land use change: a meta analysis. Glob. ChangeBiol., 8:345–360.
HARCOMBE, P. A., G. N. CAMERON AND E. G. GLUMAC. 1993. Above-ground net primary production inadjacent grassland and woodland on the coastal prairie of Texas, USA. J. Veg. Sci., 4:521–530.
HARRIS, D., W. R. HORWATH AND C. VAN KESSEL. 2001. Acid fumigation of soils to remove carbonates priorto total organic carbon or carbon-13 isotopic analysis. Soil Sci. Soc. Am. J., 65:1853–1856.
HIBBARD, K., S. ARCHER, D. S. SCHIMEL AND D. W. VALENTINE. 2001. Biogeochemical changes accompanyingwoody plant encroachment in a subtropical savanna. Ecology, 82:1999–2011.
HUGHES, R. F., S. ARCHER, G. P. ASNER, C. WESSMAN, C. R. MCMURTRY, J. A. NELSON AND R. J. ANSLEY. 2006.Changes in aboveground primary production and carbon and nitrogen pools accompanyingwoody plant encroachment in a temperate savanna. Glob. Change Biol., 12:1733–1747.
HUNT, H. W., D. E. REUSS AND E. T. ELLIOTT. 1999. Correcting estimates of root chemical composition forsoil contamination. Ecology, 80:702–707.
JACKSON, R. B., J. L. BANNER, E. G. JOBBAGY, W. T. POCKMAN AND D. H. WALL. 2002. Ecosystem carbon losswith woody plant invasion of grasslands. Nature, 418:623–626.
———, K. A. FARLEY, W. A. HOFFMAN, E. G. JOBBAGY AND R. L. MCCULLEY. 2007. Ch. 19: Carbon and watertradeoffs in conversions to forests and shrublands, p. 237–246. In: J. Canadell, D. E. Patakiand F. Louis (eds.). Terrestrial Ecosystems in a Changing World. Springer, Cambridge,Massachusetts.
———, J. CANADELL, J. R. EHLERINGER, H. A. MOONEY, O. E. SALA AND E. D. SCHULZE. 1996. A global analysisof root distributions for terrestrial biomes. Oecologia, 108:389–411.
JANSSENS, I. A., W. DIELEMAN, S. LUYSSAERT, J.-A. SUBKE, M. REICHSTEIN, R. CEULEMANS, P. CIAIS, A. J. DOLMAN, J.GRACE, G. MATTEUCCI, D. PAPALE, S. L. PIAO, E.-D. SCHULZE, J. TANG AND B. E. LAW. 2010. Reductionof forest soil respiration in response to nitrogen deposition. Nat. Geosci., 3:315–322.
JOHNSON, H. B. AND H. S. MAYEUX. 1990. Prosopis glandulosa and the nitrogen balance of rangelands:extent and occurrence of nodulation. Oecologia, 84:176–185.
KIRSCHBAUM, M. U. F., L. B. GUO AND R. M. GIFFORD. 2008. Why does rainfall affect the trend in soil carbonafter converting pastures to forests?: A possible explanation based on nitrogen dynamics. For.Ecol. Manag., 255:2990–3000.
2012 MCCULLEY & JACKSON: GRASSLAND-TO-WOODLAND C & N CYCLING 319
KNAPP, A. K., J. M. BRIGGS, S. L. COLLINS, S. ARCHER, M. S. BRET-HARTE, B. E. EWERS, D. P. C. PETERS, D. R.YOUNG, G. R. SHAVER, E. PENDALL AND M. B. CLEARY. 2008. Shrub encroachment in NorthAmerican grasslands: Shifts in growth form dominance rapidly alters control of ecosystemcarbon inputs. Glob. Change Biol., 14:615–623.
KNORR, M., S. D. FREY AND P. S. CURTIS. 2005. Nitrogen additions and litter decomposition: A meta-analysis. Ecology, 86:3252–3257.
KOCHY, M. AND S. D. WILSON. 1997. Litter decomposition and nitrogen dynamics in aspen forest andmixed-grass prairie. Ecology, 78:732–739.
LAUENROTH, W. K. 2000. Methods of estimating belowground net primary production, p. 58–71. In: O. E.Sala, R. B. Jackson, H. A. Mooney and H. W. Howarth (eds.). Methods in Ecosystem Science.Springer-Verlag, New York, New York.
LAUNGANI, R. AND J. M. H. KNOPS. 2009. Species-driven changes in nitrogen cycling can provide amechanism for plant invasions. P. Natl. Acad. Sci. USA, 106:12400–12405.
LETT, M. S., A. K. KNAPP, J. M. BRIGGS AND J. M. BLAIR. 2004. Influence of shrub encroachment onaboveground net primary productivity and carbon and nitrogen pools in a mesic grassland.Can. J. Bot., 82:1363–1370.
MCCARRON, J. K., A. K. KNAPP AND J. M. BLAIR. 2003. Soil C and N responses to woody plant expansion in amesic grassland. Plant Soil, 257:183–192.
MCCLARAN, M. P., J. MOORE-KUCERA, D. A. MARTENS, J. VAN HAREN AND S. E. MARSH. 2008. Soil carbon andnitrogen in relation to shrub size and death in a semi-arid grassland. Geoderma, 145:60–68.
MCCULLEY, R. L. 1998. Soil respiration and microbial biomass in a savanna parkland landscape: spatio-temporal variation and environmental controls. Thesis, Department of Rangeland Ecology andManagement, Texas A&M University, College Station, Texas. 102 p.
———, S. ARCHER, T. W. BOUTTON, F. M. HONS AND D. A. ZUBERER. 2004. Soil respiration and nutrientcycling in wooded communities developing in grassland. Ecology, 85:2804–2817.
MCKINLEY, D. C. AND J. M. BLAIR. 2008. Woody plant encroachment by Juniperus virginiana in a mesicnative grassland promotes rapid carbon and nitrogen accrual. Ecosystems, 11:454–468.
NORRIS, M. D., J. M. BLAIR AND L. C. JOHNSON. 2001. Land cover change in eastern Kansas: litter dynamicsof closed-canopy eastern redcedar forests in tallgrass prairie. Can. J. Bot., 79:214–222.
OLSON, J. S. 1963. Energy storage and the balance of producers and decomposers in ecological systems.Ecology, 44:322–331.
PACALA, S. W., G. C. HURTT, D. BAKER, P. PEYLIN, R. A. HOUGHTON, R. A. BIRDSEY, L. HEATH, E. T. SUNDQUIST,R. F. STALLARD, P. CIAIS, P. MOORCROFT, J. P. CASPERSEN, E. SHEVLIAKOVA, B. MOORE, G. KOHLMAIER,E. A. HOLLAND, M. GLOOR, M. E. HARMON, S. M. FAN, J. L. SARMIENTO, C. L. GOODALE, D. S. SCHIMEL
AND C. B. FIELD. 2001. Consistent land- and atmosphere-based U.S. carbon sink estimates.Science, 292:2316–2320.
POLLEY, H. W., B. J. WILSEY AND J. D. DERNER. 2007. Dominant species constrain effects of species diversityon temporal variabilit in biomass production of tallgrass prairie. Oikos, 116:2044–2052.
REICH, P. B., D. W. PETERSON, D. WEDIN AND K. WRAGE. 2001. Fire and vegetation effects on productivityand nitrogen cycling across a forest-grassland continuum. Ecology, 82:1703–1719.
RYBA, S. A. AND R. M. BURGESS. 2002. Effects of sample preparation on the measurement of organiccarbon, hydrogen, nitrogen, sulfur, and oxygen concentrations in marine sediments.Chemosphere, 48:139–147.
SAS. 1996. SAS for Windows, version 6.11. Cary, North Carolina.SCHLESINGER, W. H. AND A. M. PILMANIS. 1998. Plant-soil interactions in deserts. Biogeochemistry, 42:169–187.———, J. F. REYNOLDS, G. L. CUNNINGHAM, L. F. HUENNEKE, W. M. JARRELL, R. A. VIRGINIA AND W. G.
WHITFORD. 1990. Biological feedbacks in global desertification. Science, 247:1043–1048.SCURLOCK, J. M. O., K. JOHNSON AND R. J. OLSON. 2002. Estimating net primary productivity from grassland
biomass dynamics measurements. Glob. Change Biol., 8:736–753.SMEINS, F. E. AND D. D. DIAMOND. 1983. Remnant grasslands of the Fayette Prairie, Texas. Am. Midl. Nat.,
110:1–13.SMITH, D. L. AND L. C. JOHNSON. 2003. Expansion of Juniperus virginiana L. in the Great Plains: Changes in
soil organic carbon dynamics. Glob. Biogeochem. Cy., 17:1062.
320 THE AMERICAN MIDLAND NATURALIST 167(2)

——— AND ———. 2004. Vegetation-mediated changes in microclimate reduce soil respiration aswoodlands expand into grasslands. Ecology, 85:3348–3361.
STEINAKER, D. F. AND S. D. WILSON. 2005. Belowground litter contributions to nitrogen cycling at anorthern grassland-forest boundary. Ecology, 86:2825–2833.
VETAAS, O. R. 1992. Micro-site effects of trees and shrubs in dry savannas. J. Veg. Sci., 3:337–344.WALDROP, M. P. AND M. K. FIRESTONE. 2004. Microbial community utilization of recalcitrant and simple
carbon compounds: impact of oak-woodland plant communities. Oecologia, 138:275–284.WESSMAN, C., S. ARCHER, L. JOHNSON AND G. ASNER. 2004. Woodland expansion in US grasslands: assessing
land-cover change and biogeochemical impacts, p. 185–208. In: G. Gutman and M. A.Cochrane (eds.). Land Change Science: Observing, Monitoring and Understanding Trajec-tories of Change on the Earth’s Surface. Kluwer Academic Publishers, New York.
WILSON, S. D. AND H. R. KLEB. 1996. The influence of prairie and forest vegetation on soil moisture andavailable nitrogen. Am. Midl. Nat., 136:222–231.
SUBMITTED 22 JUNE 2010 ACCEPTED 12 OCTOBER 2012
2012 MCCULLEY & JACKSON: GRASSLAND-TO-WOODLAND C & N CYCLING 321