converging lens
DESCRIPTION
Converging Lens. Xiaoya Wu Marguerite Daw. Purpose. Examine the relationship between : object distance vs. image distance object height vs. image height image height vs. object distance. Hypothesis. As object distance increases, image distance decreases - PowerPoint PPT PresentationTRANSCRIPT

Converging Lens
Xiaoya WuMarguerite Daw
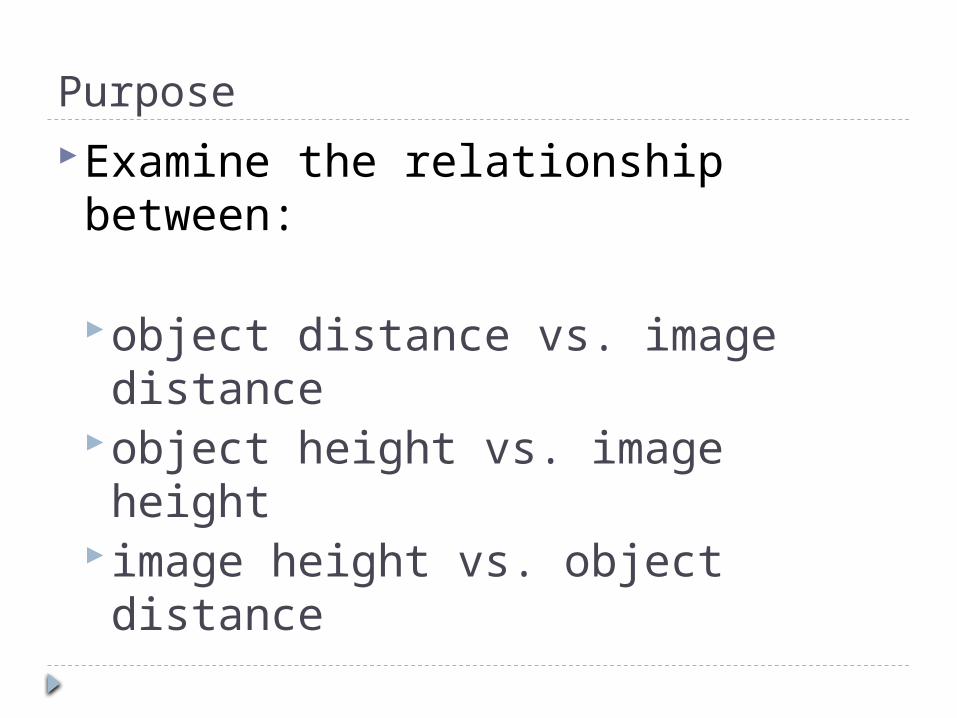
PurposeExamine the relationship between:
object distance vs. image distance
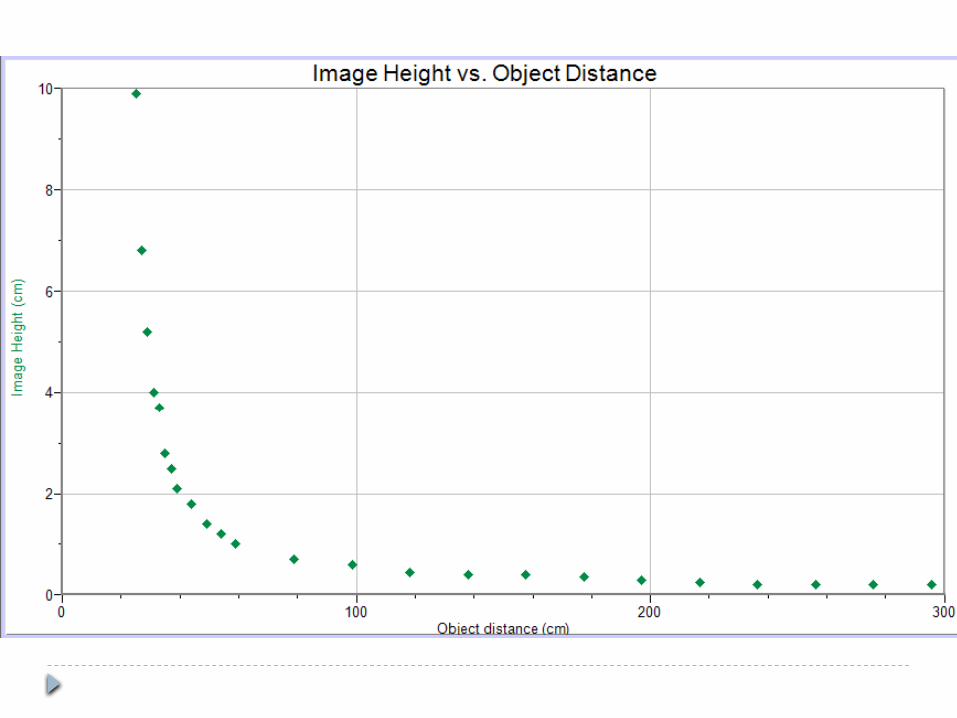
object height vs. image height image height vs. object distance
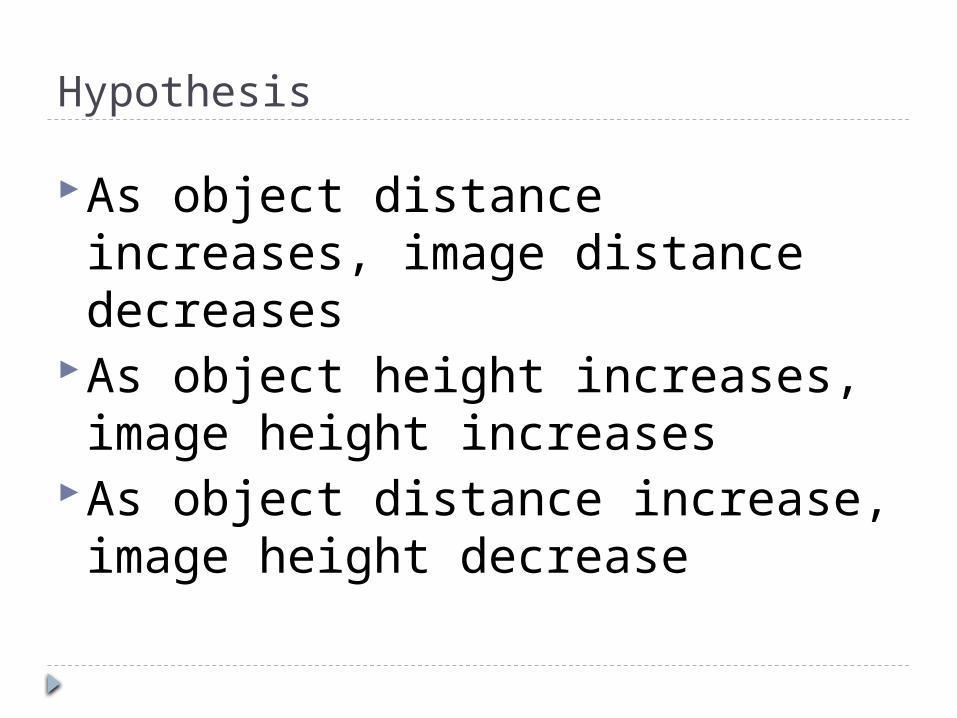
Hypothesis
As object distance increases, image distance decreases
As object height increases, image height increases
As object distance increase, image height decrease
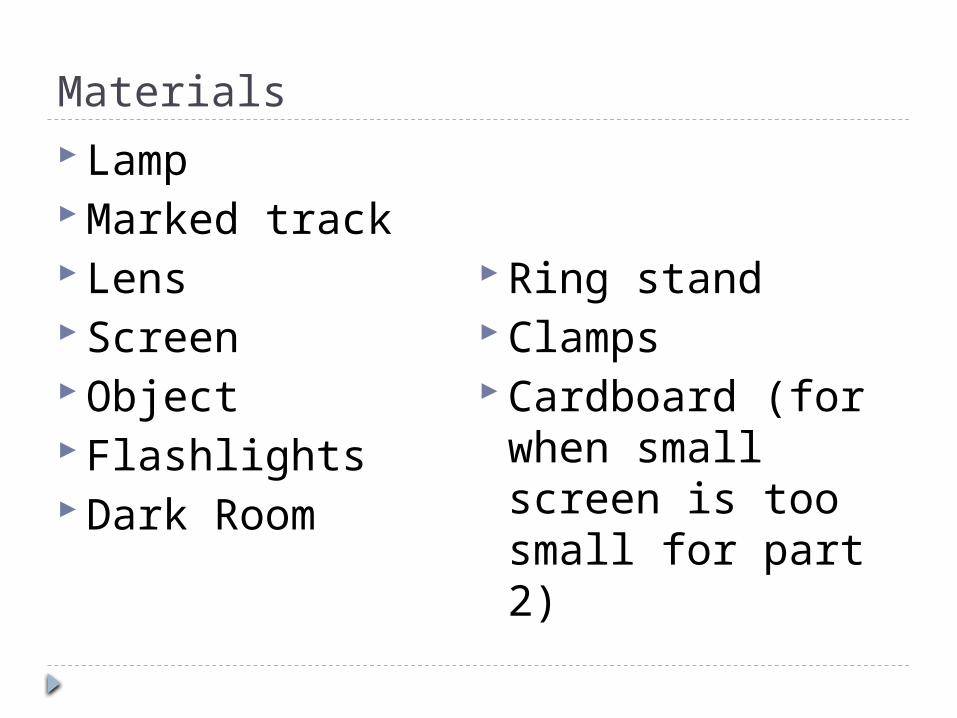
Materials Lamp Marked track Lens Screen Object Flashlights Dark Room
Ring stand Clamps Cardboard (for
when small screen is too small for part 2)
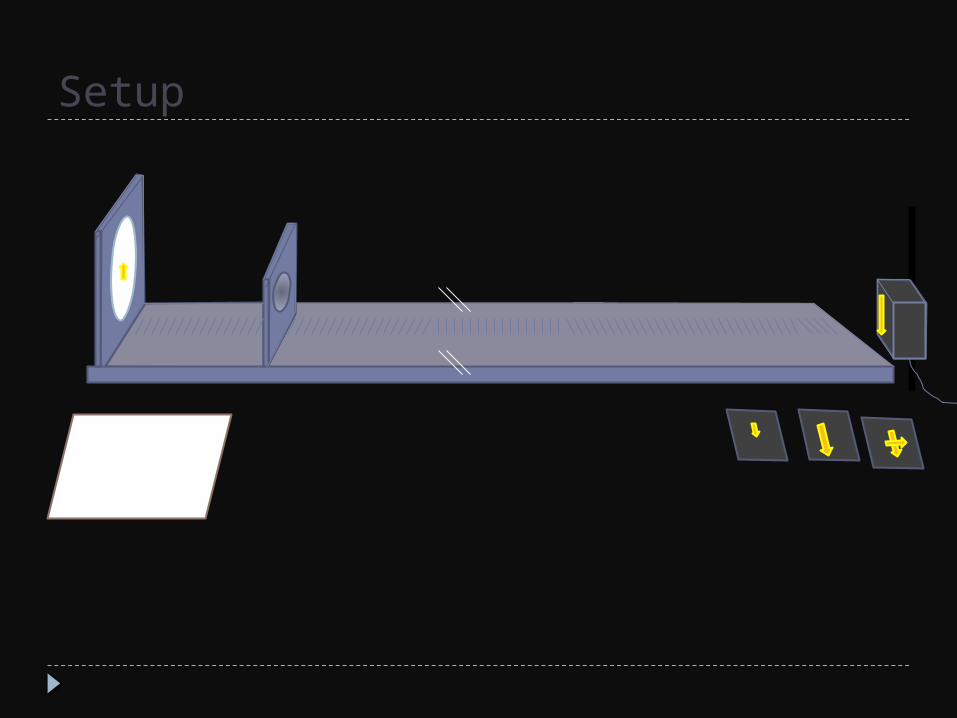
Setup
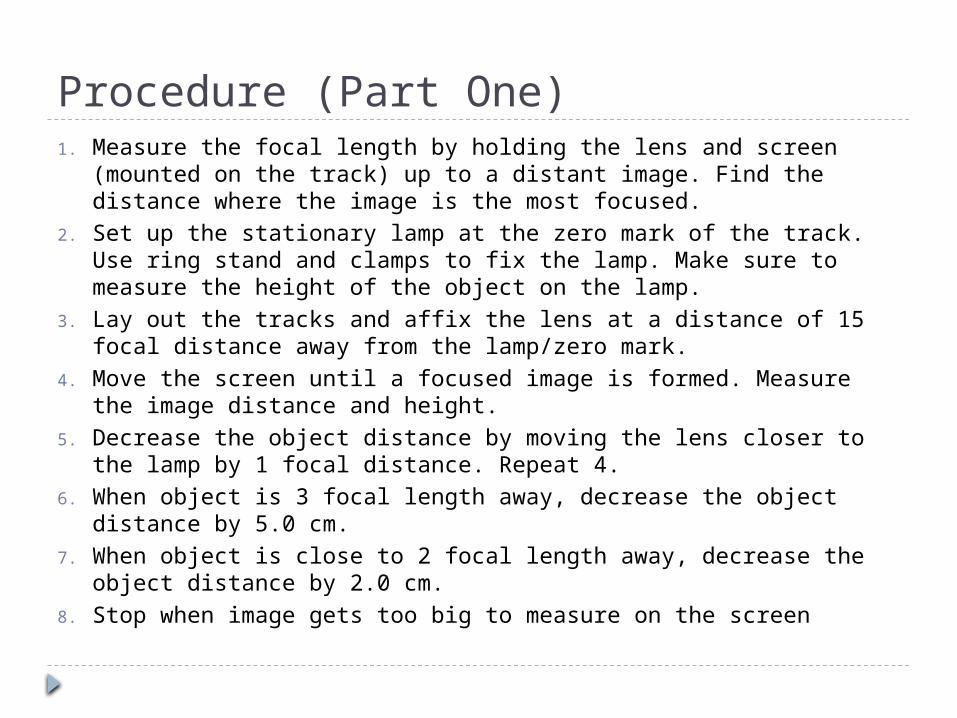
Procedure (Part One)1. Measure the focal length by holding the lens and screen (mounted
on the track) up to a distant image. Find the distance where the image is the most focused.
2. Set up the stationary lamp at the zero mark of the track. Use ring stand and clamps to fix the lamp. Make sure to measure the height of the object on the lamp.
3. Lay out the tracks and affix the lens at a distance of 15 focal distance away from the lamp/zero mark.
4. Move the screen until a focused image is formed. Measure the image distance and height.
5. Decrease the object distance by moving the lens closer to the lamp by 1 focal distance. Repeat 4.
6. When object is 3 focal length away, decrease the object distance by 5.0 cm.
7. When object is close to 2 focal length away, decrease the object distance by 2.0 cm.
8. Stop when image gets too big to measure on the screen
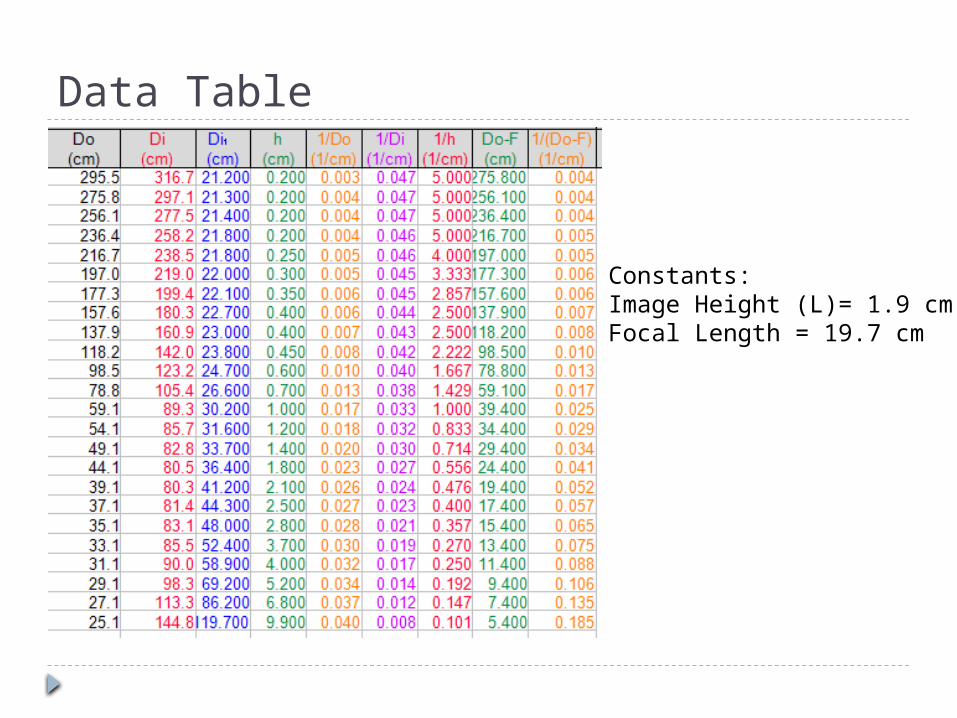
Data Table
Constants:Image Height (L)= 1.9 cmFocal Length = 19.7 cm
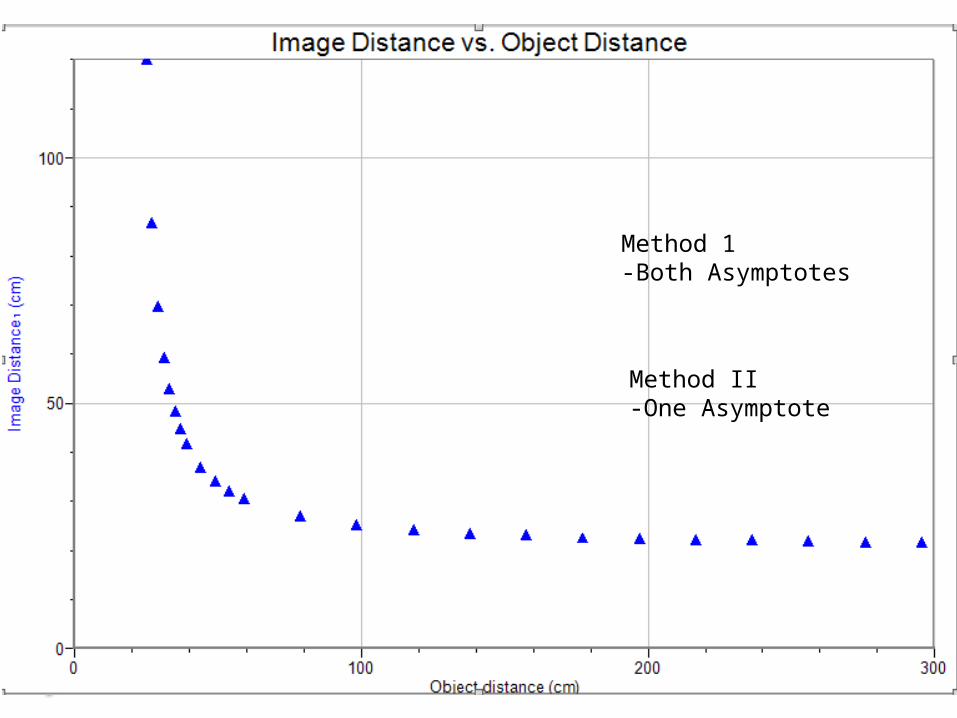
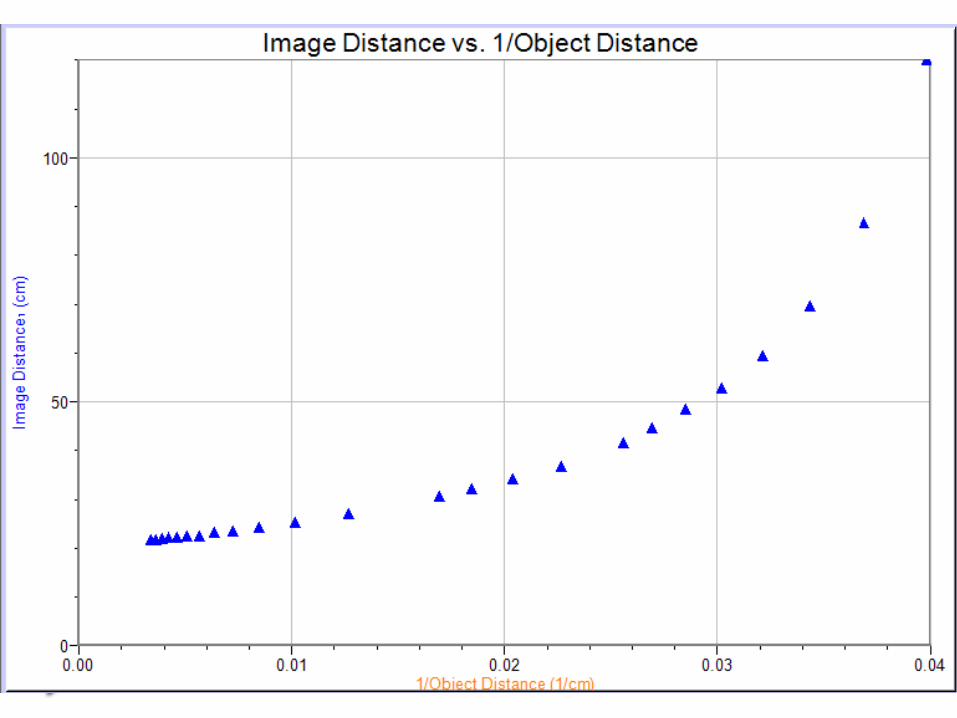
Method 1-Both Asymptotes
Method II-One Asymptote
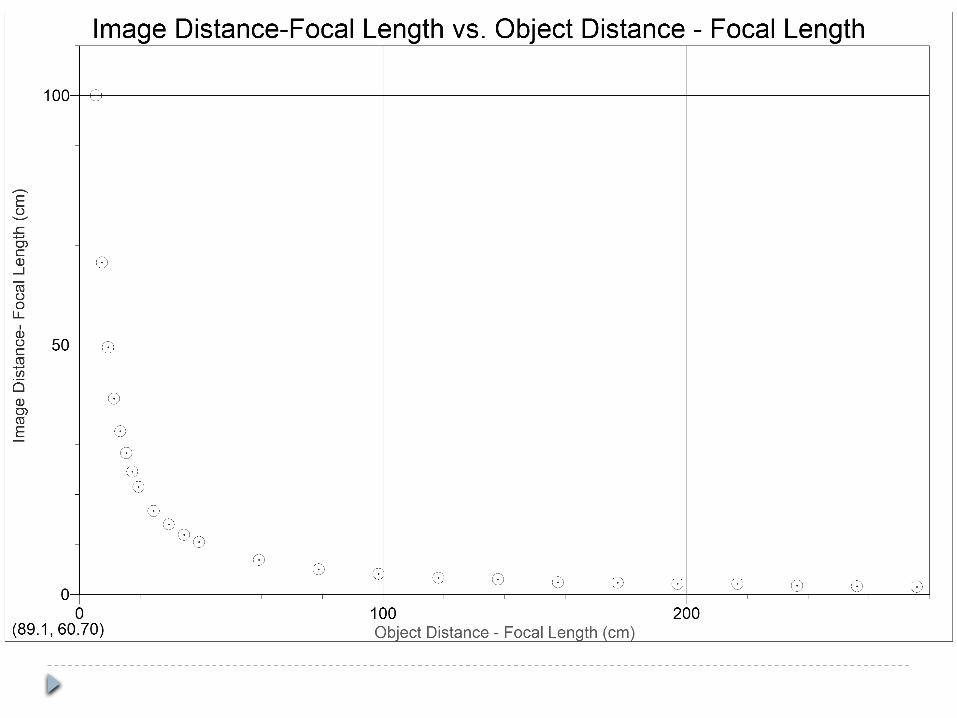
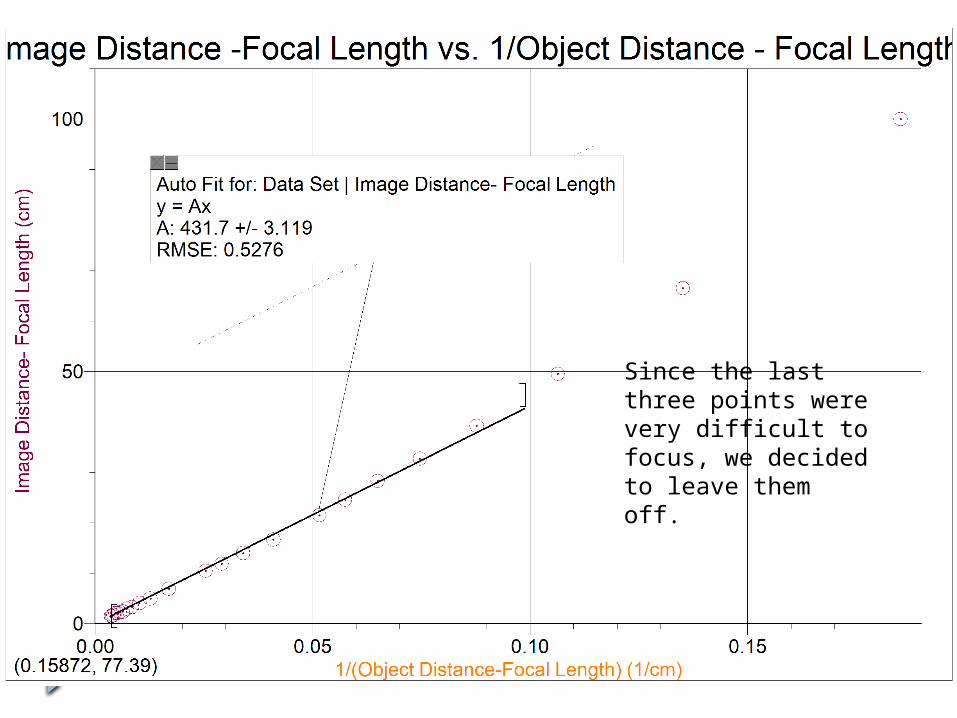
Since the last three points were very difficult to focus, we decided to leave them off.

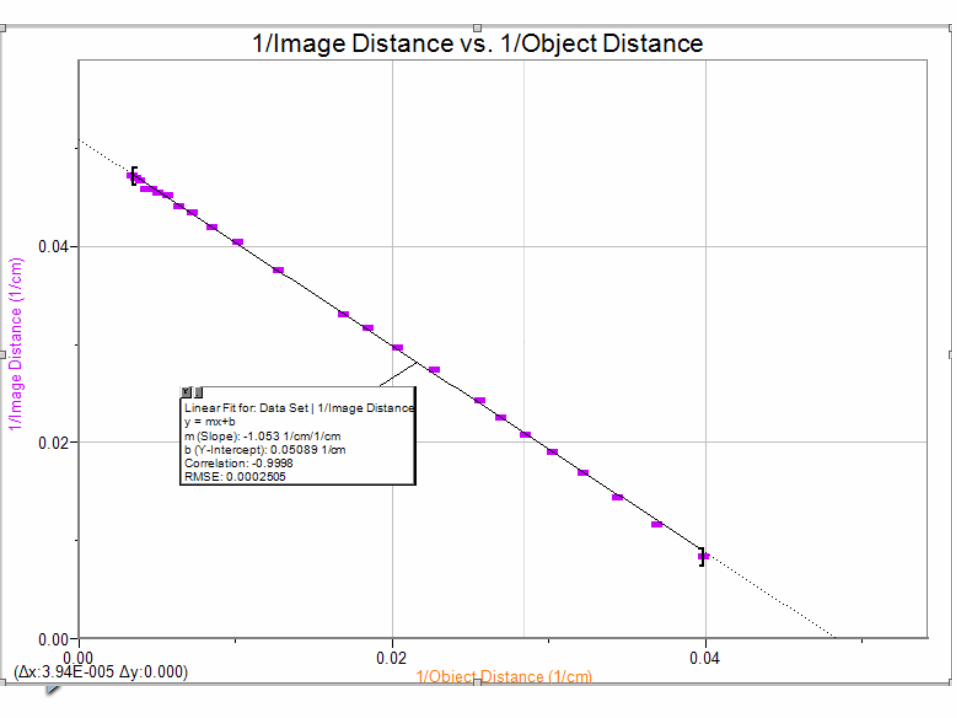
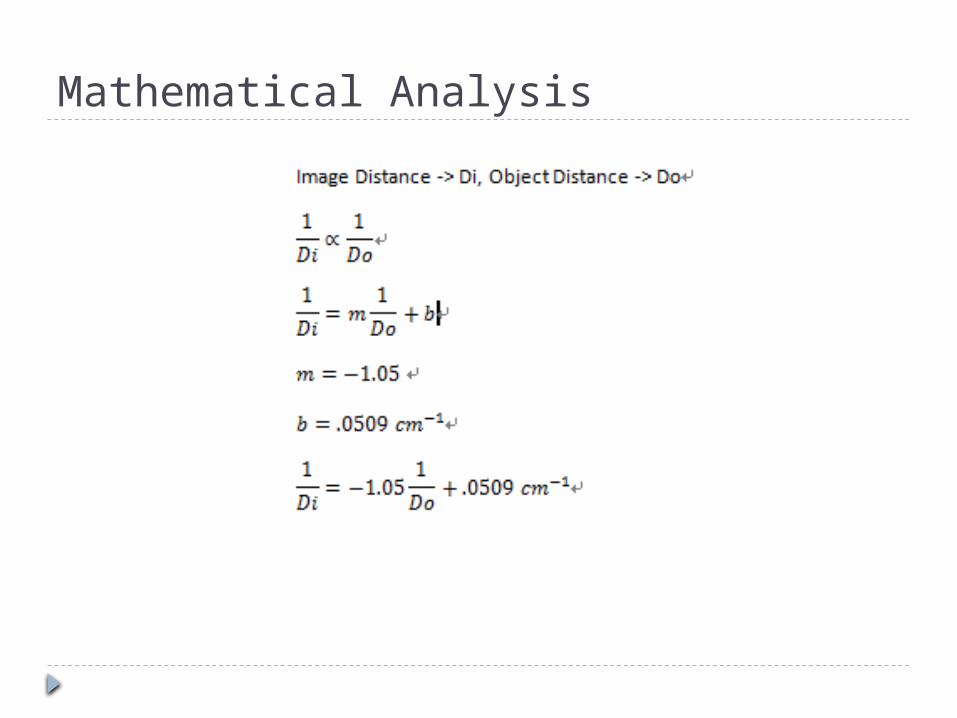
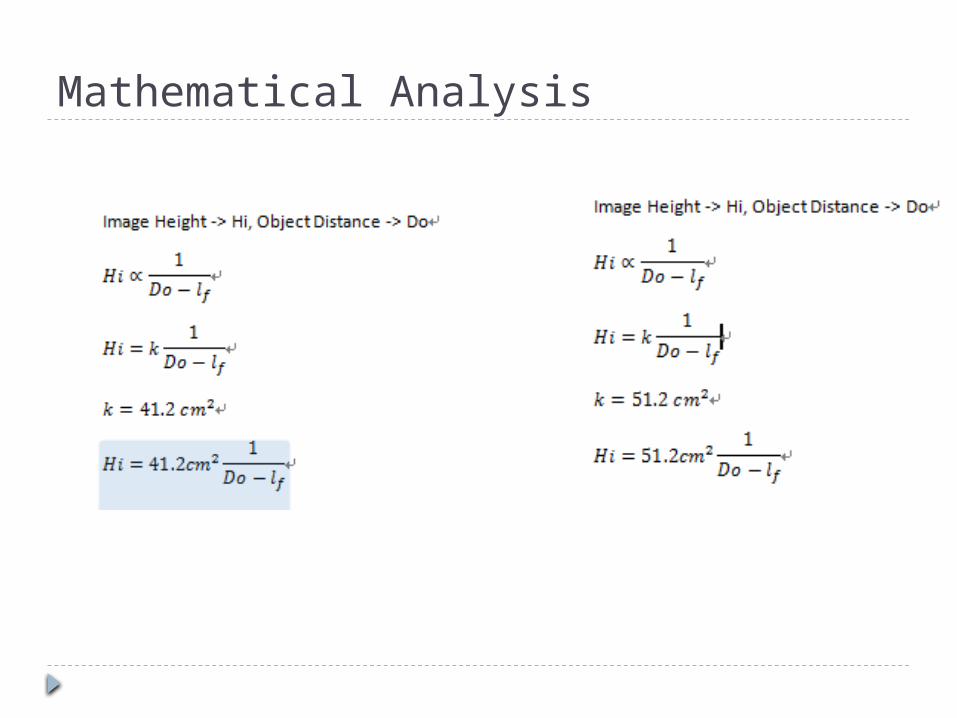
Mathematical Analysis
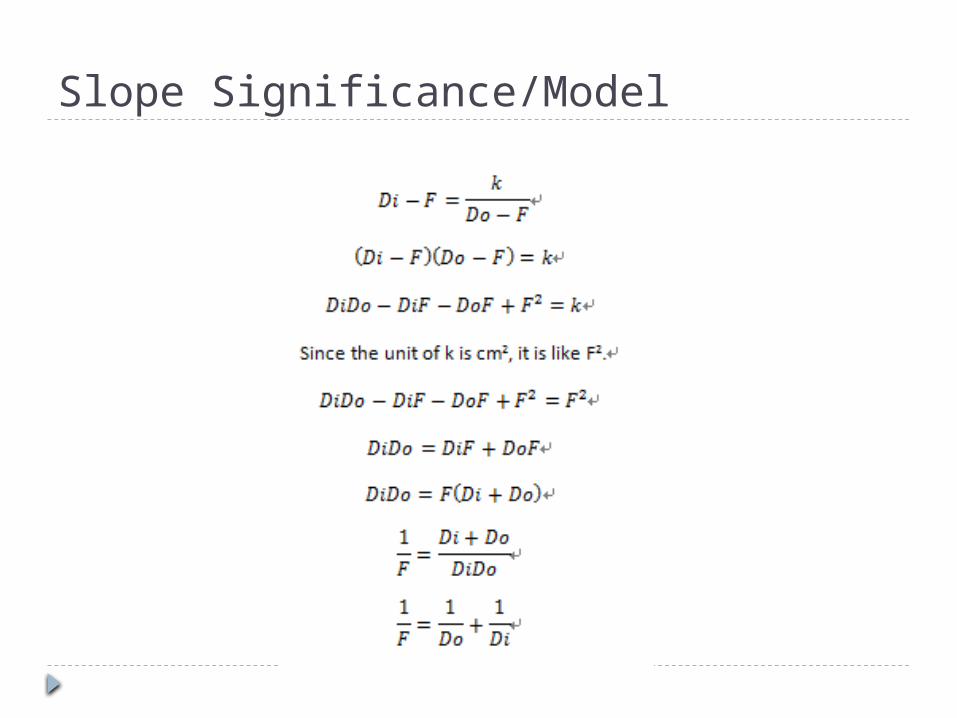
Slope Significance/Model
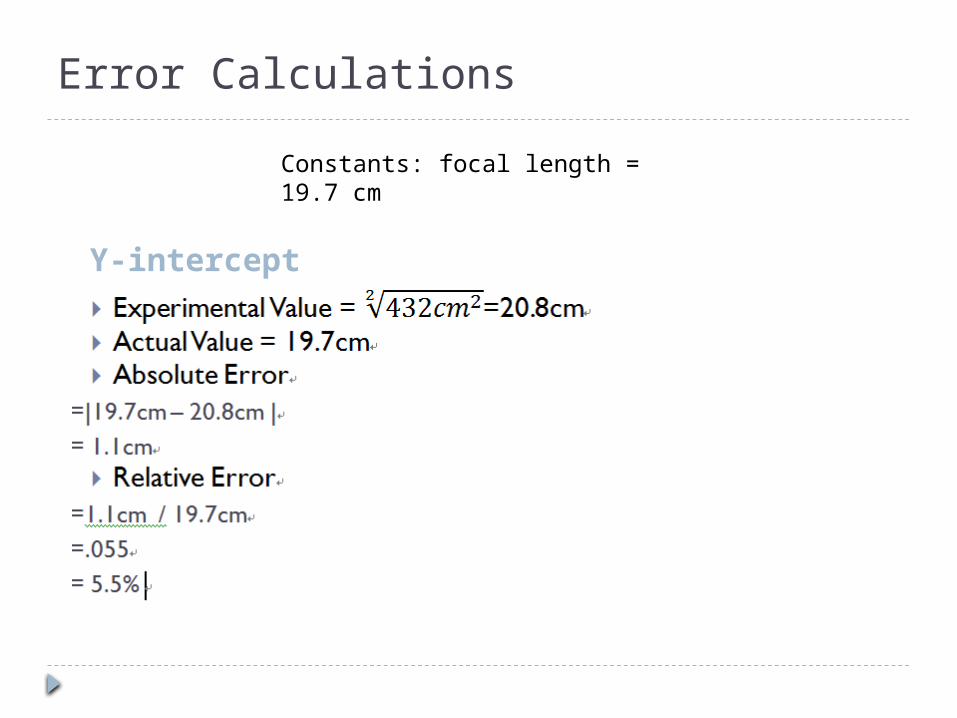
Error Calculations
Y-intercept
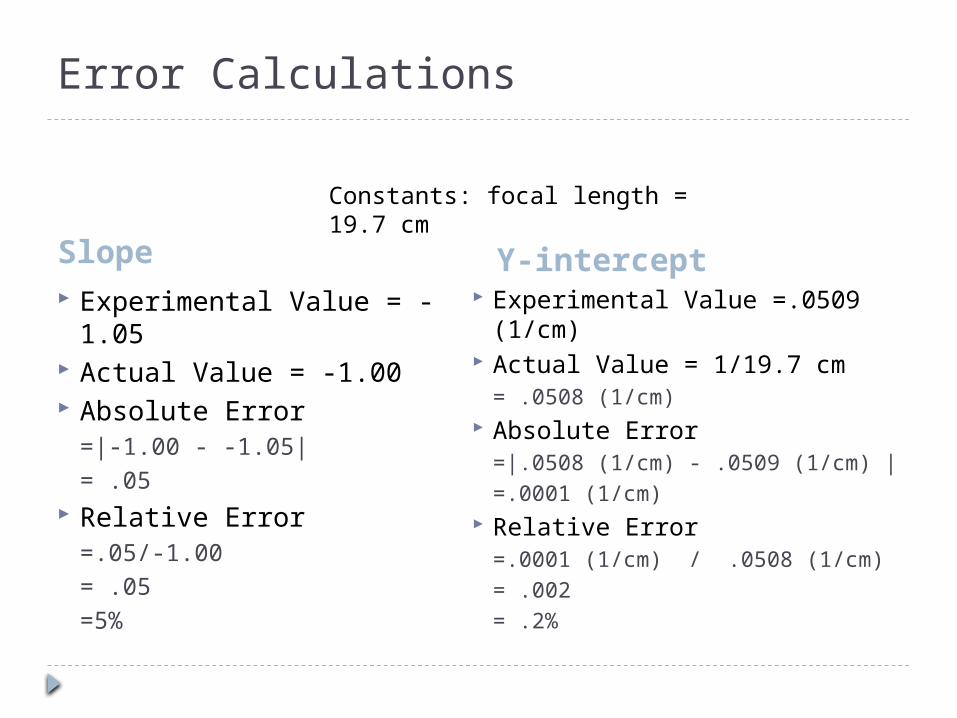
Constants: focal length = 19.7 cm
Mathematical Analysis
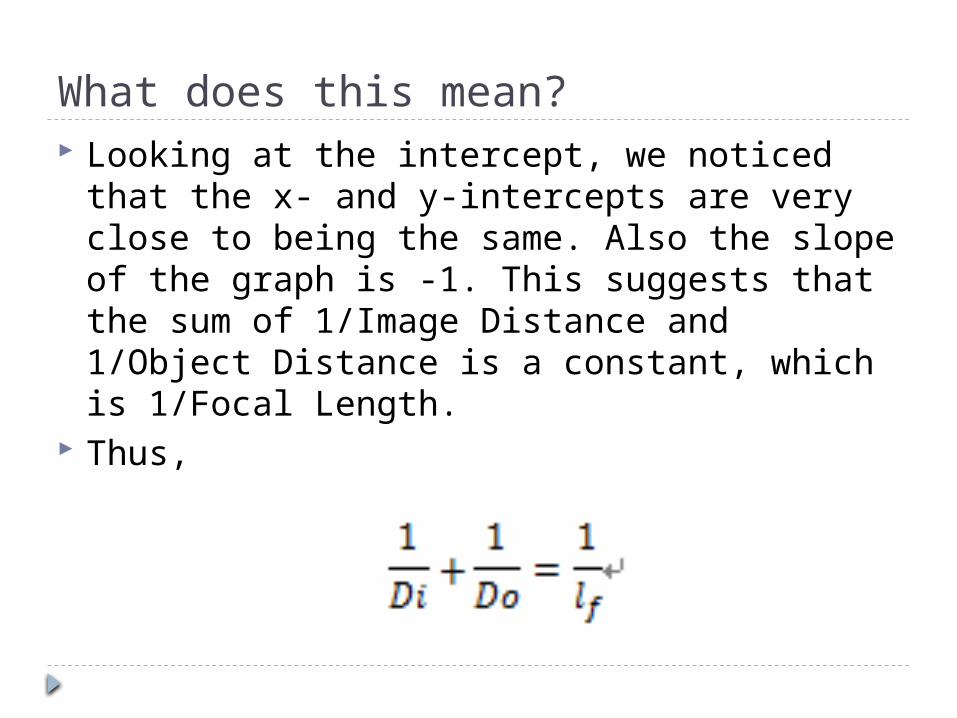
What does this mean? Looking at the intercept, we noticed that the
x- and y-intercepts are very close to being the same. Also the slope of the graph is -1. This suggests that the sum of 1/Image Distance and 1/Object Distance is a constant, which is 1/Focal Length.
Thus,
Error Calculations
Slope Y-intercept Experimental Value = -1.05 Actual Value = -1.00 Absolute Error
=|-1.00 - -1.05|= .05
Relative Error=.05/-1.00= .05=5%
Experimental Value =.0509 (1/cm) Actual Value = 1/19.7 cm
= .0508 (1/cm) Absolute Error
=|.0508 (1/cm) - .0509 (1/cm) |=.0001 (1/cm)
Relative Error=.0001 (1/cm) / .0508 (1/cm)= .002= .2%
Constants: focal length = 19.7 cm
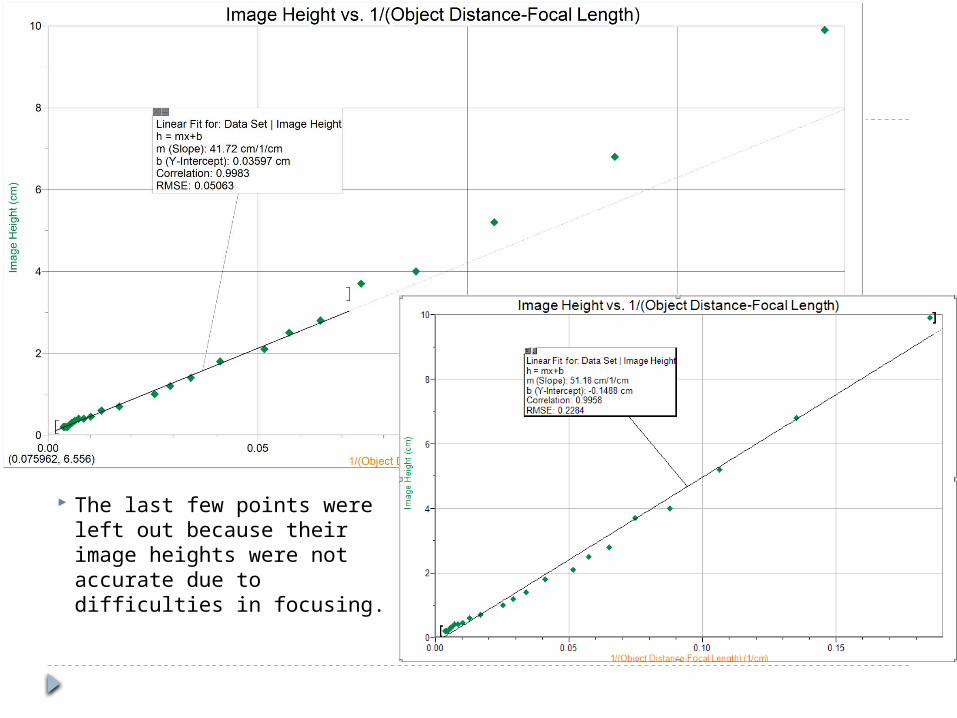
The last few points were left out because their image heights were not accurate due to difficulties in focusing.
Mathematical Analysis
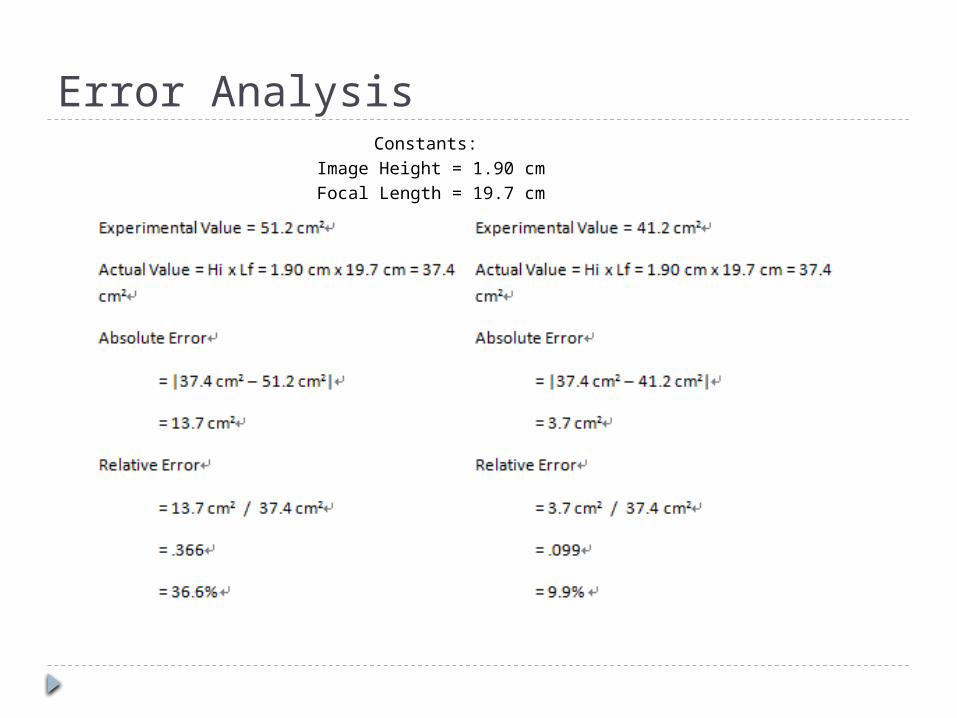
Error AnalysisConstants:
Image Height = 1.90 cmFocal Length = 19.7 cm
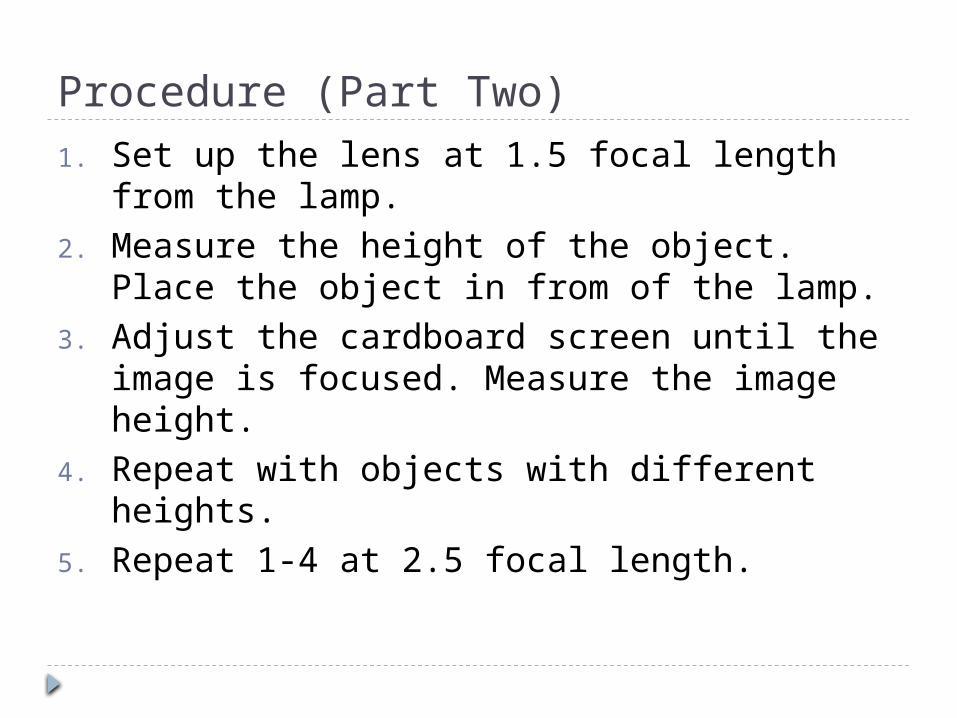
Procedure (Part Two)1. Set up the lens at 1.5 focal length from the
lamp.2. Measure the height of the object. Place the
object in from of the lamp.3. Adjust the cardboard screen until the image
is focused. Measure the image height.4. Repeat with objects with different heights.5. Repeat 1-4 at 2.5 focal length.
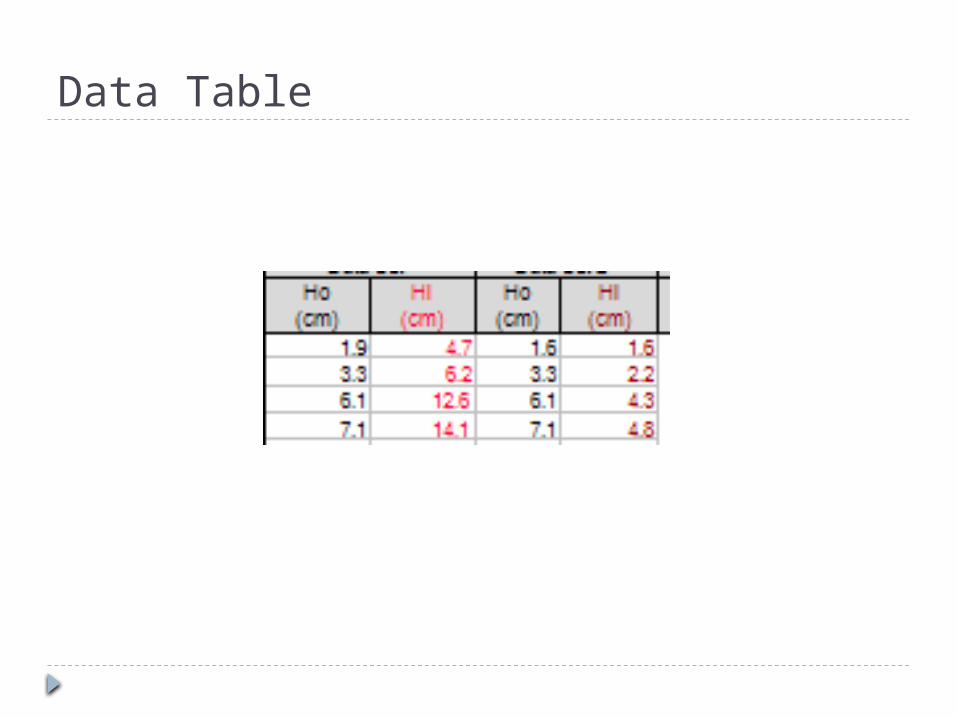
Data Table
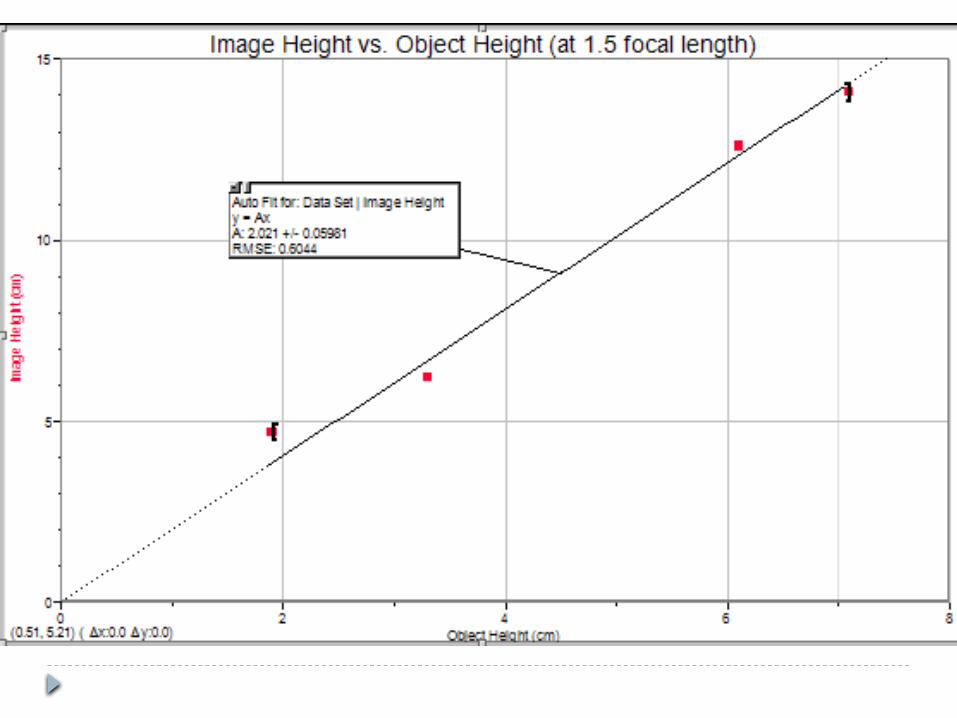
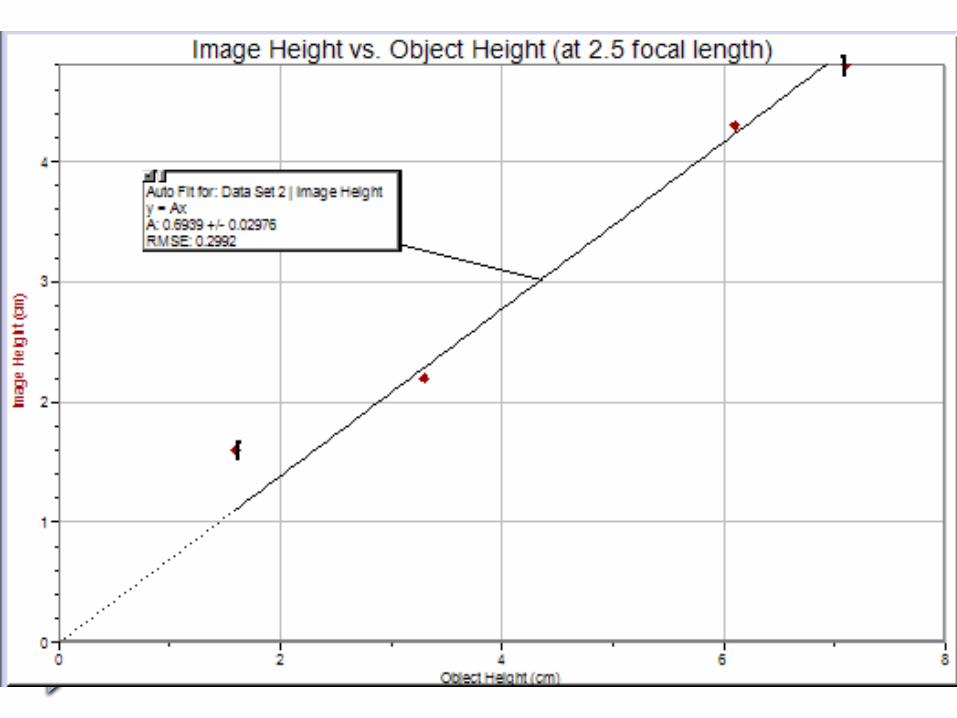
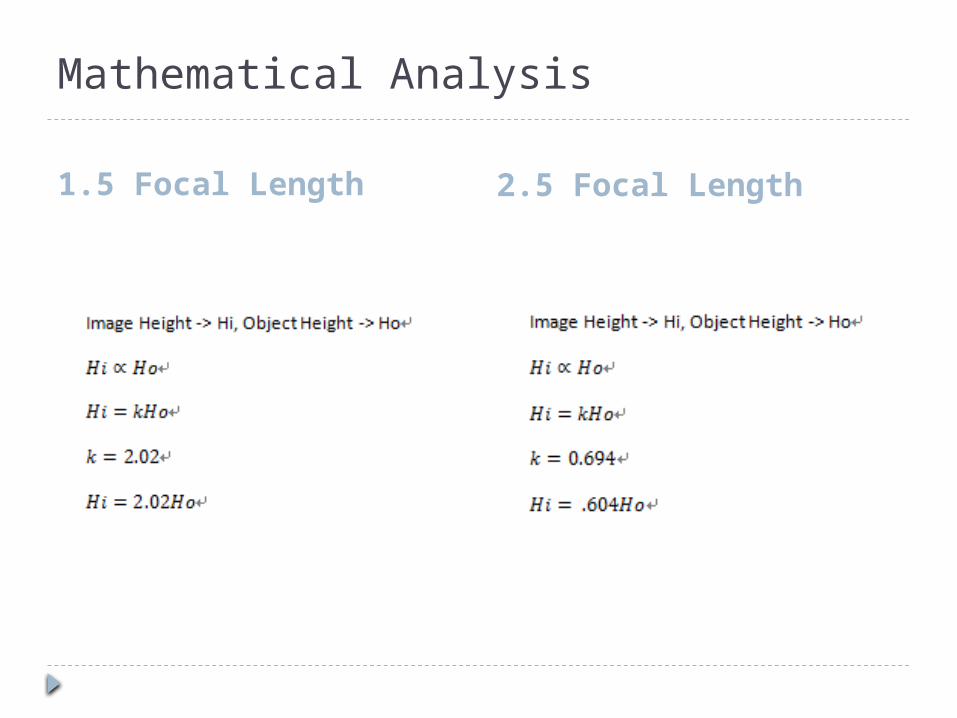
Mathematical Analysis
1.5 Focal Length 2.5 Focal Length
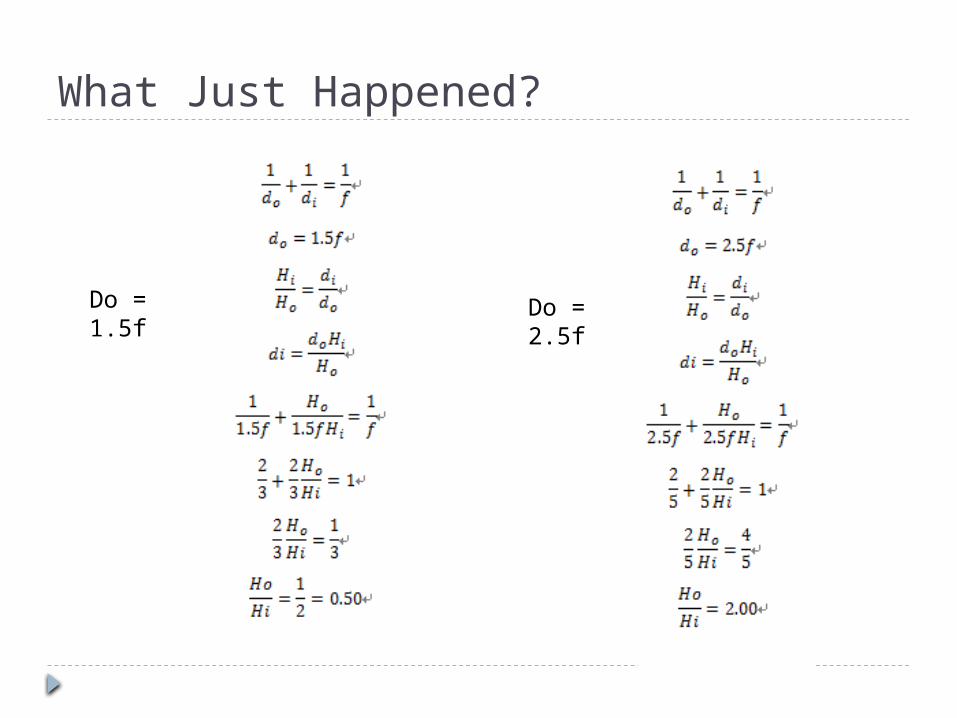
What Just Happened?
Do = 1.5f
Do = 2.5f
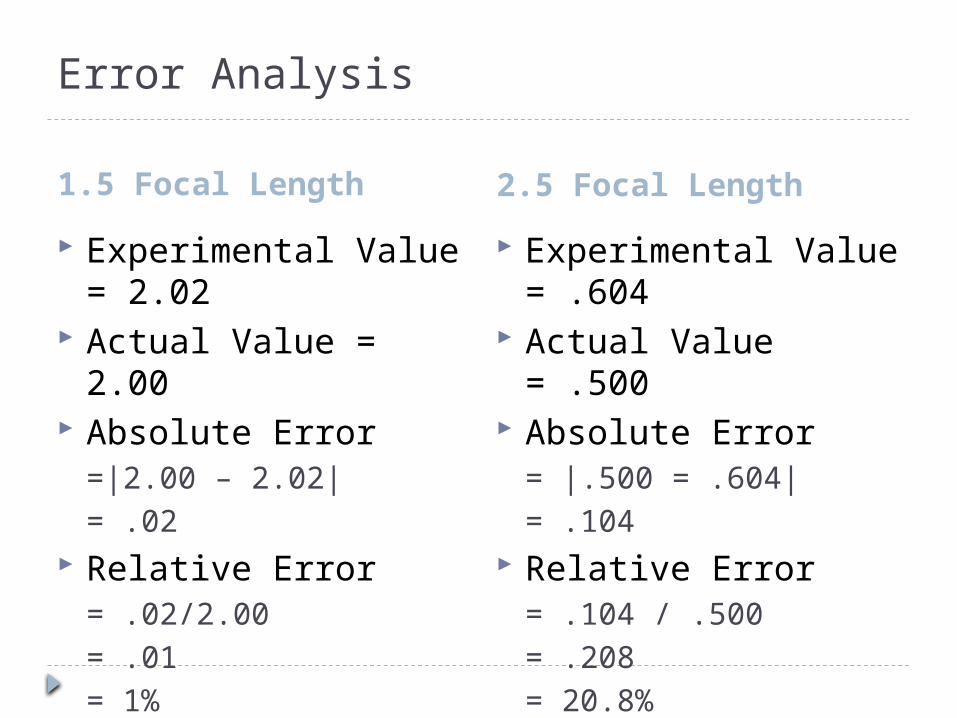
Error Analysis
1.5 Focal Length 2.5 Focal Length Experimental Value
= 2.02 Actual Value = 2.00 Absolute Error
=|2.00 – 2.02|= .02
Relative Error= .02/2.00= .01= 1%
Experimental Value = .604
Actual Value = .500 Absolute Error
= |.500 = .604|= .104
Relative Error= .104 / .500= .208= 20.8%
Source of Error The main source of error was measuring the
image height. It was especially difficult when the image was small. For the first few points, there was no discernible difference in the height. The ruler was also not always held steady when measuring.
Another source was getting the image completely focused and then measuring the image distance. At some points the distance could have been a range of values of + or – 1cm.
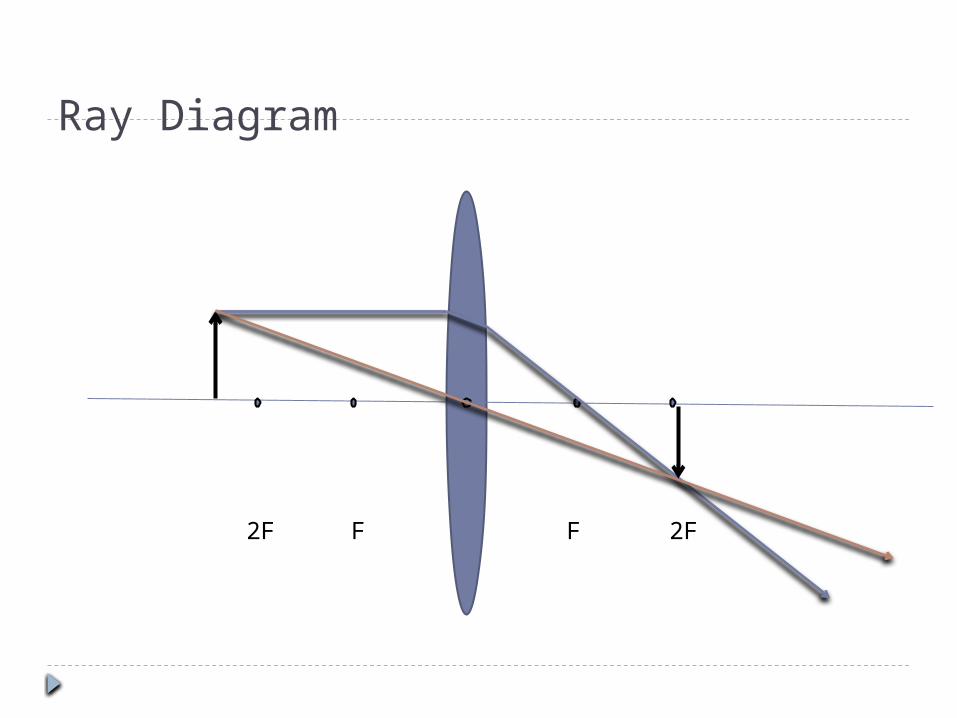
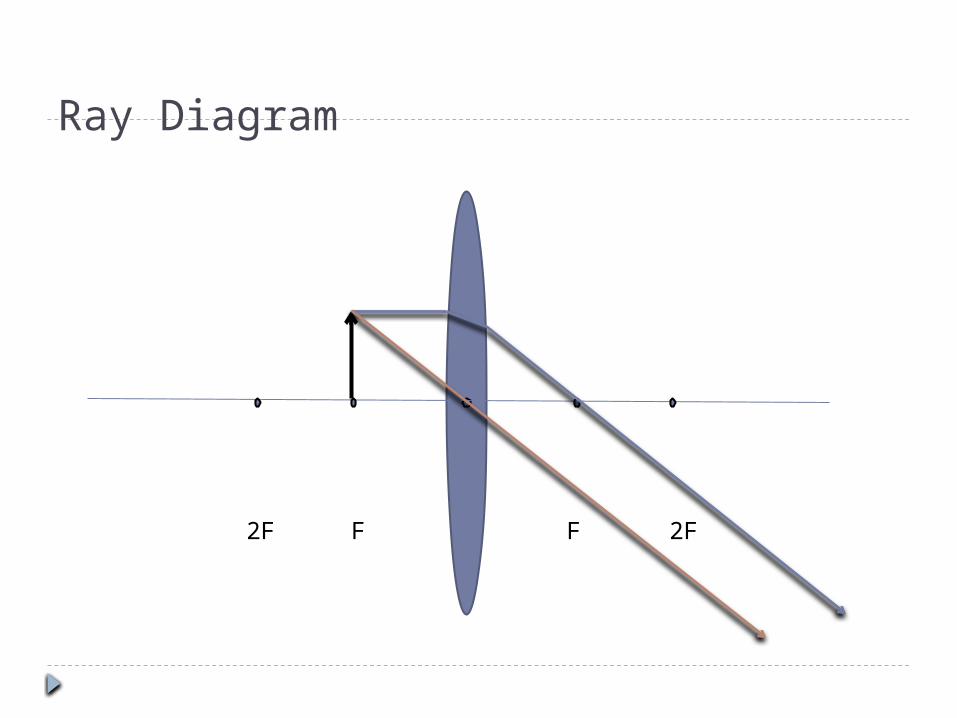
Ray Diagram
F2F 2FF
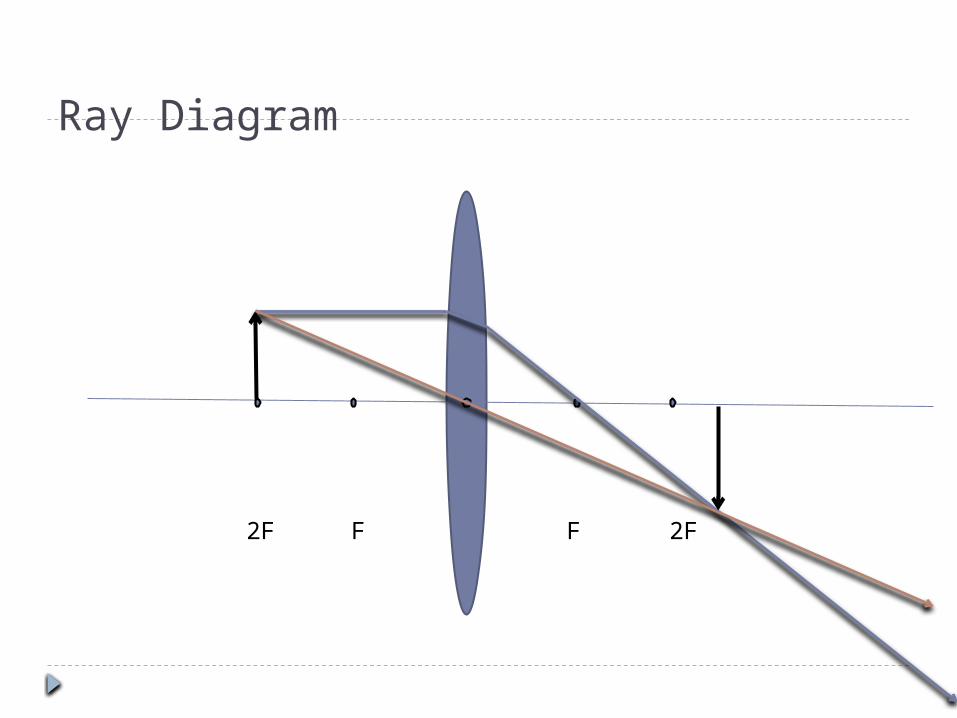
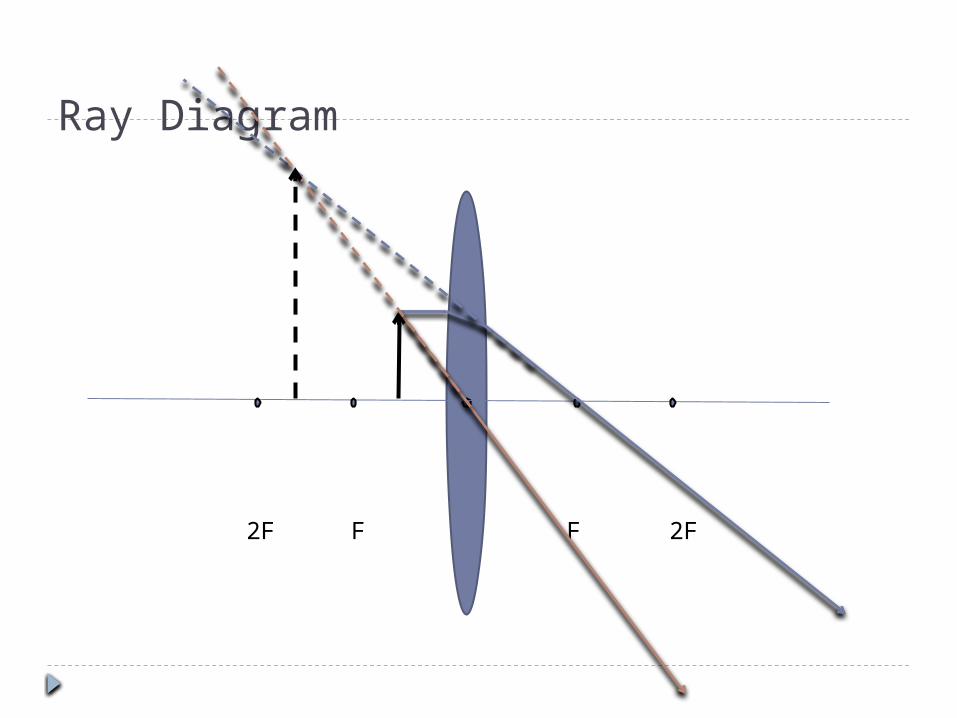
Ray Diagram
F2F 2FF
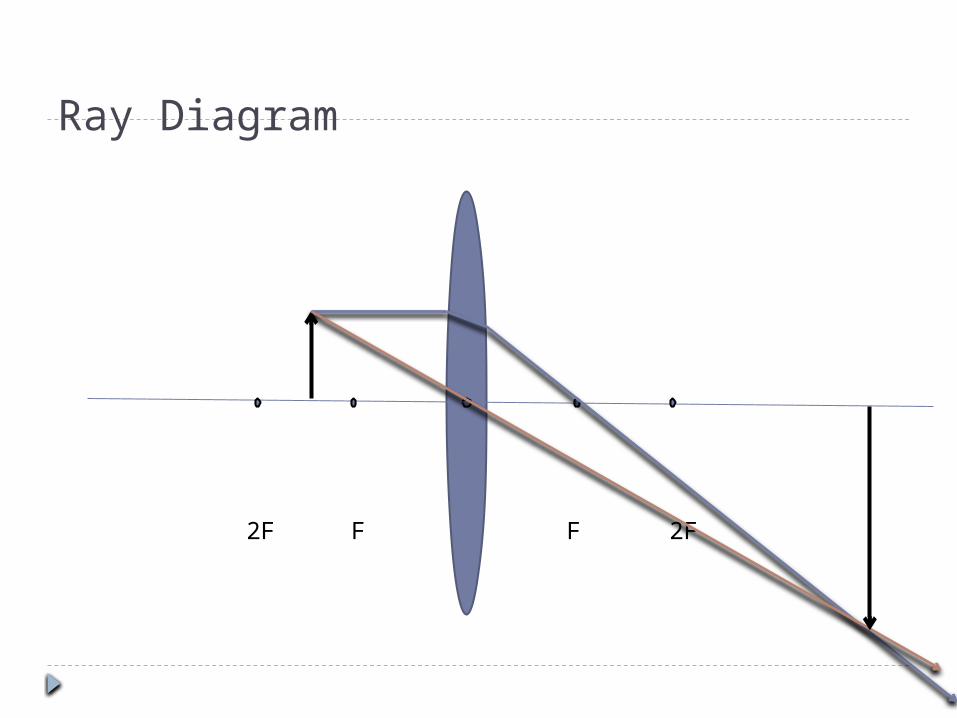
Ray Diagram
F2F 2FF
Ray Diagram
F2F 2FF
Ray Diagram
F2F 2FF

Thank you
The End