contrasting visions of urban transport - vtpi.org · contrasting visions of urban transport ......
TRANSCRIPT
www.vtpi.org
Phone & Fax: 250-360-1560
Todd Alexander Litman © 2010-13 You are welcome and encouraged to copy, distribute, share and excerpt this document and its ideas, provided the author is given
attribution. Please send your corrections, comments and suggestions for improvement.
Contrasting Visions of Urban Transport Critique of “Fixing Transit: The Case For Privatization”
5 November 2013
Todd Litman Victoria Transport Policy Institute
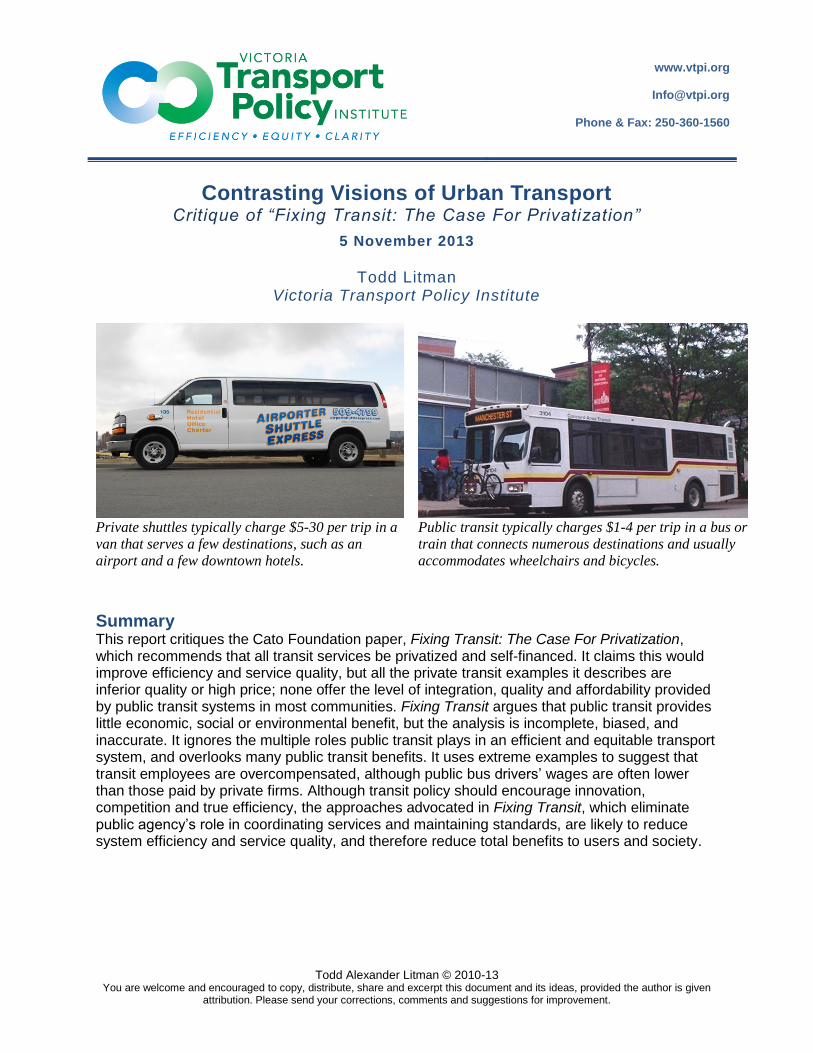
Private shuttles typically charge $5-30 per trip in a
van that serves a few destinations, such as an
airport and a few downtown hotels.
Public transit typically charges $1-4 per trip in a bus or
train that connects numerous destinations and usually
accommodates wheelchairs and bicycles.
Summary This report critiques the Cato Foundation paper, Fixing Transit: The Case For Privatization, which recommends that all transit services be privatized and self-financed. It claims this would improve efficiency and service quality, but all the private transit examples it describes are inferior quality or high price; none offer the level of integration, quality and affordability provided by public transit systems in most communities. Fixing Transit argues that public transit provides little economic, social or environmental benefit, but the analysis is incomplete, biased, and inaccurate. It ignores the multiple roles public transit plays in an efficient and equitable transport system, and overlooks many public transit benefits. It uses extreme examples to suggest that transit employees are overcompensated, although public bus drivers’ wages are often lower than those paid by private firms. Although transit policy should encourage innovation, competition and true efficiency, the approaches advocated in Fixing Transit, which eliminate public agency’s role in coordinating services and maintaining standards, are likely to reduce system efficiency and service quality, and therefore reduce total benefits to users and society.
Contrasting Visions of Urban Transportation Victoria Transport Policy Institute
2
Introduction This report evaluates two contrasting visions of urban transportation. On one hand, most cities
and towns around the world are working to improve their public transport (also called transit)
service quality.1 They recognize that public transit plays a critical role in an equitable and
efficient transport system by providing basic mobility for non-drivers, efficient mobility on
major urban travel corridors, and support for strategic development. Even where public transit
serves a minor share of total travel, the travel it serves tend to be high value, and so tend to
provide large benefits, as discussed later in this report.
In contrast, a paper titled, Fixing Transit: The Case for Privatization (O’Toole 2010),
recommends that transit systems be privatized and unsubsidized. It claims that this would
increase transport system efficiency and service quality, but evidence suggests otherwise.
O’Toole’ examples of private transport services – airporters, dollar vans, intercity bus services,
and unregulated buses and vans common in developing countries – are either low quality or
expensive, and generally service limited destinations. None provide the relatively high quality,
affordable, integrated service offered by public transit agencies in most cities.
For example, our local private airport shuttle service charges $19 for a 20-kilometer trip,
operates uncomfortable cube vans, serves limited destinations (the airport and a limited set of
stops), pays drivers low wages resulting in high turnover and requests for tips, has a loose
schedule (vans leave about hourly, after sufficient passengers accumulate), and cannot
accommodate wheelchair users (who must pay $60 for a taxi).2 In contrast, our public transit
service charges $2.50 to numerous regional destinations, has more comfortable vehicles, more
professional drivers, more reliable service, and accommodates wheelchairs.3 Even accounting for
subsidies (about $2.00 per trip) it is far cheaper per passenger-mile. This is just one of many
examples illustrating the superior efficiency and service quality that public transit can provide.
Private transport providers sometimes offer cheaper or higher quality service than public transit,
but these are exceptions, available only under high demand conditions. Private companies cannot
provide an integrated network of transit services needed to achieve strategic planning objectives,
such as basic mobility for non-drivers and significant reductions in urban traffic problems.
This is an important issue. To be efficient and equitable a transport system must provide diverse
options so people can choose the best one for each trip. This requires high quality public transit
that is convenient, comfortable, reliable and relatively affordable. The quality and efficiency of
public transit service affects overall transport system performance, and therefore a community’s
economic productivity and quality of life. Even people who do not currently use public transit
can benefit significantly from high quality service.
This is not to suggest that public transit cannot be improved or that privatization is never
appropriate. Many reforms may be justified. However, it is important to apply comprehensive
analysis when evaluating such options, including consideration of impacts on service quality and
overall transport system performance.

Contrasting Visions of Urban Transportation Victoria Transport Policy Institute
3
Appropriate Privatization There is often debate concerning whether particular goods and services should be provided by
public agencies, private firms or a combination. Generally, services that are considered critical to
society and require strategic coordination to achieve social objectives are best provided by public
agencies, although many specific tasks can be contracted out (PPIAF 2006). For example, public
agencies plan and operate most policing and schooling, although many tasks are contracted out
to private industry. Other goods and services are provided by private firms, but with strategic
public support. For example, private farms produce most foods but with support from public
irrigation systems, agricultural research and extension programs, public port and roadway
systems, and food safety regulations. Table 1 lists examples of public and private goods.
Table 1 Production Of Goods And Services
Typically Public Typically Private
National security
Law enforcement
Schooling
Public health services
Road construction and operations
Parks
Building construction and operations
Farming
Manufacturing
Retailing
Healthcare delivery
Financing and insurance
Most experts conclude that, because transportation infrastructure provides critical services and
requires strategic coordination, governments should control overall planning and management,
and provide subsidies as needed to achieve strategic objectives (Estache and Gómez-Lobo 2003,
Gómez-Ibáñez, Lorrain, and Ragazzi 2006; Silva 2000; Zegras 2006; Mandri-Perrott 2010). This
is why canals, ports, roads and airports are generally developed and operated by public agencies,
although specific tasks are often contracted out to private firms. This report explores whether
that approach is appropriate for public transport services, such as urban bus and rail transit.
Is transit a critical service? Although public transit serves only a minor portion of total
travel in most communities, many of the trips it service are high value, including basic
mobility for non-drivers, and efficient travel on congested urban corridors. At some point in
their life most people rely on public transit, live in a household with somebody who relies on
public transit, or live in a city public transit contributes significantly to efficient transport.
Does transit require strategic coordination? Like any transport mode, public transit is most
efficient and beneficial if efficiently integrated into the overall transport system. For
example, public transit becomes more effective if some roads are designed with bus lanes; if
walking and cycling conditions are improved and park-and-ride facilities built around transit
stations; if transit systems have integrated routes, schedules and fares; if land use policies
support transit-oriented development; and other supportive policies are implemented.
Personal transportation services do meet criteria for public (i.e., government) planning and
operation. This is not to suggest that private enterprise and competition have no role in transit
service provision, but it does suggest that transit is most efficient and beneficial with public
planning and coordination.
Contrasting Visions of Urban Transportation Victoria Transport Policy Institute
4
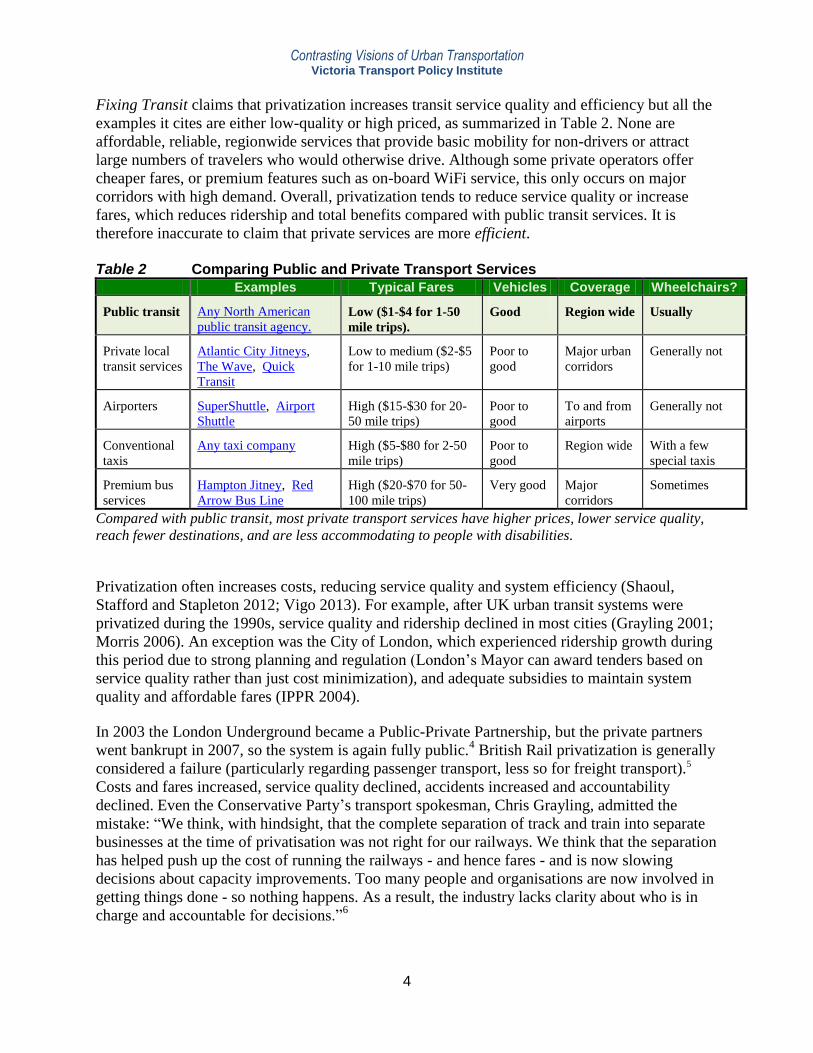
Fixing Transit claims that privatization increases transit service quality and efficiency but all the
examples it cites are either low-quality or high priced, as summarized in Table 2. None are
affordable, reliable, regionwide services that provide basic mobility for non-drivers or attract
large numbers of travelers who would otherwise drive. Although some private operators offer
cheaper fares, or premium features such as on-board WiFi service, this only occurs on major
corridors with high demand. Overall, privatization tends to reduce service quality or increase
fares, which reduces ridership and total benefits compared with public transit services. It is
therefore inaccurate to claim that private services are more efficient.
Table 2 Comparing Public and Private Transport Services
Examples Typical Fares Vehicles Coverage Wheelchairs?
Public transit Any North American
public transit agency. Low ($1-$4 for 1-50
mile trips).
Good Region wide Usually
Private local
transit services
Atlantic City Jitneys,
The Wave, Quick
Transit
Low to medium ($2-$5
for 1-10 mile trips)
Poor to
good
Major urban
corridors
Generally not
Airporters SuperShuttle, Airport
Shuttle
High ($15-$30 for 20-
50 mile trips)
Poor to
good
To and from
airports
Generally not
Conventional
taxis
Any taxi company High ($5-$80 for 2-50
mile trips)
Poor to
good
Region wide With a few
special taxis
Premium bus
services
Hampton Jitney, Red
Arrow Bus Line
High ($20-$70 for 50-
100 mile trips)
Very good Major
corridors
Sometimes
Compared with public transit, most private transport services have higher prices, lower service quality,
reach fewer destinations, and are less accommodating to people with disabilities.
Privatization often increases costs, reducing service quality and system efficiency (Shaoul,
Stafford and Stapleton 2012; Vigo 2013). For example, after UK urban transit systems were
privatized during the 1990s, service quality and ridership declined in most cities (Grayling 2001;
Morris 2006). An exception was the City of London, which experienced ridership growth during
this period due to strong planning and regulation (London’s Mayor can award tenders based on
service quality rather than just cost minimization), and adequate subsidies to maintain system
quality and affordable fares (IPPR 2004).
In 2003 the London Underground became a Public-Private Partnership, but the private partners
went bankrupt in 2007, so the system is again fully public.4 British Rail privatization is generally
considered a failure (particularly regarding passenger transport, less so for freight transport).5
Costs and fares increased, service quality declined, accidents increased and accountability
declined. Even the Conservative Party’s transport spokesman, Chris Grayling, admitted the
mistake: “We think, with hindsight, that the complete separation of track and train into separate
businesses at the time of privatisation was not right for our railways. We think that the separation
has helped push up the cost of running the railways - and hence fares - and is now slowing
decisions about capacity improvements. Too many people and organisations are now involved in
getting things done - so nothing happens. As a result, the industry lacks clarity about who is in
charge and accountable for decisions.”6

Contrasting Visions of Urban Transportation Victoria Transport Policy Institute
5
Privatized transit systems generally offer inferior service quality and are less efficient than
publically managed systems.
When Clayton County, Georgia stopped funding the local C-Tran7 public transit system, the
private Quick Transit8 company that replaced it tripled fares, reduced service from five to two
routes, and reduced service frequency, making non-drivers much worse off.9
When Santiago, Chile eliminated public management and regulation of transport services in the
1970s, operating efficiency declined, causing fares, congestion and pollution to increase (Estache
and Gómez-Lobo 2003). The city subsequently reintroduced public regulation and investment.
Sydney, Australia’s privately-built Airport Link rail line charges $15.00 per trip between the city
and airport, compared with $3.60 for similar distance trips on the public rail system.10
Ridership
is significantly below targets and the line has generated little new development around stations. In
2000, the Airport Link Company went into receivership, forcing the government to develop a new
revenue and patronage agreement which involves significant public costs.11
Victoria, Australia privatized much of its tram and passenger rail services during the last decade,
but users complain that service quality declined. A 2010 survey found that Victorians are less
supportive of transport system privatization, as a result of their experience.12
Private, unregulated paratransit services common in developing countries (publicos, colectivos, or
shared taxis) are often crowded, dirty and dangerous.13
Drivers work long hours, sometimes race
for passengers, and cram vehicles. Most developing countries are trying to formalize their transit
services to increase efficiency and service quality (World Bank 2009; Vigo 2013).
Many efforts to build privatized highways have also proven unsuccessful, resulting in
uncompleted projects, higher tolls, bankruptcies, and government bailouts (Ragazzi 2006).
Dozens of private toll roads built during the 1990s in Mexico, Hungary, Indonesia, and Thailand
have gone bankrupt and were subsequently taken over by governments (Silva 2000).
Jarrett Walker (www.humantransit.org/2010/09/on-privatization-scares.html)
There are many different ways to involve private enterprise in providing transit services, and these are so
diverse that vague talk of “privatization” simply doesn’t illuminate what’s going on. At one extreme, you can
privatise operations, planning, fleet, information, branding and almost everything else. In this model,
prominent in Britain (but not London) and British-influenced countries like Australia and New Zealand,
governments subsidise services but do not control overall network planning. This sometimes works in a
political sense, in areas with low expectations for transit, such as rural areas. It’s been very problematic in
urban areas, because it deprives government of the control that its subsidies should be buying, and makes it
impossible to plan rational networks that would meet the shared goal of a city and its people. Sydney,
Brisbane, and Auckland all went far down this path and are now trying to pull back and re-assert government
control over most aspects of planning and marketing.
At the other extreme, you can privatise operations only. This is the model used in a number of lean North
American operators such as Southern California’s Foothill Transit. In Australia, only Perth takes this approach,
but it’s very successful there. A public agency answerable to voters keeps full control of planning, and also
owns the fleet and facilities. Private operating companies are hired only to provide operations and maintenance
under contracts that are periodically re-opened to competitive procurement. This is a targeted kind of
privatisation aimed at the functions that are the biggest budget-killers for all-public agencies: labor costs, labor
relations, and liability related to operations and maintenance. Many agencies - especially newer agencies that
don’t have legacy labor commitments - are finding this a very good model.

Contrasting Visions of Urban Transportation Victoria Transport Policy Institute
6
Justifications for Transit Subsidies Markets are generally most efficient and fair if consumers pay directly for the goods they use.
However, subsidies are justified to achieve specific objectives, such as those in Table 3. Such
subsidies should be allocated carefully, since money spent to subsidize transit reduces the funds
available to support other public services. However, most economists agree that significant
subsidies are often justified to support public transit services.
Public transit subsidy benefits can be particularly large due to their interactive effects. For
example, subsidies provide direct equity benefits by providing basic mobility for non-drivers,
and indirectly by leading to service expansion, and reductions in traffic impacts imposed on non-
drivers, such as reduced congestion delay to bus riders, and reduced accident risk to pedestrians
and cyclists. This implies, for example, that bus riders benefit from subsidies to regional
commuter rail service and rail commuters benefit from subsidies to local bus service if together
they increase total transit service supply, help create more walkable neighborhoods, make public
transit use more socially acceptable, and increase public support for future transit improvements.
Table 3 Potential Justifications for Transportation Subsidies
Type Public Transit Automobile
Vertical equity: Physically,
economically or socially
disadvantaged people benefit
Transit often provides basic
mobility and cost savings to
disadvantaged people.
Although used by disadvantaged
people, they represent a small
portion of total use.
Scale economies: Unit costs
decline with system expansion, so
users benefit as a system grows
and demand increases.
Transit service experiences
economies of scale and scope. As
transit systems expand their unit
costs and subsidies per passenger-
mile tend to decline.
Once a road system matures there
are generally no scale economies;
unit costs tend to increase once
roads become congested.
Externalities: It provides external
benefits or reduces external costs
(impacts on non-users).
High quality public transit services
tend to reduce external costs of
automobile traffic, including
congestion, accidents and
pollution.
Automobile travel often causes
congestion, parking costs,
accident risk and pollution
emissions.14
Land value gains. Improved
accessibility increases nearby land
values, reflecting the transport cost
savings.
Land values often increase near
transit stations, reflecting user
benefits and increasing tax revenue
(Johns, et al. 2010; Smith and
Gihring 2004).
New roadways can increase
nearby land values, but there is
little shortage of automobile-
oriented land in most regions.
Strategic objectives: It helps
achieve strategic objectives such
as support for a strategic industry
or preferred land use development
patterns.
Transit investments can help
achieve various economic, social
and environmental objectives
including more efficient land use
patterns, and economic
development.
Increased automobile dependency
and sprawl tend to contradict
many strategic development
objectives.
There are several justifications to subsidize public transit, less for automobile travel.
Contrasting Visions of Urban Transportation Victoria Transport Policy Institute
7
Figure 1 Per Capita Annual Transit Subsidies and Service (FTA 2010)15
R2 = 0.6928
0
10
20
30
40
50
60
70
80
90
$0 $200 $400 $600 $800 $1,000
Annual Transit Subsidies Per Capita
An
nu
al
Tra
nsit
Veh
icle
Reven
ue-
Mil
es C
ap
ita
Four
As subsidies increase, so does transit service.
What do public transit subsidies achieve? As subsidies increase, so do transit service and
ridership, as illustrated in figures 1 and 2. Increased service directly benefits transit-dependent
users, and by attracting travelers who would otherwise drive, helps reduce traffic problems. Also,
as subsidies increase so does service efficiency (costs and subsidy per passenger-mile), as
indicated in Table 4.
Figure 2 Per Capita Annual Transit Subsidies and Ridership (FTA 2010)
R2 = 0.8057
0
200
400
600
800
1,000
1,200
$0 $50 $100 $150 $200 $250 $300 $350
Annual Transit Subsidies Per Capita
An
nu
al
Tra
ns
it P
assen
ge
r-M
iles P
er
Cap
ita
One
Two
ThreeFour
Four
As subsidies increase, so does transit ridership.
Contrasting Visions of Urban Transportation Victoria Transport Policy Institute
8
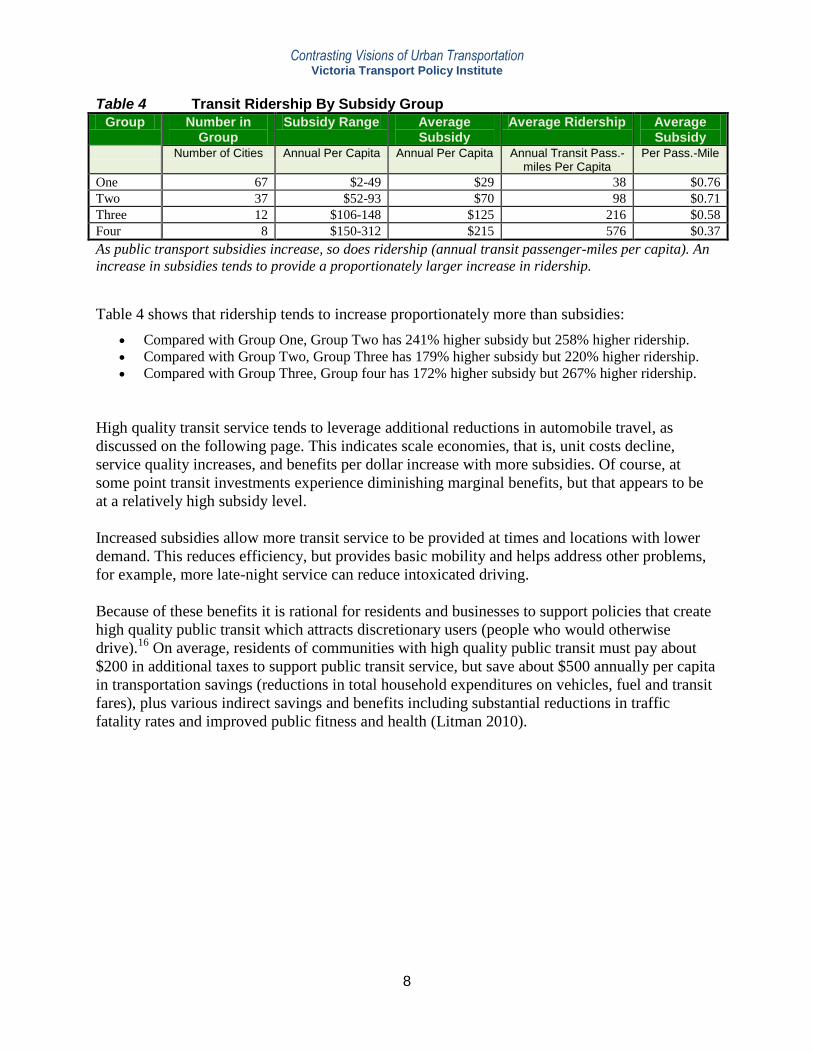
Table 4 Transit Ridership By Subsidy Group
Group Number in Group
Subsidy Range Average Subsidy
Average Ridership Average Subsidy
Number of Cities Annual Per Capita Annual Per Capita Annual Transit Pass.-miles Per Capita
Per Pass.-Mile
One 67 $2-49 $29 38 $0.76
Two 37 $52-93 $70 98 $0.71
Three 12 $106-148 $125 216 $0.58
Four 8 $150-312 $215 576 $0.37
As public transport subsidies increase, so does ridership (annual transit passenger-miles per capita). An
increase in subsidies tends to provide a proportionately larger increase in ridership.
Table 4 shows that ridership tends to increase proportionately more than subsidies:
Compared with Group One, Group Two has 241% higher subsidy but 258% higher ridership.
Compared with Group Two, Group Three has 179% higher subsidy but 220% higher ridership.
Compared with Group Three, Group four has 172% higher subsidy but 267% higher ridership.
High quality transit service tends to leverage additional reductions in automobile travel, as
discussed on the following page. This indicates scale economies, that is, unit costs decline,
service quality increases, and benefits per dollar increase with more subsidies. Of course, at
some point transit investments experience diminishing marginal benefits, but that appears to be
at a relatively high subsidy level.
Increased subsidies allow more transit service to be provided at times and locations with lower
demand. This reduces efficiency, but provides basic mobility and helps address other problems,
for example, more late-night service can reduce intoxicated driving.
Because of these benefits it is rational for residents and businesses to support policies that create
high quality public transit which attracts discretionary users (people who would otherwise
drive).16
On average, residents of communities with high quality public transit must pay about
$200 in additional taxes to support public transit service, but save about $500 annually per capita
in transportation savings (reductions in total household expenditures on vehicles, fuel and transit
fares), plus various indirect savings and benefits including substantial reductions in traffic
fatality rates and improved public fitness and health (Litman 2010).
Contrasting Visions of Urban Transportation Victoria Transport Policy Institute
9
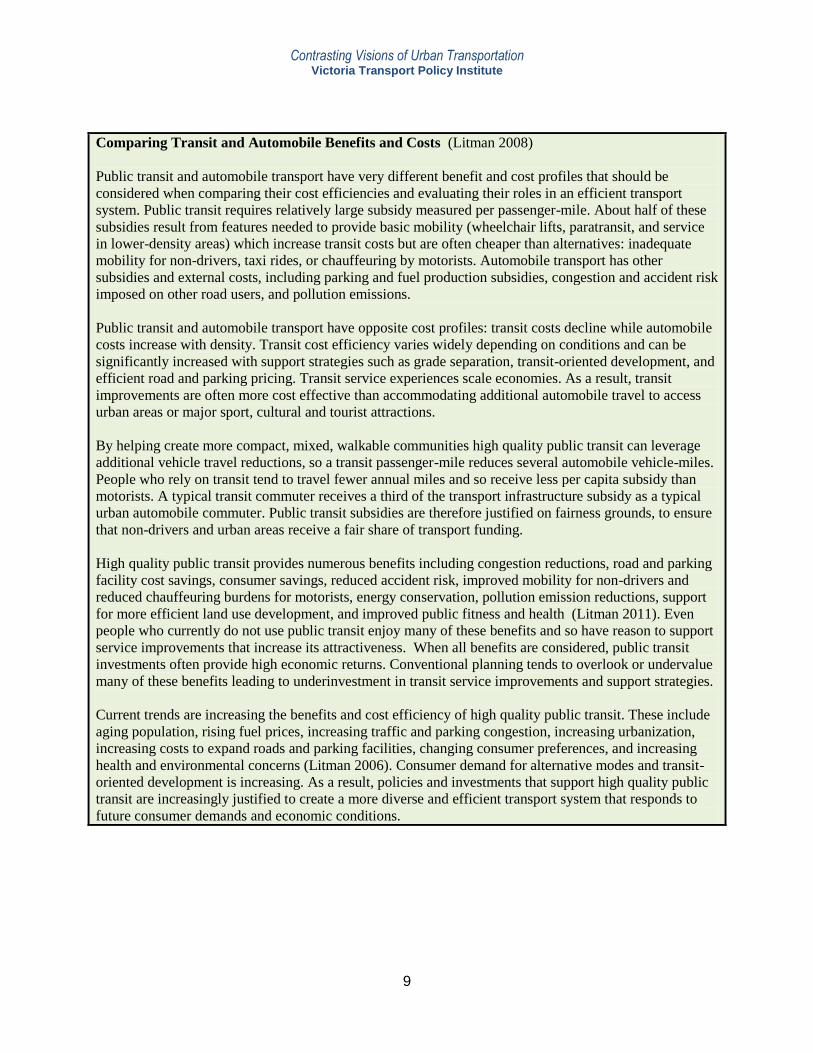
Comparing Transit and Automobile Benefits and Costs (Litman 2008)
Public transit and automobile transport have very different benefit and cost profiles that should be
considered when comparing their cost efficiencies and evaluating their roles in an efficient transport
system. Public transit requires relatively large subsidy measured per passenger-mile. About half of these
subsidies result from features needed to provide basic mobility (wheelchair lifts, paratransit, and service
in lower-density areas) which increase transit costs but are often cheaper than alternatives: inadequate
mobility for non-drivers, taxi rides, or chauffeuring by motorists. Automobile transport has other
subsidies and external costs, including parking and fuel production subsidies, congestion and accident risk
imposed on other road users, and pollution emissions.
Public transit and automobile transport have opposite cost profiles: transit costs decline while automobile
costs increase with density. Transit cost efficiency varies widely depending on conditions and can be
significantly increased with support strategies such as grade separation, transit-oriented development, and
efficient road and parking pricing. Transit service experiences scale economies. As a result, transit
improvements are often more cost effective than accommodating additional automobile travel to access
urban areas or major sport, cultural and tourist attractions.
By helping create more compact, mixed, walkable communities high quality public transit can leverage
additional vehicle travel reductions, so a transit passenger-mile reduces several automobile vehicle-miles.
People who rely on transit tend to travel fewer annual miles and so receive less per capita subsidy than
motorists. A typical transit commuter receives a third of the transport infrastructure subsidy as a typical
urban automobile commuter. Public transit subsidies are therefore justified on fairness grounds, to ensure
that non-drivers and urban areas receive a fair share of transport funding.
High quality public transit provides numerous benefits including congestion reductions, road and parking
facility cost savings, consumer savings, reduced accident risk, improved mobility for non-drivers and
reduced chauffeuring burdens for motorists, energy conservation, pollution emission reductions, support
for more efficient land use development, and improved public fitness and health (Litman 2011). Even
people who currently do not use public transit enjoy many of these benefits and so have reason to support
service improvements that increase its attractiveness. When all benefits are considered, public transit
investments often provide high economic returns. Conventional planning tends to overlook or undervalue
many of these benefits leading to underinvestment in transit service improvements and support strategies.
Current trends are increasing the benefits and cost efficiency of high quality public transit. These include
aging population, rising fuel prices, increasing traffic and parking congestion, increasing urbanization,
increasing costs to expand roads and parking facilities, changing consumer preferences, and increasing
health and environmental concerns (Litman 2006). Consumer demand for alternative modes and transit-
oriented development is increasing. As a result, policies and investments that support high quality public
transit are increasingly justified to create a more diverse and efficient transport system that responds to
future consumer demands and economic conditions.

Contrasting Visions of Urban Transportation Victoria Transport Policy Institute
10
A Productivity Crisis? Fixing Transit claims (p. 3) that public transit has a “productivity crisis,” indicated by a decline
in passenger trips per operating employee between 1955 and 1995. But that was a period of
declining transit ridership, suburbanization, and new services such as paratransit (Scholl 2006).
In 1965 transit agencies provided no special services for people with disabilities, but by 2008
paratransit services represented 30% of transit vehicle-hours, which indicates that nearly a third
of what Fixing Transit calls a productivity decline actually results from new services for people
with disabilities.17
Calling this a “productivity crisis” assumes there is no value to providing
suburban service or accommodating people with disabilities. It is also assumes incorrectly that
such trends will continue. The decline in trips-per-operator stopped about 1995. Ridership is now
increasing due to factors such as aging population, rising fuel prices, increasing urbanization,
changing consumer preferences, service improvements, and more transit-oriented development
(Litman 2006).
As evidence of transit inefficiency, Fixing Transit estimates that transit subsidies have totaled
more than $800 billion since 1965 (p. 5). This is a large but meaningless number since virtually
no other costs are measured in 45 year totals.18
Transit subsidies average about $65 annually per
capita annual, or 18¢ per capita per day, which is small compared with total vehicle, road and
parking costs. Such subsidies are equal about 10% of government roadway expenditures,19
4-8%
of total parking subsidies,20
and just 2% of consumer motor vehicle expenditures.21
This suggests
that for each transit subsidy dollar, governments, businesses and consumers spend about $20 to
subsidize roads and vehicle parking facilities, plus another $20 to own and operate automobiles.
Fixing Transit claims that public transit agencies pay excessive wages and benefits (p. 4), but its
evidence is biased and exaggerated, describing exceptional examples but providing no
information on overall industry compensation practices.22
According to the Bureau of Labor
Statistics, transit and intercity bus drivers earn $16.32 median hourly wages,23
somewhat less
than those in comparable private sector jobs such as Greyhound bus drivers ($19.35 per hour).24
Bus operation is a demanding job, requiring responsibility, physical skill and ability to deal with
the public. Of course, as with any industry, some public transit agency employees earn more than
average, including those with professional or specialized training, and those located in large
cities, but O’Toole provides no evidence that public transit compensation is overall excessive.
Focusing on wage rates overlooks other, more important factors that affect transit cost efficiency.
Leading transportation economists found that contracted transit services are sometimes, but not
always, less costly than those operated directly by transit agencies, but other factors, such as
labor and vehicle utilization rates, have greater impacts on overall system cost efficiency
(McCullough, Taylor and Wachs 1998). Transit systems with high ridership are more cost
efficient overall, despite their higher wages, than lower ridership systems with lower wages.
Fixing Transit criticizes New York, Chicago and Portland, for high wages (dollars per hour) and
operating costs (dollars per vehicle-mile),25
although they are actually more cost efficient (lower
cost per passenger-mile and higher cost recovery) than most other cities, as illustrated in Table 5.
These cities have better service quality (service coverage, frequency, speed and operating hours).
As a result, transit is significantly more efficient overall (more service per dollar spent) in the
cities Fixing Transit criticizes as financially wasteful.
Contrasting Visions of Urban Transportation Victoria Transport Policy Institute
11
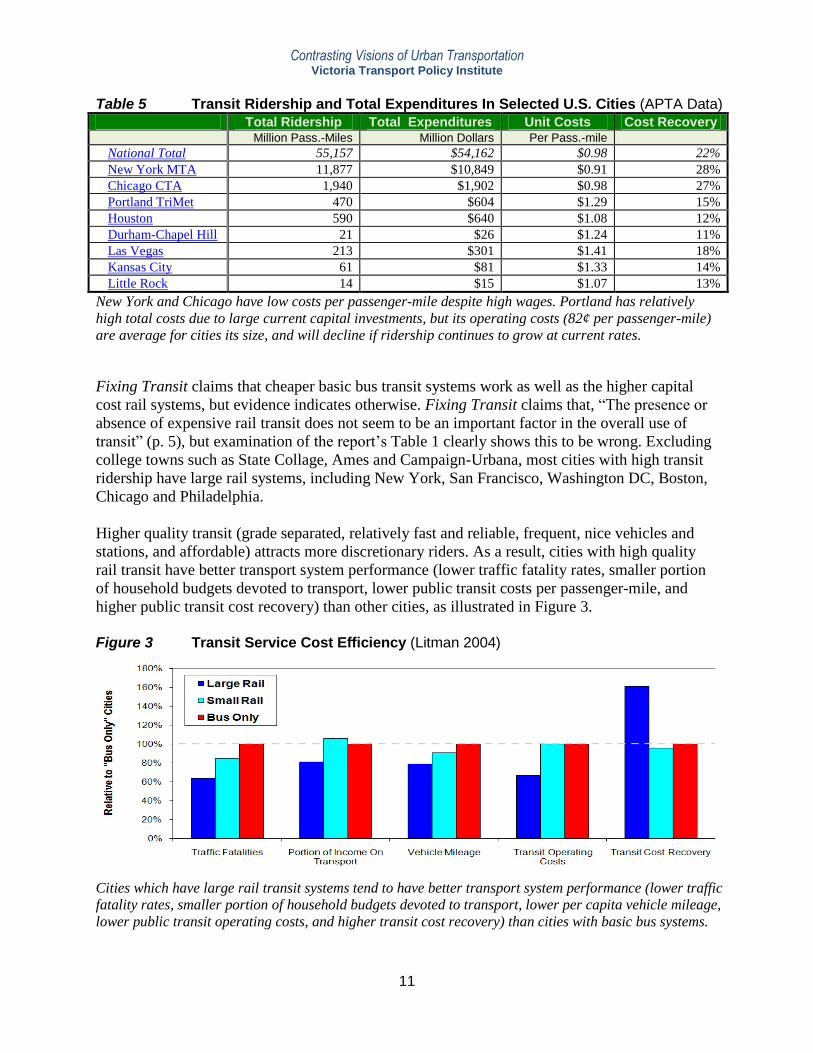
Table 5 Transit Ridership and Total Expenditures In Selected U.S. Cities (APTA Data)
Total Ridership Total Expenditures Unit Costs Cost Recovery Million Pass.-Miles Million Dollars Per Pass.-mile
National Total 55,157 $54,162 $0.98 22%
New York MTA 11,877 $10,849 $0.91 28%
Chicago CTA 1,940 $1,902 $0.98 27%
Portland TriMet 470 $604 $1.29 15%
Houston 590 $640 $1.08 12%
Durham-Chapel Hill 21 $26 $1.24 11%
Las Vegas 213 $301 $1.41 18%
Kansas City 61 $81 $1.33 14%
Little Rock 14 $15 $1.07 13%
New York and Chicago have low costs per passenger-mile despite high wages. Portland has relatively
high total costs due to large current capital investments, but its operating costs (82¢ per passenger-mile)
are average for cities its size, and will decline if ridership continues to grow at current rates.
Fixing Transit claims that cheaper basic bus transit systems work as well as the higher capital
cost rail systems, but evidence indicates otherwise. Fixing Transit claims that, “The presence or
absence of expensive rail transit does not seem to be an important factor in the overall use of
transit” (p. 5), but examination of the report’s Table 1 clearly shows this to be wrong. Excluding
college towns such as State Collage, Ames and Campaign-Urbana, most cities with high transit
ridership have large rail systems, including New York, San Francisco, Washington DC, Boston,
Chicago and Philadelphia.
Higher quality transit (grade separated, relatively fast and reliable, frequent, nice vehicles and
stations, and affordable) attracts more discretionary riders. As a result, cities with high quality
rail transit have better transport system performance (lower traffic fatality rates, smaller portion
of household budgets devoted to transport, lower public transit costs per passenger-mile, and
higher public transit cost recovery) than other cities, as illustrated in Figure 3.
Figure 3 Transit Service Cost Efficiency (Litman 2004)
Cities which have large rail transit systems tend to have better transport system performance (lower traffic
fatality rates, smaller portion of household budgets devoted to transport, lower per capita vehicle mileage,
lower public transit operating costs, and higher transit cost recovery) than cities with basic bus systems.
Contrasting Visions of Urban Transportation Victoria Transport Policy Institute
12
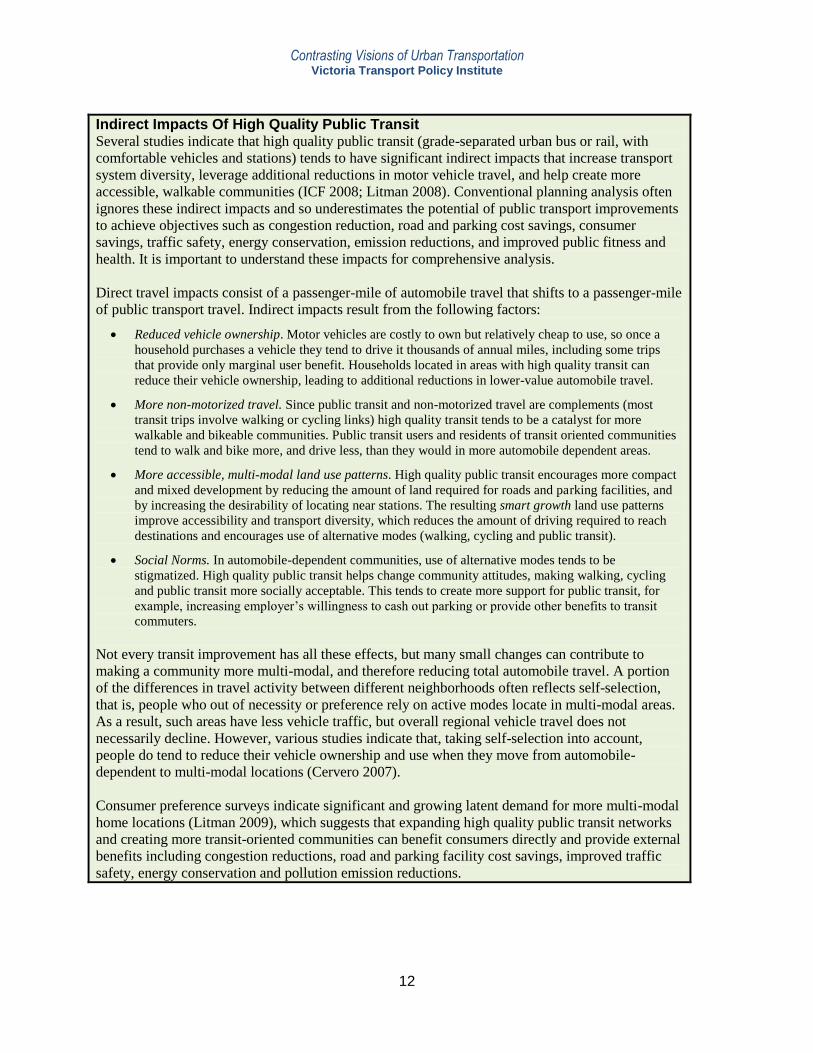
Indirect Impacts Of High Quality Public Transit Several studies indicate that high quality public transit (grade-separated urban bus or rail, with
comfortable vehicles and stations) tends to have significant indirect impacts that increase transport
system diversity, leverage additional reductions in motor vehicle travel, and help create more
accessible, walkable communities (ICF 2008; Litman 2008). Conventional planning analysis often
ignores these indirect impacts and so underestimates the potential of public transport improvements
to achieve objectives such as congestion reduction, road and parking cost savings, consumer
savings, traffic safety, energy conservation, emission reductions, and improved public fitness and
health. It is important to understand these impacts for comprehensive analysis.
Direct travel impacts consist of a passenger-mile of automobile travel that shifts to a passenger-mile
of public transport travel. Indirect impacts result from the following factors:
Reduced vehicle ownership. Motor vehicles are costly to own but relatively cheap to use, so once a
household purchases a vehicle they tend to drive it thousands of annual miles, including some trips
that provide only marginal user benefit. Households located in areas with high quality transit can
reduce their vehicle ownership, leading to additional reductions in lower-value automobile travel.
More non-motorized travel. Since public transit and non-motorized travel are complements (most
transit trips involve walking or cycling links) high quality transit tends to be a catalyst for more
walkable and bikeable communities. Public transit users and residents of transit oriented communities
tend to walk and bike more, and drive less, than they would in more automobile dependent areas.
More accessible, multi-modal land use patterns. High quality public transit encourages more compact
and mixed development by reducing the amount of land required for roads and parking facilities, and
by increasing the desirability of locating near stations. The resulting smart growth land use patterns
improve accessibility and transport diversity, which reduces the amount of driving required to reach
destinations and encourages use of alternative modes (walking, cycling and public transit).
Social Norms. In automobile-dependent communities, use of alternative modes tends to be
stigmatized. High quality public transit helps change community attitudes, making walking, cycling
and public transit more socially acceptable. This tends to create more support for public transit, for
example, increasing employer’s willingness to cash out parking or provide other benefits to transit
commuters.
Not every transit improvement has all these effects, but many small changes can contribute to
making a community more multi-modal, and therefore reducing total automobile travel. A portion
of the differences in travel activity between different neighborhoods often reflects self-selection,
that is, people who out of necessity or preference rely on active modes locate in multi-modal areas.
As a result, such areas have less vehicle traffic, but overall regional vehicle travel does not
necessarily decline. However, various studies indicate that, taking self-selection into account,
people do tend to reduce their vehicle ownership and use when they move from automobile-
dependent to multi-modal locations (Cervero 2007).
Consumer preference surveys indicate significant and growing latent demand for more multi-modal
home locations (Litman 2009), which suggests that expanding high quality public transit networks
and creating more transit-oriented communities can benefit consumers directly and provide external
benefits including congestion reductions, road and parking facility cost savings, improved traffic
safety, energy conservation and pollution emission reductions.
Contrasting Visions of Urban Transportation Victoria Transport Policy Institute
13
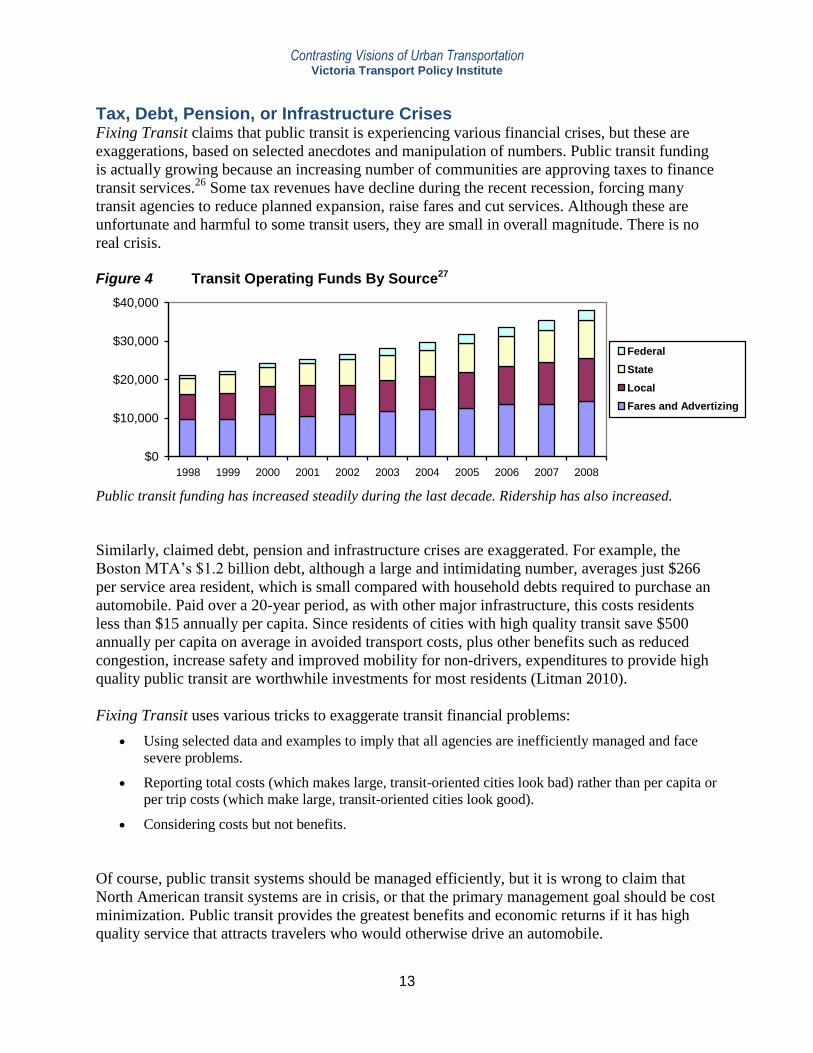
Tax, Debt, Pension, or Infrastructure Crises Fixing Transit claims that public transit is experiencing various financial crises, but these are
exaggerations, based on selected anecdotes and manipulation of numbers. Public transit funding
is actually growing because an increasing number of communities are approving taxes to finance
transit services.26
Some tax revenues have decline during the recent recession, forcing many
transit agencies to reduce planned expansion, raise fares and cut services. Although these are
unfortunate and harmful to some transit users, they are small in overall magnitude. There is no
real crisis.
Figure 4 Transit Operating Funds By Source27
$0
$10,000
$20,000
$30,000
$40,000
1998 1999 2000 2001 2002 2003 2004 2005 2006 2007 2008
Federal
State
Local
Fares and Advertizing
Public transit funding has increased steadily during the last decade. Ridership has also increased.
Similarly, claimed debt, pension and infrastructure crises are exaggerated. For example, the
Boston MTA’s $1.2 billion debt, although a large and intimidating number, averages just $266
per service area resident, which is small compared with household debts required to purchase an
automobile. Paid over a 20-year period, as with other major infrastructure, this costs residents
less than $15 annually per capita. Since residents of cities with high quality transit save $500
annually per capita on average in avoided transport costs, plus other benefits such as reduced
congestion, increase safety and improved mobility for non-drivers, expenditures to provide high
quality public transit are worthwhile investments for most residents (Litman 2010).
Fixing Transit uses various tricks to exaggerate transit financial problems:
Using selected data and examples to imply that all agencies are inefficiently managed and face
severe problems.
Reporting total costs (which makes large, transit-oriented cities look bad) rather than per capita or
per trip costs (which make large, transit-oriented cities look good).
Considering costs but not benefits.
Of course, public transit systems should be managed efficiently, but it is wrong to claim that
North American transit systems are in crisis, or that the primary management goal should be cost
minimization. Public transit provides the greatest benefits and economic returns if it has high
quality service that attracts travelers who would otherwise drive an automobile.
Contrasting Visions of Urban Transportation Victoria Transport Policy Institute
14
An Innovation Crisis? Fixing Transit argues (p. 13) that public transit agencies never innovate, demand response is
always better than fixed-route service, buses are always better than rail, everybody prefers
automobile travel and sprawl, and newer technologies are always better. These claims are wrong.
Transit agencies do innovate. North American transit agencies are implementing all the
innovations mentioned in Fixing Transit, including telephone dispatching, vehicle tracking,
electronic payment systems, and improved user information, plus many more. The Transit
Cooperative Research Program sponsors extensive research on transit innovations.
Demand response is already provided by most North American transit agencies. It is appropriate
for some applications, particularly serving people with disabilities, but is inherently inefficient. It
typically cost several times more than conventional transit (the SuperShuttle airporter service
O’Toole cites as an example typically charges $15-30 per trip) and is generally slower and less
predictable than fixed-route transit due to flexible routing and stops. Because of its low load
factors, it provides little or no congestion reduction or energy savings compared with driving.
As discussed previously, high quality rail transit tends to provide greater benefits to users and
society compared with conventional bus transit, including greater comfort, speed and reliability,
reduced traffic congestion and accident rates, more energy savings and emission reductions
(Litman 2004). As a result, under appropriate conditions, rail transit is the most appropriate
transit option. Although Bus Rapid Transit can provide similar benefits, it also requires
substantial investments.
Housing preferences are diverse and changing (Chernikoff and Yoon 2010). Consumer surveys
indicate that many people would prefer to drive less, rely more on alternative modes, and live in
more accessible, multi-modal communities (Litman 2006). Although many families (especially
those with young children) prefer single-family homes, an increasing portion will choose more
compact houses in exchange for improved accessibility and financial savings (Litman 2009).
Similarly, although few motorists want to give up automobile travel altogether, many would
prefer to drive less and rely more on alternatives, provided they are convenient, comfortable, safe
and affordable. The 2009 Emerging Trends in Real Estate report explains:28
Energy prices and road congestion accelerate the move back into metropolitan-area interiors as more
people crave greater convenience in their lives. They want to live closer to work and shopping
without the hassle of car dependence. Higher-density residential projects with retail components will
gain favor in the next round of building. Apartment and townhouse living looks more attractive,
especially to singles and empty nesters—high utility bills, gasoline expenses, car payments, and rising
property taxes make suburban-edge McMansion lifestyles decidedly less economical.
It is silly to assume, as Fixing Transit, does, that newer transportation technologies are always
better than those that are well established and tested. History of rife with proposals for transport
system innovations that are technically feasible but not worthwhile, including flying cars and
rocket belts. Although Segways can replace non-motorized travel, they have few practical uses.
Walking and cycling are generally better overall. Similarly, buses and trains are efficient and
reliable transport modes, which can be improved, but not replaced, by technological innovation.

Contrasting Visions of Urban Transportation Victoria Transport Policy Institute
15
Evaluating Costs Fixing Transit (p. 2) claims that, “urban transit is the most expensive way of moving people in
the United States.” This is untrue, based on incomplete analysis that overlooks these factors:
Fixing Transit ignores many costs of automobile travel, such as the costs of parking facilities, and
incremental congestion, accident and pollution costs.
Transit services are concentrated in urban areas where transport infrastructure is costly. It is
therefore wrong to compare transit service costs with overall average automobile costs, rather,
transit costs should be compared with the costs of accommodating additional automobile travel
under urban conditions.
A major portion of transit service is designed to provide basic mobility for non-drivers, including
service at times and locations where demand is low, such as in during evenings and in suburban
areas. This has relatively high cost per passenger-mile, but is often cheaper than alternatives, such
as taxi service, or chauffeuring by a family member of friend who drives.
Transit users tend to travel far fewer annual miles than automobile travelers. As a result,
motorists tend to receive greater total per capita transportation subsidy than transit users,
particularly if government-mandated parking facilities are considered in the analysis.
The claim that transit is the most expensive of transport is based on analysis that only considers
two modes (automobile and transit) and two costs (vehicle and roads/tracks). It does not answer
the more relevant question, “What is the most cost effective way of providing basic mobility and
efficient transport on congested urban corridors, considering all costs?”
The analysis in Fixing Transit is based on overall average vehicle costs, although these tend to
be significantly higher under urban-peak travel conditions due to traffic congestion, high
insurance costs, high road and parking facility costs, and lower vehicle occupancy rates.
Similarly, the costs of expanding road and parking facilities is much higher in urban areas.
According to a Federal Highway Administration study, expanding major urban highways costs
$1.00 or more per additional peak-period vehicle (Decorla-Souza and Jensen-Fisher 1997).
Measured differently, tolls on privatized urban roadways typically range from 10¢ to 50¢ per
vehicle-mile (for example, California State Route 73 fees are about $5 for a 15-mile peak-period
trip, or about 33¢ per mile, and more for shorter trips), although such tolls seldom cover total
roadway land, construction and operating costs. Parking typically costs $20 to $35 per day in
large city downtowns, and perhaps half that in suburban areas, averaging perhaps $16 per day
overall, or 50¢ per mile for a 32-mile commute.29
This indicates that a single-occupant urban
automobile commute costs about 45¢ per mile in vehicle costs (O’Toole’s 35¢ per vehicle-mile
increased to account for higher costs under urban-peak travel conditions), plus 30¢ for roadway
costs and 50¢ for parking, or $1.25 per mile.
In contrast, total transit capital and operating expenses average $0.91 to $1.29 per passenger-mile
in large U.S. cities, as illustrated in Table 5. Of course, actual travel costs vary. Driving is
cheaper under some conditions and more costly under others. Similarly, transit is more
convenient and cost effective for some trips than others. If high quality public transit service
exists, users can choose the most cost effective travel option for each trip. If transit service is
inferior, travelers are forced to drive even when it is cost inefficient.

Contrasting Visions of Urban Transportation Victoria Transport Policy Institute
16
Scope of Benefits Considered Fixing Transit ignores many benefits provided by high quality public transit. It criticizes public
transit agencies for having multiple objectives (p. 3), but that is the nature of major public
infrastructure: it serves multiple functions and users. For example, most citizens probably want
their police departments to prevent and investigate crimes, manage traffic, rescue lost children,
and control parade crowds. They don’t evaluate policing services based on a single performance
indicator, such as minimal wages or maximum citation revenues. Similarly, public transit
agencies can maximize benefits by balancing multiple objectives. Public transport helps achieve
two different and sometimes conflicting categories of objectives:
1. Basic mobility for non-drivers. This requires providing broadly distributed service (including
service at times and locations where demand is low, resulting in low operating efficiencies) and
accommodating people with special needs (including wheelchair lifts and other design features to
accommodate people with disabilities, and demand response services).
2. Efficient mobility on major urban corridors. Public transit is often cheaper overall (including
vehicle, road, parking, accidents and pollution emissions) than accommodating additional
automobile travel on major urban corridors. This requires high quality service to attract
discretionary riders who would otherwise drive.
As a result, equity-justified transit (service where or when demand is low, and features to
accommodate passengers with special needs, such as wheelchair lifts and paratransit services)
may seem inefficient, while efficiency-justified transit (high quality, grade separated rail and
commuter bus services on major corridors) may seem inequitable, but those simply reflect
different types of services intended to provide different types of benefits. All these objectives
and benefits should be considered when evaluating public transit cost efficiency.
Comparisons between cities indicate that those with high quality transit systems (grade
separation, nice vehicles and stations, integrated with land use development, and other
supportive polities) have:
Higher per capita transit ridership.
Higher transit commute mode share.
Lower per capita motor vehicle ownership and travel.
Lower per capita traffic fatality rates.
Lower per capita consumer expenditures on transport.
Lower transit operating costs per passenger-mile.
Higher transit service cost recovery.
Better mobility options for non-drivers.
Improved fitness and health (since most transit trips have walking or cycling links, so transit
travelers are much more likely to achieve physical activity targets than motorists).
Increased money circulating in local economies (since transit travelers spend significantly less on
imported vehicles and fuel, leaving more money to spend on other goods which tend to have
more local input).
Contrasting Visions of Urban Transportation Victoria Transport Policy Institute
17
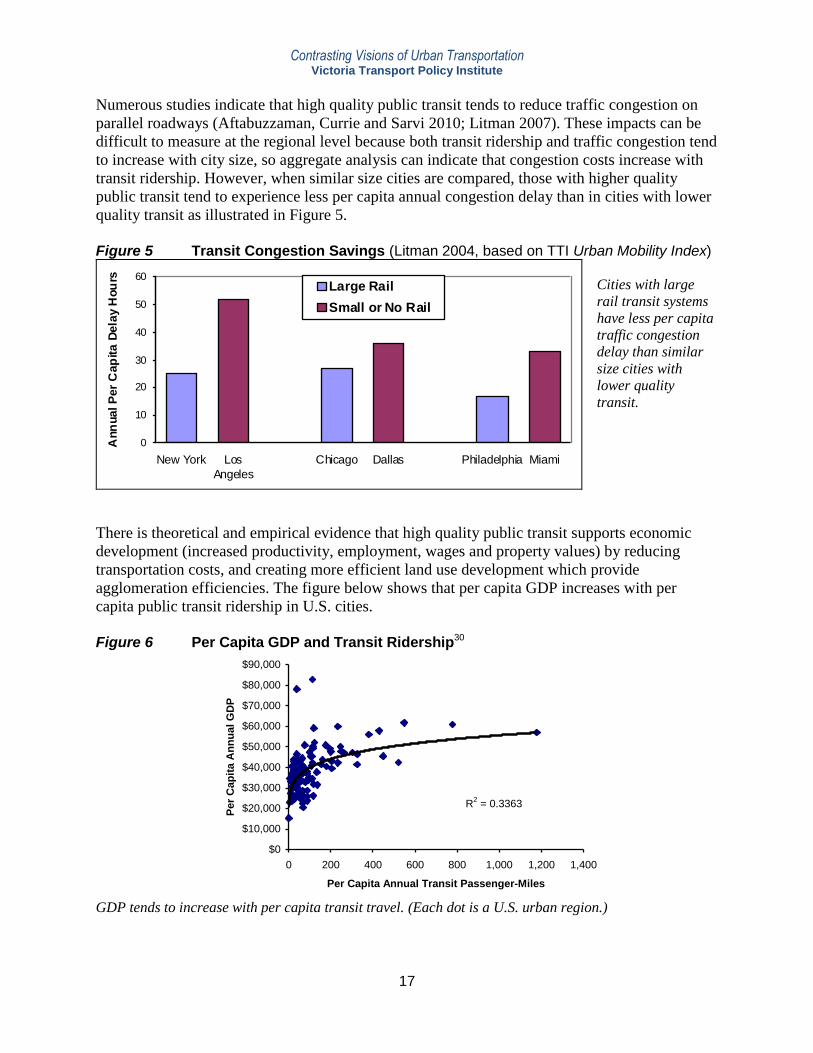
Numerous studies indicate that high quality public transit tends to reduce traffic congestion on
parallel roadways (Aftabuzzaman, Currie and Sarvi 2010; Litman 2007). These impacts can be
difficult to measure at the regional level because both transit ridership and traffic congestion tend
to increase with city size, so aggregate analysis can indicate that congestion costs increase with
transit ridership. However, when similar size cities are compared, those with higher quality
public transit tend to experience less per capita annual congestion delay than in cities with lower
quality transit as illustrated in Figure 5.
Figure 5 Transit Congestion Savings (Litman 2004, based on TTI Urban Mobility Index)
0
10
20
30
40
50
60
New York Los
Angeles
Chicago Dallas Philadelphia Miami
Ann
ual P
er
Cap
ita D
ela
y H
ou
rs
Large Rail
Small or No Rail
Cities with large
rail transit systems
have less per capita
traffic congestion
delay than similar
size cities with
lower quality
transit.
There is theoretical and empirical evidence that high quality public transit supports economic
development (increased productivity, employment, wages and property values) by reducing
transportation costs, and creating more efficient land use development which provide
agglomeration efficiencies. The figure below shows that per capita GDP increases with per
capita public transit ridership in U.S. cities.
Figure 6 Per Capita GDP and Transit Ridership30
R2 = 0.3363
$0
$10,000
$20,000
$30,000
$40,000
$50,000
$60,000
$70,000
$80,000
$90,000
0 200 400 600 800 1,000 1,200 1,400
Per Capita Annual Transit Passenger-Miles
Per
Cap
ita A
nn
ua
l G
DP
GDP tends to increase with per capita transit travel. (Each dot is a U.S. urban region.)

Contrasting Visions of Urban Transportation Victoria Transport Policy Institute
18
Impacts on Transit-Dependent People Fixing Transit claims (p. 22) that “Privatization will make transit responsive to users, not
politicians, and will actually lead to better services for many transit users,” but provides no
evidence. In fact, the type of privatization recommended in Fixing Transit generally leads to a
spiral of declining service and ridership, and increasing fares. Fixing Transit ignores the harm
this would impose on transit dependent people (and their families, friends and employers).
Although some transit users have alternatives (walking, bicycling, being chauffeured by family
members or friends, driving, or hiring a taxi), others face severe difficulties, including inability
to access essential services and activities, or excessive financial burdens to pay for higher fares
or alternatives such as taxis.
End Of C-Tran Leaves Many Without Rides
Atlanta Journal Constitution, 31 March 2010 (www.ajc.com/news/clayton/end-of-c-tran-421823.html)
As Clayton County‘s C-Tran buses made their last morning rounds on Wednesday, many riders were still
wondering how they would get to work without the service.
Constance Glenn of Hampton said she has been riding C-Tran buses to and from her job at Hartsfield-
Jackson International Airport for two years. “I don’t know how I’m going to get to work,” Glenn said.
She had tried talking to friends about catching a ride, “but nobody has a car, so I’m out of luck. I’m going to
be out of a job. It makes me very angry.”
Tyrone Maze has been riding C-Tran for about three years. “I use it to go to work, to go downtown and to
doctor’s appointments. It’s really going to throw [my routine] off,” Maze said. He called C-Tran “the last
resort some people have, including myself. It’s really going to take a toll on the people in this area.”
High school senior Antionette Mellerson, 18, has been riding C-Tran off and on for a couple of years, and
daily for about three months. She said her mother will “be getting up early in the morning and taking me to
school. I don’t want her to do that, but we have no other choice.” Mellerson said she knows people who “are
actually going out to buy cars with no insurance and no driver’s license. It interferes with your everyday life
when you don’t have transportation,” she said.
Fixing Transit recommends (p. 22) that any subsidies should be provided directly to users.
Although this could benefit some people, it would reduce total transport services due to lost scale
economies. For example, assume transit service costs $100 per trip to provide on a route, fares
average $2 per trip, and there are 20 transit-dependent users and 20 discretionary users. With
supply-based subsidies the public transit agency spends $20 per trip to maintain the service (40
riders paying $2 per trip generates $80 in revenue, which is $20 short of the $100 operating
costs). If the same subsidy is provide directly to users, the service would only continue if the 20
subsidy recipients continue using the route. If any users shift mode the route becomes
unprofitable. For example, if 5 subsidy recipients shift to taxi, revenue declines to $85, making
the route unprofitable. Without supply-based subsidies the transit service collapses because it
experiences scale economies and requires a critical mass of users. In such a situation, efficiency
requires either regulation or subsidies to concentrate demand to particular routes and services.
Contrasting Visions of Urban Transportation Victoria Transport Policy Institute
19
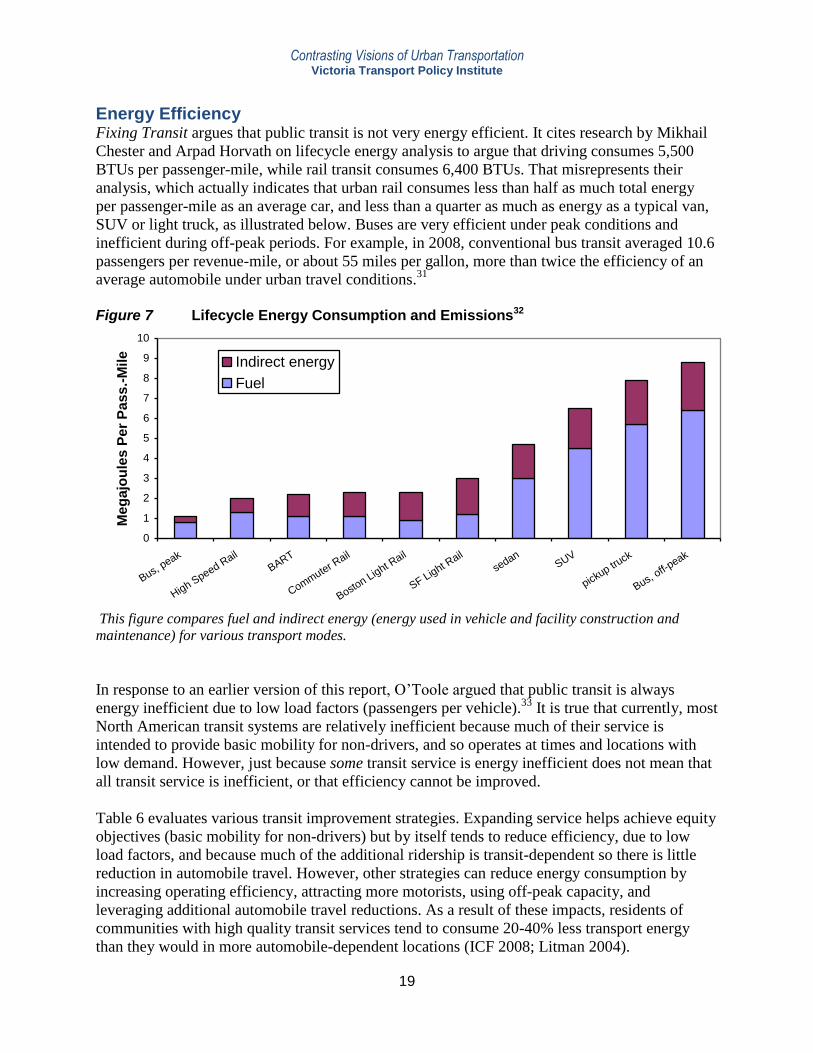
Energy Efficiency Fixing Transit argues that public transit is not very energy efficient. It cites research by Mikhail
Chester and Arpad Horvath on lifecycle energy analysis to argue that driving consumes 5,500
BTUs per passenger-mile, while rail transit consumes 6,400 BTUs. That misrepresents their
analysis, which actually indicates that urban rail consumes less than half as much total energy
per passenger-mile as an average car, and less than a quarter as much as energy as a typical van,
SUV or light truck, as illustrated below. Buses are very efficient under peak conditions and
inefficient during off-peak periods. For example, in 2008, conventional bus transit averaged 10.6
passengers per revenue-mile, or about 55 miles per gallon, more than twice the efficiency of an
average automobile under urban travel conditions.31
Figure 7 Lifecycle Energy Consumption and Emissions32
0
1
2
3
4
5
6
7
8
9
10
Bus, peak
High Speed R
ail
BART
Commuter Rail
Boston Light R
ail
SF Light Rail
sedanSUV
pickup tr
uck
Bus, off-
peak
Me
ga
jou
les
Pe
r P
as
s.-
Mile
Indirect energy
Fuel
This figure compares fuel and indirect energy (energy used in vehicle and facility construction and
maintenance) for various transport modes.
In response to an earlier version of this report, O’Toole argued that public transit is always
energy inefficient due to low load factors (passengers per vehicle).33
It is true that currently, most
North American transit systems are relatively inefficient because much of their service is
intended to provide basic mobility for non-drivers, and so operates at times and locations with
low demand. However, just because some transit service is energy inefficient does not mean that
all transit service is inefficient, or that efficiency cannot be improved.
Table 6 evaluates various transit improvement strategies. Expanding service helps achieve equity
objectives (basic mobility for non-drivers) but by itself tends to reduce efficiency, due to low
load factors, and because much of the additional ridership is transit-dependent so there is little
reduction in automobile travel. However, other strategies can reduce energy consumption by
increasing operating efficiency, attracting more motorists, using off-peak capacity, and
leveraging additional automobile travel reductions. As a result of these impacts, residents of
communities with high quality transit services tend to consume 20-40% less transport energy
than they would in more automobile-dependent locations (ICF 2008; Litman 2004).

Contrasting Visions of Urban Transportation Victoria Transport Policy Institute
20
Table 6 Equity and Efficiency Impacts of Various Transit Improvement Strategies
Transit Improvement Strategy Equity Impacts Efficiency Impacts
Impacts on mobility and
accessibility of non-drivers.
Impacts on traffic congestion,
energy consumption, pollution
emissions and other external costs.
Service expansion. More routes and
service frequency, including times
and locations with low demand.
Improves basic mobility. Reduces efficiency if load factors
are low.
Improve vehicle fuel efficiency.
Smaller vehicles where appropriate,
hybrid drives, and alternative fuels.
Generally no impact. Reduces energy use per vehicle-
mile.
Improve operating efficiency. Grade
separation and bus priority, faster
boarding (such as prepaid fares).
Improves transit travel speeds and
reliability.
Reduces energy use per vehicle-
mile.
Financial incentives. Lower fares,
subsidized transit passes, parking
pricing and cash out.
Positive incentives (reduced fares
and parking cash out) benefit users,
particularly those with lower
incomes.
Increases efficiency, particularly if
it reduces automobile travel and
increases ridership on routes with
excess capacity.
Improved convenience and comfort.
Better user information, nicer
vehicles and stations, marketing
programs.
Improves the convenience and
comfort of travel by disadvantaged
people. Helps reduce the stigma of
transit travel.
Increases efficiency, particularly if
it reduces automobile travel and
increases ridership on routes with
excess capacity.
Better modal integration. Improved
walkability near transit stops.
Bicycle racks and lockers. Better
connections with vanpools, ferry
terminals and airports.
Improves the convenience and
comfort of travel by disadvantaged
people.
Increases transport system
efficiency, particularly if it reduces
automobile travel and increases
ridership on routes with excess
capacity.
Offpeak incentives. Discounts for
off-peak transit travel.
Provides financial savings that
benefit some disadvantaged people
(those with flexible schedules).
Increases efficiency by filling
otherwise unused capacity.
Transit-oriented development. More
compact, mixed development,
pedestrian improvements and
parking management near high-
quality transit service.
Benefits disadvantaged people,
particularly if appropriate
affordable housing is included. By
providing a catalyst for more
accessible development, provides
additional benefits (besides just
improved transit access).
Increases efficiency, both directly,
but encouraging transit travel, and
indirectly by creating communities
where travel distances are shorter,
and people own fewer cars, drive
less, and rely more on walking,
cycling and public transit.
Transit service expansion helps achieve equity objectives (basic mobility) but by itself tends to reduce
system efficiency. Other transit improvement strategies can increase transport system efficiency, and
some strategies (service quality improvements and transit-oriented development) tend to leverage
additional energy savings and efficiency gains.
With appropriate improvements, public transit can provide substantial energy savings and
efficiency gains, including direct savings from more efficient transit operations, and indirect
savings that result when high quality transit leverages additional vehicle travel reductions.
Contrasting Visions of Urban Transportation Victoria Transport Policy Institute
21
What Experts Conclude Several academic studies have investigated transit privatization benefits and costs (Estache and
Gómez-Lobo 2003; Grayling 2001; Gómez-Ibáñez, Lorrain and Osius 2004; Macário 2010;
McCullough, Taylor and Wachs 1998; Morris 2006; Scholl 2006; PPIAF 2006; van de Velde, et
al. 2010). Their conclusions are summarized below.
According to Scholl (2006), early studies of U.S. bus service contracting found 10-40% savings,
but many of those studies had significant methodological problems. More recent studies find
smaller savings, estimated to range from 5-19%, and indicate that savings result largely from
reduced driver compensation which tends to increase turnover, and so reduces service quality
and safety, rather than actual productivity gains. Contracting out increases administrative costs
that reduce net savings, and efficiency benefits can erode over time, due to market consolidation
which reduces the number of firms that can bid on contracts, reducing competition.
Analysis of U.S. public transit agency cost efficiency by McCullough, Taylor and Wachs (1998)
indicates that contacting out can provide savings under some circumstances, but other
management factors have greater impacts on overall transit service productivity. They conclude
that public agencies can provide cost efficient transit services.
Grayling (2001) and Morris (2006) describe how public transport privatization in Great Britain
reduced system efficiency and service quality. They conclude that regulation and subsidies are
required to provide the high quality public transport services needed to achieve social equity
objectives (basic mobility for non-drivers) and attract discretionary travelers (and therefore
reduce roadway traffic problems).
A World Bank study by Estache and Gómez-Lobo (2003) concludes that both economic theory
and experience indicate that unregulated and unsubsidized public transit systems cannot provide
optional service for the following reasons:
Service is only provided on the most profitable routes, and is not coordinated between routes, so
the system cannot achieve scale economies.
Companies that provide transit services tend to be either large and monopolistic, or small and
inefficient, depending on market conditions. Either way, they are unlikely to provide optimal
service without appropriate regulation.
Operators race for passengers, which increases congestion and accidents.
Because automobile travel imposes external congestion, accident and pollution costs, and public
transit helps achieve social equity objectives, unregulated and unsubsidized transit will provide
less than optimal service levels.
For these reasons, the study recommends the Bus Rapid Transit model of contracting service, in
which governments own and operate bus lanes and stations, and allow private companies to bid
on the right to use those facilities, based on low operating costs and high service quality.
Overall, most experts conclude that regulation and subsidies are required to maintain efficient
and high quality transit service. Many support contracting out and public-private partnerships
where appropriate, but within a regulatory structure that insures system integration and quality.

Contrasting Visions of Urban Transportation Victoria Transport Policy Institute
22
Summary of Impacts Table 7 summarizes how privatization affects various public transit performance factors. Under
most circumstances total privatization reduces service quality (coverage, frequency, integration)
and increases fares. A reduction in subsidies tends to increase unit costs (dollars per passenger-
mile) due to reduced economies of scale.
Table 7 Privatization Impacts
Performance Factor Total Privatization Contracting Out
Service (coverage,
frequency, hours, etc.)
Tends to decline significantly since
service is only provided at times and
locations with high demand.
Typically unchanged
Integration (quality of
connections between
different routes and modes)
Tends to decline significantly. Private
companies generally lack any incentive
to coordinate services.
Typically unchanged
Vehicle quality Tends to decline, except on a few routes
with premium fares. Private companies
often drive vans that lack amenities such
as wheelchair lifts.
Typically unchanged
Bus stations, waiting area
comfort.
Tend to decline significantly. Individual
companies generally lack resources to
build and maintain attractive stations.
Typically unchanged
Fares Fare may decline on a few routes (those
with very high demand) but increase
elsewhere.
Typically unchanged
Public subsidies Declines. Typically unchanged
Employee compensation Declines. Tends to decline
Employee quality Tends to decline due to lower
compensation
May decline if wages decline
Unit costs (dollars per
passenger-mile)
May decline on routes with high demand
but increases elsewhere due to reduced
scale economies.
May decline if wages decline
Automobile travel
reductions and external
benefits (reduced traffic
congestion, accident risk
and pollution)
Tends to decline significantly due to
reduced service and higher fares.
Typically unchanged
Privatization and contacting out tend to reduce service quality and increase fares, while reducing
employee compensation.
The claimed benefits of privatization mainly result from reduced service and employee
compensation, and so only increase efficiency if there is too much transit service (fewer areas
should receive transit service) and drivers are over-compensated. Otherwise, complete
privatization can be considered inefficient and harmful overall.
Contrasting Visions of Urban Transportation Victoria Transport Policy Institute
23
Recommendations for Transit Privatization There is certainly an appropriate role for private enterprise in transit service provision (Zegras
2006; PPIAF 2006; van de Velde, et al. 2010; . Macário 2010). An excellent model is widely
used around the world for Bus Rapid Transit (BRT) system; governments build and own the bus
lanes and stations, collect fares, and establish performance standards, while private companies
(including worker cooperatives) bid for the right to operate buses which compete based on cost
efficiency and service quality (Wright 2007).34
This allows privatization to support strategic
planning objectives, including efficient use of infrastructure and vehicles, and high service
quality that attracts discretionary travelers. The following are recommendations for effective
transit privatization.
Public agencies should maintain overall control of strategic planning and performance standards.
Transit system routes, schedules, fare structures, user information, and marketing should be
integrated to maximize user convenience and system efficiency.
Encourage development of competitive supply markets. For example, encourage the development
of multiple companies that can bid on service contracts.
Establish policies that prevent strikes and other labor disruptions that reduce transit services.
Establish and maintain high service quality standards. Reward operators based on meeting service
quality requirements.
Design data collection and evaluation methods to monitor performance.

Contrasting Visions of Urban Transportation Victoria Transport Policy Institute
24
Conclusions Claims that private, self-financed bus and van services would be more efficient and higher
quality than current public transit systems are unsupported by evidence. All private transport
services identified in Fixing Transit – airporters, jitneys, and coach buses – are either inferior
quality or expensive, and serve limited destinations. None offer the relatively affordable, reliable,
integrated services provided by public transit systems in most cities.
Without public coordination and subsidies private companies only provide transit on limited
routes with high demand. Some private transport services that operate on particularly profitable
routes charge low fares, but this leaves public agencies with the less profitable routes, causing
total service to decline or subsidies to increase. As a result, private companies cannot achieve
strategic objectives such as providing basic mobility for non-drivers and reducing traffic
problems.
For these and other reasons, most experts agree that transit requires government coordination and
support for equity and efficiency. Purely privatized, self-financing public transit provides less
service and higher fares than socially optimal, creating a cycle of declining service quality,
ridership and benefits.
Fixing Transit makes numerous analytic errors. It ignores the multiple roles public transit plays
in an efficient transport system and so underestimates the costs that result from transit service
reductions. When comparing automobile and public transit costs it significantly underestimates
total automobile costs under urban conditions. It assumes that without transit, users could
otherwise drive, rather than requiring more costly taxi or chauffeured travel. It uses extreme
examples to suggest that transit employees are overcompensated, although average bus drivers’
wages are lower than those paid by private firms. It underestimates public transit energy savings
and other benefits. It criticizes the transit industry for failing to innovate, although public transit
agencies are now implementing all the innovations described, plus many others. It overlooks the
efficiencies and benefits of high quality urban transit: the transit agencies it criticizes for
excessive wages actually provide some of the most cost effective service (passenger-mile per
dollar) in North America. Similarly, it ignores the tendency of high quality public transit to
leverage vehicle travel reductions, which provides significant benefits including energy savings.
Fixing Transit is outdated. During the 1990s many experts advocated transport infrastructure
privatization (roads, rail and urban transit), but subsequent experience found that these experts
had understated problems and costs, and exaggerated benefits. As a result, many transport
privatization efforts have since been scaled back, restructured or abandoned.
This is not to suggest that innovation and privatization undesirable. Many transit systems have
outdated policies and practices deserving reform, and agencies should implement appropriate
innovations. Many transit agencies could contract out more services. Although transit policy
should encourage innovation and appropriate competition, the approaches advocated in Fixing
Transit are likely to reduce system efficiency and service quality, and therefore reduce total
benefits to users and society.

Contrasting Visions of Urban Transportation Victoria Transport Policy Institute
25
References Md Aftabuzzaman, Graham Currie and Majid Sarvi (2010), “Evaluating the Congestion Relief Impacts of
Public Transport in Monetary Terms,” Journal of Public Transportation, Vol. 13, No. 1, pp. 1-24;
www.nctr.usf.edu/jpt/pdf/JPT13-1.pdf.
G.B. Arrington (2000), Responding to Wendell Cox, PBQD, Smart Growth America
(http://cfte.org/images/response_cox.pdf).
Xinyu Cao, Susan L. Handy and Patricia L. Mokhtarian (2006), “The Influences Of The Built
Environment And Residential Self-Selection On Pedestrian Behavior,” Transportation
(www.springerlink.com), Vol. 33, No. 1, pp. 1 – 20.
Robert Cervero (2007), “Transit Oriented Development’s Ridership Bonus: A Product Of Self Selection
And Public Policies,” Environment and Planning, Vol. A, No. 39, pp. 2068-2085; at
www.uctc.net/papers/765.pdf.
CFTE (2003), CFTE O’Toole Response, Center for Transportation Excellence (www.cfte.org); at
www.cfte.org/critics/O'Toole%20response.pdf.
Helen Chernikoff and Al Yoon (2010), Smart Money in Real Estate Is on Smart Growth, ABC News
(http://abcnews.go.com); at http://abcnews.go.com/Business/wireStory?id=11311919.
CMT (2004), Light Rail - The Facts; Critics Refute Federal Reserve Arguments, Citizens for Modern
Transit (www.cmt-stl.org/issues/fedreserve.html).
Colliers (2010), North America Parking Rate Survey, Colliers International (www.colliers.com); at
www.colliers.com/Country/UnitedStates/content/colliersparkingratesurvey2010.pdf.
CTS (2009), Understanding the Impacts of Transitways: Demographic and Behavioral Differences
between Hiawatha Light-Rail and Other Transit Riders, Transitway Impacts Research Program (TIRP),
Center for Transportation Studies, University of Minnesota
(www.cts.umn.edu/Research/Featured/Transitways).
Patrick Decorla-Souza and Ronald Jensen-Fisher (1997), “Comparing Multimodal Alternatives in Major
Travel Corridors,” Transportation Research Record 1429 (www.trb.org), pp. 15-23, Table 1.
Alan Ehrenhalt (2009), “Paul Weyrich’s Soft Spot For Public Transit: The Late Conservative Leader
Debunks The Free-Market Case Against Transit,” Governing Magazine (www.governing.com); at
www.governing.com/column/paul-weyrichs-soft-spot-public-transit.
Antonio Estache and Andrés Gómez-Lobo (2003), The Limits To Competition In Urban Bus Services In
Developing Countries, World Bank (www.worldbank.org); at
http://info.worldbank.org/etools/library/view_p.asp?lprogram=7&objectid=64610.
FTA (2002), Transit Performance Monitoring System (TPMS) Results, American Public Transit
Association (www.apta.com) and the Federal Transit Administration
(www.fta.dot.gov/printer_friendly/publications_5677.html).
GAO (2004), Highways and Transit: Private Sector Sponsorship Of And Investment In Major Projects
Has Been Limited, General Accounting Office, GAO-04-419 (www.gao.gov).
Contrasting Visions of Urban Transportation Victoria Transport Policy Institute
26
José A. Gómez-Ibáñez, Dominique Lorrain, and Meg Osius (2004), The Future Of Private Infrastructure,
Kennedy School of Government, Harvard University (www.hks.harvard.edu); at
www.hks.harvard.edu/var/ezp_site/storage/fckeditor/file/pdfs/centers-
programs/centers/taubman/working_papers/gomezibanez_04_infrastructure.pdf.
Haynes Goddard (2009), A Review of “On the Social Desirability of Urban Rail Systems” by C. Winston
and V. Maheshrib, Department of Economics, University of Cincinnati; at www.vtpi.org/goddard.pdf.
Tony Grayling (2001), Any More Fares? Delivering Better Bus Services, IPPR (www.ippr.org.uk);
summary at www.ippr.org/publicationsandreports/publication.asp?id=129.
Lyndon Henry and Todd Litman (2006), Evaluating New Start Transit Program Performance
Comparing Rail And Bus, VTPI (www.vtpi.org); at www.vtpi.org/bus_rail.pdf.
ICF (2008), The Broader Connection between Public Transportation, Energy Conservation and
Greenhouse Gas Reduction, American Public Transportation Association (www.apta.com); at
www.apta.com/research/info/online/documents/land_use.pdf.
IPPR (2004), Bus Regulation Outside of London, Institute for Public Policy Research (www.ippr.org.uk);
at www.ippr.org.uk/uploadedFiles/projects/proceedings%20-%20seminar%202.pdf.
ITLS (2010), Quarter 3 Transport Opinion Survey (TOPS), Institute of Transport and Logistics Studies,
University of Sydney (http://sydney.edu.au/business/itls/tops).
Robert Johns, et al. (2010), Value Capture for Transportation Finance, University of Minnesota Center
for Transportation Studies (www.cts.umn.edu); at
www.cts.umn.edu/Research/Featured/ValueCapture/index.html.
Jeff Kenworthy (2008), “An International Review of The Significance of Rail in Developing More
Sustainable Urban Transport Systems in Higher Income Cities,” World Transport Policy & Practice, Vol.
14, No. 2 (www.eco-logica.co.uk); at www.eco-logica.co.uk/pdf/wtpp14.2.pdf.
Mike Lewyn (2007), Debunking Cato: Why Planning in Portland Works Better Than the Analysis of Its
Chief Neo-Libertarian Critic, Congress for New Urbanism (www.cnu.org); at
http://cnu.org/sites/files/DebunkingCato.pdf.
William S. Lind (2010), “Rail Against The Machine: What’s So Conservative About Federal Highways,”
The American Conservative (www.amconmag.com), August 2010; at http://t4america.org/wp-
content/uploads/2010/07/American-Conservative-August-2010.pdf.
Allison Linn (2010), Carmakers’ Next Problem: Generation Y: People In Their Teens And Twenties Are
More Interested In Gadgets Than Cars, MicroSoft News, 4 Nov. 2010
(www.msnbc.msn.com/id/39970363/ns/business-autos).
Todd Litman (2003), Evaluating Rail Transit Criticism, VTPI (www.vtpi.org); at
www.vtpi.org/railcrit.pdf.
Todd Litman (2004), Rail Transit In America: Comprehensive Evaluation of Benefits, VTPI
(www.vtpi.org); at www.vtpi.org/railben.pdf.
Contrasting Visions of Urban Transportation Victoria Transport Policy Institute
27
Todd Litman (2005), “Impacts of Rail Transit on the Performance of a Transportation System,”
Transportation Research Record 1930, Transportation Research Board (www.trb.org), pp. 23-29.
Todd Litman (2006), The Future Isn’t What It Used To Be: Changing Trends And Their Implications For
Transport Planning, Victoria Transport Policy Institute (www.vtpi.org); at www.vtpi.org/future.pdf;
originally published as “Changing Travel Demand: Implications for Transport Planning,” ITE Journal,
Vol. 76, No. 9, (www.ite.org), September, pp. 27-33.
Todd Litman (2007), “Evaluating Rail Transit Benefits: A Comment,” Transport Policy, Vol. 14, No. 1
(www.elsevier.com/locate/tranpol), January, pp. 94-97.
Todd Litman (2008), Evaluating Public Transit Benefits and Costs, VTPI (www.vtpi.org/tca); at
www.vtpi.org/tranben.pdf.
Todd Litman (2009), Where We Want To Be: Home Location Preferences And Their Implications For
Smart Growth, Victoria Transport Policy Institute (www.vtpi.org); at www.vtpi.org/sgcp.pdf.
Todd Litman (2010), Raise My Taxes, Please! Evaluating Household Savings From High Quality Public
Transit Service, VTPI (www.vtpi.org); at www.vtpi.org/raisetaxes.pdf.
LRN (2001), Most Light Rail Projects Within Budget, On Time (www.lightrailnow.org/myths/m_lrt009.htm)
and Light Rail's Stunning Track Record in Meeting – and Exceeding – Ridership Projections
(www.lightrailnow.org/myths/m_lrt011.htm), Light Rail Now!
LRN (2005), Randal O'Toole's ‘Great Rail Disaster’: Ideological Train Wreck Disguised as ‘Research
Study’, Light Rail Now (www.lightrailnow.org/features/f_lrt_2005-04.htm).
LRN (2006), Rail Transit vs. "Bus Rapid Transit": Comparative Success and Potential in Attracting
Ridership, Light Rail Now (www.lightrailnow.org/facts/fa_brt_2006-08a.htm).
William Lucy (2002), Danger in Exurbia: Outer Suburbs More Dangerous Than Cities, University of
Virginia (www.virginia.edu); at http://arch.virginia.edu/exurbia/death-in-exurbia.pdf.
Rosário Macário, editor (2010), Research in Transportation Economics; Special Issue on the Economics
Of Contractual Relationships In The Provision Of Transport Infrastructure, Vol. 30, Issue 1;
www.sciencedirect.com/science/journal/07398859.
Cledan Mandri-Perrott (2010), Private Sector Participation in Light Rail-Light Metro Transit Initiatives,
Public-Private Infrastructure Advisory Committee (www.ppiaf.org), World Bank (www.worldbank.org);
at http://ideas.repec.org/b/wbk/wbpubs/2416.html.
William McCullough, Brian Taylor and Martin Wachs (1998), Transit Service Contracting And Cost
Efficiency, UCTC 365, University of California Transportation Center (www.uctc.net); at
www.uctc.net/papers/365.pdf.
Eric Morris (2006), “How Privitization Became a Train Wreck,” ACCESS 28, (www.uctc.net), Spring, pp.
18-25; at www.uctc.net/access/28/Access%2028%20-%2004%20-
%20How%20Privatization%20Became%20a%20Train%20Wreck.pdf.
Arthur C. Nelson, Rolf Pendall, Casy Dawkins and Gerrit Knaap (2002), The Link Between Growth
Management and Housing Affordability: The Academic Evidence, Brookings Institution Center on Urban

Contrasting Visions of Urban Transportation Victoria Transport Policy Institute
28
and Metropolitan Policy (www.brook.edu); at
www.brookings.edu/es/urban/publications/growthmanagexsum.htm.
NCSL (2010), Public-Private Partnerships for Transportation: A Toolkit for Legislators, National
Conference of State Legislatures (www.ncsl.org); at www.ncsl.org/default.aspx?tabid=20321.
Randal O’Toole (2010), Fixing Transit: The Case For Privatization, Policy Analysis 670, Cato Institute
(www.cato.org); at www.cato.org/pubs/pas/PA670.pdf.
PPIAF (2006), Urban Bus Toolkit: Tools and Options for Reforming Urban Bus Systems, Public-Private
Infrastructure Advisory Facility (www.ppiaf.org); at
www.ppiaf.org/ppiaf/sites/ppiaf.org/files/documents/toolkits/UrbanBusToolkit/assets/home.html.
Giorgio Ragazzi (2006), “Are Highways Best Run By Concessions? The Italian Experience,” World
Transport Policy & Practice, Vol. 12, No. 2 (www.ecoplan.org/wtpp/wtj_index.htm), Spring, pp. 22-34;
at www.eco-logica.co.uk/pdf/WTPP12.2.pdf.
Jean Shaoul, Anne Stafford And Pam Stapleton (2012), The Fantasy World of Private Finance for
Transport via Public Private Partnerships, Discussion Paper No. 2012-6, International Transport Forum
(www.internationaltransportforum.org); at
www.internationaltransportforum.org/jtrc/DiscussionPapers/DP201206.pdf.
Lynn Scholl (2006), “Privatization of Public Transit: A Review of the Research on Contracting of Bus
Services in the United States,” Berkeley Planning Journal, Volume 19 (www-dcrp.ced.berkeley.edu/bpj),
pp. 143-161; at www.ced.berkeley.edu/pubs/bpj/pdf/19-8-Scholl.pdf.
Elliott D. Sclar (2000), You Don't Always Get What You Pay for: The Economics of Privatization,
Century Foundation Books (www.tcf.org).
Gisele F. Silva (2000), Toll Roads, Public Policy for the Private Sector, World Bank
(www.worldbank.org); at http://rru.worldbank.org/documents/publicpolicyjournal/224Silva-1211.pdf.
Jeffery J. Smith and Thomas A. Gihring (2004), Financing Transit Systems Through Value Capture: An
Annotated Bibliography, Geonomy Society (www.progress.org/geonomy); at www.vtpi.org/smith.pdf;
originally published as “Financing Transit Systems Through Value Capture: Annotated Bibliography,”
American Journal of Economics and Sociology, Volume 65, Issue 3, July 2006, pp. 751-786.
Subsidy Scope (2009), Analysis Finds Shifting Trends in Highway Funding: User Fees Make Up
Decreasing Share Subsidy Scope (www.subsidyscope.com); at
www.subsidyscope.com/transportation/highways/funding.
Didier van de Velde, Wijnand Veeneman, David Hensher and Ruth Steel, editors (2010), Research in
Transportation Economics; Special Issue on Reforming Public Transportation, Vol. 29, Issue 1.
W. Veeneman (2010), “Changing Public Transport Governance In Dutch Metropoles: To Tender Or Not
To Tender,” Research in Transportation Economics, Vol. 29, Issue 1, pp. 195-203; summary
www.sciencedirect.com/science/journal/07398859.
Manuel Vigo (2013), Slow Jam: Can Lima Finally Untangle Its Transportation Mess?, Next City
(wwwnextcity.org); at http://nextcity.org/forefront/view/slow-jam.

Contrasting Visions of Urban Transportation Victoria Transport Policy Institute
29
Jarrett Walker (2010), On Privatization Scares, Human Transit (www.humantransit.org/2010/09/on-
privatization-scares.html).
Paul Weyrich and William Lind (2001), Twelve Anti-Transit Myths: A Conservative Critique, Free
Congress Research and Education Center, Smart Growth America
(www.smartgrowthamerica.org/weyrich3.pdf).
World Bank (2009), Transport On A Human Scale, World Bank (www.worldbank.org); at
http://siteresources.worldbank.org/INTCOLUMBIAINSPANISH/Resources/TransporteColombia.pdf.
Lloyd Wright (2007), Bus Rapid Transit Planning Guide, Institute for Transportation and Development
Policy (www.itdp.org); at www.itdp.org/index.php/microsite/brt_planning_guide.
Chris Zegras (2006), Private Sector Participation in Urban Transport Infrastructure Provision, Module
1C, Sustainable Transportation: A Sourcebook for Policy-Makers in Developing Countries, Sustainable
Urban Transport Project – Asia (www.sutp.org); at www.sutp.org/dn.php?file=1C-PSP-EN.pdf.

Contrasting Visions of Urban Transportation Victoria Transport Policy Institute
30
Endnotes 1 For more information see the “Transit Examples” (www.vtpi.org/tdm/tdm118.htm) chapters of our Online TDM
Encyclopedia (www.vtpi.org/tdm).
2 www.victoriaairportshuttle.com.
3 www.bctransit.com.
4 Wikipedia (http://en.wikipedia.org/wiki/London_Underground).
5 Morris 2006; Wikipedia (http://railways.wikia.com/wiki/Privatisation_of_British_Rail).
6 “Tories Change Policy On Railways,” BBC Online, BBC, 17 July 2006
(http://news.bbc.co.uk/1/hi/uk_politics/5186196.stm).
7 http://web.co.clayton.ga.us/ctran/index.htm
8 http://www.quicktransit.net
9 “C-Tran Reaches End of The Line,” Clayton County New, 29 March 2010 (www.ajc.com/news/clayton/c-tran-
reaches-end-416424.html).
10 Sydney Airport Link Fees Insane Abusrd, Psychopyk Blog (http://psychopyko.com/general/sydney-airport-link-
fees-insane-abusrd), 27 Feb. 2010.
11 Wikipedia (http://en.wikipedia.org/wiki/Airport_and_East_Hills_railway_line,_Sydney).
12 ITLS 2010; at http://sydney.edu.au/business/itls/tops.
13 See, Taxi Hell In South Africa (www.therightperspective.org/2009/03/24/taxi-hell-in-south-africa).
14 Until automobile travel is efficiently priced, transit subsidies can be justified on second-best grounds.
15 FTA (2010), Transit Profiles: The Top 50 Agencies, National Transit Database 2009 Report Year
(www.ntdprogram.gov/ntdprogram/pubs/top_profiles/2009/Transit_Profiles_Top%2050%20Agencies-Complete.pdf).
16 In this case “rational” means that they are ideologically unbiased and so will support the mix of public and private
ownership that provides the greatest net benefits, considering all benefits and costs.
17 APTA (2010), “Table 8,” 2010 Public Transportation Fact Book, American Public Transportation Association
(www.apta.com); at www.apta.com/resources/statistics/Documents/FactBook/APTA_2010_Fact_Book.pdf.
18 See discussion in my Planetizen blog, A Trillion Dollars, or Cents Per Day (www.planetizen.com/node/39892).
19 www.fhwa.dot.gov/policyinformation/statistics/2008/hf10.cfm.
20 Delucchi estimated that non-residential parking subsidies totaled $148-$288 billion annually in 1991, or $225 -
$438 billion in 2007. See Delucchi (1996), Annualized Social Cost of Motor-Vehicle Use in the U.S., 1990-1991,
Vol. 6, Institute of Transportation Studies (http://engineering.ucdavis.edu), Table 6-B.1 as summarized in “Parking
Costs,” Transportation Cost and Benefit Analysis, (www.vtpi.org/tca/tca0504.pdf).
21 According to the Bureau of Labor Statistics’ 2009 Consumer Expenditure Survey
(ftp://ftp.bls.gov/pub/special.requests/ce/standard/2009/income.txt), households spent $7,658 on transportation, of
which $479 is for public transport and $7,179 is for automobiles, or $2,872 per capita since there are 2.5 average
household members. $65 annual transit subsidy is 2.2% of this amount.
22 For example, O’Toole cites a commuter train conductor who earned $240,000 in one year, giving the impression
that is typical; in fact the worker had cashed out many years of sick and vacation time in preparation for retirement.
23 www.bls.gov/oco/ocos242.htm.
24 www.glassdoor.com/Hourly-Pay/Greyhound-Bus-Driver-Hourly-Pay-E93_D_KO10,20.htm.
25 The higher transit operating costs in larger cities are not necessarily true inefficiencies. They can be attributed to a
combination of factors including congestion (which slows vehicle operations), higher wages common in larger

Contrasting Visions of Urban Transportation Victoria Transport Policy Institute
31
cities, major new investments (particularly in cities such as Portland that are expanding their transit systems), and
outdated policies and practices. Only the last can be considered a true inefficiency.
26 See the Center for Transportation Excellence’s Transportation Elections webpage.
http://216.119.75.74/success/pastelections.asp. For example, referenda financing public transit succeeded 67% in
2007, 74% in 2008 and 73% in 2009.
27 APTA (2010), Table 41, “Operating Funding Sources,” Public Transportation Fact Book; Appendix A: Historical
Tables, American Public Transportation Association
(www.apta.com/resources/statistics/Documents/FactBook/2010_Fact_Book_Appendix_A.pdf).
28 ULI (2009), Emerging Trends in Real Estate, Urban Land Institute (www.uli.org); at
www.uli.org/ResearchAndPublications/EmergingTrends/Americas.aspx.
29 Colliers (2009), Global CBC Parking Rate Survey, Colliers International (www.colliers.com). Also see “Parking
Costs,” Transportation Cost and Benefit Analysis, VTPI (www.vtpi.org/tca/tca0504.pdf).
30 Based on data from the FHWA’s Highway Statistics and the Bureau of Economic Account’s Gross Domestic
Product By Metropolitan Area (www.bea.gov/regional/gdpmetro).
31 APTA 2010. Tables 6 shows 21,757 million bus passenger-miles and Table 8 shows 2,052 bus revenue miles, and
assuming that buses average 5.0 miles per gallon.
32 Aurbach (http://pedshed.net/?p=219), based on Mikhail V Chester and Arpad Horvath (2009), “Environmental
Assessment Of Passenger Transportation Should Include Infrastructure And Supply Chains,” Environmental
Research Letters, Vol. 4; at http://iopscience.iop.org/1748-9326/4/2/024008. Also see “Resource Costs” chapter of
Transportation Cost and Benefit Analysis (www.vtpi.org/tca/tca0512.pdf).
33 Randal O’Toole (2010), Why Transit Will Never Be Energy Efficient, Antiplanner
(http://ti.org/antiplanner/?p=4086).
34 Also see www.reavaya.org.za; www.planetizen.com/node/45041.
www.vtpi.org/cont_vis.pdf