contrast sensitivity of pattern transient vep components ... · contrast sensitivity of pattern...
TRANSCRIPT
Psychology & Neuroscience, 2013, 6, 2, 191 - 198DOI: 10.3922/j.psns.2013.2.07
Contrast sensitivity of pattern transient VEP components: contribution from M and P pathwaysGivago S. Souza, Bruno D. Gomes, Eliza Maria C.B. Lacerda, Cézar A. Saito, Manoel da Silva Filho, and Luiz Carlos L. SilveiraUniversidade Federal do Pará, Belém, PA, Brazil
AbstractThe purpose of this study was to compare contrast sensitivity estimated from transient visual evoked potentials (VEPs) elicited by achromatic pattern-reversal and pattern-onset/offset modes. The stimuli were 2-cpd, achromatic horizontal gratings presented either as a 1 Hz pattern reversal or a 300 ms onset/700 ms offset stimulus. Contrast thresholds were estimated by linear regression to amplitudes of VEP components vs. the logarithm of the stimulus contrasts, and these regressions were extrapolated to the zero amplitude level. Contrast sensitivity was defined as the inverse of contrast threshold. For pattern reversal, the relation between the P100 amplitude and log of the stimulus contrast was best described by two separate linear regressions. For the N135 component, a single straight line was sufficient. In the case of pattern onset/offset for both the C1 and C2 components, single straight lines described their amplitude vs. log contrast relations in the medium-to-low contrast range. Some saturation was observed for C2 components. The contrast sensitivity estimated from the low-contrast limb of the P100, from the N135, and from the C2 were all similar but higher than those obtained from the high-contrast limb of the P100 and C1 data, which were also similar to each other. With 2 cpd stimuli, a mechanism possibly driven by the M pathway appeared to contribute to the P100 component at medium-to-low contrasts and to the N135 and C2 components at all contrast levels, whereas another mechanism, possibly driven by the P and M pathways, appeared to contribute to the P100 component at high contrast and C1 component at all contrast levels. Keywords: visual evoked potentials, contrast sensitivity, spatial vision, visual pathways, parallel processing.
Received 26 July 2012; received in revised form 11 January 2013; accepted 14 January 2013. Available online 18 November 2013.
Givago S. Souza, Bruno D. Gomes, Eliza Maria C.B. Lacerda, Cézar A. Saito, Manoel da Silva Filho, and Luiz Carlos L. Silveira, Instituto de Ciências Biológicas, Universidade Federal do Pará, Belém, Brazil. Givago S. Souza and Luiz Carlos L. Silveira, Núcleo de Medicina Tropical, Universidade Federal do Pará, Belém, Brazil. Correspondence regarding this article should be directed to: Givago da Silva Souza, Universidade Federal do Pará, Núcleo de Medicina Tropical, Av. Generalíssimo Deodoro 92 (Umarizal), Belém, Pará, 66055-240, Brazil. Phone: +55 91 32016819. Fax: +55 91 32410032. E-mail: [email protected]
IntroductionThe relationship between amplitudes and latencies
of different components of transient visual evoked potentials (VEPs) and certain stimulus features such as the contrast of stimuli presented in appearance-disappearance and phase-reversal modes has been previously investigated in several studies (Estévez & Spekreijse, 1974; Jeffreys, 1977; Kulikowski, 1977; Shawkat & Kriss, 1998a, 2000). The way in which VEP changes with stimulus contrast has been used to distinguish between the cortical activity of different visual pathways (Campbell & Maffei, 1970; Nakayama & Mackeben, 1982; Bobak, Bodis-Wollner, Harnois, & Harnois, 1984; Previc, 1988; Valberg & Rudvin, 1997; Rudvin, Valberg, & Kilavik, 2000; Ellemberg,
Hammarrenger, Lepore, Roy, & Guillemot, 2001; Gomes, Souza, Rodrigues, Saito, Silveira, & da Silva Filho, 2006; Gomes, Souza, Lima, Rodrigues, Saito, da Silva Filho, & Silveira, 2008; Souza, Gomes, Saito, da Silva Filho, & Silveira, 2007; Souza, Gomes, Lacerda, Saito, da Silva Filho, & Silveira, 2008). Visual evoked potential amplitude linearly depends on the logarithm of stimulus contrast, sometimes with saturation at high contrasts. Although often only one straight line is sufficient to describe the data, depending on the spatial frequency, two separate straight lines may be needed (Campbell & Maffei, 1970; Nakayama & Mackeben, 1982; Bobak et al., 1984; Valberg & Rudvin, 1997; Rudvin et al., 2000; Souza et al., 1997, 1998).
Zemon & Gordon (2006) and Souza et al. (2007, 2008) suggested that a function that relates VEP amplitude with stimulus contrast that linearly increases and then saturates at high achromatic contrasts is a signature of the activity of a single visual pathway, possibly the magnocellular (M) pathway, which is highly sensitive to contrast, reflected by single-cell recordings of M neurons in the retina and lateral geniculate nucleus (LGN) (Kaplan & Shapley, 1982, 1986; Lee, Martin, & Valberg, 1989; Lee et al., 2000). Souza et al. (2007) also suggested that a double-slope function indicates a contrast-dependent contribution of different visual pathways to VEP. The high-contrast-sensitive M
192 Souza et al.
pathway dominates the VEP at low contrasts, whereas the low-contrast-sensitive pathway dominates the VEP at high contrasts (i.e., the parvocellular [P] pathway either in isolation or in combination with other visual pathways; Valberg & Rudvin, 1997; Rudvin et al., 2000; Souza et al., 2007).
Based on the literature, it is unclear what generator mechanisms elicit transient VEP components. Also unknown is how the presentation mode (pattern reversal and onset/offset) influences the contribution of each generator mechanism. In the present study we used the response-contrast functions of different transient VEP components to estimate contrast thresholds. We assumed that similar threshold contrasts indicate generation by the same generator mechanism. We chose a spatial frequency of 2 cycles per degree (cpd), for which we previously found that double-slope functions are usually generated by a pattern-reversal stimulation mode.
Methods
SubjectsTwelve subjects without previous ocular, systemic,
or degenerative diseases participated in the experiments. All subjects had normal visual acuity or were corrected to 20/20. The stimuli were viewed monocularly with the eye with the lowest dioptric error value using optical corrections. All experiments were performed according to the tenets of the Declaration of Helsinki. They were also approved by the Committee for Ethics in Research of the Federal University of Para (Report 113/2004, November 25, 2004) following Resolution 196/96 of the Health National Council of Brazil.
Visual stimulationA Flexscan T662 color monitor (Eizo, Ishikawa,
Japan) with a 100 Hz frame rate and 800 × 600 pixel spatial resolution was used for visual stimulus presentation. The monitor was driven by a VSG2/3 graphics card (Cambridge Research Systems, Rochester, UK) and controlled by Psycho v2.6 software (Cambridge Research Systems). Gamma correction was performed using an OP200E OptiCAL photometer (Cambridge Research Systems). The monitor was positioned 1 m from the subject.
Horizontal achromatic sine-wave gratings (2 cpd) were presented in a circle with a 5º visual angle in two temporal configurations: 1 Hz pattern-reversal presentation (n = 10, five males and five females; mean ± SD age, 23.8 ± 3.3 years) and onset (300 ms)/offset (700 ms) presentation (n = 6, n = 10, two males and four females; mean ± SD age, 22.2 ± 2.2 years). All stimuli had the same mean chromaticity (CIE 1976: u’ = 0.215, v’ = 0.480). The mean luminance was 40 cd/m2 for achromatic pattern reversal and 34.3 cd/m2 for achromatic onset/offset presentation. The stimuli were surrounded by a background with the same mean luminance and mean chromaticity. Between eight and ten Michelson contrasts (low-contrast range, <10%;
medium-contrast range, 10%-50%; high-contrast range, >50%) were presented for each presentation mode. For onset/offset presentation, the Michelson contrast might not be fully appropriate because the duration of the offset phase (700 ms) was more than twice the duration of the onset phase (300 ms). We considered that the effect of the duration differences in the onset and offset phases in the contrast was small and did not interfere with the results.
Recording proceduresElectrode placement was performed according to
the recommendations of the International Society of Clinical Electrophysiology of Vision (ISCEV; Odom et al., 2004), consisting of three gold-cup electrodes placed at Oz (active), Fz (reference), and Fpz (ground) reference points. Recordings were amplified 50,000 times and band-pass-filtered with 0.5-100 Hz cut-off frequencies using a differential amplifier (MAS800, Cambridge Research Systems). Optima v.1.4 software (Cambridge Research Systems) controlled an AS-1 data acquisition card (Cambridge Research Systems) to allow on-line digital recording at 1 kHz with a 12-bit resolution sampling rate.
AnalysisWe recorded 120-480 sweeps (each lasting 1000
ms) at each contrast. Each sweep was subjected to off-line Fast Fourier Transform software and further band-pass-filtered between 0.5 and 40 Hz. An inverse Fast Fourier Transform was applied to synthesize the off-line filtered recordings using all of the harmonics for onset/offset sweeps and even harmonics for pattern-reversal sweeps. The choice of only even harmonics in the inverse Fourier Transforms for pattern-reversal sweeps occurred because we found that the amplitude was little affected by filtering, with an increase in the signal-to-noise ratio of the recordings. We studied the average of all of the recorded sweeps at each contrast level for each subject, measuring the peak-to-baseline amplitude of the transient VEP components. The contrast threshold for each stimulation mode was estimated by extrapolating a linear model to a 0 µV amplitude level.
Results
Contrast threshold estimated from achromatic pattern reversal transient VEP components
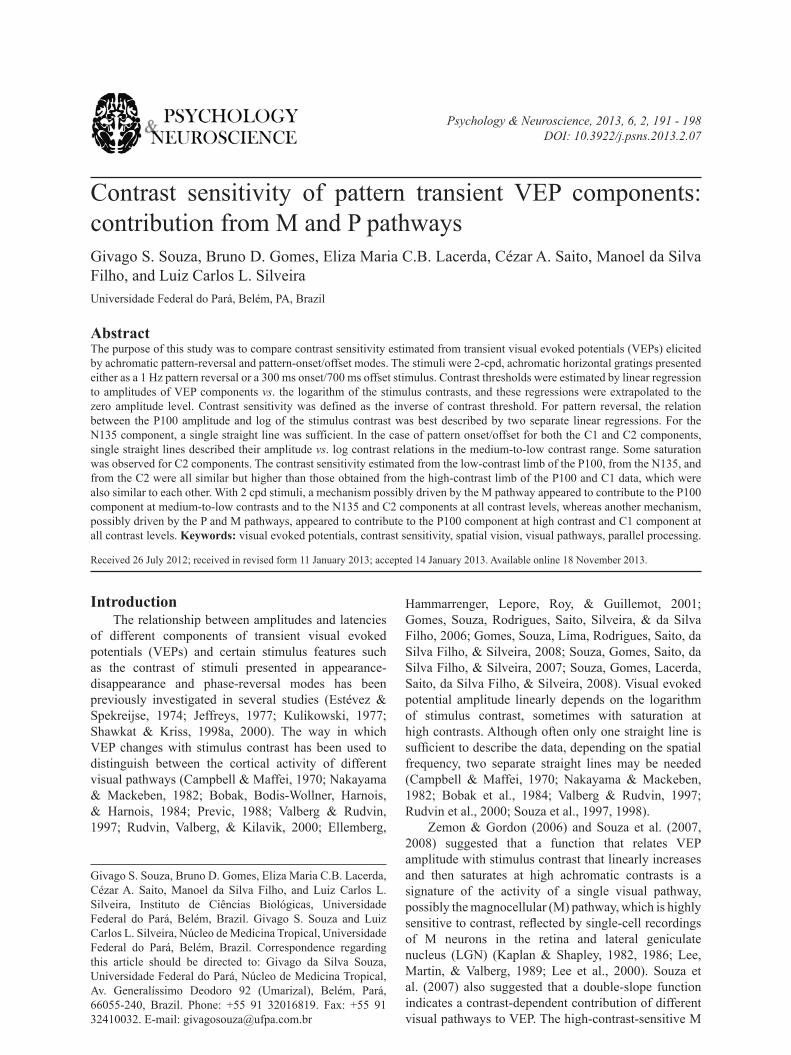
Transient VEPs were reliably recorded from all 10 subjects. An example from one of the subjects is presented in Figure 1. Three main components could be identified in the transient VEP elicited by pattern-reversal stimuli: N75, P100, and N135 (Figure 1A). This is consistent with the responses described in the ISCEV protocols (Odom et al., 2004). The N75 component was entirely absent in some of the subjects or appeared only at high contrast in others (>50%). The P100 and N135 components were present in all subjects and could be identified in a substantial range of contrasts. We
Contrast sensitivity of VEP components 193
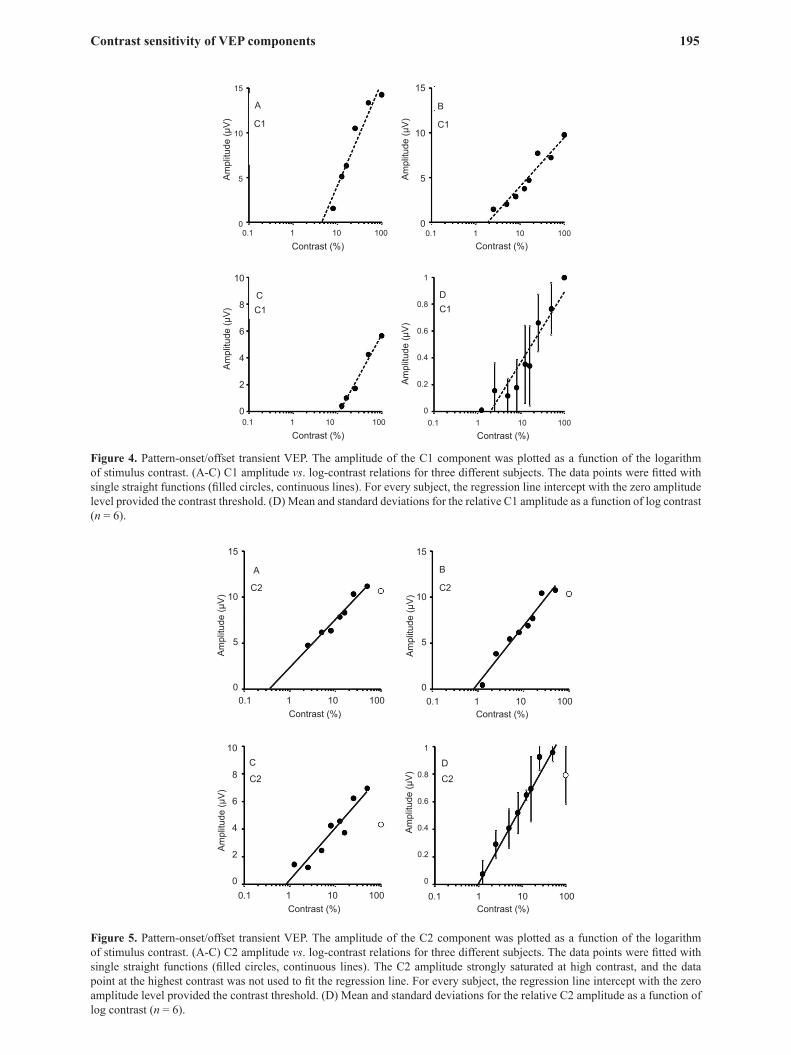
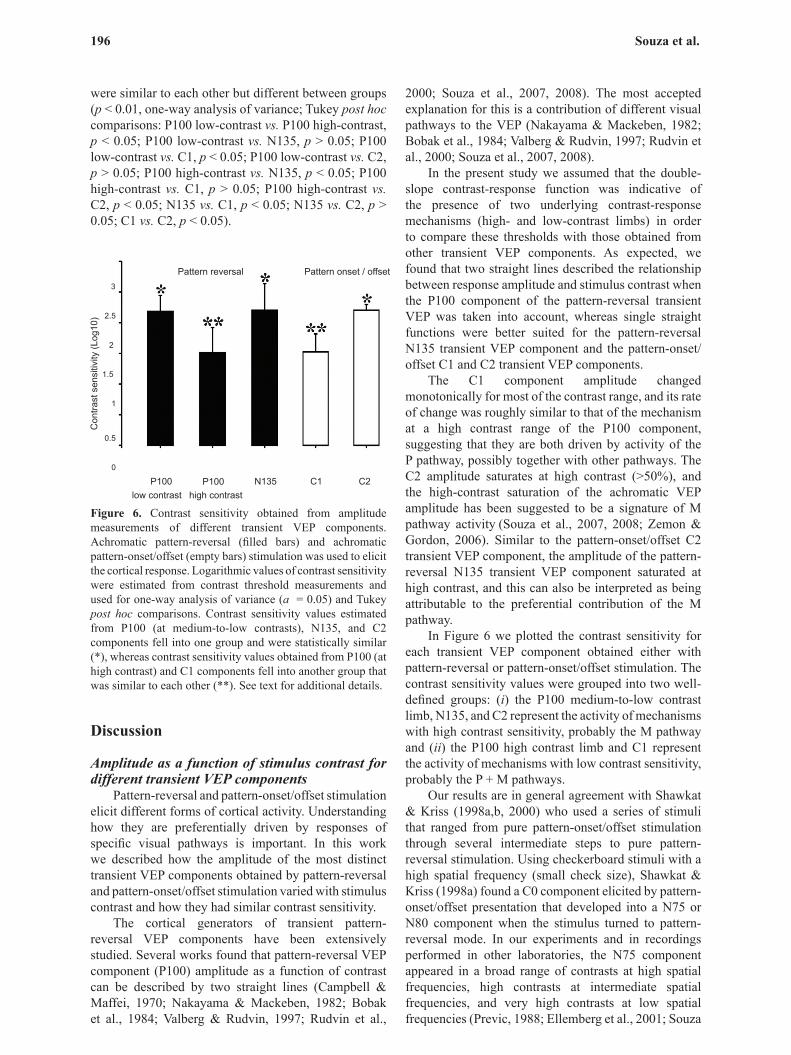
amplitude was described by straight lines in the low-to-medium contrast range (<50%; Figures 4 and 5). The C2 component amplitude saturated at high contrasts (>50%) in all of the subjects. These data were not used to estimate contrast threshold (Figure 5). The contrast thresholds estimated using the C1 and C2 amplitudes were 4.83% ± 3.65% and 0.90% ± 0.32%, respectively.
Statistical analysis of contrast sensitivities obtained from transient VEP components
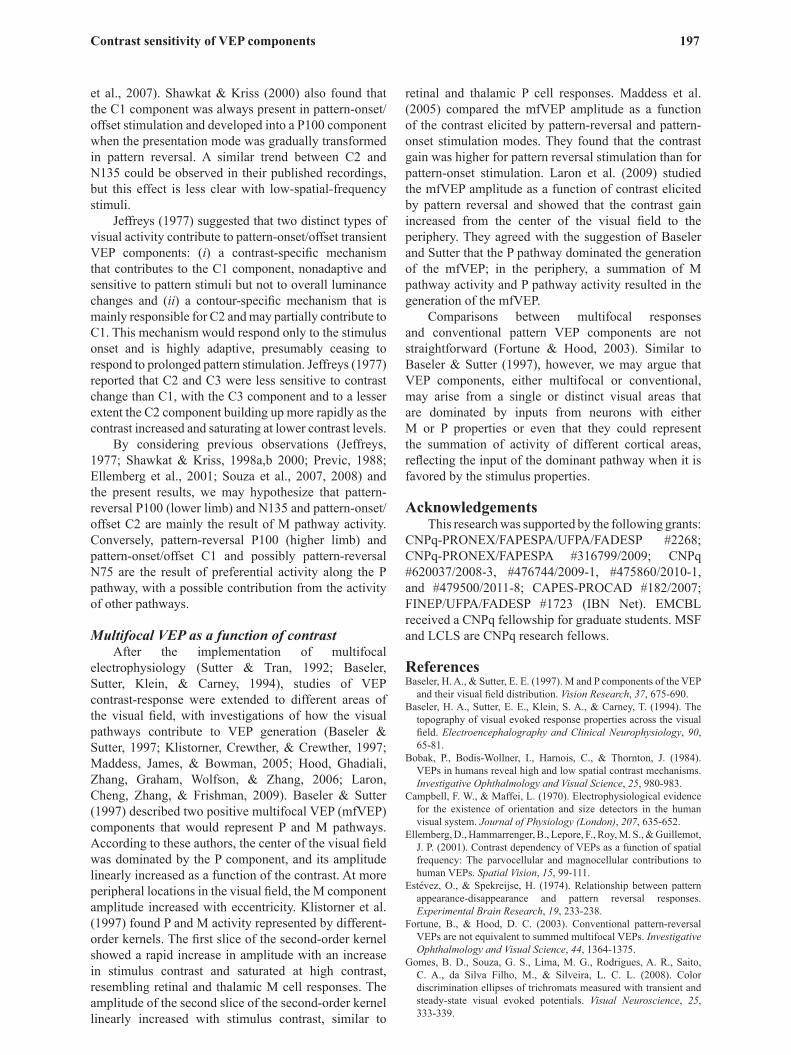
Contrast thresholds and contrast sensitivity obtained from amplitude measurements of different transient VEP components were converted to the logarithm of contrast sensitivity using the following relation: contrast sensitivity = 1/contrast threshold. We preferred to use the logarithm of contrast sensitivity instead of contrast sensitivity itself because the logarithmic values for all five groups had a normal distribution (Lilliefors test; p > 0.05) and could be used for further statistical comparisons. The means and standard deviations for the log contrast sensitivity of different transient VEP components were the following: P100 middle-to-low contrasts (2.18 ± 0.26), P100 high contrasts (1.51 ± 0.41), N135 (2.20 ± 0.43), C1 (1.44 ± 0.38), C2 (2.08 ± 0.2; Figure 6).
The contrast sensitivity values estimated using different transient VEP components fell into two groups. High contrast sensitivity values were obtained using low-to-medium contrast P100, N135, and C2 amplitude data points, whereas high-contrast P100 and C1 amplitude data points provided low contrast sensitivity values. The contrast sensitivity values within each group
Figure 1. Recordings obtained from one subject using two stimulation modes. (A) Pattern-reversal stimulation elicited transient VEPs with three main components: N75 (square), P100 (circle), and N135 (triangle). The earliest N75 component was detectable only at high contrasts and in some subjects was entirely absent. The P100 and N135 components were present at a range of contrast levels. (B) Pattern-onset/offset stimulation elicited transient VEPs also with three main components: C1 (square) and C2 (circle), which were present at a range of contrasts, and a late C3 component (triangle) that was variable among subjects.
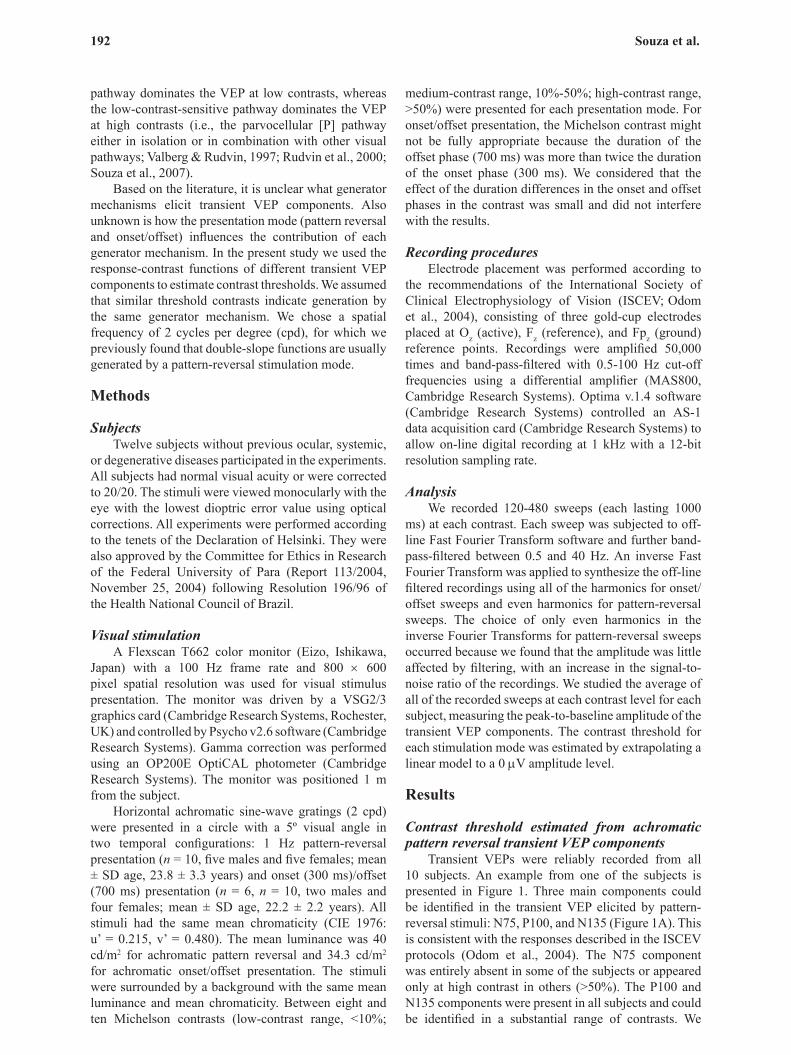
measured the baseline-to-peak amplitudes of these two components. Figures 2 and 3 present them as a function of log stimulus contrast.
In all subjects, the P100 amplitude as a function of log contrast could be described by two straight lines with a limb at medium-to-low contrasts (<50%) and another limb at high contrasts (Figure 2). The contrast thresholds obtained from the P100 amplitude data point at medium and low contrasts and high contrasts were 0.76% ± 0.43% and 4.34% ± 3.36% (mean ± SD), respectively. The N135 component amplitude could be described by a single straight line (Figure 3). The mean contrast threshold estimated from the N135 component was 0.90% ± 0.67%. A small degree of saturation was observed in the N135 component in some of the subjects; in this case, this data point was not used to estimate the contrast threshold (Figure 3A).
Contrast threshold estimated from achromatic pattern onset/offset transient VEP components
As described in the ISCEV protocols (Odom et al., 2004), three main components could be identified in transient VEPs elicited by pattern onset/offset stimuli: C1, C2, and C3 (Figure 1B). The first positive component C1 and the following negative component C2 were present in all of the subjects at a substantial range of contrasts, whereas the second positive component C3 was variable among subjects. Therefore, we only measured the amplitudes of C1 and C2 and related them to the stimulus contrast (Figures 4 and 5). The C1 component amplitude could be described with straight lines at all contrasts, whereas the C2 component
A B Michelson contrast (%)
100
50
25
16
12.5
8
5
2.5
1.25
P100N75
N135
C3
C2C1
Am
plitu
de (5
µV/d
iv)
Time (ms) Time (ms)
0 100 200 300 400 500 0 100 200 300 400 500
194 Souza et al.
Figure 2. Pattern-reversal transient VEP. The amplitude of the P100 component was plotted as a function of the logarithm of stimulus contrast. (A-C) P100 amplitude vs. log-contrast relations for three different subjects. The data points were fitted with double-slope straight functions composed of a limb at medium-to-low contrasts (filled circles, continuous lines) and another limb at high contrasts (empty circles, dashed lines). For every subject, the intercepts of the two regression lines with the zero amplitude level provided different values for contrast threshold. (D) Mean and standard deviations for the relative amplitude of the P100 component as a function of log contrast (n = 10).
Figure 3. Pattern-reversal transient VEP. The amplitude of the N135 component was plotted as a function of the logarithm of stimulus contrast. (A-C) N135 amplitude vs. log-contrast relations for three different subjects. The data points were fitted with single straight functions (filled circles, continuous lines). For every subject, the regression line intercept with the zero amplitude level provided the contrast threshold. (D) Mean and standard deviations for the relative amplitude of the N135 component as a function of log contrast (n = 10).
A
A B
C
B
C D
P100 P100
P100
0.1 1 10 100
0.1 1 10 1000.1 1 10 100
0.1 1 10 1000.1 1 10 100
P100
N135
N135 N135
N135
0.1 1 10 100 0.1 1 10 100
0.1 1 10 100
Contrast (%) Contrast (%)
Contrast (%)Contrast (%)
Contrast (%)
Contrast (%) Contrast (%)
Contrast (%)
Am
plitu
de (µ
V)
Am
plitu
de (µ
V)
Am
plitu
de (µ
V)
Am
plitu
de (µ
V)
Am
plitu
de (µ
V)
Am
plitu
de (µ
V)
Am
plitu
de (µ
V)
Am
plitu
de (µ
V)
15
10
5
0
15
10
5
0
1
0.8
0.6
0.4
0.2
0
10
8
6
4
2
0
10
8
6
4
2
0
10
8
6
4
2
0
10
8
6
4
2
0
10
8
6
4
2
0
Contrast sensitivity of VEP components 195
Figure 4. Pattern-onset/offset transient VEP. The amplitude of the C1 component was plotted as a function of the logarithm of stimulus contrast. (A-C) C1 amplitude vs. log-contrast relations for three different subjects. The data points were fitted with single straight functions (filled circles, continuous lines). For every subject, the regression line intercept with the zero amplitude level provided the contrast threshold. (D) Mean and standard deviations for the relative C1 amplitude as a function of log contrast (n = 6).
Figure 5. Pattern-onset/offset transient VEP. The amplitude of the C2 component was plotted as a function of the logarithm of stimulus contrast. (A-C) C2 amplitude vs. log-contrast relations for three different subjects. The data points were fitted with single straight functions (filled circles, continuous lines). The C2 amplitude strongly saturated at high contrast, and the data point at the highest contrast was not used to fit the regression line. For every subject, the regression line intercept with the zero amplitude level provided the contrast threshold. (D) Mean and standard deviations for the relative C2 amplitude as a function of log contrast (n = 6).
A
A
C
C
D
D
B
B
C1
C2 C2
C2C2
C1 C1
C1
Am
plitu
de (µ
V)
Am
plitu
de (µ
V)
Am
plitu
de (µ
V)
Am
plitu
de (µ
V)
Am
plitu
de (µ
V)
Am
plitu
de (µ
V)
Am
plitu
de (µ
V)
Am
plitu
de (µ
V)
0.1 1 10 100
0.1 1 10 100
0.1 1 10 100 0.1 1 10 100
0.1 1 10 1000.1 1 10 100
0.1 1 10 100
0.1 1 10 100
15
10
5
0
15
10
5
0
15
10
5
0
15
10
5
0
Contrast (%)
Contrast (%)
Contrast (%) Contrast (%)
Contrast (%) Contrast (%)
Contrast (%)
Contrast (%)
10
8
6
4
2
0
10
8
6
4
2
0
1
0.8
0.6
0.4
0.2
0
1
0.8
0.6
0.4
0.2
0
196 Souza et al.
were similar to each other but different between groups (p < 0.01, one-way analysis of variance; Tukey post hoc comparisons: P100 low-contrast vs. P100 high-contrast, p < 0.05; P100 low-contrast vs. N135, p > 0.05; P100 low-contrast vs. C1, p < 0.05; P100 low-contrast vs. C2, p > 0.05; P100 high-contrast vs. N135, p < 0.05; P100 high-contrast vs. C1, p > 0.05; P100 high-contrast vs. C2, p < 0.05; N135 vs. C1, p < 0.05; N135 vs. C2, p > 0.05; C1 vs. C2, p < 0.05).
Figure 6. Contrast sensitivity obtained from amplitude measurements of different transient VEP components. Achromatic pattern-reversal (filled bars) and achromatic pattern-onset/offset (empty bars) stimulation was used to elicit the cortical response. Logarithmic values of contrast sensitivity were estimated from contrast threshold measurements and used for one-way analysis of variance (a = 0.05) and Tukey post hoc comparisons. Contrast sensitivity values estimated from P100 (at medium-to-low contrasts), N135, and C2 components fell into one group and were statistically similar (*), whereas contrast sensitivity values obtained from P100 (at high contrast) and C1 components fell into another group that was similar to each other (**). See text for additional details.
Discussion
Amplitude as a function of stimulus contrast for different transient VEP components
Pattern-reversal and pattern-onset/offset stimulation elicit different forms of cortical activity. Understanding how they are preferentially driven by responses of specific visual pathways is important. In this work we described how the amplitude of the most distinct transient VEP components obtained by pattern-reversal and pattern-onset/offset stimulation varied with stimulus contrast and how they had similar contrast sensitivity.
The cortical generators of transient pattern-reversal VEP components have been extensively studied. Several works found that pattern-reversal VEP component (P100) amplitude as a function of contrast can be described by two straight lines (Campbell & Maffei, 1970; Nakayama & Mackeben, 1982; Bobak et al., 1984; Valberg & Rudvin, 1997; Rudvin et al.,
2000; Souza et al., 2007, 2008). The most accepted explanation for this is a contribution of different visual pathways to the VEP (Nakayama & Mackeben, 1982; Bobak et al., 1984; Valberg & Rudvin, 1997; Rudvin et al., 2000; Souza et al., 2007, 2008).
In the present study we assumed that the double-slope contrast-response function was indicative of the presence of two underlying contrast-response mechanisms (high- and low-contrast limbs) in order to compare these thresholds with those obtained from other transient VEP components. As expected, we found that two straight lines described the relationship between response amplitude and stimulus contrast when the P100 component of the pattern-reversal transient VEP was taken into account, whereas single straight functions were better suited for the pattern-reversal N135 transient VEP component and the pattern-onset/offset C1 and C2 transient VEP components.
The C1 component amplitude changed monotonically for most of the contrast range, and its rate of change was roughly similar to that of the mechanism at a high contrast range of the P100 component, suggesting that they are both driven by activity of the P pathway, possibly together with other pathways. The C2 amplitude saturates at high contrast (>50%), and the high-contrast saturation of the achromatic VEP amplitude has been suggested to be a signature of M pathway activity (Souza et al., 2007, 2008; Zemon & Gordon, 2006). Similar to the pattern-onset/offset C2 transient VEP component, the amplitude of the pattern-reversal N135 transient VEP component saturated at high contrast, and this can also be interpreted as being attributable to the preferential contribution of the M pathway.
In Figure 6 we plotted the contrast sensitivity for each transient VEP component obtained either with pattern-reversal or pattern-onset/offset stimulation. The contrast sensitivity values were grouped into two well-defined groups: (i) the P100 medium-to-low contrast limb, N135, and C2 represent the activity of mechanisms with high contrast sensitivity, probably the M pathway and (ii) the P100 high contrast limb and C1 represent the activity of mechanisms with low contrast sensitivity, probably the P + M pathways.
Our results are in general agreement with Shawkat & Kriss (1998a,b, 2000) who used a series of stimuli that ranged from pure pattern-onset/offset stimulation through several intermediate steps to pure pattern-reversal stimulation. Using checkerboard stimuli with a high spatial frequency (small check size), Shawkat & Kriss (1998a) found a C0 component elicited by pattern-onset/offset presentation that developed into a N75 or N80 component when the stimulus turned to pattern-reversal mode. In our experiments and in recordings performed in other laboratories, the N75 component appeared in a broad range of contrasts at high spatial frequencies, high contrasts at intermediate spatial frequencies, and very high contrasts at low spatial frequencies (Previc, 1988; Ellemberg et al., 2001; Souza
Pattern reversal
low contrast
high contrast
P100 P100 N135 C1 C2
Pattern onset / offset
Con
trast
sen
sitiv
ity (L
og10
)
3
2.5
2
1.5
1
0.5
0
Contrast sensitivity of VEP components 197
et al., 2007). Shawkat & Kriss (2000) also found that the C1 component was always present in pattern-onset/offset stimulation and developed into a P100 component when the presentation mode was gradually transformed in pattern reversal. A similar trend between C2 and N135 could be observed in their published recordings, but this effect is less clear with low-spatial-frequency stimuli.
Jeffreys (1977) suggested that two distinct types of visual activity contribute to pattern-onset/offset transient VEP components: (i) a contrast-specific mechanism that contributes to the C1 component, nonadaptive and sensitive to pattern stimuli but not to overall luminance changes and (ii) a contour-specific mechanism that is mainly responsible for C2 and may partially contribute to C1. This mechanism would respond only to the stimulus onset and is highly adaptive, presumably ceasing to respond to prolonged pattern stimulation. Jeffreys (1977) reported that C2 and C3 were less sensitive to contrast change than C1, with the C3 component and to a lesser extent the C2 component building up more rapidly as the contrast increased and saturating at lower contrast levels.
By considering previous observations (Jeffreys, 1977; Shawkat & Kriss, 1998a,b 2000; Previc, 1988; Ellemberg et al., 2001; Souza et al., 2007, 2008) and the present results, we may hypothesize that pattern-reversal P100 (lower limb) and N135 and pattern-onset/offset C2 are mainly the result of M pathway activity. Conversely, pattern-reversal P100 (higher limb) and pattern-onset/offset C1 and possibly pattern-reversal N75 are the result of preferential activity along the P pathway, with a possible contribution from the activity of other pathways.
Multifocal VEP as a function of contrastAfter the implementation of multifocal
electrophysiology (Sutter & Tran, 1992; Baseler, Sutter, Klein, & Carney, 1994), studies of VEP contrast-response were extended to different areas of the visual field, with investigations of how the visual pathways contribute to VEP generation (Baseler & Sutter, 1997; Klistorner, Crewther, & Crewther, 1997; Maddess, James, & Bowman, 2005; Hood, Ghadiali, Zhang, Graham, Wolfson, & Zhang, 2006; Laron, Cheng, Zhang, & Frishman, 2009). Baseler & Sutter (1997) described two positive multifocal VEP (mfVEP) components that would represent P and M pathways. According to these authors, the center of the visual field was dominated by the P component, and its amplitude linearly increased as a function of the contrast. At more peripheral locations in the visual field, the M component amplitude increased with eccentricity. Klistorner et al. (1997) found P and M activity represented by different-order kernels. The first slice of the second-order kernel showed a rapid increase in amplitude with an increase in stimulus contrast and saturated at high contrast, resembling retinal and thalamic M cell responses. The amplitude of the second slice of the second-order kernel linearly increased with stimulus contrast, similar to
retinal and thalamic P cell responses. Maddess et al. (2005) compared the mfVEP amplitude as a function of the contrast elicited by pattern-reversal and pattern-onset stimulation modes. They found that the contrast gain was higher for pattern reversal stimulation than for pattern-onset stimulation. Laron et al. (2009) studied the mfVEP amplitude as a function of contrast elicited by pattern reversal and showed that the contrast gain increased from the center of the visual field to the periphery. They agreed with the suggestion of Baseler and Sutter that the P pathway dominated the generation of the mfVEP; in the periphery, a summation of M pathway activity and P pathway activity resulted in the generation of the mfVEP.
Comparisons between multifocal responses and conventional pattern VEP components are not straightforward (Fortune & Hood, 2003). Similar to Baseler & Sutter (1997), however, we may argue that VEP components, either multifocal or conventional, may arise from a single or distinct visual areas that are dominated by inputs from neurons with either M or P properties or even that they could represent the summation of activity of different cortical areas, reflecting the input of the dominant pathway when it is favored by the stimulus properties.
Acknowledgements
This research was supported by the following grants: CNPq-PRONEX/FAPESPA/UFPA/FADESP #2268; CNPq-PRONEX/FAPESPA #316799/2009; CNPq #620037/2008-3, #476744/2009-1, #475860/2010-1, and #479500/2011-8; CAPES-PROCAD #182/2007; FINEP/UFPA/FADESP #1723 (IBN Net). EMCBL received a CNPq fellowship for graduate students. MSF and LCLS are CNPq research fellows.
ReferencesBaseler, H. A., & Sutter, E. E. (1997). M and P components of the VEP
and their visual field distribution. Vision Research, 37, 675-690.Baseler, H. A., Sutter, E. E., Klein, S. A., & Carney, T. (1994). The
topography of visual evoked response properties across the visual field. Electroencephalography and Clinical Neurophysiology, 90, 65-81.
Bobak, P., Bodis-Wollner, I., Harnois, C., & Thornton, J. (1984). VEPs in humans reveal high and low spatial contrast mechanisms. Investigative Ophthalmology and Visual Science, 25, 980-983.
Campbell, F. W., & Maffei, L. (1970). Electrophysiological evidence for the existence of orientation and size detectors in the human visual system. Journal of Physiology (London), 207, 635-652.
Ellemberg, D., Hammarrenger, B., Lepore, F., Roy, M. S., & Guillemot, J. P. (2001). Contrast dependency of VEPs as a function of spatial frequency: The parvocellular and magnocellular contributions to human VEPs. Spatial Vision, 15, 99-111.
Estévez, O., & Spekreijse, H. (1974). Relationship between pattern appearance-disappearance and pattern reversal responses. Experimental Brain Research, 19, 233-238.
Fortune, B., & Hood, D. C. (2003). Conventional pattern-reversal VEPs are not equivalent to summed multifocal VEPs. Investigative Ophthalmology and Visual Science, 44, 1364-1375.
Gomes, B. D., Souza, G. S., Lima, M. G., Rodrigues, A. R., Saito, C. A., da Silva Filho, M., & Silveira, L. C. L. (2008). Color discrimination ellipses of trichromats measured with transient and steady-state visual evoked potentials. Visual Neuroscience, 25, 333-339.
198 Souza et al.
Gomes, B. D., Souza, G. S., Rodrigues, A. R., Saito, C. A., Silveira, L. C., & da Silva Filho, M. (2006). Normal and dichromatic color discrimination measured with transient visual evoked potential. Visual Neuroscience, 23, 617-627.
Hood, D. C., Ghadiali, Q., Zhang, J. C., Graham, N. V., Wolfson, S. S., & Zhang, X. (2006). Contrast response functions for multifocal visual evoked potentials: A test of a model relating V1 activity to multifocal visual evoked potential activity. Journal of Vision, 6, 580-593.
Jeffreys, D. A. (1977). The physiological significance of pattern visual evoked potentials. In: J. E. Desmedt (Ed.), Visual evoked potentials in man: new developments: Methodology of patterned visual stimulation, neurophysiology of visual functions in man, clinical applications (pp. 134-167). Oxford, UK: Clarendon Press.
Kaplan, E., & Shapley, R. M. (1986). The primate retina contains two types of ganglion cells, with high and low contrast sensitivity. Proceedings of the National Academy of Sciences of the United States of America, 83, 2755-2757.
Kaplan, E., Shapley, R. M. (1982). X and Y cells in the lateral geniculate nucleus of macaque monkeys. Journal of Physiology (London), 330, 125-143.
Klistorner, A., Crewther, D. P., & Crewther, S. G. (1997). Separate magnocellular and parvocellular contributions from temporal analysis of the multifocal VEP. Vision Research, 38, 2161-2169.
Kremers, J., Silveira, L. C., & Kilavik, B. E. (2001). Influence of contrast on the responses of marmoset lateral geniculate cells to drifting gratings. Journal of Neurophysiology, 85, 235-246.
Kulikowski, J. J. (1977). Separation of occipital potentials related to the detection of pattern and movement. In: J. E. Desmedt (Ed.), Visual evoked potentials in man: new developments: New developments, methodology of patterned visual stimulation, neurophysiology of visual functions in man, clinical applications (pp. 184-196). Oxford, UK: Clarendon Press.
Laron, M., Cheng, H., Zhang, B., & Frishman, L. J. (2009). The effect of eccentricity on the contrast response function of multifocal visual evoked potentials (mfVEPs). Vision Research, 49, 1711-1716.
Lee, B. B., Martin, P. R., & Valberg, A. (1989). Sensitivity of macaque retinal ganglion cells to chromatic and luminance flicker. Journal of Physiology (London), 414, 223-243.
Lee, B. B., Silveira, L. C. L., Yamada, E. S., Hunt, D. M., Kremers, J., Martin, P. R., ... da Silva Filho, M. (2000). Visual responses of ganglion cells of a New World primate, the capuchin monkey, Cebus apella. Journal of Physiology (London), 528, 573-590.
Maddess, T., James, A. C., & Bowman, E. A. (2005). Contrast response of temporally sparse dichoptic multifocal visual evoked potentials. Visual Neuroscience, 22, 153-162.
Nakayama, K., & Mackeben, M. (1982). Steady state visual evoked potentials in the alert primate. Vision Research, 22, 1261-1271.
Odom, J. V., Bach, M., Barber, C., Brigell, M., Marmor, M. F., Tormene, A. P., ... Vaegan (2004). Visual evoked potentials standard (2004). Documenta Ophthalmologica, 108, 115-123.
Previc, F. H. (1988). The neurophysiological significance of the N1 and P1 components of the visual evoked potential. Clinical Vision and Science, 3, 195-202.
Rudvin, I., Valberg, A., & Kilavik, B. E. (2000). Visual evoked potentials and magnocellular and parvocellular segregation. Visual Neuroscience, 17, 579-590.
Shawkat, F. S., & Kriss, A. (1998a). Sequential pattern-onset, -reversal and -offset VEPs: Comparison of effects of checksize. Ophthalmic and Physiological Optics, 6, 495-503.
Shawkat, F. S., & Kriss, A. (1998b). Effects of experimental scotomata on sequential pattern-onset, pattern-reversal and pattern-offset evoked potentials. Documenta Ophthalmologica, 94, 307-320.
Shawkat, F. S., & Kriss, A. (2000). A study of the effects of contrast change on pattern VEPs, and the transition between onset, reversal and offset modes of stimulation. Documenta Ophthalmologica, 101, 73-89.
Souza, G. S., Gomes, B. D., Lacerda, E. M. C. B., Saito, C. A., da Silva Filho, M., & Silveira, L. C. L. (2008). Amplitude of the transient visual evoked potential (tVEP) as a function of achromatic and chromatic contrast: Contribution of different visual pathways. Visual Neuroscience, 25, 317-325.
Souza, G. S., Gomes, B. D., Saito, C. A., da Silva Filho, M., & Silveira, L. C. L. (2007). Spatial luminance contrast sensitivity measured with transient VEP: Comparison with psychophysics and evidence for multiple mechanisms. Investigative Ophthalmology and Visual Science, 48, 3396-3404.
Sutter, E. E., & Tran, D. (1992). The field topography of ERG components in man: I. The photopic luminance response. Vision Research, 32, 433-446.
Valberg, A., & Rudvin, I. (1997). Possible contributions of magnocellular- and parvocellular- pathway cells to transient VEPs. Visual Neuroscience, 14, 1-11.
Zemon, V., & Gordon, J. (2006). Luminance-contrast mechanisms in humans: Visual evoked potentials and a nonlinear model. Vision Research, 46, 4163-4180.