contracts and returns in private equity investments
TRANSCRIPT
J. Finan. Intermediation 22 (2013) 201–217
Contents lists available at SciVerse ScienceDirect
J. Finan. Intermediation
journal homepage: www.elsevier .com/locate/ jfi
Contracts and returns in private equity investments
Stefano Caselli a, Emilia Garcia-Appendini b,1, Filippo Ippolito c,⇑a Universitá Commerciale Luigi Bocconi, Italyb Universitá Commerciale Luigi Bocconi, IGIER, Italyc Universitat Pompeu Fabra, Barcelona Graduate School of Economics, Spain
a r t i c l e i n f o
Article history:Received 16 March 2010Available online 6 September 2012
Keywords:Private equity fundsVenture capitalIRRCovenantsBoard directors
1042-9573/$ - see front matter � 2012 Elsevier Inhttp://dx.doi.org/10.1016/j.jfi.2012.08.002
⇑ Corresponding author. Address: Department o25-27, Barcelona 08005, Spain. Fax: +34 93 542 17
E-mail address: [email protected] (F. Ipp1 Present address: University of St. Gallen, Rosenb
a b s t r a c t
We analyze the relationship between contracts and returns inprivate equity (PE) investments. Contractual control in the formof covenants tends to be employed to identify good deals. Betterquality firms are more likely to have covenant-rich contracts, asthey are less concerned by the constraints imposed by the cove-nants. PE investors appoint closer associates of the fund in dealsthat are performing poorly but tend to outsource board gover-nance in better deals. Collectively, our evidence suggests thatPE investors operate along two dimensions, choosing covenantsand board seats differently, based on the ex ante quality of thecompany.
� 2012 Elsevier Inc. All rights reserved.
1. Introduction
In recent years, the uniqueness and complexity of private equity (PE) contracts has attracted muchinterest among academics and the wider public. From a practical perspective, this has been the resultof the increasing importance of PE in the economy. From a conceptual perspective, PE contracts haveoffered academics a primary exploratory field for developing and testing theories of optimal contract-ing. An extensive theoretical literature has developed on how to optimally design the investments of
c. All rights reserved.
f Economics and Business, Universitat Pompeu Fabra, Ramon Trias Fargas46.
olito).ergstrasse 52, St. Gallen 9000, Switzerland.
202 S. Caselli et al. / J. Finan. Intermediation 22 (2013) 201–217
PE investors in venture capital financed firms.2 From the empirical viewpoint, however, there is still rel-atively little evidence on the relationship between contract design and investment returns.3
In this paper, we begin to fill this gap in the literature by examining how contracts and returns arerelated in PE investments. There are many dimensions along which PE investors structure the terms ofan investment in a PE-financed firm. These include, among others, the choice of securities, voting andcash flow rights, liquidation options, and the appointment of directors in the board of the target firm.In most cases, the definition of these terms is expressed in specific covenants that PE investors includein the contract at the time of entry.
The covenants used by PE investors are rather different from those attached to bank loans (Druckerand Puri, 2009) or credit lines (Sufi, 2009) which primarily focus on the maintenance of certain finan-cial ratios, such as cash flows over assets or interest coverage. In contrast, covenants in a PE contexteffectively define the securities held by PE investors, as they identify the contingencies in which cer-tain actions can be taken by the involved parties. By focusing on covenants we are then able to offernew insights on the structure of PE contracts and their relation to returns.
We base our work on a proprietary database of 834 deals provided by a currently active Italianmanagement company. The database covers all deals that occurred between January 1999 and Decem-ber 2005 in which the target company is incorporated in Italy and the investment company is regis-tered as an Italian PE management company. Although our sample is restricted to Italian deals, it isinformative of the PE market in continental Europe due to the common regulatory framework sharedby the members of the European Union. The majority of our deals belong to the categories of expan-sion financing (50.7%) and buyouts (27.1%), while venture capital financing, in the form of early stage,represents only a minority of observations (16.7%). Exit from investment primarily occurs via tradesale (86.9%), while IPOs and write-offs are relatively rare (respectively 5.1% and 6.5%).
We begin our analysis by observing that covenant-heavy contracts are generally associated withhigher returns, regardless of whether the measure of returns employed is the IRR of the fund, thechange in ROE and ROA, or the increase in sales over the investment period. The relationship seemsto be driven by lockups, permitted-transfer rights, exit ratchets, and, to a lesser extent, rights of firstrefusal and redemption rights.
We then examine self-selection in the choice of covenants. Li and Prabhala (2007) review severalmethods of self-selection. We focus on the model of Lee (1978), subsequently implemented by Goyal(2005) in a finance context.4 In this model the selection decision depends on the expected treatmenteffects that the inclusion of covenants has on returns. For completeness, we also estimate a standardswitching model. From the results obtained in the estimation of the two models, we find that there isa selection effect associated with the inclusion of covenants, and that covenant heavy firms are generallybetter performers.
These findings are consistent with two explanations. First, it may be that firms with higher ex-pected performance have lower bargaining power vis-a-vis PE investors and are required to acceptmore covenants. Alternatively, firms with better prospects are willing to take up more covenants be-cause they are less likely to be constrained by them. Therefore, the presence of covenants acts as a sig-nal of high quality. The first of these two explanations does not seem very plausible, as firms withbetter prospects should have stronger rather then weaker bargaining power when dealing with aPE investor. The second explanation appears relatively more plausible and particularly well suitedto covenants that offer protection to PE investors if performance is lower than expected. These cove-nants include redemption rights and permitted transfers, and are unlikely to bind for a successful firm.The estimated treatment effects are stronger for covenants that provide incentives to managers forprofit maximization, such as deals with lockup, rights of refusal, or an exit ratchet.
2 The theoretical models presented in Casamatta (2003),Cornelli and Yosha (2003), Hellmann (1998),Hellmann, 2006, andSchmidt (2003) offer different explanations for the complex contracting solutions commonly employed in venture capitalinvestments (Kaplan and Strömberg, 2003; Kaplan and Strömberg, 2004; Sahlman, 1990).
3 Cumming (2008) is the first to provide a systematic analysis of the relationship between contractual characteristics andperformance of PE investments. He does so by relating the allocation of control rights in PE contracts to the likelihood of exiting viaan acquisition, a write-off, or an IPO.
4 Dunbar (1995), Fang (2005), Goyal (2005) and Song (2004) all provide examples of how self-selection can be employed tostudy the role of private information in relation to the choices of economic agents. See Li and Prabhala (2007) for a survey.

S. Caselli et al. / J. Finan. Intermediation 22 (2013) 201–217 203
Next, we examine the choice of directors appointed in the board of target firms, which we regard asan alternative contracting dimension through which PE investors control the behavior of the firmsthey invest in. We classify appointed directors as either outsiders or insiders. We employ four differentmeasures for this classification. We look at whether the appointed director is or has been an employeeof the PE fund, presently has strong ties with the fund, had strong ties with the fund in the past, andwhether there is a match in the maturity of the appointment and the duration of the fund. We borrowfrom Lerner (1995) the hypothesis that insiders are appointed when the need for oversight is greater,which suggests a negative relationship between investment performance and the strength of the tiesbetween appointed director and fund. Our findings show a negative association between the appoint-ment of insiders and target firm profitability, which suggests that insiders are appointed in firms withlower prospects, thus providing support to Lerner’s hypothesis.
Overall, our findings contribute to the understanding of how PE investors design contracts in thepresence of hidden information and moral hazard. They operate along two dimensions choosing cov-enants and board seat differently, based on the ex ante quality of the company. Contractual control inthe form of covenants is primarily employed to identify good deals. Firms signal their quality byaccepting more or less covenant-heavy contracts, as better firms are less concerned by the constraintsimposed by the covenants. At the same time, however, covenants can also change performance, pos-sibly by strengthening the incentives of firm managers towards profit maximization. In addition tocovenants, PE investors employ direct board control to strengthen control in worse deals. They doso by appointing closer associates of the fund in deals that are performing poorly and outsourcingboard governance in better deals.
To our knowledge this is the first paper that addresses empirically the relationship between con-tracts and returns in PE investments. It establishes a link between the strand of literature on the re-turns of PE investments (Bygrave and Timmons, 1992;Gompers and Lerner, 1997; Groh andGottschalg, 2006;Kaplan and Schoar, 2005; Lerner et al., 2007;Ljungqvist and Richardson, 2003) andthat on venture capital contracts (Bengtsson, 2011; Gompers, 1999;Lerner and Merges, 1998; Metrickand Yasuda, 2010).
The rest of the paper is organized as follows. Section 2 describes the data collection process andprovides descriptive statistics for our sample. Section 3 provides a discussion of the information con-tent of covenants. Sections 4 and 5 examine the relation between covenants and returns using selec-tion models. Section 6 analyzes the choice of board directors. Finally, Section 7 concludes.
2. Data collection and sample description
We use a proprietary database provided by MPS Venture SGR, a currently active Italian manage-ment company. The database covers all deals that satisfy the following requirements: (1) investmentoccurred between January, 1st 1999 and December, 31st 2005; (2) target company is incorporated inItaly; (3) investment company is registered as an Italian PE management company.
Data were collected by MPS Venture SGR from several sources: (1) the Bank of Italy provided the listof Italian PE management companies and the aggregate number of deals that these companies havemade5; (2) the Italian Private Equity and Venture Capital Association (AIFI) provided information for sin-gle deals, including: target firm name, type and size of investment, percentage of shares acquired by thefund, entry and exit dates, exit, leverage, IRR, and covenants; (3) private interviews held by MPS VentureSGR with other fund managers completed the information of AIFI; (4) Bureau Van Dijk’s AIDA/AmadeusDatabase, and Italian Balance Sheet Central Database (Centrale dei Bilanci), provided balance sheet data;(5) the Italian Credit Bureau (Centrale dei Rischi) provided information about credit relationships; and (6)the Trade Ministry (Camera di Commercio) and the Italian Security and Exchange Commission (Consob)provided information on board members.
Importantly, due to privacy restrictions, MPS Venture SGR has not disclosed the names of any of theentities involved. Therefore, (1) we are unable to merge our data back into publicly available databases
5 According to the European 1998 Financial Services Directive, PE management companies are regarded as regulated financialcompanies; as such, they must register with the Central Bank of their country of incorporation, and must disclose the aggregatenumber of deals made by each fund.

204 S. Caselli et al. / J. Finan. Intermediation 22 (2013) 201–217
such as Amadeus/AIDA to complement the balance sheet information that may still be missing; (2) wecannot distinguish between first, second or higher rounds of financing to the same firm by different PEinvestors; and (3) we do not know which firms are public or private at the time of investment. Nev-ertheless, in our sample, the standard investment strategy for PE funds is ‘‘one firm, one investment’’,meaning that neither stage financing nor syndication are employed.
Finally, we complement the database of MPS Venture with aggregate macroeconomic data at thetime of investment, obtained from Datastream and AIDA/Amadeus: (1) the returns of the Italian stockindex, (2) the ratio of IPOs over newly created firms, (3) industry leverage, and (4) industry ROE.
2.1. Sample characteristics
The sample includes 834 investments made by 104 PE funds owned by 73 management companies.Most target firms operate in the consumer goods sector (34%), the general industrial sector (25%), andthe services sector (20%). Consistent with the structure of the Italian corporate sector, most targetfirms are majority owned by individuals or families (69.28%).
All investments were financed between 1999 and 2005, with 2000, 2001 and 2004 being peakyears. The median investment size is 4.1 million euros. The median annualized IRR ranges from�4.33% to 49.31%. Returns peak during the technology bubble of 1999–2001, and are low after thefinancial crisis in 2011. The majority of our deals consist of expansion financing (50.7%), followedby buyouts (27.1%), early stage (16.7%) and turnaround (5.39%). Early stage and expansions are muchsmaller than buyouts and turnarounds. Buyouts include most of the larger deals in our sample, whichhowever look small by international standards, particularly if compared to the large buyouts recentlywitnessed in the US and the UK (see Axelson et al., forthcoming).
All but 11 deals are exited by the time of data collection (May 2011). Trade sale is the most com-mon form of exit (86.9%). Most exits occurred between 2002 and 2008 (731 deals). IPOs and write-offsare less frequent and account for 5.1% and 6.5% of the sample, respectively. IPOs are more correlatedwith buyouts and expansions than with early-stage and turnarounds. In our sample 60.74% of themanagement companies are controlled by a banking group. These management companies countfor 62.35% of the deals in the sample. Within this subsample the controlling bank has a credit relation-ship with the target firm in 80.38% of cases. Importantly, the existence of a credit relationship is eval-uated at the time of investment and is not related to debt issued in conjunction with a leveragedbuyout, a type of deal that is very rare in our sample. These data on credit relationships suggest thatequity financing by a PE fund in conjunction with debt financing by the controlling bank is a commonphenomenon in Italian deals.
Table 1 provides descriptive statistics of our returns measures, which include yearly IRR, and theyearly changes in sales, ROA, and ROE over the investment period. IRR is simply computed as the dif-ference in PE investors’ equity stake at the time of investment and exit. Annualizations are based on
Table 1Investment returns.
All (%) Type Exit
Early (%) Exp. (%) Buy. (%) Turn. (%) Trade (%) IPO (%) W-Off (%) Unexit. (%)
IRR Mean 9.40 1.64 11.23 11.99 3.33 13.33 32.19 �57.87 �2.60Med. 10.61 8.32 10.71 12.03 12.80 10.86 28.44 �54.07 �4.32
DSales Mean 6.68 3.82 6.83 7.98 7.67 7.11 13.47 �2.88 �0.01Med. 3.92 2.46 3.92 4.97 4.23 4.14 9.99 �0.06 �3.63
DROA Mean 6.01 3.05 6.21 7.27 6.90 6.34 11.90 �2.59 0.05Med. 3.19 1.95 3.15 4.18 3.85 3.35 8.36 �0.32 0.39
DROE Mean 17.59 7.23 18.21 22.20 20.88 19.24 27.48 �8.09 �1.18Med. 7.23 5.20 7.73 8.82 8.24 7.98 18.27 �0.51 0.01
This table provides descriptive statistics for investment performance across different investment types and exits. The samplesize consists of 834 deals. All values are reported as percentages. For unexited deals, IRR is estimated on the basis of the changein net asset value from investment date do the date of data collection (May 2011).

Table 2Definitions of covenants and directors.
Lockup A provision in the underwriting agreement between some or all existing shareholders thatprohibits the sale of shares before a predetermined date
Permitted transfer The permission to a VC to make transfers of shares without pre-emption in favor of the remainingshareholders. The types of permitted transfers may vary according to the class of shares. There willusually be a permitted transfer provision allowing transfers between two or more separate fundsmanaged by the same VC
Redemption right Rights to force the company to purchase shares (a ‘‘put’’). A redemption right allows oneshareholder to liquidate an investment in the event an IPO or a public merger becomes unlikely.One may also negotiate a redemption provision to become effective when the company defaults orfails to make payments upon a key employee’s death, etc.
Tag-along rights A minority shareholder protection affording the right to include their shares in any sale of controland at the offered price (‘‘right of co-sale’’)
Drag-along rights A majority shareholders right, obligating minority shareholders whose shares are bound into theagreement, to sell their shares into an offer the majority wishes to execute
Right of first refusal A negotiated obligation of the company or existing investors to offer shares to the company orother existing investors at fair market value or a previously negotiated price, prior to selling sharesto new investors (‘‘pre-emption right’’)
Exit ratchet An exit ratchet is used to adjust the respective shareholdings of the VCs and insiders depending oneither the level of returns or on an exit. This clause is principally used to provide additionalincentives/rewards to the managers for delivering high returns to investors
S. Caselli et al. / J. Finan. Intermediation 22 (2013) 201–217 205
yearly compounding.6 These measures respectively proxy for the returns to the PE investors (IRR), to allstakeholders in the firm (sales, ROA) and to equityholders (ROE). The averages (medians) of yearly IRR,growth in sales, ROA and ROE are 9.4% (10.61%), 6.68% (3.92%), 6.01% (3.19%), and 17.59% (7.23%). Theestimated median IRR for the 11 unexited deals is �4.32%. As comparison Kaplan and Schoar (2005) findthat equal-weighted median and average IRRs reported by Venture Economics over the period 1980–2001 are 12% and 17%, respectively. Cochrane (2005) finds that venture capital investments generateaverage log returns of 15% per year. Bygrave and Timmons (1992) find an average IRR of 13.5% for theperiod 1974–1989. Gompers and Lerner (1997) report an arithmetic average yearly IRR of 30.5% grossof fees over the years 1972–1997. Ljungqvist and Richardson (2003) produce an estimated IRR of19.8%. Finally, we observe that buyouts and early-stage are respectively the most and the least profitabletype of investments, irrespective of the measure employed. Kaplan and Schoar also find that returns tobuyout funds are slightly higher than the returns to venture funds. In our sample, IPOs are the most prof-itable type of exit.
3. Covenants
In our sample we observe seven different covenants: lockups, permitted-transfer rights, redemp-tion rights, tag-along rights, drag-along rights, rights of first-refusal, and exit ratchets. A definitionof these covenants is provided in Table 2. We find that in our sample there is more variety in thechoice of covenants than in previous studies. Cumming (2008) reports four covenants: right to replacethe CEO, redemption rights, drag-along rights, and antidilution rights. Kaplan and Strömberg (2003)report the use of redemption rights, anti-dilution provisions, and automatic-conversion provisions.In both papers PE investors employ a mix of securities which includes various types of preferred stockand convertible debt, while in our sample PE investors always hold common equity.
Table 3 provides descriptive statistics for our set of covenants. Tag-along rights are the most com-mon type of covenant (86.93% of the deals), followed by drag-along rights, permitted transfer andredemption rights. There is relatively little variation in the use of covenants across different invest-ment types, but there is large variation across different types of exit. Lockups, permitted transfers,redemption rights, rights of first-refusal and exit ratchets are more likely to be included when exit oc-
6 For the 11 un-exited deals in the sample, IRR is estimated on the basis of the change in net asset value during the investmentperiod.

206 S. Caselli et al. / J. Finan. Intermediation 22 (2013) 201–217
curs via an IPO. In untabulated results we find that over time there has been a tendency towards ‘‘cov-enant-lite’’ contracts, with a marked reduction in the use of tag-along, drag-along and redemptionrights.
We find a positive correlation in the use of lockups, permitted transfers, redemption rights andrights of first-refusal. This suggests that certain types of covenants might be bundled together to forma contracting style. To explore this point in more detail and identify different contracting styles, we per-form a multiple correspondence analysis (MCA).7 As in Principal Component Analysis, the MCA offers alow-dimensional representation of the data, in a way that best preserves the original variance of the data.The first dimension of variation explains 84.2% of covenant variability. This component is strongly re-lated to lockups and rights of first-refusal, and to a smaller extent also to permitted transfers, redemptionrights, and exit ratchets. The second component explains only 0.03% of the total data variability and isstrongly related tag-along rights and to drag-along rights. We observe three relatively well defined clus-ters, plus a singleton. Lockups and rights of first-refusal represent the first cluster. The second cluster iscomposed by tag-along and drag-along rights. We label this cluster default covenants because tag- anddrag-along rights are present in the majority of deals. Redemption rights and permitted-transfer rightsform the third cluster. Since both give PE investors an exit option, we refer to this cluster as protectioncovenants. Exit ratchets represent a singleton which cannot be perfectly mapped into any of the previousclusters. Given that exit ratchets are instrumental in providing incentives to managers, we group themtogether with lockups and rights of first refusal to form the third group of covenants to which we refer asincentive covenants. In Table 3 we report statistics for the three clusters.
3.1. The information content of contracts
The existing theories on the role of contracts in the financing of an entrepreneurial firm identifyadverse-selection and double-sided moral hazardas the two main sources of information problems inventure capital contracts.8 We examine from a theoretical standpoint the interplay between covenants,information problems and returns.
We start by looking at incentive covenants. These covenants provide incentives to managers formaximizing firm value, and also appear to be associated with high quality firms. Aghion et al.(2004), Brav and Gompers (2003), and Casares-Field and Hanka (2001), and in a broader settingHolmström (1979), suggest that lockups help align the incentives of managers and PE investors withthe maximization of equity value. Also, lockups signal firm quality because they are generally asso-ciated with IPOs (see Table 3) which is the most profitable type of exit. Rights of first-refusal (a.k.a aspreemption rights) and exit ratchets are also meant to preserve the incentives of managers towardsvalue maximization, respectively by preventing a dilution of the managers’ interest in the firm, andby rewarding managers with new shares in case of high returns.9 Overall, we should expect incentivecovenants to be positively correlated with returns because they signal high firm quality and strengthenincentives.
With respect to protection covenants, permitted-transfer rights give PE investors the option to selltheir stake in the firm without requesting the permission of other shareholders (Yates and Hinchliffe,2010), while redemption rights allow PE investors to sell their shares back to the company (long put),typically in the event an IPO or a public merger becomes unlikely. Both types of covenants signalstrong bargaining power of PE investors, but also indicate uncertainty about the firm’s futureprospects.
Finally, the two default covenants, tag- and drag-along rights, maximize the likelihood of a profit-able exit and should then correlate positively with returns. Empirically it is difficult to estimate theirrelationship with returns, precisely because the vast majority of firms in the sample includes one ofthese covenants, thus reducing the power of the statistical tests.
7 For an overview of MCA methodology see Johnson and Wichern (2007), Chapter 12.8 See Aghion and Bolton (1992), Bascha and Walz (2001), Casamatta (2003), Cornelli and Yosha (2003), Dessi (2005), Hellmann
(1998, 2006), Inderst and Mueller (2004), Renucci (2000), Repullo and Suarez (2004), and Schmidt (2003)9 Two special types of exit ratchets employed in the US are returns and time vesting (Kaplan and Strömberg, 2003).
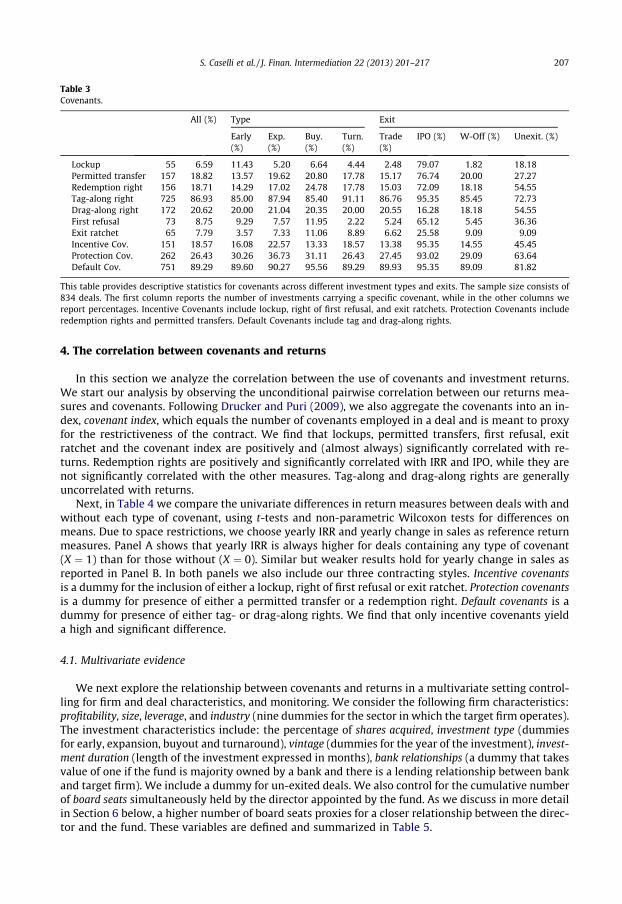
Table 3Covenants.
All (%) Type Exit
Early(%)
Exp.(%)
Buy.(%)
Turn.(%)
Trade(%)
IPO (%) W-Off (%) Unexit. (%)
Lockup 55 6.59 11.43 5.20 6.64 4.44 2.48 79.07 1.82 18.18Permitted transfer 157 18.82 13.57 19.62 20.80 17.78 15.17 76.74 20.00 27.27Redemption right 156 18.71 14.29 17.02 24.78 17.78 15.03 72.09 18.18 54.55Tag-along right 725 86.93 85.00 87.94 85.40 91.11 86.76 95.35 85.45 72.73Drag-along right 172 20.62 20.00 21.04 20.35 20.00 20.55 16.28 18.18 54.55First refusal 73 8.75 9.29 7.57 11.95 2.22 5.24 65.12 5.45 36.36Exit ratchet 65 7.79 3.57 7.33 11.06 8.89 6.62 25.58 9.09 9.09Incentive Cov. 151 18.57 16.08 22.57 13.33 18.57 13.38 95.35 14.55 45.45Protection Cov. 262 26.43 30.26 36.73 31.11 26.43 27.45 93.02 29.09 63.64Default Cov. 751 89.29 89.60 90.27 95.56 89.29 89.93 95.35 89.09 81.82
This table provides descriptive statistics for covenants across different investment types and exits. The sample size consists of834 deals. The first column reports the number of investments carrying a specific covenant, while in the other columns wereport percentages. Incentive Covenants include lockup, right of first refusal, and exit ratchets. Protection Covenants includeredemption rights and permitted transfers. Default Covenants include tag and drag-along rights.
S. Caselli et al. / J. Finan. Intermediation 22 (2013) 201–217 207
4. The correlation between covenants and returns
In this section we analyze the correlation between the use of covenants and investment returns.We start our analysis by observing the unconditional pairwise correlation between our returns mea-sures and covenants. Following Drucker and Puri (2009), we also aggregate the covenants into an in-dex, covenant index, which equals the number of covenants employed in a deal and is meant to proxyfor the restrictiveness of the contract. We find that lockups, permitted transfers, first refusal, exitratchet and the covenant index are positively and (almost always) significantly correlated with re-turns. Redemption rights are positively and significantly correlated with IRR and IPO, while they arenot significantly correlated with the other measures. Tag-along and drag-along rights are generallyuncorrelated with returns.
Next, in Table 4 we compare the univariate differences in return measures between deals with andwithout each type of covenant, using t-tests and non-parametric Wilcoxon tests for differences onmeans. Due to space restrictions, we choose yearly IRR and yearly change in sales as reference returnmeasures. Panel A shows that yearly IRR is always higher for deals containing any type of covenant(X ¼ 1) than for those without (X ¼ 0). Similar but weaker results hold for yearly change in sales asreported in Panel B. In both panels we also include our three contracting styles. Incentive covenantsis a dummy for the inclusion of either a lockup, right of first refusal or exit ratchet. Protection covenantsis a dummy for presence of either a permitted transfer or a redemption right. Default covenants is adummy for presence of either tag- or drag-along rights. We find that only incentive covenants yielda high and significant difference.
4.1. Multivariate evidence
We next explore the relationship between covenants and returns in a multivariate setting control-ling for firm and deal characteristics, and monitoring. We consider the following firm characteristics:profitability, size, leverage, and industry (nine dummies for the sector in which the target firm operates).The investment characteristics include: the percentage of shares acquired, investment type (dummiesfor early, expansion, buyout and turnaround), vintage (dummies for the year of the investment), invest-ment duration (length of the investment expressed in months), bank relationships (a dummy that takesvalue of one if the fund is majority owned by a bank and there is a lending relationship between bankand target firm). We include a dummy for un-exited deals. We also control for the cumulative numberof board seats simultaneously held by the director appointed by the fund. As we discuss in more detailin Section 6 below, a higher number of board seats proxies for a closer relationship between the direc-tor and the fund. These variables are defined and summarized in Table 5.

Table 4Univariate differences in performance accounting for the use of covenants.
X IRR if X = 0 (%) IRR if X = 1 (%) t-test p-value Wilcoxon z p-value
Panel A – IRRLockup 8.45 22.87 �5.171 0.000 �4.345 0.000Permitted transfer 8.87 11.69 �1.237 0.217 �1.615 0.053Redemption right 8.98 11.24 �1.109 0.269 �0.502 0.308Tag-along right 4.97 10.07 �1.732 0.086 �2.507 0.006Drag-along right 9.54 8.87 0.350 0.726 2.270 0.012First refusal 8.93 14.31 �1.790 0.077 �1.122 0.131Exit ratchet 7.63 30.44 �5.378 0.000 �7.054 0.000Incentive covenants 7.03 20.16 �5.668 0.000 �5.282 0.000Protection covenants 8.82 10.69 �1.057 0.291 �0.686 0.246Default covenants 6.99 9.67 �0.824 0.412 �0.659 0.255
DSales if X = 0 (%) DSales if X = 1 (%) t-test p-value Wilcoxon z p-value
Panel B – DSalesLockup 6.26 12.71 �3.789 0.000 �5.296 0.000Permitted transfer 6.53 7.35 �0.785 0.433 �0.713 0.238Redemption right 6.86 5.91 1.053 0.293 0.550 0.291Tag-along right 6.50 6.71 �0.180 0.857 0.128 0.449Drag-along right 6.95 5.68 1.337 0.182 1.859 0.031First refusal 6.60 7.56 �0.643 0.522 �1.671 0.047Exit ratchet 5.43 21.48 �5.610 0.000 �6.636 0.000Incentive covenants 5.18 13.50 �5.600 0.000 �6.496 0.000Protection covenants 6.82 6.40 0.526 0.599 0.578 0.282Default covenants 6.92 6.66 0.203 0.839 0.924 0.178
This table shows the difference in performance between investments respectively with and without a specific covenant. To testfor differences we employ a t- and a Wilcoxon test.
208 S. Caselli et al. / J. Finan. Intermediation 22 (2013) 201–217
We run a set of 66 regressions, one for each return measure (plus IPO and Write-off) on each cov-enant (plus the covenant index and the three contracting styles), controlling for the above firm anddeal characteristics and for board seats. We use OLS to estimate all equations involving a continuousmeasure of returns, and probit models to estimate the probability of exit. We cluster the standard er-rors at the PE investor level.10
The results of all the regressions performed above are summarized in Table 6. Panel A contains thecomplete model specifications for the regressions of each returns measure on the covenant index. InPanel B we run the same specifications as in Panel A with each single covenant separately. We also runthree specifications, one for each contracting style (incentives, protection, default). To be concise, in Pa-nel B we report only the estimated coefficients of the relevant covenant for each regression. The esti-mated (untabulated) coefficients of the control variables in Panel B are qualitatively very similar totheir counterparts reported in Panel A.
The main findings of Table 6 are: (1) the relationship between the covenant index and returns isstrong and positive also in a multivariate setting; (2) this relationship appears to be driven mainlyby lockups, permitted transfers, and exit ratchets, and to a lesser extent by rights of first refusaland redemption rights; and (3) tag- and drag-along appear generally uncorrelated to returns, thusconfirming their status of default covenants.
4.2. Selection models
The empirical findings of the previous section raise non-trivial theoretical and empirical issues.From a theoretical standpoint, in a model of optimum contracting in which covenants are chosen tomaximize returns, a reduced form equation of returns should depend solely on the parameters of
10 In untabulated results we carry out a robustness check by including PE fixed effects (a dummy for each management company)in the regressions. Results on covenants are unaffected.
S. Caselli et al. / J. Finan. Intermediation 22 (2013) 201–217 209
the model. The same should hold for covenants.11 If we take this line of reasoning literally, then empir-ically we should not expect to observe a relationship between covenants and returns. However, in prac-tice such relationship may arise because covenants can proxy for omitted variables.Drucker and Puri(2009) and Li and Prabhala (2007), we may regard this as a problem of self-selection in which covenantscapture some of the information privately held by the contracting parties. The selection of covenantsgives us information about some unobserved heterogeneity in firm quality.
Self-selection, however, may not be the only reason why covenants are interesting from an empir-ical point of view. For instance, covenants can also change manager behavior by improving incentivesto maximize firm value. This would imply a positive relationship between covenants and returns,which could also partially explain the empirical facts observed in Table 6. We employ the methodssuggested by Lee (1978) to estimate selection and treatment effects of covenants on returns.
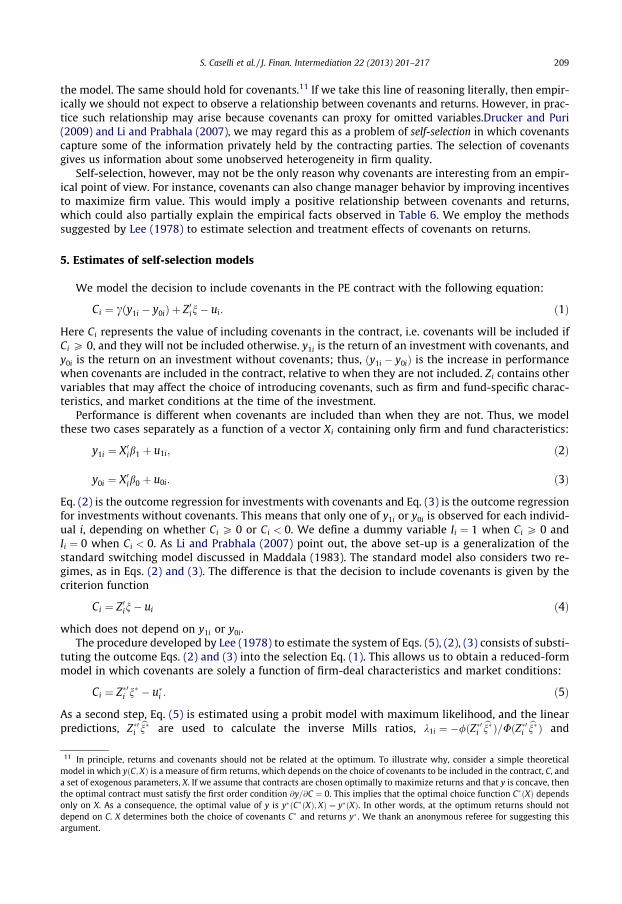
5. Estimates of self-selection models
We model the decision to include covenants in the PE contract with the following equation:
11 In pmodel ia set ofthe optonly ondependargume
Ci ¼ cðy1i � y0iÞ þ Z0in� ui: ð1Þ
Here Ci represents the value of including covenants in the contract, i.e. covenants will be included ifCi P 0, and they will not be included otherwise. y1i is the return of an investment with covenants, andy0i is the return on an investment without covenants; thus, ðy1i � y0iÞ is the increase in performancewhen covenants are included in the contract, relative to when they are not included. Zi contains othervariables that may affect the choice of introducing covenants, such as firm and fund-specific charac-teristics, and market conditions at the time of the investment.
Performance is different when covenants are included than when they are not. Thus, we modelthese two cases separately as a function of a vector Xi containing only firm and fund characteristics:
y1i ¼ X0ib1 þ u1i; ð2Þ
y0i ¼ X0ib0 þ u0i: ð3Þ
Eq. (2) is the outcome regression for investments with covenants and Eq. (3) is the outcome regressionfor investments without covenants. This means that only one of y1i or y0i is observed for each individ-ual i, depending on whether Ci P 0 or Ci < 0. We define a dummy variable Ii ¼ 1 when Ci P 0 andIi ¼ 0 when Ci < 0. As Li and Prabhala (2007) point out, the above set-up is a generalization of thestandard switching model discussed in Maddala (1983). The standard model also considers two re-gimes, as in Eqs. (2) and (3). The difference is that the decision to include covenants is given by thecriterion function
Ci ¼ Z0in� ui ð4Þ
which does not depend on y1i or y0i.The procedure developed by Lee (1978) to estimate the system of Eqs. (5), (2), (3) consists of substi-
tuting the outcome Eqs. (2) and (3) into the selection Eq. (1). This allows us to obtain a reduced-formmodel in which covenants are solely a function of firm-deal characteristics and market conditions:
Ci ¼ Z�0i n� � u�i : ð5Þ
As a second step, Eq. (5) is estimated using a probit model with maximum likelihood, and the linearpredictions, Z�0i bn
� are used to calculate the inverse Mills ratios, k1i ¼ �/ðZ�0i bn� Þ=UðZ�0i bn
� Þ and
rinciple, returns and covenants should not be related at the optimum. To illustrate why, consider a simple theoreticaln which yðC;XÞ is a measure of firm returns, which depends on the choice of covenants to be included in the contract, C, andexogenous parameters, X. If we assume that contracts are chosen optimally to maximize returns and that y is concave, thenimal contract must satisfy the first order condition @y=@C ¼ 0. This implies that the optimal choice function C�ðXÞ depends
X. As a consequence, the optimal value of y is y�ðC�ðXÞ;XÞ ¼ y�ðXÞ. In other words, at the optimum returns should noton C. X determines both the choice of covenants C� and returns y� . We thank an anonymous referee for suggesting this
nt.

Table 5Summary statistics of main variables.
Variable definition Mean[median]
Correlations (p-values) with:
Covenantindex
IRR D Sales
Profitability EBIDTA/assets 0.169 [0.114] 0.141 (0.000) �0.068 (0.046) �0.079 (0.022)Size Log of assets 4.212 [4.205] �0.023 (0.503) 0.198 (0.000) 0.184 (0.000)Leverage Book value of debt/assets 0.791 [0.799] �0.081 (0.018) �0.012 (0.730) �0.021 (0.539)% Shares Percentage of shares acquired by the fund 0.227 [0.250] �0.064 (0.063) �0.020 (0.553) �0.053 (0.123)Board seats during the
investmentNumber of other board seats held during the investment on behalf of thefund
6.718 [7.000] �0.007 (0.843) 0.047 (0.173) �0.012 (0.738)
Board seats before theinvestment
Number of board seats held before the investment on behalf of the fund 6.597 [7.000] �0.053 (0.119) 0.025 (0.459) �0.038 (0.272)
Employee Dummy = 1 if board director is an employee 0.456 [0.000] 0.006 (0.865) 0.026 (0.455) 0.123 (0.000)No match of duration Dummy = 1 if mandate of director and board do not match 0.366 [0.000] 0.010 (0.773) 0.051 (0.133) 0.080 (0.020)Bank ownership Dummy = 1 if the fund is owned by a bank 0.607 [1.000] �0.021 (0.546) �0.034 (0.325) �0.069 (0.042)Bank relationships Dummy = 1 if the fund is owned by a bank that provides credit to the
firm0.488 [0.000] 0.001 (0.982) �0.033 (0.342) �0.096 (0.005)
Market returns 6 m Returns on S&P MIB over previous 6 months 0.165 [0.153] 0.160 (0.000) 0.114 (0.001) 0.089 (0.009)Industry ROE Average industry ROE at time of investment 8.071 [7.805] 0.092 (0.007) �0.055 (0.107) �0.043 (0.212)IPO/new Ratio of IPOs to newly created firms created over previous 6 months 0.156 [0.119] 0.010 (0.773) �0.100 (0.003) �0.170 (0.000)Average number of covenants
6 mAverage number of covenants per deal in the previous 6 months 1.710 [1.693] 0.189 (0.000) �0.0122 (0.721) �0.092 (0.007)
This table provides definitions and summary statistics for the key variables employed in the analysis, as well as their pairwise correlation with IRR and growth in sales.
210S.Caselli
etal./J.Finan.Interm
ediation22
(2013)201–
217

Table 6Regressions of performance on covenants.
(1) (2) (3) (4) (5) (6)OLS OLS OLS OLS Probit ProbitIRR DSales DROA DROE IPO Write-off
Panel A – Performance and covenant indexCovenant Index 0.046⁄⁄⁄ 0.018⁄⁄⁄ 0.014⁄⁄⁄ 0.035⁄⁄⁄ 1.933⁄⁄⁄ �0.066
(0.007) (0.004) (0.003) (0.011) (0.227) (0.063)Profitability �0.029 �0.036 �0.031 �0.200⁄⁄ 0.605 0.087
(0.054) (0.031) (0.028) (0.089) (0.652) (0.322)Size 0.050⁄⁄ 0.014⁄ 0.014⁄ 0.030 �0.225 �0.201
(0.024) (0.009) (0.008) (0.026) (0.435) (0.156)Leverage �0.454⁄ �0.172 �0.116 �0.250 �10.948⁄⁄ 3.795⁄
(0.240) (0.143) (0.110) (0.353) (5.043) (2.164)Bank relationship �0.015 �0.021 �0.018 �0.072 0.263 �0.083
(0.019) (0.013) (0.013) (0.044) (0.263) (0.126)% Shares 0.182 0.056 0.023 �0.005 7.197⁄⁄ �0.817
(0.176) (0.067) (0.065) (0.227) (3.484) (1.215)Board seats (During) �0.001 �0.001 �0.004⁄⁄⁄ �0.014⁄⁄ �0.127⁄⁄ 0.009
(0.003) (0.001) (0.001) (0.006) (0.056) (0.022)Constant 0.109 0.072 0.091 0.349 0.921 �5.100⁄⁄⁄
(0.179) (0.126) (0.092) (0.299) (2.547) (1.871)Observations 834 834 834 834 789 823Adj (Pse) R2 0.104 0.130 0.115 0.067 0.771 0.0948Industry FE YES YES YES YES YES YESInvestment FE YES YES YES YES YES YESYear FE YES YES YES YES YES YESInvestm. Duration NO NO NO NO YES YES
Covenants OLS OLS OLS OLS Probit ProbitDSales IRR DROA DROE IPO Write-off
Panel B – Performance and single covenantsLockup 0.182⁄⁄⁄ 0.073⁄⁄⁄ 0.052⁄⁄⁄ 0.093⁄⁄ 3.786⁄⁄⁄ �0.673⁄
(0.027) (0.022) (0.014) (0.039) (0.539) (0.381)Perm.Trans 0.045⁄⁄ 0.018⁄⁄ 0.013⁄ 0.008 1.630⁄⁄⁄ 0.009
(0.017) (0.007) (0.007) (0.030) (0.202) (0.160)Redemption 0.039⁄⁄ 0.001 �0.000 �0.022 1.711⁄⁄⁄ 0.001
(0.018) (0.007) (0.006) (0.024) (0.205) (0.185)Tag-along 0.034 0.003 �0.001 �0.032 0.980⁄⁄⁄ �0.123
(0.029) (0.009) (0.010) (0.054) (0.366) (0.260)Drag-along 0.018 0.002 0.001 �0.007 �0.044 �0.096
(0.016) (0.008) (0.007) (0.033) (0.204) (0.217)First refus. 0.095⁄⁄⁄ 0.022 0.012 �0.007 2.294⁄⁄⁄ �0.247
(0.026) (0.015) (0.013) (0.042) (0.197) (0.304)Exit ratchet 0.212⁄⁄⁄ 0.155⁄⁄⁄ 0.141⁄⁄⁄ 0.561⁄⁄⁄ 0.976⁄⁄⁄ �0.016
(0.046) (0.035) (0.036) (0.171) (0.224) (0.293)Incentive cov. 0.156⁄⁄⁄ 0.092⁄⁄⁄ 0.081⁄⁄⁄ 0.289⁄⁄⁄ 2.996⁄⁄⁄ �0.146
(0.023) (0.019) (0.018) (0.087) (0.317) (0.193)Protection cov. 0.038⁄⁄ 0.006 0.005 �0.008 1.973⁄⁄⁄ �0.069
(0.017) (0.006) (0.006) (0.024) (0.230) (0.155)Default cov. 0.022 0.002 0.000 �0.020 0.729⁄⁄ �0.146
(0.034) (0.012) (0.013) (0.058) (0.334) (0.292)
This table examines the relationship between covenants and performance in a multivariate setting. In Panel A we regress eachmeasure of performance on the covenant index, also controlling for firm characteristics, investment type, year, and industryfixed effects. In Panel B each performance measure is regressed on each covenant individually, as well as on the three subsetsincentive, protection, default, again controlling for firm and investment characteristics, and investment, year, and industry fixedeffects. For each regression in Panel B we report only the coefficient on the relevant covenant. Firm characteristics include:profitability, size, leverage, industry, bank relationships and board seats (during). Investment type is: early, expansion, buyout,turnaround. We also include a dummy for un-exited deals. All regressions have 782 observations. Standard errors clustered atthe management company level are in parenthesis.⁄ Significance at the 10% level.⁄⁄ Significance at the 5% level.⁄⁄⁄ Significance at the 1% level.
S. Caselli et al. / J. Finan. Intermediation 22 (2013) 201–217 211
212 S. Caselli et al. / J. Finan. Intermediation 22 (2013) 201–217
k0i ¼ /ðZ�0i bn�Þ=ð1�UðZ�0i bn
� ÞÞ. Consistent estimates of b1 and b0 are then obtained by augmenting Eqs.(2) and (3) with the inverse Mills ratio as additional right-hand side variables, and estimating theequation with OLS. Finally, as third step we substitute the difference in expected performance forthe whole sample, by1i � by0i, into the selection Eq. (1), and produce consistent estimates of the struc-tural probit model parameters c and n.12
The selection-adjustment estimation procedure sketched here is useful for the following reasons:(1) by adjusting for self-selection we obtain consistent estimates for b1 and b0; (2) the statistical sig-nificance of the coefficient for the inverse Mills ratio captures possible self-selection effects associatedwith the inclusion of covenants; and (3) the statistical significance of parameter c captures possibletreatment effects associated with the inclusion of covenants. The omitted variables used to correctfor self-selection, k1i and k0i, can be interpreted as an estimate of the private information underlyinga firm’s choice (Li and Prabhala, 2007).
It is worth noting that in a standard switching model, a positive sign for the coefficient of the in-verse Mills ratio means that covenants act as a signal of high returns, and it implies a positive covari-ance between the unexplained factors that affect returns and those that affect the choice of covenants.In the Lee (1978) model, however, the signs of the coefficients for the inverse Mills ratios do not have adirect interpretation, because the coefficients estimate the covariance between u1i and u�i (or u0i andu�i Þ, which depends on the second moments of the error terms u1;u0 and u, as discussed in detail in Lee(1978). For this reason, in the analysis below we will estimate both the Lee (1978) model, and a stan-dard switching model (as in Eq. 4). We compare the results from the two estimations to determine thesign of the selection coefficient.
Vector Xi of Eqs. (2) and (3) contains the same firm variables considered in the previous multivar-iate analysis (profitability, size, leverage, industry, shares acquired, investment type, vintage, previousbank relationships, board seats). In addition to the variables that are in Xi, vector Zi also contains thefollowing three instruments: stock market returns over the previous 6 months, defined as the returns onItalian equity market (S&P Mib) over the 6 months preceding the investment start date; the averageindustry ROE, based on a two-digit SIC classification of Italian firms at the investment starting date;the average ratio of IPOs to newly created firms in Italy over the 6 months preceding the investmentstart date; average number of covenants employed in the deals that occurred in the previous 6 months.These variables represent potential instruments that may help with the identification of the model:they are exogenously given at the time of the investment; and by proxying for market and investmentconditions they should correlate with the choice of covenants, thus satisfying the relevance condition.
We acknowledge that it is difficult to identify instruments that correlate with covenants but notwith performance, and thus do not violate the exclusion condition. In particular, it may be that pre-deal market conditions affect IRR directly and not only via the choice of covenants. For example, con-sider the following mechanism suggested by Gompers and Lerner (1999) and Gompers and Lerner(2000): as entry prices are influenced by market conditions, with prices being higher in heated mar-kets than in low markets, IRR is a function of the share price at the time of contracting and at the timeof exit. If this reasoning was correct, market conditions would not satisfy the exclusion conditionwhen performance is measured with IRR. To avoid this problem, we employ other measures of perfor-mance (sales, ROA and ROE) alongside with IRR. These other measures appear less exposed to a vio-lation of the exclusion condition because they do not depend on the entry price paid by the fund.
We construct a new dummy, covenant heavy, which takes value one if the covenant index is greaterthan its median value across the sample. The covenant heavy dummy and the three contracting stylesidentified above (incentives, default, protection) respectively represent the dependent variables in thecriterion function of Eq. (1).
We follow the estimation procedure sketched above. We start by estimating the reduced-form mod-el in Eq. (5). We then obtain the inverse Mills ratios and use it to augment Eqs. (2) and (3), the estimatesof which are reported in Table 7. The dependent variable changes across columns: it is IRR in columns
12 The selection equation contains the (unobserved) difference in ex ante expected returns between deals with and withoutcovenants. We proxy for the ex ante expected returns using the ex post (observed) realized outcomes. The same approach isemployed in Lee (1978), where ex post observed wages are used in the criterion function that determines whether workers shouldunionize or not.
S. Caselli et al. / J. Finan. Intermediation 22 (2013) 201–217 213
1a and 1b, change in sales in columns 2a and 2b, change in ROA in columns 3a and 3b, and change inROE in Columns 4a and 4b. The coefficients in columns 1a, 2a, 3a and 4a are for Eq. (3) (Ii ¼ 0), while incolumns 1b, 2b, 3b and 4b they are for Eq. (2) (Ii ¼ 1). The criterion functions Ii refer to the inclusion/exclusion of different types of covenants in a deal: covenant heavy in Panel A, incentivecovenants inPanel B, defaultcovenants in Panel C, and protectioncovenants in Panel D. In the table, we report thefull set of regressions only for covenant heavy, while for the other three specifications of the criterionfunction (incentives, default, protection), we only report the coefficient of the inverse Mills ratio.
The inverse Mills ratio is (1) always significant when covenant heavy is the selection variable, (2)generally significant for incentiveand protectioncovenants (relatively more so for the latter), and (3) al-most always not significant for default covenants. These results suggest that there is a selection effectassociated with the use of covenants, that the effect depends significantly on the covenants employed,and that the effect is stronger for protection and, albeit to a lesser extent, incentive covenants.
We next estimate the standard model outlined in Eq. (4). In untabulated results we find that thecoefficients of the inverse Mills ratios for the standard model are always positive and significant forcovenant heavy deals and for incentive covenants; positive and significant for protection covenants,when the outcome is measured with IRR; generally, not significant for default covenants.13 Therefore,the standard switching model suggests that better firms are associated with having more covenants andwith incentive and, albeit to a lesser extent, protection covenants.14
We also estimate counterfactuals by computing the predicted returns associated with the observa-tions that carry covenants, using the estimated coefficients for the observations that do not carry cov-enants.15 Our estimations suggest that it is optimal for covenant laden firms, and for firms usingincentive or protection covenants to make the choice of covenants that we observe in reality. For exam-ple, the estimated IRR for firms with incentive covenants (Ii ¼ 1) is 20.5%, while the counterfactual esti-mate for these firms is 11.1%. For protection covenants, the corresponding figures are an estimated 10.8%vs. 4.8% had they not chosen the covenant. In contrast, firms that chose not to include protection orincentive covenants would have performed better had they chosen to include them.
Finally, we proceed to the last step of Lee’s estimation procedure, and produce estimates of Eq. (1)in which y1i and y0i are the values predicted by (2) and (3). Table 8 reports our estimation of c, which ismeant to capture how expected treatment effects influence the decision to include covenants. Thetable reports the coefficient of c obtained in all the possible combinations of selection variables (in col-umns) and outcome variables (in rows). The main finding of this estimation is that c is positive andsignificant for the covenant heavy dummy and for incentive covenants with respect to change in sales,ROA and ROE, while it is not significant for IRR. On the other hand, the coefficient is never significantfor default and protection covenants.
6. The choice of board directors
As shown by Barry et al. (1990), Lerner (1995) and Sahlman (1990), it is common practice in the USfor PE investors to elect one or more directors in the board of the firms in their portfolio. The role of thesedirectors is to represent the interests of the PE fund by exerting direct oversight on the managers of thefirm. In our sample deals we also find that the appointment of directors is a common phenomenon. Al-most invariably PE funds appoint only one director, regardless of the percentage of shares acquired.
13 We also construct three new dependent variables, given by the difference between IRR and, respectively, sales growth, ROAgrowth and ROE growth. We run the base selection model using these differences as dependent variables and covenant heavyas theselection variable. We observe a positive and significant coefficient for the inverse Mills ratio for the first two measures andinsignificant for the third one. This result suggests that covenants are associated with more than proportionally higher returns forPE investors than for other types of investors.
14 The results of the standard switching model can also be interepreted to indicate that one source of treatment effect is becausethe PE investor picks up a firm whose value is lower than it should be. However, this explanation is mainly suited to explain theeffect that treatment has on IRR than on the other measures of performance (sales, ROA, ROE), that do not depend on entry and exitprices.
15 Formally, the counterfactual for firms with covenants had they not used covenants is defined as Eðy1jX; I ¼ 1; b0Þ, and thecounterfactual for firms without covenants had they used covenants is Eðy0jX; I ¼ 0; b1Þ. See Poon et al. (2009) for comprehensivedefinitions of counterfactual measures in a switching model applied to solicited vs. unsolicited bank ratings.

Table 7Performance regressions adjusted for selection bias.
(1a) (1b) (2a) (2b) (3a) (3b) (4a) (4b)IRR IRR DSales DSales DROA DROA DROE DROE
Panel A: Coefficients for covenant heavyProfitability 0.114 0.033 0.034 0.042 0.039 0.032 0.043 0.051
(0.097) (0.051) (0.033) (0.026) (0.033) (0.027) (0.122) (0.115)Size 0.029⁄⁄ 0.031⁄⁄⁄ 0.012⁄⁄⁄ 0.019⁄⁄⁄ 0.009⁄⁄ 0.021⁄⁄⁄ 0.028⁄ 0.074⁄⁄⁄
(0.012) (0.011) (0.004) (0.005) (0.004) (0.006) (0.015) (0.024)Leverage 0.037 �0.550⁄⁄ 0.071 �0.272⁄⁄ 0.111 �0.182 0.280 �0.646
(0.338) (0.249) (0.117) (0.125) (0.114) (0.129) (0.428) (0.557)Bank Relationship �0.045⁄ 0.035⁄ �0.016⁄ �0.003 �0.013 �0.005 �0.038 �0.036
(0.024) (0.021) (0.008) (0.011) (0.008) (0.011) (0.031) (0.048)% Shares �0.455⁄⁄ 0.201 �0.161⁄⁄ �0.127 �0.180⁄⁄⁄ �0.094 �0.748⁄⁄⁄ �0.086
(0.197) (0.162) (0.068) (0.082) (0.066) (0.084) (0.249) (0.363)Board Seats (During) �0.004 �0.007⁄ �0.002 0.003 �0.005⁄⁄⁄ �0.001 �0.013⁄⁄ �0.005
(0.004) (0.004) (0.001) (0.002) (0.001) (0.002) (0.005) (0.008)Inverse Mills Ratio 0.251⁄⁄⁄ 0.182⁄⁄ 0.124⁄⁄⁄ 0.231⁄⁄⁄ 0.090⁄⁄⁄ 0.204⁄⁄⁄ 0.275⁄⁄ 0.756⁄⁄⁄
(0.092) (0.073) (0.032) (0.037) (0.031) (0.038) (0.116) (0.163)Observations 453 370 453 370 453 370 453 370Adjusted R-squared 0.066 0.267 0.115 0.436 0.117 0.398 0.076 0.366
Panel B: Inverse mills ratios for incentive covenantsInverse mills ratio 0.194⁄ 0.371⁄ 0.049⁄ 0.674 0.263⁄⁄ 0.074⁄ 0.142⁄ 0.358⁄⁄
(0.104) (0.195) (0.026) (1.249) (0.104) (0.042) (0.075) (0.156)
Panel C: Inverse mills ratios for default covenantsInverse Mills Ratio 0.021 0.161 0.064 0.161 0.044 0.208⁄ 0.096 0.888
(0.133) (0.163) (0.043) (0.112) (0.042) (0.119) (0.142) (0.561)
Panel D: Inverse mills ratios for protection covenantsInverse mills ratio 0.109⁄⁄⁄ 0.006 0.323⁄⁄ 0.362⁄⁄ 0.074⁄ 0.104⁄⁄⁄ 0.226⁄⁄⁄ 0.104⁄⁄
(0.039) (0.038) (0.134) (0.179) (0.042) (0.038) (0.039) (0.046)
This table reports the estimation of Eqs. (2) and (3) with the dependent variable changing across columns: IRR in columns 1aand 1b, Change in Sales in columns 2a and 2b, Change in ROA in columns 3a and 3b, and Change in ROE in Columns 4a and 4b.Coefficients in columns 1a, 2a, 3a and 4a are for Eq. (3) (Ii = 1), while in columns 1b, 2b, 3b and 4b we estimate Eq. (2) (Ii = 1). Thecriterion functions Ii refer to the inclusion/exclusion of different types of covenants in the deals: Covenant Heavy in Panel A,Incentive Covenants in Panel B, Default Covenants in Panel C, and Protection Covenants in Panel D. More precisely, CovenantHeavy is a dummy variable that takes value one if the number of covenants employed in a deal is above median. Incentive,Default, and Protection Covenants are dummies for inclusion of incentive, default, or protection covenants in the deal,respectively. We control for firm characteristics, investment type and outcome (exited/unexited); year and industry fixedeffects. We also include four instruments all computed over the 6 months preceding the investment: public market returns,average industry ROE, ratio of IPOs to newly created firms, and average number of covenants in previous deals. We also reportthe Wald test on the significance of the instruments.⁄ Significance at the 10% level.⁄⁄ Significance at the 5% level.⁄⁄⁄ Significance at the 1% level.
214 S. Caselli et al. / J. Finan. Intermediation 22 (2013) 201–217
We classify appointed directors asoutsiders and insiders, depending on whether the appointee is orhas been an employee of the fund, or has strong ties with the fund. Our definition of insider is differentfrom Sahlman (1990),Lerner (1995), which classifies directors into outsiders and insiders with respectto their relationship with the firm, rather than with respect to the fund.
We want to investigate whether the appointment of a certain type of director is related to firm per-formance. We focus on the hypothesis suggested by Lerner (1995) that ‘‘if venture capitalists areintensive monitors of managers, their involvement as directors should be more intense when the needfor oversight is greater.’’ Therefore, we expect outsiders to be appointed in firms where less monitor-ing is required. These firms are likely to be the less risky and more profitable, which implies that weshould observe a negative correlation between the appointment of insiders and returns.16
16 An alternative hypothesis is that inside directors are busier and can exert less monitoring on the target firm, thus leading topoorer performance. This hypothesis is based on the idea of the inefficiency of busy directors originally developed by Fich andShivdasani (2006). While this hypothesis appears well suited to large corporations, it does not fit well with the high-incentiveenvironment of PE partnerships.
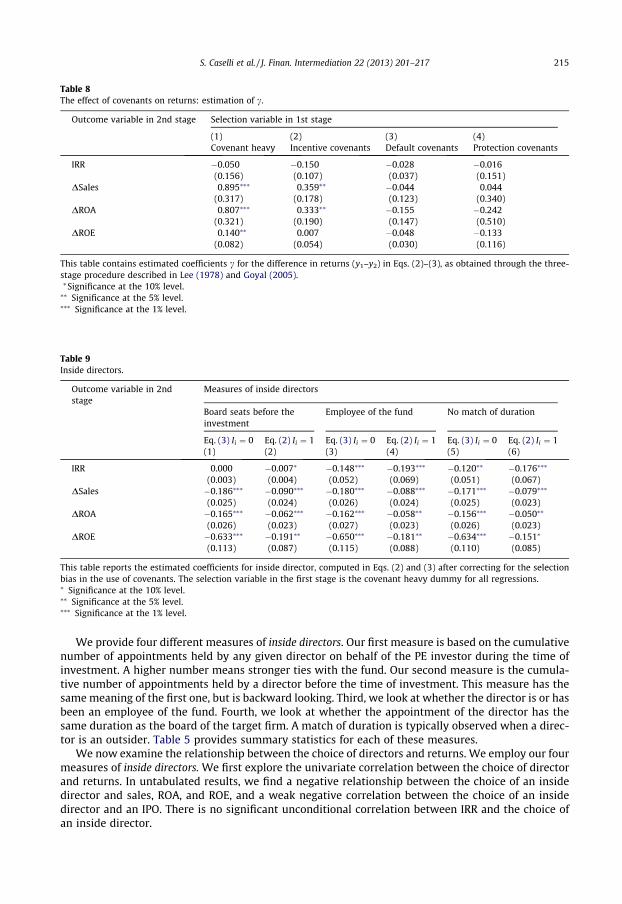
Table 8The effect of covenants on returns: estimation of c.
Outcome variable in 2nd stage Selection variable in 1st stage
(1) (2) (3) (4)Covenant heavy Incentive covenants Default covenants Protection covenants
IRR �0.050 �0.150 �0.028 �0.016(0.156) (0.107) (0.037) (0.151)
DSales 0.895⁄⁄⁄ 0.359⁄⁄ �0.044 0.044(0.317) (0.178) (0.123) (0.340)
DROA 0.807⁄⁄⁄ 0.333⁄⁄ �0.155 �0.242(0.321) (0.190) (0.147) (0.510)
DROE 0.140⁄⁄ 0.007 �0.048 �0.133(0.082) (0.054) (0.030) (0.116)
This table contains estimated coefficients c for the difference in returns (y1–y2) in Eqs. (2)–(3), as obtained through the three-stage procedure described in Lee (1978) and Goyal (2005).⁄Significance at the 10% level.⁄⁄ Significance at the 5% level.⁄⁄⁄ Significance at the 1% level.
Table 9Inside directors.
Outcome variable in 2ndstage
Measures of inside directors
Board seats before theinvestment
Employee of the fund No match of duration
Eq. (3) Ii ¼ 0 Eq. (2) Ii ¼ 1 Eq. (3) Ii ¼ 0 Eq. (2) Ii ¼ 1 Eq. (3) Ii ¼ 0 Eq. (2) Ii ¼ 1(1) (2) (3) (4) (5) (6)
IRR 0.000 �0.007⁄ �0.148⁄⁄⁄ �0.193⁄⁄⁄ �0.120⁄⁄ �0.176⁄⁄⁄
(0.003) (0.004) (0.052) (0.069) (0.051) (0.067)DSales �0.186⁄⁄⁄ �0.090⁄⁄⁄ �0.180⁄⁄⁄ �0.088⁄⁄⁄ �0.171⁄⁄⁄ �0.079⁄⁄⁄
(0.025) (0.024) (0.026) (0.024) (0.025) (0.023)DROA �0.165⁄⁄⁄ �0.062⁄⁄⁄ �0.162⁄⁄⁄ �0.058⁄⁄ �0.156⁄⁄⁄ �0.050⁄⁄
(0.026) (0.023) (0.027) (0.023) (0.026) (0.023)DROE �0.633⁄⁄⁄ �0.191⁄⁄ �0.650⁄⁄⁄ �0.181⁄⁄ �0.634⁄⁄⁄ �0.151⁄
(0.113) (0.087) (0.115) (0.088) (0.110) (0.085)
This table reports the estimated coefficients for inside director, computed in Eqs. (2) and (3) after correcting for the selectionbias in the use of covenants. The selection variable in the first stage is the covenant heavy dummy for all regressions.⁄ Significance at the 10% level.⁄⁄ Significance at the 5% level.⁄⁄⁄ Significance at the 1% level.
S. Caselli et al. / J. Finan. Intermediation 22 (2013) 201–217 215
We provide four different measures of inside directors. Our first measure is based on the cumulativenumber of appointments held by any given director on behalf of the PE investor during the time ofinvestment. A higher number means stronger ties with the fund. Our second measure is the cumula-tive number of appointments held by a director before the time of investment. This measure has thesame meaning of the first one, but is backward looking. Third, we look at whether the director is or hasbeen an employee of the fund. Fourth, we look at whether the appointment of the director has thesame duration as the board of the target firm. A match of duration is typically observed when a direc-tor is an outsider. Table 5 provides summary statistics for each of these measures.
We now examine the relationship between the choice of directors and returns. We employ our fourmeasures of inside directors. We first explore the univariate correlation between the choice of directorand returns. In untabulated results, we find a negative relationship between the choice of an insidedirector and sales, ROA, and ROE, and a weak negative correlation between the choice of an insidedirector and an IPO. There is no significant unconditional correlation between IRR and the choice ofan inside director.

216 S. Caselli et al. / J. Finan. Intermediation 22 (2013) 201–217
We then analyze whether the relationship observed between returns and the presence of an insidedirector is robust in a multivariate setting. To examine the coefficients of the inside directors we lookat the selectivity-bias adjusted regressions for all four measures of performance and all four measuresof inside directors, thus obtaining sixteen coefficients for Eq. (2) and sixteen coefficients for Eq. (3).These coefficients are reported in the relevant row of Table 7 for the variable board seats during andin Table 9 for the other three measures of inside directors.
Our main finding from the two tables is that for all four measures of insider we observe a negativerelationship with performance which is stronger for sales, ROA and ROE than for IRR. The explanationprovided by Lerner (1995) that internal directors are appointed where there is a need for more inten-sive monitoring seems to be supported by the data for all four measures of board directors. It is alsoconsistent with the weaker correlation between these measures and IRR. The interpretation of the lat-ter result may be that even though insiders signal low firm prospects, the IRR of the investment is notaffected as much as other measures of performance.
7. Conclusions
In this paper we examine the relationship between the returns of PE investments and contractcharacteristics. We identify covenants as the main object of analysis and find a strong positive rela-tionship between the number of covenants included in a deal and deal returns. This relationship holdsfor different measures of returns (IRR, growth in sales, ROA and ROE). The relationship is robust aftercontrolling for a number of firm, industry and investment characteristics.
We conjecture that the observed correlation between covenants and returns is caused by a self-selection process in which PE investors choose covenants based on their expectations of the targetfirm’s future prospects. We use a three-stage methodology that allows us to (i) account for self-selec-tion in the use of covenants, and (ii) for the possible treatment effects that covenants have perfor-mance. Our central finding is that self-selection plays a key role in the choice of covenants andmore covenants are associated with better firm prospects. The choice of covenants reveals unobserv-able private information that is not otherwise observable by looking at public information, contained,for example, in accounting variables. We interpret this evidence to indicate that firms signal their bet-ter prospects to potential investors by accepting more covenants than average. We also show that cov-enants can carry treatment effects that likely operate by strengthening the incentives of managerstowards profit maximization.
Finally, we examine the relationship between the appointment of board directors and returns. Wefind that internal directors are appointed in firms that are less profitable. We interpret this evidence asconsistent with the hypothesis of Lerner (1995) that insiders are appointed when there is more needfor close monitoring.
Acknowledgments
We thank MPS Venture SGR for kindly providing the data; Paul Gompers, Francesco Corielli, Doug-las Cumming, John Doukas, Giuliano Iannotta, Josh Lerner, Marco Da Rin, Antoinette Schoar, AlbrechtGlitz, two anonymous referees, and the editor Manju Puri for helpful comments. We also thank sem-inar participants at the Second Entrepreneurial Finance and Innovation Conference in Boston, EFA inFrankfurt, EFMA in Milan, EFMA Symposium on Private Equity in Montreal, and FMA in Reno. Weacknowledge financial support from CAREFIN Centre for Applied Research in Finance.
References
Aghion, P., Bolton, P., Tirole, J., 2004. Exit options in corporate finance: liquidity versus incentives. Rev. Finance 8, 327–353.Aghion, P., Bolton, P., 1992. An incomplete contracts approach to financial contracting. Rev. Econ. Stud. 77, 101–338.Axelson, U., Jenkinson, T., Strömberg, P., Weisbach, M.S., forthcoming. Borrow cheap, buy high? Determinants of Leverage and
Pricing in Buyouts. J. Finance.Barry, C.B., Muscarella, C.J., Peavy, J.W., Vetsuypens, M.R., 1990. The role of venture capital in the creation of public companies:
evidence from the going-public process. J. Finan. Econ. 27, 447–471.Bascha, A., Walz, U., 2001. Convertible securities and optimal exit decisions in venture capital finance. J. Corp. Finan. 7, 285–306.

S. Caselli et al. / J. Finan. Intermediation 22 (2013) 201–217 217
Bengtsson, O., 2011. Covenants in venture capital contracts. Manage. Sci. 57 (11), 1926–1943.Brav, A., Gompers, P.A., 2003. The role of lockups in initial public offerings. Rev. Finan. Stud. 16 (1), 1–29.Bygrave, W., Timmons, J., 1992. Venture Capital at the Crossroads. Harvard Business School Press, Boston.Casamatta, C., 2003. Financing and advising: optimal financial contracts with venture capitalists. J. Finance 58 (5), 2059–2085.Casares-Field, L., Hanka, G., 2001. The expiration of IPO share lockups. J. Finance 56 (2), 471–500.Cochrane, J.H., 2005. The risk and return of venture capital. J. Finan. Econ. 75 (1), 3–52.Cornelli, F., Yosha, O., 2003. Stage financing and the role of convertible securities. Rev. Econ. Stud. 70 (1), 1–32.Cumming, D., 2008. Contracts and exits in venture capital finance. Rev. Finan. Stud. 21 (5), 1947–1982.Dessi, R., 2005. Start-up finance, monitoring and collusion. RAND J. Econ. 36 (2), 255–274.Drucker, S., Puri, M., 2009. On loan sales, loan contracting, and lending relationships. Rev. Finan. Stud. 22 (7), 2835–2872.Dunbar, C.G., 1995. The use of warrants as underwriter compensation in initial public offerings. J. Finan. Econ. 38, 59–78.Fang, L.H., 2005. Investment bank reputation and the price and quality of underwriting services. J. Finance 60 (6), 2729–2761.Fich, E.M., Shivdasani, A., 2006. Are busy boards effective monitors? J. Finance 61 (2), 689–724.Gompers, P., Lerner, J., 1997. Risk and reward in private equity investments: the challenge of performance assessment. J. Private
Equity 1, 5–12.Gompers, P., Lerner, J., 1999. An analysis of compensation in the US venture capital partnership. J. Finan. Econ. 51 (1), 3–44.Gompers, P., Lerner, J., 2000. Money chasing deals? The impact of fund inflows in private equity valuations. J. Finan. Econ. 55,
281–325.Gompers, P.A., 1999. Ownership and Control in Entrepreneurial Firms: An Examination of Convertible Securities in Venture
Capital Investments. Unpublished results.Goyal, V.K., 2005. Market discipline of bank risk: evidence from subordinated debt contracts. J. Finan. Intermediation 14, 318–
350.Groh, A., Gottschalg, O., 2006. The Risk-Adjusted Returns of US Buyouts. Unpublished results.Hellmann, T., 1998. The allocation of control rights in venture capital contracts. RAND J. Econ. 29 (1), 57–76.Hellmann, T., 2006. IPOs, acquisitions, and the use of convertible securities in venture capital. J. Finan. Econ. 81, 649–679.Holmström, B., 1979. Moral hazard and observability. Bell J. Econ. 10, 74–91.Inderst, R., Mueller, H., 2004. The effect of capital market characteristics in the value of start-up firms. J. Finan. Econ. 72, 319–
356.Johnson, R.A., Wichern, D.A., 2007. Applied Multivariate Statistical Analysis, sixth ed. Pearson Prentice Hall, NJ.Kaplan, S., Schoar, A., 2005. Private equity performance: returns, persistence and capital flows. J. Finance 60 (4), 1791–1823.Kaplan, S.N., Strömberg, P., 2003. Financial contracting theory meets the real world: an empirical analysis of venture capital
contracts. Rev. Econ. Stud. 70 (2), 281–315.Kaplan, S.N., Strömberg, P., 2004. Characteristics, contracts, and actions: evidence from venture capitalist analyses. J. Finance 59
(5), 2173–2206.Lee, L.F., 1978. Unionism and wage rates: a simultaneous equations model with quantitative and limited dependent variables.
Intermountain Econ. Rev. 19, 415–433.Lerner, J., 1995. Venture capitalists and the oversight of private firms. J. Finance 50, 301–318.Lerner, J., Merges, R.P., 1998. The control of technology alliances: an empirical analysis of the biotechnology industry. J. Industry
Stud. 46 (2), 125–156.Lerner, J., Schoar, A., Wong, W., 2007. Smart institutions, foolish choices? The limited partner returns puzzle. J. Finance 62, 731–
764.Li, K., Prabhala, N.R., 2007. Self-selection models in corporate finance. In: Eckbo, B.E. (Ed.), Handbook of Corporate Finance, vol. I.
North Holland, pp. 37–83.Ljungqvist, A., Richardson, M., 2003. The Cash-Flow, Return and Risk Characteristics of Private Equity. Unpublished results.Maddala, G.S., 1983. Limited-Dependent and Qualitative Variables in Econometrics. Cambridge University Press.Metrick, A., Yasuda, A., 2010. The economics of private equity funds. Rev. Finan. Stud. 23, 2303–2341.Poon, W.P.H., Lee, J., Gup, B.E., 2009. Do solicitations matter in bank credit ratings? Results from a study of 72 countries. J.
Money, Credit, Banking 41, 285–314.Renucci, A., 2000. Optimal Contracts between Entrepreneurs and Value-enhancing Financiers. Unpublished results.Repullo, R., Suarez, J., 2004. Venture capital finance: a security design approach. Rev. Finance 8 (1), 75–108.Sahlman, W.A., 1990. The structure and governance of venture capital organizations. J. Finan. Econ. 27, 473–521.Schmidt, K.M., 2003. Convertible securities and venture capital finance. J. Finance 58 (5), 2059–2086.Song, W., 2004. Competition and coalition among underwriters: the decision to join a syndicate. J. Finance 59, 2421–2444.Sufi, Amir, 2009. Bank lines of credit in corporate finance: an empirical analysis. Rev. Finan. Stud. 22 (3), 1057–1088.Yates, G., Hinchliffe, M., 2010. A Practical Guide to Private Equity Transactions. Cambridge University Press, Cambridge.