contour lines basics contour lines are lines drawn on a map connecting points of equal elevation. if...
TRANSCRIPT
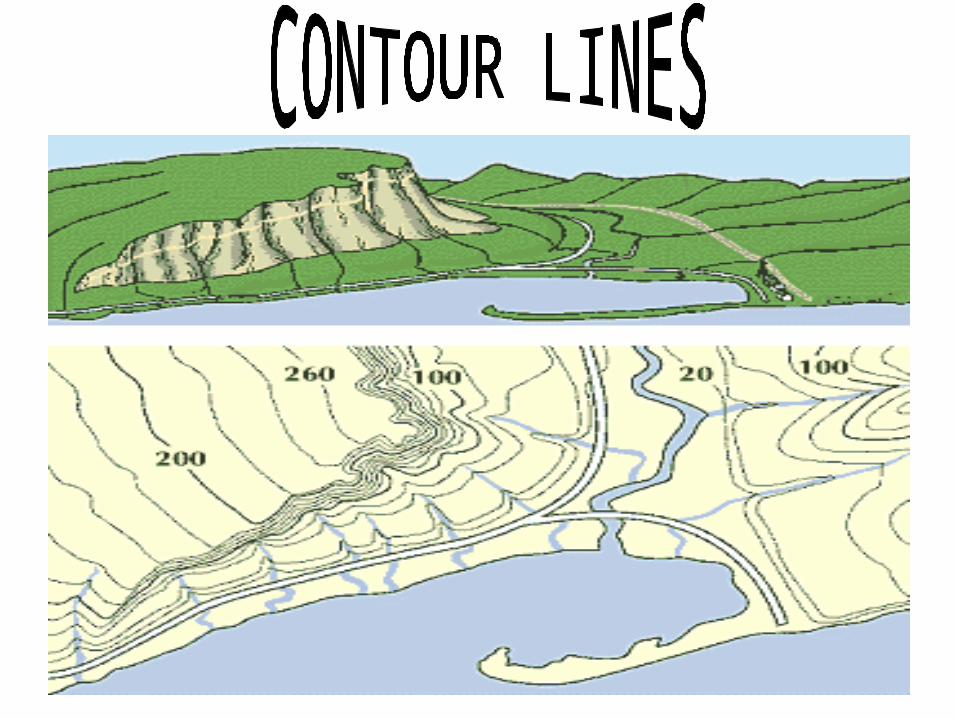
CONTOUR LINESBASICS
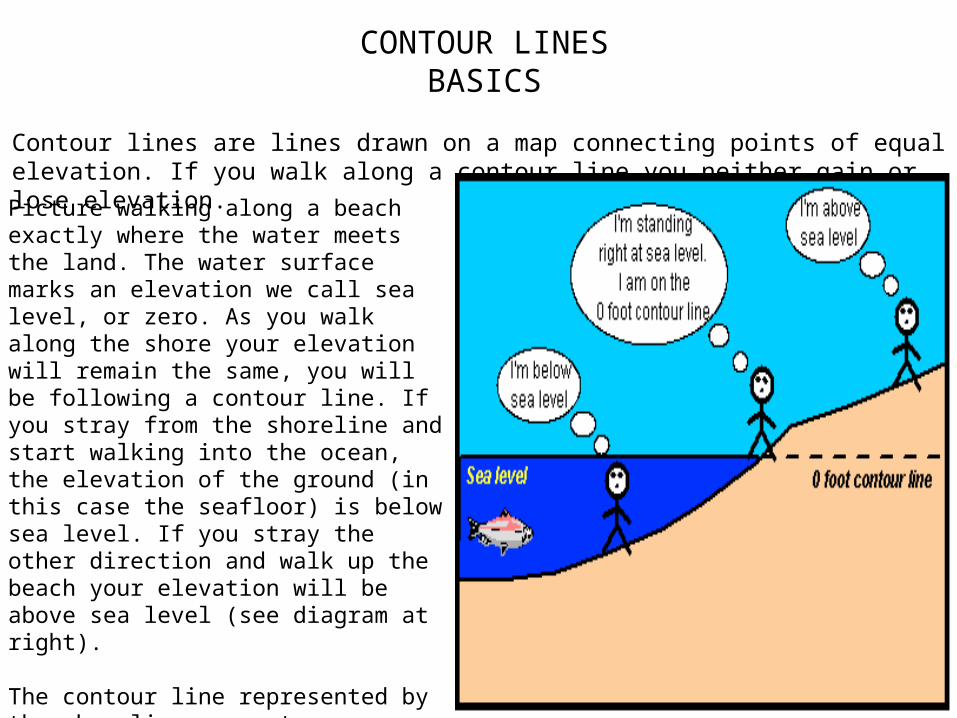
Contour lines are lines drawn on a map connecting points of equal elevation. If you walk along a contour line you neither gain or lose elevation.
Picture walking along a beach exactly where the water meets the land. The water surface marks an elevation we call sea level, or zero. As you walk along the shore your elevation will remain the same, you will be following a contour line. If you stray from the shoreline and start walking into the ocean, the elevation of the ground (in this case the seafloor) is below sea level. If you stray the other direction and walk up the beach your elevation will be above sea level (see diagram at right).
The contour line represented by the shoreline separates areas that have elevations above sea level from those that have elevations below sea level. We refer to contour lines in terms of their elevation above or below sea level. In this example the shoreline would be the zero contour line.
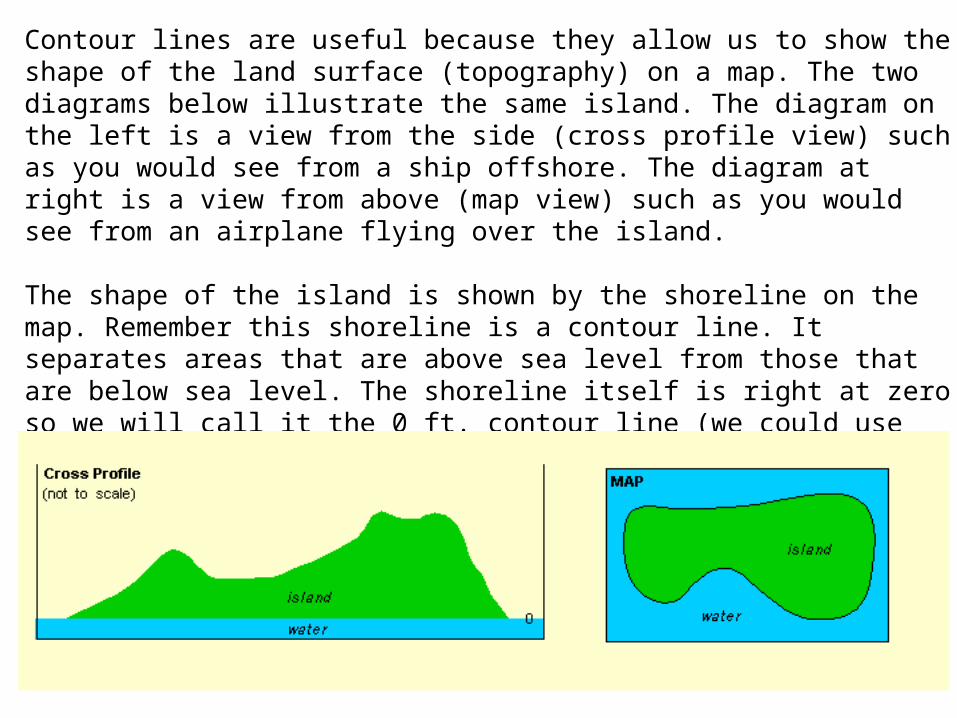
Contour lines are useful because they allow us to show the shape of the land surface (topography) on a map. The two diagrams below illustrate the same island. The diagram on the left is a view from the side (cross profile view) such as you would see from a ship offshore. The diagram at right is a view from above (map view) such as you would see from an airplane flying over the island.
The shape of the island is shown by the shoreline on the map. Remember this shoreline is a contour line. It separates areas that are above sea level from those that are below sea level. The shoreline itself is right at zero so we will call it the 0 ft. contour line (we could use m.,cm., in., or any other measurement for elevation).
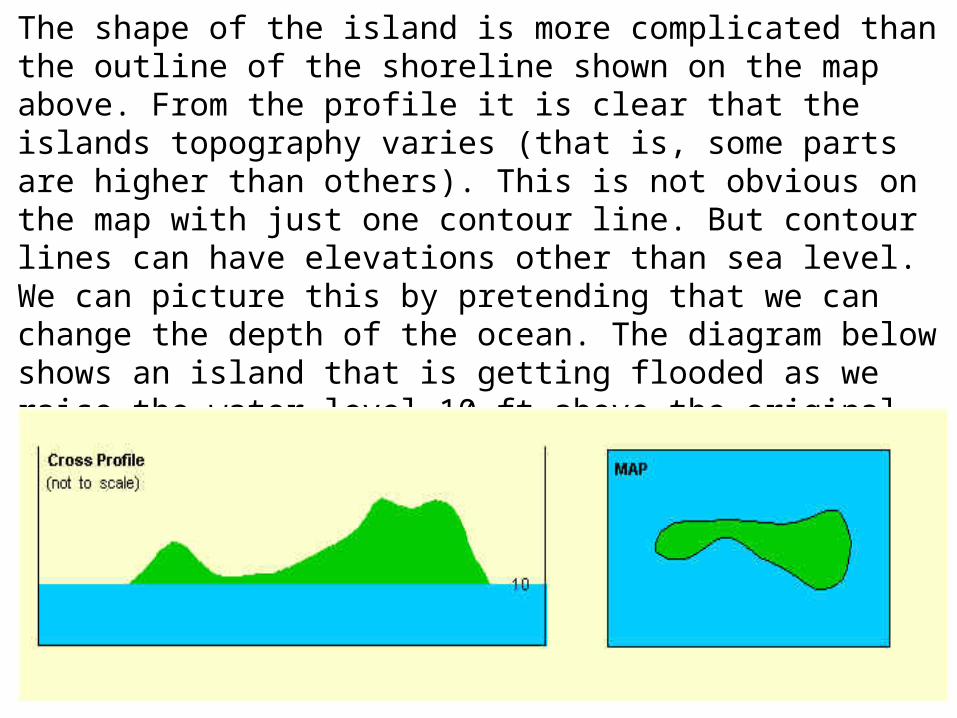
The shape of the island is more complicated than the outline of the shoreline shown on the map above. From the profile it is clear that the islands topography varies (that is, some parts are higher than others). This is not obvious on the map with just one contour line. But contour lines can have elevations other than sea level. We can picture this by pretending that we can change the depth of the ocean. The diagram below shows an island that is getting flooded as we raise the water level 10 ft above the original sea level.
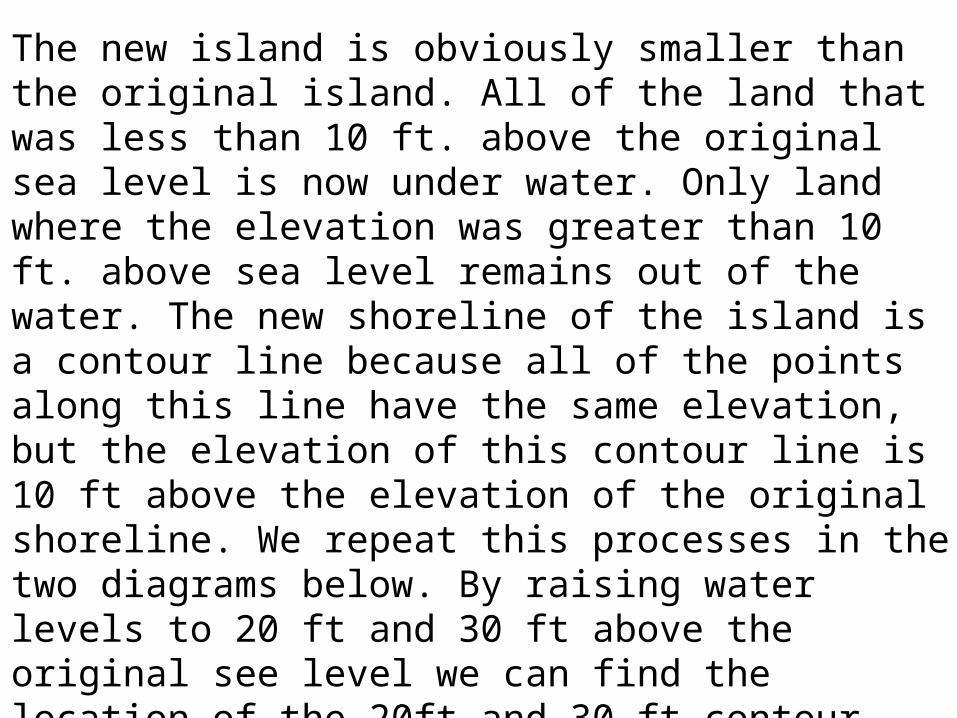
The new island is obviously smaller than the original island. All of the land that was less than 10 ft. above the original sea level is now under water. Only land where the elevation was greater than 10 ft. above sea level remains out of the water. The new shoreline of the island is a contour line because all of the points along this line have the same elevation, but the elevation of this contour line is 10 ft above the elevation of the original shoreline. We repeat this processes in the two diagrams below. By raising water levels to 20 ft and 30 ft above the original see level we can find the location of the 20ft and 30 ft contour lines. Notice our islands gets smaller and smaller.
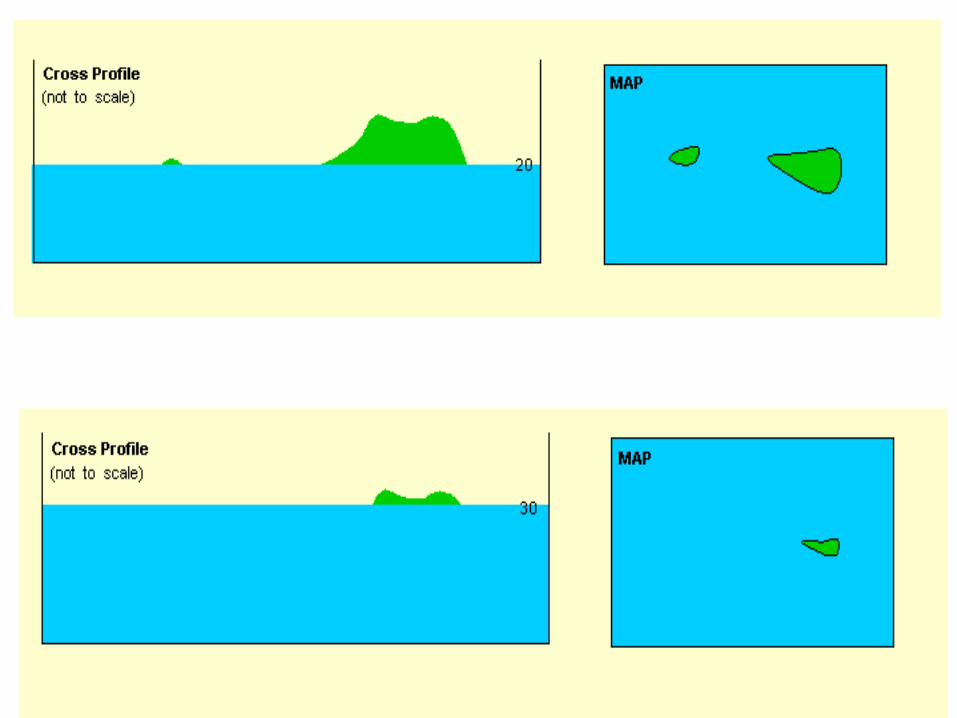
Fortunately we do not really have to flood the world to make contour lines. Unlike shorelines, contour lines are imaginary. They just exist on maps. If we take each of the shorelines from the maps above and draw them on the same map we will get a topographic map (see map below). Taken all together the contour lines supply us with information on the topography of the island. From the map (and the profile) we can see that this island has two "high" points. The highest point is above 30 ft elevation (inside the 30 ft contour line). The second high point is above 20 ft in elevation, but does not reach 30 ft. These high points are at the ends of a ridge that runs the length of the island where elevations are above 10 ft. Lower elevations, between the 10 ft contour and sea level, surround this ridge.
With practice we can picture topography by looking at the map even without the cross profile. That is the power of topographic maps.
READING ELEVATIONS
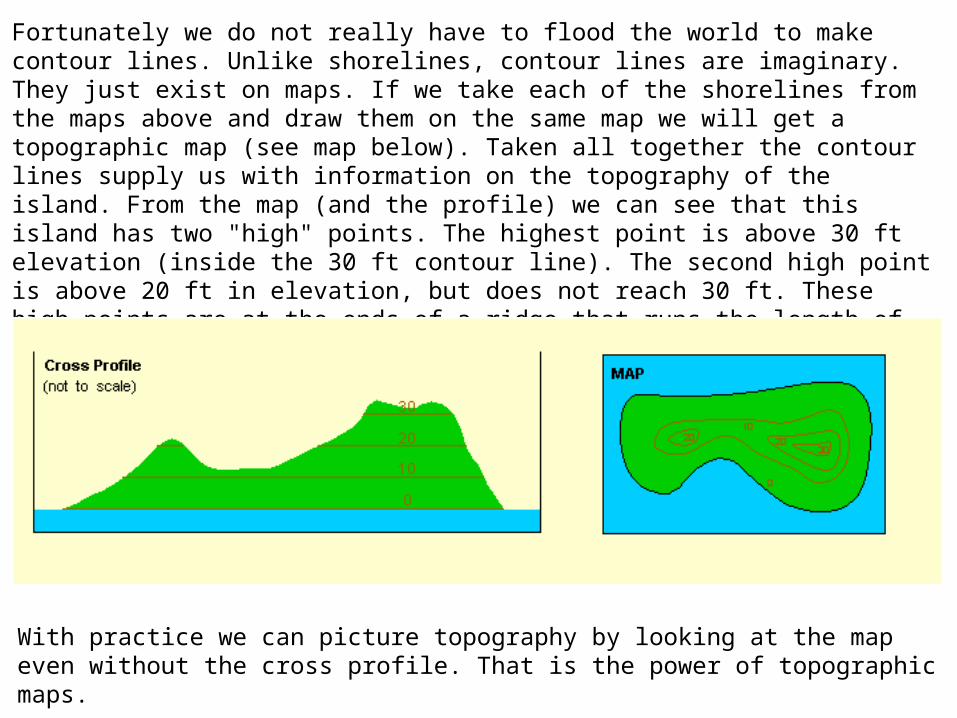
A common use for a topographic map is to determine the elevation at a specified locality. The map below is an enlargement of the map of the island from above. Each of the letters from A to E represent locations for which we wish to determine elevation. Use the map and determine (or estimate) the elevation of each of the 5 points. (Assume elevations are given in feet)
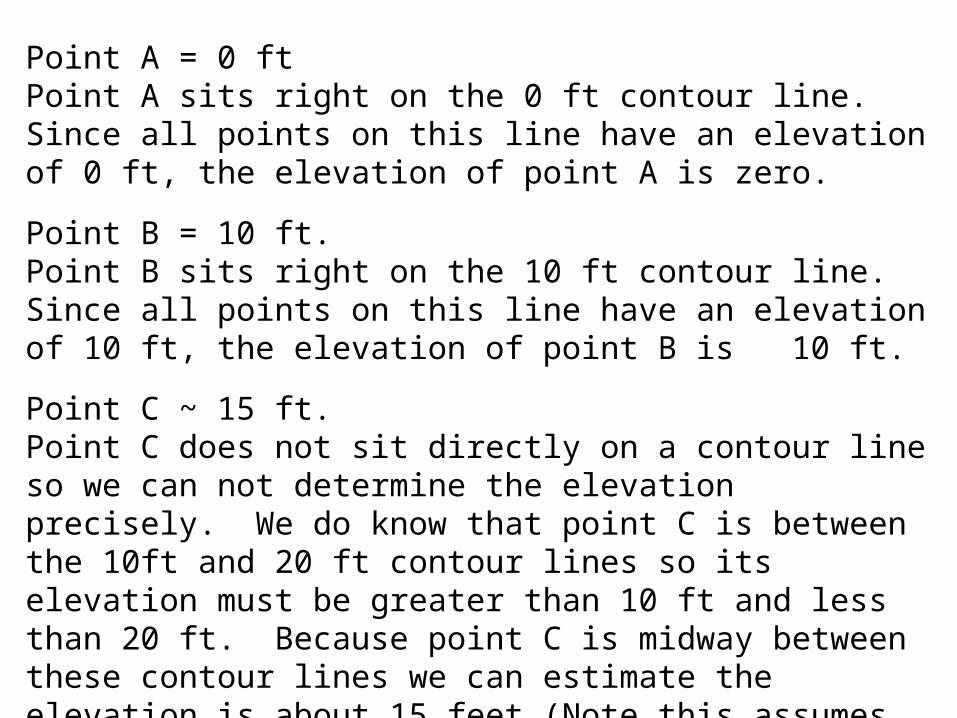
Point A = 0 ftPoint A sits right on the 0 ft contour line. Since all points on this line have an elevation of 0 ft, the elevation of point A is zero.
Point B = 10 ft.Point B sits right on the 10 ft contour line. Since all points on this line have an elevation of 10 ft, the elevation of point B is 10 ft.
Point C ~ 15 ft.Point C does not sit directly on a contour line so we can not determine the elevation precisely. We do know that point C is between the 10ft and 20 ft contour lines so its elevation must be greater than 10 ft and less than 20 ft. Because point C is midway between these contour lines we can estimate the elevation is about 15 feet (Note this assumes that the slope is constant between the two contour lines, this may not be the case) .
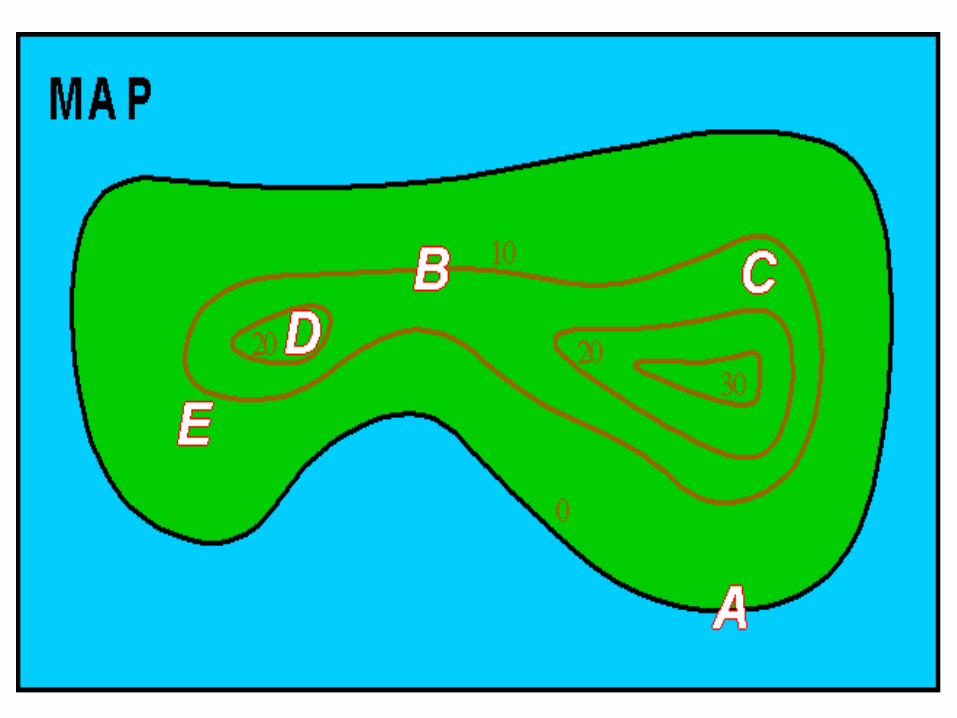
Point D ~ 25 ft.We are even less sure of the elevation of point D than point C. Point D is inside the 20 ft. contour line indicating its elevation is above 20 ft. Its elevation has to be less than 30 ft. because there is no 30 ft. contour line shown. But how much less? There is no way to tell. The elevation could be 21 ft, or it could be 29 ft. There is now way to tell from the map. (An eight foot difference in elevation doesn't seem like much, but remember these numbers are just an example. If the contour lines were spaced at 100 ft intervals instead of 10 ft., the difference would be a more significant 80 ft.)
Point E ~ 8 ft.Just as with point C above, we need to estimate the elevation of point E somewhere between the 0 ft and 10 ft contour lines it lies in between. Because this point is closer to the 10 ft line than the 0 ft. line we estimate an elevation closer to 10. In this case 8 ft. seems reasonable. Again this estimation makes the assumption of a constant slope between these two contour lines.
CONTOUR INTERVAL and INDEX CONTOURS
Contour Intervals
Contour lines can be drawn for any elevation, but to simplify things only lines for certain elevations are drawn on a topographic map. These elevations are evenly spaced vertically. This vertical spacing is referred to as the contour interval. For example the maps above used a 10 ft contour interval. Each the contour lines was a multiple of 10 ft.( i.e. 0, 10, 20, 30). Other common intervals seen on topographic maps are 20 ft, 40 ft, 80 ft, and 100ft. The contour interval chosen for a map depends on the topography in the mapped area. In areas with high relief the contour interval is usually larger to prevent the map from having too many contour lines, which would makes the map difficult to read.
The contour interval is constant for each map. It will be noted on the margin of the map. You can also determine the contour interval by looking at how many contour lines are between labelled contours.
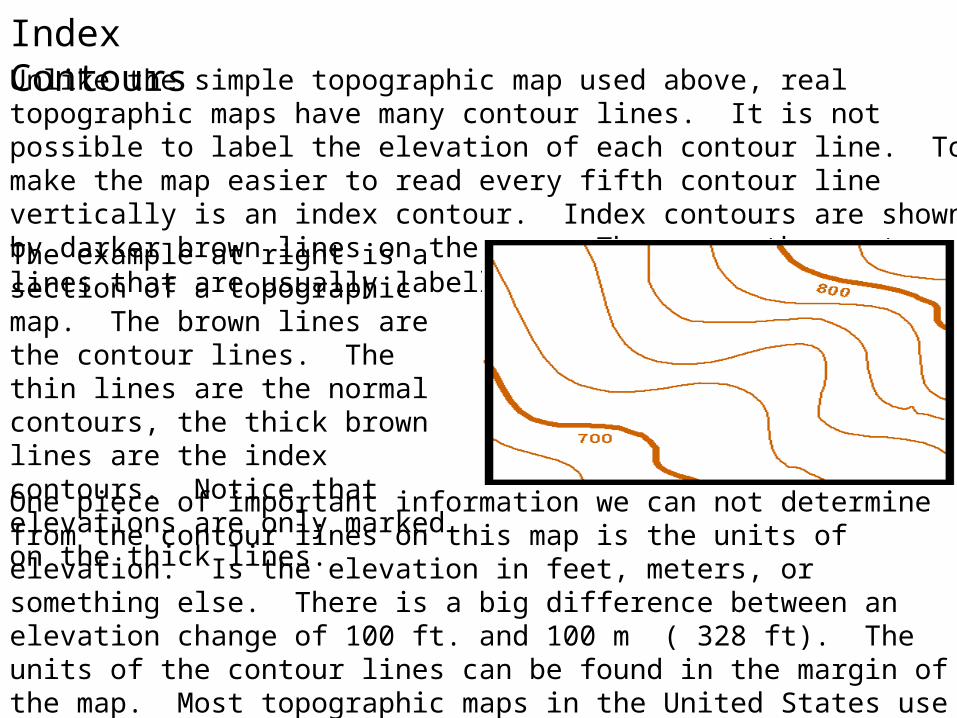
Unlike the simple topographic map used above, real topographic maps have many contour lines. It is not possible to label the elevation of each contour line. To make the map easier to read every fifth contour line vertically is an index contour. Index contours are shown by darker brown lines on the map. These are the contour lines that are usually labelled.
Index Contours
The example at right is a section of a topographic map. The brown lines are the contour lines. The thin lines are the normal contours, the thick brown lines are the index contours. Notice that elevations are only marked on the thick lines.
One piece of important information we can not determine from the contour lines on this map is the units of elevation. Is the elevation in feet, meters, or something else. There is a big difference between an elevation change of 100 ft. and 100 m ( 328 ft). The units of the contour lines can be found in the margin of the map. Most topographic maps in the United States use feet for elevation, but it is important to check because some do use meters.
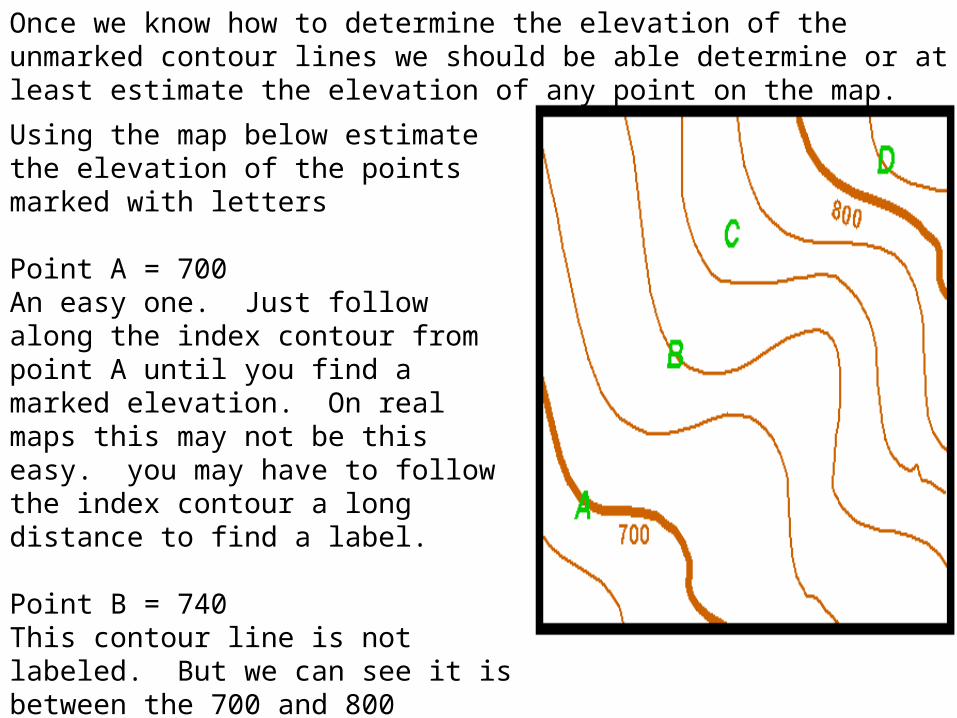
Once we know how to determine the elevation of the unmarked contour lines we should be able determine or at least estimate the elevation of any point on the map.
Using the map below estimate the elevation of the points marked with letters
Point A = 700An easy one. Just follow along the index contour from point A until you find a marked elevation. On real maps this may not be this easy. you may have to follow the index contour a long distance to find a label.
Point B = 740This contour line is not labeled. But we can see it is between the 700 and 800 contour line. From above we know the contour interval is 20 so if we count up two contour lines (40) from 700 we reach 740.
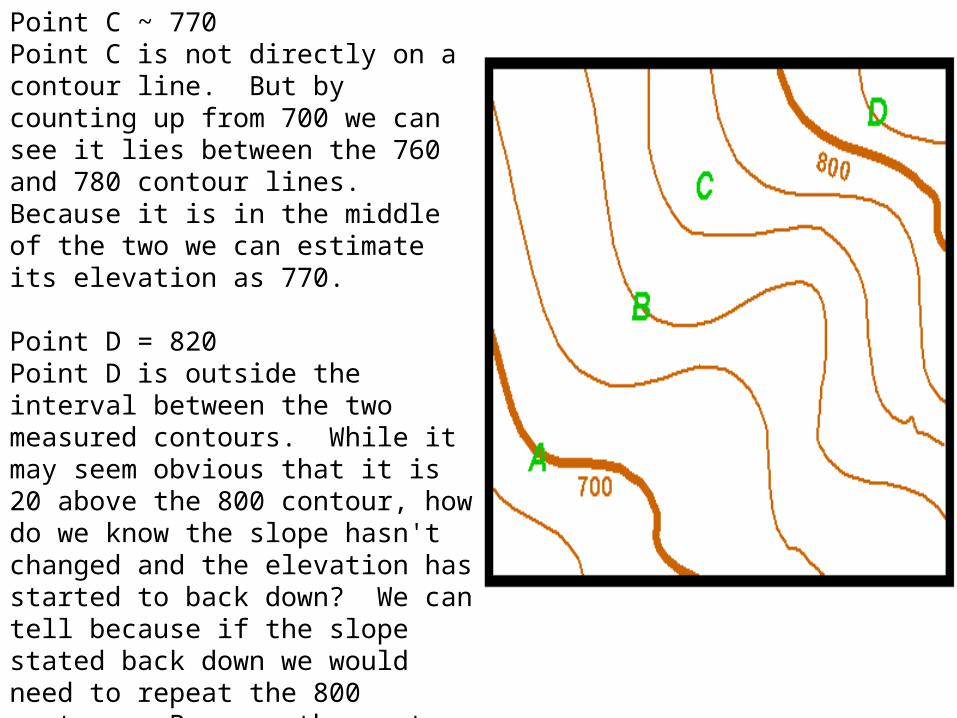
Point C ~ 770Point C is not directly on a contour line. But by counting up from 700 we can see it lies between the 760 and 780 contour lines. Because it is in the middle of the two we can estimate its elevation as 770.
Point D = 820Point D is outside the interval between the two measured contours. While it may seem obvious that it is 20 above the 800 contour, how do we know the slope hasn't changed and the elevation has started to back down? We can tell because if the slope stated back down we would need to repeat the 800 contour. Because the contour under point D is not an index contour it can not be the 800 contour, so must be 820.
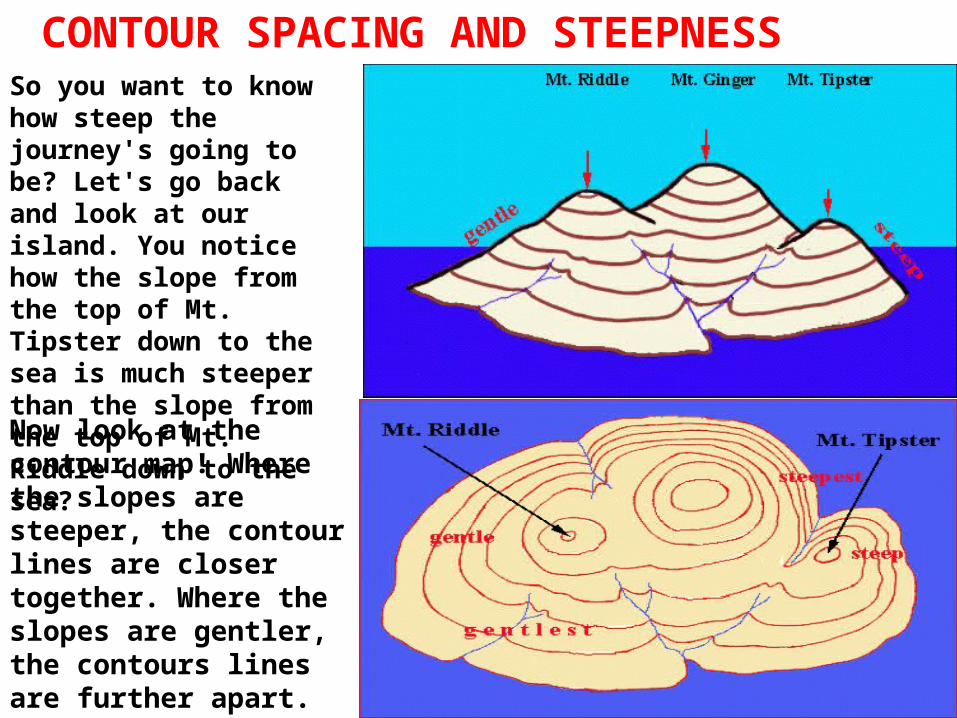
CONTOUR SPACING AND STEEPNESSSo you want to know how steep the journey's going to be? Let's go back and look at our island. You notice how the slope from the top of Mt. Tipster down to the sea is much steeper than the slope from the top of Mt. Riddle down to the sea?
Now look at the contour map! Where the slopes are steeper, the contour lines are closer together. Where the slopes are gentler, the contours lines are further apart.
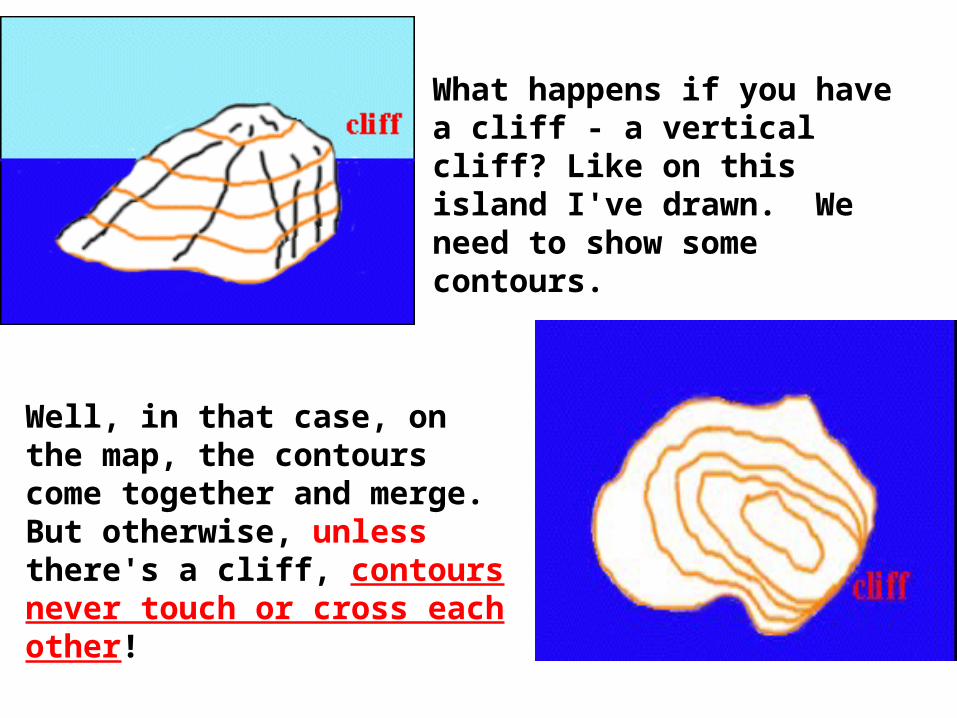
What happens if you have a cliff - a vertical cliff? Like on this island I've drawn. We need to show some contours.
Well, in that case, on the map, the contours come together and merge. But otherwise, unless there's a cliff, contours never touch or cross each other!
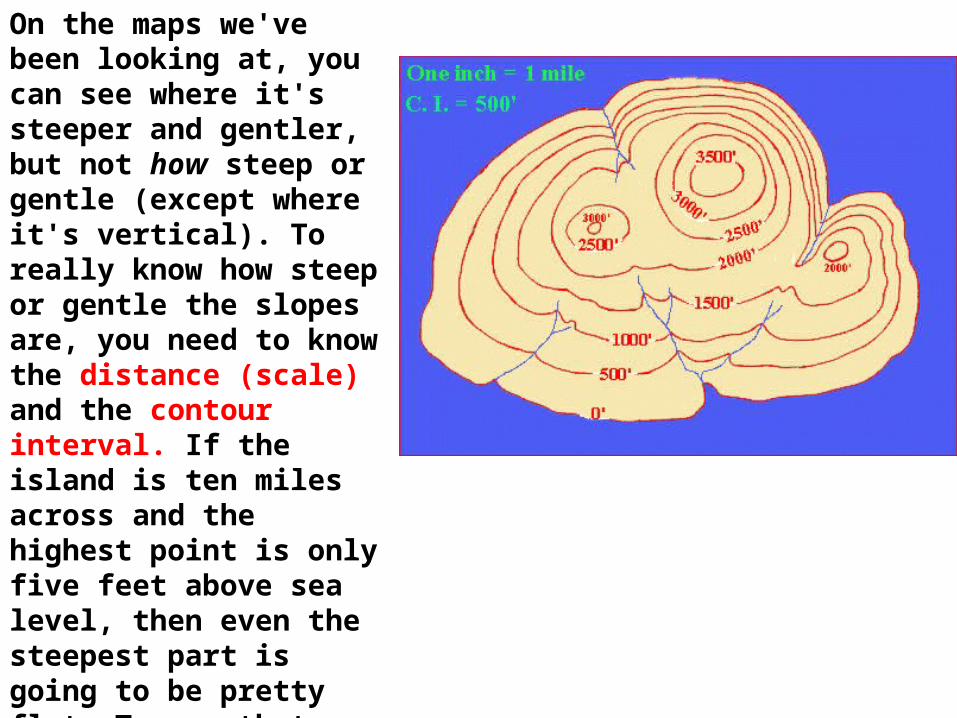
On the maps we've been looking at, you can see where it's steeper and gentler, but not how steep or gentle (except where it's vertical). To really know how steep or gentle the slopes are, you need to know the distance (scale) and the contour interval. If the island is ten miles across and the highest point is only five feet above sea level, then even the steepest part is going to be pretty flat. To see that you need a map like this. Now you can see how much you go up in a given horizontal distance.