contents...contents, continued 3 test pile configuration 4 static axial compression load test...
TRANSCRIPT


Contents
1. Introduction ............................................................................................................................................ 1
2. Limitations .............................................................................................................................................. 1
3. Subsurface Conditions ............................................................................................................................. 1 3.1 Site Geology ......................................................................................................................................... 2 3.2 Subsurface Exploration ........................................................................................................................ 2 3.3 Subsurface Conditions ......................................................................................................................... 2
4. Interpreted Geotechnical Soil Design Properties ..................................................................................... 3
5. Test Pile Program .................................................................................................................................... 3 5.1 Load Testing Procedures ...................................................................................................................... 6 5.2 Load Testing Results ............................................................................................................................ 6 5.3 Comparison of Test Results with Predicted Pile Capacity ................................................................... 7
5.3.1 Axial Compression .................................................................................................................. 7 5.3.2 Lateral Capacity ...................................................................................................................... 8
6. Conclusions ............................................................................................................................................. 8
7. Recommendations .................................................................................................................................. 9
8. References .............................................................................................................................................. 9
Appendixes
A Subsurface Data B Pile Installation Observations C Static Load Testing Procedures and Data
Figures
C-1 Axial Capacity Load Frame Configuration C-2 Axial Capacity Load Frame Photo C-3 Lateral Load Frame Photo
D Dynamic Load Testing Report
Tables
1 Recommended Soil Design Parameters ............................................................................................................ 5
2 Summary of Pile Configurations ....................................................................................................................... 6
3 Shaft and Toe Resistance Determined from Dynamic Testing and Interpretation of Static Testing ................ 8
A-1 Relative Density of Coarse-Grained Soil1 ...................................................................................................... A-1
A-2 Consistency of Fine-Grained Soil 1 ................................................................................................................ A-2
B-1 Pressure/Torque Readings from Gage in Cab: Pile 5 (Provided by APE) ...................................................... B-3
Figures
1 Site Location Map 2 Test Site Plan
SEA130450001/ES020513062946SEA III

CONTENTS, CONTINUED
3 Test Pile Configuration 4 Static Axial Compression Load Test Results: Pile 1, Single Helix, Ungrouted 5 Static Axial Compression Load Test Results: Pile 5, Single Helix, Grouted 6 Static Lateral Load Test Results and Calculated Lateral Deflection: Grouted and Ungrouted 7 Comparison of Calculated and Measured Capacity in Axial Compression: Pile 1 8 Comparison of Calculated and Measured Capacity in Axial Compression: Pile 5
IV SEA130450001/ES020513062946SEA

Acronyms and Abbreviations APE American Piledriving Equipment, Inc.
ASTM American Society for Testing and Materials
bgs below ground surface
ksi kips per square inch
NAD83/91 North American Datum 1983/1991
NAVD88 North American Vertical Datum 1988
OD outside diameter
pcf pounds per cubic foot
pci pounds per cubic inch
psi pounds per square inch
rpm revolutions per minute
SPT Standard Penetration Test
USCS Unified Soil Classification System
yd3 cubic yards
SEA130450001/ES020513062946SEA V


Geotechnical Report for the APE Yard Helical Pile Test Program
1. Introduction This report provides subsurface information and the results of load tests on test piles installed at the American Piledriving Equipment, Inc. (APE) manufacturing facility located at 7032 South 196th Street in Kent, Washington. CH2M HILL has been contracted by APE to provide observation, analysis, and reporting of load tests on helical piles. CH2M HILL’s work included the following:
1. Logging a geotechnical boring at the test site
2. Developing preliminary engineering properties for the site based on the boring and laboratory characterization
3. Observing and documenting installation of helical test piles
4. Observing and documenting static compression and lateral load tests
5. Observing dynamic monitoring
6. Documenting the results of the site conditions and load tests in this preliminary report.
CH2M HILL is acting as an independent reviewer and has no interest in the outcome of the technology testing or development. Review of the structural capacity of the fabricated piling materials was excluded from the scope of this work.
2. Limitations This report has been prepared for the exclusive use of APE for specific application to the helical pile test program conducted between October 2012 and May 2013 at their Kent manufacturing facility. This report has been prepared in accordance with generally accepted geotechnical engineering practice. No other warranty, express or implied, is made.
The analyses, conclusions, and recommendations contained in this report are based on the data obtained from a single boring, which indicated conditions only at a specific location and time and only to the depths penetrated. The boring does not necessarily reflect strata variations that might exist beyond its immediate vicinity. Using the boring interpretation for other locations on the site or uses might not be appropriate. In addition, installation of the test piles and reaction piles for the test frames has altered the subsurface so that similar conditions might not be relied upon for future tests within the same test area.
The interpretations and recommendations contained in this report are only for the purpose of documenting helical pile capacity and are not intended for design of structures or other facilities at the site. CH2M HILL is not responsible for any claims, damages, or liability associated with interpretation of subsurface data or reuse of the subsurface data or engineering analyses without the express written authorization of CH2M HILL.
3. Subsurface Conditions Figure 1 shows the site location. The geology of the area, subsurface exploration, and observed subsurface conditions are described in the subsections below.
SEA130450001/ES020513062946SEA 1

GEOTECHNICAL REPORT FOR THE APE YARD HELICAL PILE TEST PROGRAM
3.1 Site Geology The site is located in the Green River Valley, which was an inlet of the Puget Sound at the conclusion of the most recent glaciation about 12,500 years ago. The marine embayment was gradually displaced by the deposition of alluvial soils by the ancestral and modern Green and White Rivers. The valley floor in Kent is underlain by about 400 feet of alluvial soils. The surface is capped by overbank deposits of the modern Green and White Rivers, consisting of fine sandy silt. Loose, reasonably well-sorted, alluvial sand and silt deposited by the ancestral Green and White Rivers underlie the more recent overbank deposits, which are in turn underlain by a marine sandy silt. The Osceola Mudflow, which originated from Mount Rainier, flowed into the drainage about 5,700 years ago and may interrupt the late Holocene valley fill deposits in some locations. The mudflow deposit is characterized by poor sorting of gravel, sand, silt, and clay with occasional boulders—typically massive texture, random inclusions of wood and organics, and low density—and dominance of angular and volcanic clasts. Large-scale subsurface maps developed from widely spaced well logs project the top surface of the mudflow between elevation -40 and -140 feet in the vicinity of the APE site and suggest that it could be 0 to 40 feet thick (Dragovich, et al., 1994).
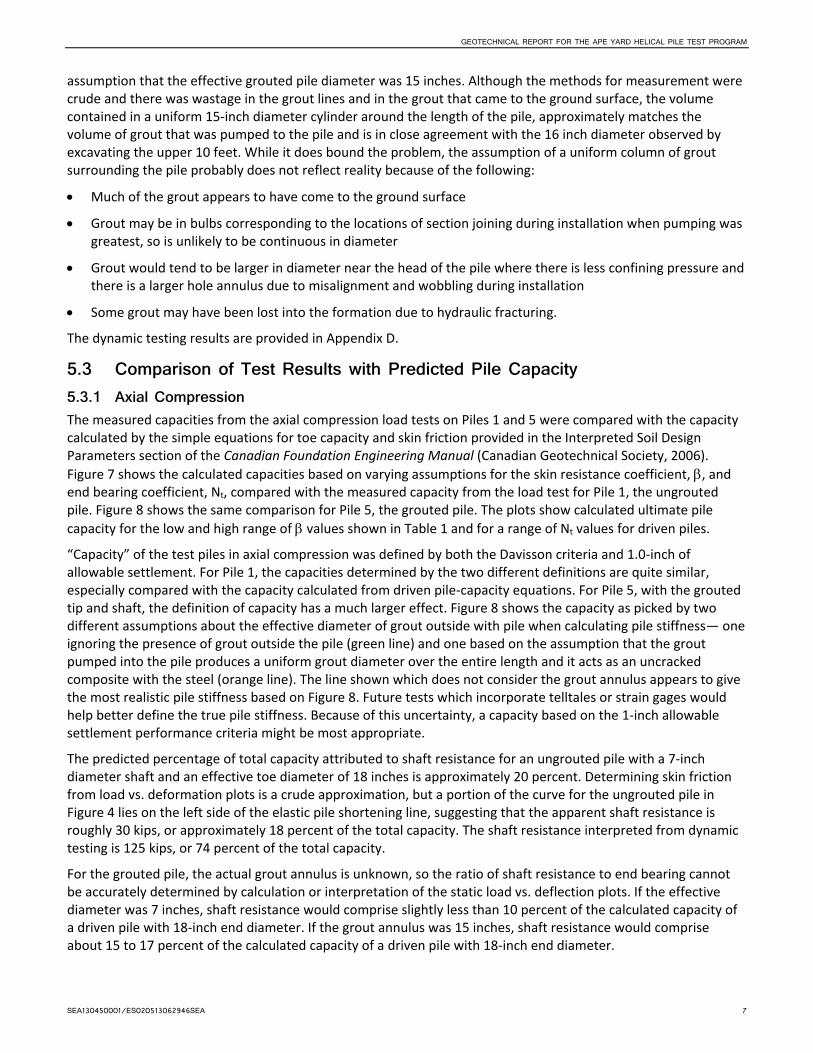
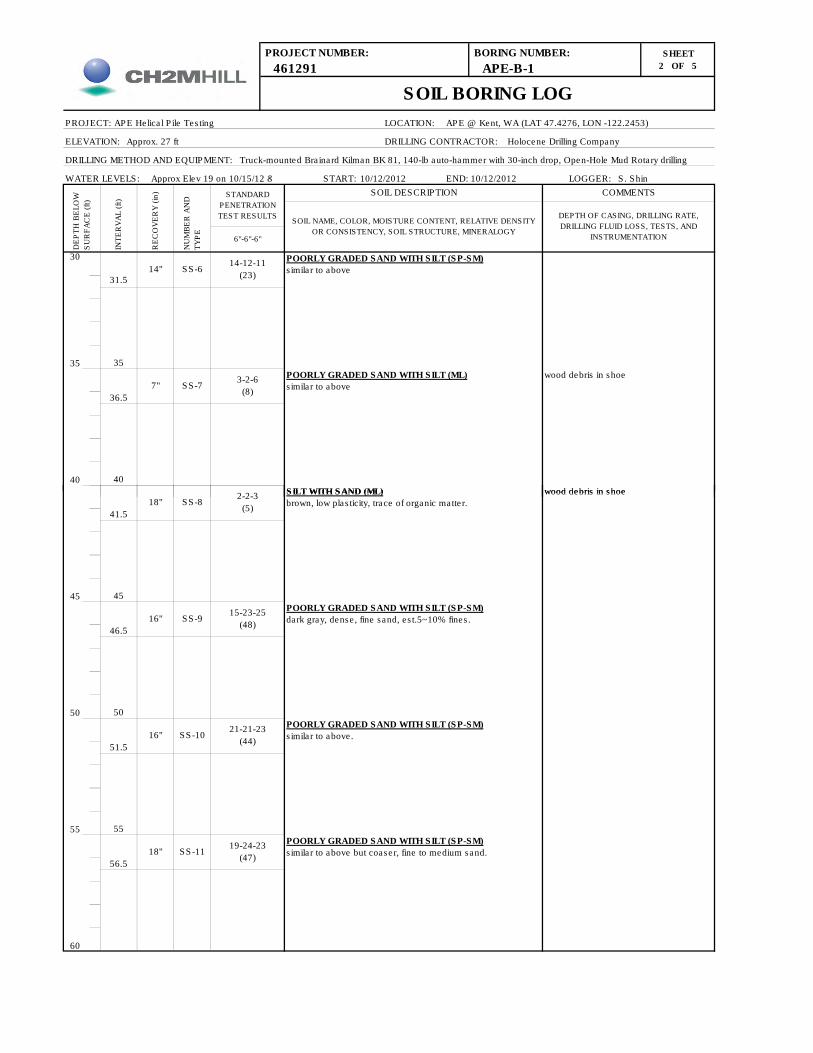
3.2 Subsurface Exploration A 141.5-foot-deep geotechnical boring was drilled in the test pile location in mid-October 2012. The boring was drilled with open-hole mud rotary techniques, and Standard Penetration Test (SPT) samples were driven at 5-foot intervals in general accordance with American Society of Testing and Materials (ASTM) D 1586, except that sample liners were not used. The Brainard Kilman BK81 drill rig was equipped with an automatic trip hammer, which was recently dynamically tested and found to have an average energy transfer ratio (measured energy divided by potential energy) of 54 percent (GeoDesign, 2013). Samples were visually classified and logged in accordance with ASTM D2488. Representative samples were tested in the laboratory for grain size and Atterberg limits. A standpipe piezometer was screened between 20 and 30 feet below the ground surface (bgs). The boring log (boring APE-B-1) and laboratory test results are contained in Appendix A. The depth to groundwater in the piezometer in boring APE-B-1 was measured on October 15 and November 30, 2012; the depth below the original ground surface varied from 7.9 to 8.0 feet.
3.3 Subsurface Conditions The boring indicates the general stratigraphy listed below at the time of drilling in October 2012. ; descriptions of the materials generally adhere to the ASTM D2488 naming conventions:
• 0 to 3 feet bgs: Poorly graded gravel with sand and silt (GP-GM), dense site fill consisting of imported angular rock, typically 1.5-inch minus
• 3 to 7 feet bgs: Silty sand with gravel (SM), medium dense, moist, angular gravel well invaded by primarily fine- and medium-grained sand and silt subgrade
• 7 to 45 feet bgs: Silty sand (SM) interbedded with silt with sand (ML) and poorly graded sand with silt (SP-SM), loose or soft to firm, wet, primarily fine-grained sand, low plasticity silt with water content near the liquid limit, traces of wood and organics
• 45 to 57 feet bgs: Poorly graded sand with silt (SP-SM), medium dense, wet, medium- to fine-grained sand, low to nonplastic silt, bedded with slight variation in silt and sand size and composition
• 57 bgs to hole bottom at 142 feet bgs: Poorly graded sand with silt (SP-SM), as above, but loose with predominantly fine-grained sand
• An additional 12 inches of crushed 1.5-inch-minus rock was placed over the test site after the test piles were installed but before the first static axial load test in early November 2012.
The upper 45 feet of soil, excluding the surface fill, appears to be the modern alluvial overbank deposits, while the materials below 45 feet appear to be earlier Holocene alluvial deposits. The Osceola mudflow deposit does not appear to be present at the boring location or is deeper than the 142-foot boring depth.
2 SEA130450001/ES020513062946SEA
GEOTECHNICAL REPORT FOR THE APE YARD HELICAL PILE TEST PROGRAM
4. Interpreted Geotechnical Soil Design Properties Visual observations of the material, laboratory gradation and plasticity, and SPT blow counts corrected for overburden pressure and hammer energy, (N1)60, or energy only, N60, as appropriate, were used with published correlations and local experience to develop the pile design parameters listed in Table 1. Although SPT hammer energy was not measured directly as part of this test, an energy transfer of 54 percent was measured within 2 months of the sampling date for this drill rig working at another site (GeoDesign, 2013). Some correlations are based on the (N1)60 value (e.g., friction angle) while others are based on the N60 value (e.g., the β value below). In the absence of load test data, the pile design parameters in Table 1 would have been developed from material type and density considerations. All layers are judged to be sufficiently granular or with fines of low enough plasticity to be considered as drained sand for pile design.
The pile design parameters are for use as follows:
Ultimate or Unfactored Pile Shaft Resistance: Rs = Sum(Askin * f)
where,
Askin = effective pile diameter * length f = β∗σ'v σ'v = effective overburden stress at midlength of segment (psf) β = 1.5 - 0.135(z)^0.5 for N60 >= 15 β = (N60/15)*(1.5 - 0.135(z)^0.5 ) for N60<15 N60 = SPT N-value corrected normalized to 60-percent hammer efficiency z = depth below ground, at soil layer mid-depth (feet)
Ultimate or Unfactored Pile Toe Resistance: Rt = Atoe * Nt * σ'v
where,
Atoe = effective end area of pile toe Nt = toe-bearing capacity coefficient σ'v = effective vertical overburden stress at toe.
5. Test Pile Program Six exploratory piles were installed with varying number of helixes and with and without grouting. Figure 2 shows the pile layouts. All piles were 7-inch outside diameter (OD), 0.453-inch wall, API 5CT P-110 tubular steel in 20-foot lengths with threaded 5.5-inch-long couplings. Helix sections were 0.75-inch-thick T-1 100 ksi plate with a single revolution at 5.25-inch pitch. Figure 3 shows the configuration. Where multiple helixes were used, spacing was 7.0 feet along pipe centerline. The piles were installed with APE HD70 rotary hydraulic driver-mounted on Caterpillar® 336E L Hydraulic Excavator. Drill rotation was single speed at 18 to 19 revolutions per minute (rpm).
Table 2 summarizes the pertinent details of pile configuration and depth. Part of the purpose of the test-pile program was to develop methods for grouting. Some methods were less successful than others and did not result in grout at the pile tip or a suitable pile depth to make testing valuable; therefore, only piles 1 and 5 were load-tested. Appendix B includes general observations from installing all piles. It is important to note that substantial amounts of grout came to the surface at all grouted piles. The ground around piles 2 and 4 heaved or bulged vertically up to 6 inches, tapering to match the preinstallation ground elevation at a radius of 5 to 8 feet during grouting. The bulging occurred too gradually to notice in Pile 2, but it clearly occurred when the pile toe was only 2 to 3 feet bgs at Pile 4. In addition, significant amounts of grout came to the surface, creating a wide zone of cemented soil and gravel within the upper several inches of the ground surface around the grouted piles.
Better grout control was maintained during installation of Pile 5, but it was still estimated that approximately 0.5 cubic yard of grout was pooled around the pile head at the completion of installation. The excess grout at the surface surrounding Pile 5 was removed while fluid. At the completion of testing, soil around pile 5 was excavated to a depth of about 10 feet. The upper 10 feet of Pile 5 was surrounded by a relatively uniform grout column approximately 16 inches in diameter. The soil outside the grout column was not cemented. SEA130450001/ES020513062946SEA 3

GEOTECHNICAL REPORT FOR THE APE YARD HELICAL PILE TEST PROGRAM
Grout cubes from the neat cement grout were tested in the laboratory. The 28-day unconfined compressive strength of the grout ranged from 7,000 to 9,500 pounds per square inch (psi). All load tests were conducted at least one month after pile installation, so the 28-day strength is considered appropriate.
4 SEA130450001/ES020513062946SEA

GEOTECHNICAL REPORT FOR THE APE YARD HELICAL PILE TEST PROGRAM
TABLE 1 Recommended Soil Design Parameters Geotechnical Report for the APE Yard Helical Pile Test Program
Soil Unit No.
Depth Range 1 (feet) Name
Unified Soil Classification Abbreviation
Average (N1)60
Total Unit
Weight, γ
(pcf)
Effective Unit
Weight, γ’
(pcf)
Effective Friction Angle,
φ’
(degrees)
Shallow Foundation
Bearing Capacity
Factor, Nq 2
Toe Bearing Capacity
Coefficient for Driven Piles, Nt 3
Bjerrum-Burland
Beta Coefficient,
β
Coefficient of Lateral Subgrade
Reaction, k (pci)
Recommended Soil Model
Type for LPILE
1 0 to 7 Site fill GP-GM and SM
25 130 130 39 to 34 55 to 30 170 to 85 0.60 to 0.35
225 to 70 Sand
2 7 to 45 Firm sandy silt
ML, SM, and SP-SM
8 105 43 34 to 29 30 to 15 85 to 50 0.40 to 0.35
48 to 12 Saturated sand
3 45 to 57 Denser sand
SP-SM 26 124 62 39 to 34 55 to 30 170 to 85 0.55 to 0.40
125 to 48 Saturated sand
4 57 to 142
Looser sand
SP-SM 15 122 60 36 to 31 40 to 20 115 to 65 0.45 to 0.30
76 to 21 Saturated sand
1 Depths reflect the subsurface conditions at the time of exploratory drilling and pile installation; 1 foot of crushed gravel was placed over the site between the date on which the boring was drilled and the dates of the load tests. 2 Values from Table 10.6.3.1.2a-1 of American Association of State Highway and Transportation Officials (2010). 3 Set as 3*Nq as recommended in the Canadian Foundation Engineering Manual (Canadian Geotechnical Society, 2006).
pcf pounds per cubic foot pci pounds per cubic inch
SEA130450001/ES020513062946SEA 5

GEOTECHNICAL REPORT FOR THE APE YARD HELICAL PILE TEST PROGRAM
TABLE 2 Summary of Pile Configurations Geotechnical Report for the APE Yard Helical Pile Test Program
Pile Number
Bottom Helix
Depth (2) (feet)
Number of Helixes Grouted? Comments
11 77 1 No
2 17 1 Yes Ran out of grout.
3 77 4 Partial Sanded grout. No grout taken below 38 feet.
4 57 1 Partial Neat cement grout. No grout taken below 50 feet.
51 50 1 Yes Neat cement grout, full length.
61 50 1 No Tested laterally only as a replacement for Pile 1 1 Used in load test program. 2 Depth below ground surface to middle of bottom helix; bottom of pile is 1-foot deeper.
5.1 Load Testing Procedures Three piles, Numbers 1, 6, and 5, were load-tested. Pile 1 was tested statically in axial compression on December 5, 2012. The ground around Pile 1 was disturbed by non-test-related activities before it could be tested laterally; a replacement ungrouted pile was installed 20 feet west of the Pile 5 location and tested laterally on May 18, 2013. Pile 5 was tested statically in axial compression on November 9 and 28, 2012, and laterally on November 30, 2012. Appendix C includes the details of the static testing procedures. Dynamic testing was initially performed on Pile 1 on December 8, 2012, using an APE D50-42 open-ended diesel hammer. Pile 5 was tested dynamically on February 8, 2013 with an APE D100-42 open-ended diesel hammer. The hammers have ram weights of 11 and 22 kips and were operated manually (i.e., the ram was lifted manually to the nominal drop height of 5 feet) for the tests. A report with the results of the dynamic testing, conducted by Miner Dynamic Testing of Bainbridge Island, Washington, is included as an appendix to this report.
Because this was the first time that APE had installed and tested high-capacity grouted piles, the testing was a learning experience and there were some test interruptions, including the following:
• Pulling out the reaction piles in the initial testing of the grouted pile, Number 5
• Failure of the hydraulic pump for the jack in the static axial compression test of the ungrouted pile, Number 1
• Inability to unload the jack incrementally on the test of pile Number 1
• Inability to fully mobilize toe bearing on the grouted pile without exceeding the operating range of the dynamic testing equipment during the first attempt at dynamic testing of pile Number 5. The dynamic testing equipment is designed for testing of commonly used piles made from grade 36 or 50 steel instead of grade 110 steel, hence, the strains generated during the dynamic testing exceeded the strains normally seen for lower grade steels, exceeding the range of the strain gages attached to the pile. A successful dynamic test of pile Number 5 was achieved by welding on a 7-inch OD x 1.0-inch thick extension in which the PDA sensors were placed.
5.2 Load Testing Results Figures 4 through 6 show deformation vs. load plots from the static load tests. The Davisson failure criteria have been plotted on the axial compression test results of Figures 4 and 5.
For the grouted pile, Figure 5 shows two different lines to bound the theoretical elastic shortening of the pile—one based on the assumption that the effective grouted pile diameter was 6 inches and one based on the
6 SEA130450001/ES020513062946SEA
GEOTECHNICAL REPORT FOR THE APE YARD HELICAL PILE TEST PROGRAM
assumption that the effective grouted pile diameter was 15 inches. Although the methods for measurement were crude and there was wastage in the grout lines and in the grout that came to the ground surface, the volume contained in a uniform 15-inch diameter cylinder around the length of the pile, approximately matches the volume of grout that was pumped to the pile and is in close agreement with the 16 inch diameter observed by excavating the upper 10 feet. While it does bound the problem, the assumption of a uniform column of grout surrounding the pile probably does not reflect reality because of the following:
• Much of the grout appears to have come to the ground surface
• Grout may be in bulbs corresponding to the locations of section joining during installation when pumping was greatest, so is unlikely to be continuous in diameter
• Grout would tend to be larger in diameter near the head of the pile where there is less confining pressure and there is a larger hole annulus due to misalignment and wobbling during installation
• Some grout may have been lost into the formation due to hydraulic fracturing.
The dynamic testing results are provided in Appendix D.
5.3 Comparison of Test Results with Predicted Pile Capacity 5.3.1 Axial Compression The measured capacities from the axial compression load tests on Piles 1 and 5 were compared with the capacity calculated by the simple equations for toe capacity and skin friction provided in the Interpreted Soil Design Parameters section of the Canadian Foundation Engineering Manual (Canadian Geotechnical Society, 2006). Figure 7 shows the calculated capacities based on varying assumptions for the skin resistance coefficient, β, and end bearing coefficient, Nt, compared with the measured capacity from the load test for Pile 1, the ungrouted pile. Figure 8 shows the same comparison for Pile 5, the grouted pile. The plots show calculated ultimate pile capacity for the low and high range of β values shown in Table 1 and for a range of Nt values for driven piles.
“Capacity” of the test piles in axial compression was defined by both the Davisson criteria and 1.0-inch of allowable settlement. For Pile 1, the capacities determined by the two different definitions are quite similar, especially compared with the capacity calculated from driven pile-capacity equations. For Pile 5, with the grouted tip and shaft, the definition of capacity has a much larger effect. Figure 8 shows the capacity as picked by two different assumptions about the effective diameter of grout outside with pile when calculating pile stiffness— one ignoring the presence of grout outside the pile (green line) and one based on the assumption that the grout pumped into the pile produces a uniform grout diameter over the entire length and it acts as an uncracked composite with the steel (orange line). The line shown which does not consider the grout annulus appears to give the most realistic pile stiffness based on Figure 8. Future tests which incorporate telltales or strain gages would help better define the true pile stiffness. Because of this uncertainty, a capacity based on the 1-inch allowable settlement performance criteria might be most appropriate.
The predicted percentage of total capacity attributed to shaft resistance for an ungrouted pile with a 7-inch diameter shaft and an effective toe diameter of 18 inches is approximately 20 percent. Determining skin friction from load vs. deformation plots is a crude approximation, but a portion of the curve for the ungrouted pile in Figure 4 lies on the left side of the elastic pile shortening line, suggesting that the apparent shaft resistance is roughly 30 kips, or approximately 18 percent of the total capacity. The shaft resistance interpreted from dynamic testing is 125 kips, or 74 percent of the total capacity.
For the grouted pile, the actual grout annulus is unknown, so the ratio of shaft resistance to end bearing cannot be accurately determined by calculation or interpretation of the static load vs. deflection plots. If the effective diameter was 7 inches, shaft resistance would comprise slightly less than 10 percent of the calculated capacity of a driven pile with 18-inch end diameter. If the grout annulus was 15 inches, shaft resistance would comprise about 15 to 17 percent of the calculated capacity of a driven pile with 18-inch end diameter.
SEA130450001/ES020513062946SEA 7

GEOTECHNICAL REPORT FOR THE APE YARD HELICAL PILE TEST PROGRAM
One crude estimate of the shaft resistance can be made by locating where the theoretical elastic compression curve of the pile is tangent to the field load-compression curve from a static load test. The assumption of negligible grout annulus outside the steel pile provides an apparent shaft resistance of about 330 kips (roughly 50 percent of the capacity) using this approximation, while the assumption of a 15-inch effective grout diameter would indicate that none of the capacity is due to shaft resistance. The shaft resistance interpreted from dynamic testing is about 360 kips, or 55 percent of the total and agrees fairly well with the assumption that there is no grout annulus around the pile which contributes to the pile stiffness. However, based on the static and dynamic tests on the grouted and ungrouted piles, the grout around the pile does contribute greatly to both the shaft resistance and the end bearing of a helical pile.
TABLE 3 Shaft and Toe Resistance Determined from Dynamic Testing and Interpretation of Static Testing Geotechnical Report for the APE Yard Helical Pile Test Program
Pile Number Installation
Predicted Capacity from
Driven Pile Equations Dynamic Test Interpretation
Static Load Test Interpretation
Pile Length (feet)
Shaft Resistance
(%)
Toe Resistance
(%)
Shaft Resistance
(%)
Toe Resistance
(%)
Shaft Resistance
(%)
Toe Resistance
(%)
1 Ungrouted, single helix
77 20 80 74 26 18 82
5 Grouted, single helix
48 16 84 55 45 52 48
5.3.2 Lateral Capacity Lateral load tests were performed on the ungrouted and grouted piles after the axial compression test. Rather than picking a capacity or “failure” criterion for the lateral load case, the measured pile head deformation with load has been plotted relative to the pile head deformation calculated with the inputs in Table 1 using the program LPILE (Ensoft, 2012); Figure 6 shows this comparison. Figure 6 shows that the measured load at 1 inch of pile head deformation, the common “failure” criterion, is about 3.3 times higher than the resistance calculated by LPILE for both the ungrouted pile and the grouted pile with a cracked section modulus. If an uncracked section modulus is assumed for the grouted pile, the measured load at 1 inch of pile head deformation is about 2.5 times higher than the resistance calculated using LPILE.
6. Conclusions Additional pile testing is required in order to draw conclusions and develop recommendations for applying driven or drilled pile design parameters to the design of grouted and ungrouted helical piles without load testing. Although tests on two piles are insufficient to develop design guidelines, we can conclude that a comparison of calculated vs. measured capacity for these particular piles indicated the following:
1. The measured ultimate axial compressive capacity of the ungrouted pile, Pile 1, approximately matches the calculated ultimate capacity of a driven pile if skin friction is ignored, the low range of Nt based on SPT N60-value and material type correlations is used, and the Nt value is divided by 3 (i.e., Nt is set equal to Nq for shallow foundations).
2. The measured ultimate axial compressive capacity of the grouted pile, Pile 5, approximately matches the calculated ultimate capacity of a driven pile if average values for skin friction and Nt in the lower third of the range based on SPT N60-value and material type correlations is used.
3. The measured ultimate compressive capacity of the grouted Pile 5 showed significant improvement in capacity both in skin friction and in end bearing.
8 SEA130450001/ES020513062946SEA

GEOTECHNICAL REPORT FOR THE APE YARD HELICAL PILE TEST PROGRAM
4. The lateral capacity of both the ungrouted and grouted piles was far greater than the calculated capacity using a model developed with LPILE.
The improvement in axial capacity with grouting is likely due to formation of a grout bulb near the toe of the pile as well as a grout skin on the pile itself and improvement of the soil near the pile with grout that was injected. This same mechanism would also cause an increase in lateral capacity.
7. Recommendations We understand that future testing to develop design guidelines for grouted and ungrouted, single and multi-helix piles, is planned. Future testing, in addition to providing a sufficient number of tests to show reproducible results and in a variety of soil conditions and depths, would benefit from minimizing the number of independent variables. In other words, if multiple pile configurations are to be tested, it would be helpful if all the piles were installed to the same depth. If multiple helixes are tested, pick an installation depth where all the helixes can be within a single uniform soil layer.
Consider installation of multiple telltales and/or strain gages welded into the bottom of each of the pile segments for ungrouted piles and attached to a reinforcing bar which can be pushed through the fluid grout to the bottom of the pile for grouted piles in order to be able to isolate toe from skin resistance and estimate the effective pile stiffness. Continue to develop a portable test frame and rapidly deployable thickened pile section suitable for commonly available sensors for dynamic testing. It might also be illustrative to carefully excavate around the reachable portions of grouted piles to observe the actual configuration of the grout bulb with depth, as was done for Pile 5 in this test.
Because lateral capacity of grouted piles is judged to be the significantly impacted by operator technique and local surface conditions, in-cab instrumentation capable of monitoring grout volume and pressure with depth would be beneficial, not only for quality control on the specific project, but for developing design guidance over a range of conditions.
8. References American Association of State Highway and Transportation Officials. 2010. LRFD Bridge Design Specifications. Fifth
Edition. Washington, D.C.
Canadian Geotechnical Society. 2006. Canadian Foundation Engineering Manual. Fourth Edition. The CGS Technical Committee on Foundations. BiTech Publishers, Vancouver.
Dragovich, J.D., P.T. Pringle, and T.J. Walsh. 1994. “Extent and Geometry of the Mid-Holocene Osceola Mudflow in the Puget Lowland – Implications for Holocene Sedimentation and Paleogeology.” Washington Geology 22 (3): September. pp. 3-26.
Ensoft, Inc. 2012. Pile Plus for Windows, Analysis of Individual Piles and Drilled Shafts Subjected to Lateral Loading Using the p-y Method. Version 2012-06. Austin, Texas.
GeoDesign. 2013. Report of SPT Hammer Energies. Prepared by GeoDesign of Portland, Oregon for Holocene Drilling, Inc. of Puyallup, Washington. January 29.
Sowers, G.F. 1979. Introductory Soil Mechanics and Foundations: Geotechnical Engineering. Fourth Edition. New Work: Macmillan. 621 p.
SEA130450001/ES020513062946SEA 9


Figures


GEOTECHNICAL REPORT FOR THE APE YARD HELICAL PILE TEST PROGRAM
FIGURE 1 Site Location Map
SEA130450001/ES020513062946SEA 13

GEOTECHNICAL REPORT FOR THE APE YARD HELICAL PILE TEST PROGRAM
FIGURE 2 Test Site Plan
14 SEA130450001/ES020513062946SEA

GEOTECHNICAL REPORT FOR THE APE YARD HELICAL PILE TEST PROGRAM
FIGURE 3 Test Pile Configuration
SEA130450001/ES020513062946SEA 15

GEOTECHNICAL REPORT FOR THE APE YARD HELICAL PILE TEST PROGRAM
FIGURE 4 Static Axial Compression Load Test Results: Pile 1, Single Helix, Ungrouted
16 SEA130450001/ES020513062946SEA

GEOTECHNICAL REPORT FOR THE APE YARD HELICAL PILE TEST PROGRAM
FIGURE 5 Static Axial Compression Load Test Results: Pile 5, Single Helix, Grouted
0
100
200
300
400
500
600
700
800
0 0.2 0.4 0.6 0.8 1 1.2 1.4 1.6 1.8
Load
(kip
s)
Pile Head Deflection (inches)
measured 11-9-12
theoretical if Dgrout=6-in
Davisson Criteria, Dgrout=6-in
measured 11-28-12
theoretical if Dgrout=15-iin
Davisson Criteria, Dgrout=15-in
shift in frame/jackduring creep portion of test
Theoretical pile head deflection based on elastic shortening of steel and grout for end bearing pile.
SEA130450001/ES020513062946SEA 17

GEOTECHNICAL REPORT FOR THE APE YARD HELICAL PILE TEST PROGRAM
FIGURE 6 Static Lateral Load Test Results and Calculated Lateral Deflection: Pile 5, Single Helix, Grouted
0
20
40
60
80
100
120
0 0.2 0.4 0.6 0.8 1 1.2 1.4 1.6 1.8
Late
ral L
oad
(kip
s)
Lateral Deflection (inches)
Grouted Pile 5 Measured
LPILE calculated - uncracked 15-in diameter grout/steel composite
LPILE calculated - cracked grouted section
Ungrouted Pile 6 Measured
LPILE calculated - no grout
18 SEA130450001/ES020513062946SEA

GEOTECHNICAL REPORT FOR THE APE YARD HELICAL PILE TEST PROGRAM
FIGURE 7 Comparison of Calculated and Measured Capacity in Axial Compression: Pile 1
SEA130450001/ES020513062946SEA 19

GEOTECHNICAL REPORT FOR THE APE YARD HELICAL PILE TEST PROGRAM
FIGURE 8 Comparison of Calculated and Measured Capacity in Axial Compression: Pile 5
20 SEA130450001/ES020513062946SEA

Appendix A Subsurface Data


APPENDIX A
Subsurface Data
A.1 Explanation of Boring Logs The section below contains a summary description of the Standard Penetration Test (SPT) method used during drilling, tables defining the descriptions of relative density of coarse-grained and fine-grained soils used in soil descriptions, and information noted on the borings logs, such as the soil classification method and possible abbreviations noted on the boring logs.
A.2 Standard Penetration Test The SPT is performed by driving a standard split-barrel sampler 18 inches into undisturbed soil at the bottom of the borehole using a 140-pound guided hammer or ram, falling freely from a height of 30 inches. This test is conducted to obtain a measure of the resistance of the soil to the sampler’s penetration and to retrieve a disturbed soil sample. The number of blows required to drive the sampler for three 6-inch intervals, for a total of 18 inches, is observed and recorded on the soil boring log. The sum of the number of blows required to drive the sampler the second and third 6-inch intervals is considered the Standard Penetration Resistance or the SPT blowcount, N. If the sampler is driven less than 18 inches, but more than 1 foot, then the SPT blowcount is that for the last 1 foot of penetration. If less than a foot is penetrated, then the number of blows and the fraction of 1 foot penetrated are recorded in the boring logs.
The values of N provide a means for evaluating the relative density of granular (coarse-grained) soils and the consistency of cohesive (fine-grained) soils. Low N-values indicate soft or loose deposits, while high N-values are evidence of hard or dense materials. The criteria used for describing the relative density of coarse-grained soil and the consistency of fine-grained soils based on N-value are presented in Tables A-1 and A-2, respectively. Field classification of the soil, based on these criteria, is incorporated in the boring logs presented at the end of this appendix.
TABLE A-1 Relative Density of Coarse-Grained Soil1 Geotechnical Report for the APE Yard Helical Pile Test Program
N (blows per foot) Relative Density Field Test
0 to 4 Very loose Easily penetrated with 0.5-inch steel rod
Pushed by hand
5 to 10 Loose Easily penetrated with 0.5-inch steel rod
Pushed by hand
11 to 30 Medium dense Easily penetrated with 0.5-inch steel rod
Driven with 5-pound hammer
31 to 50 Dense Penetrated 1 foot with 0.5-inch steel rod
Driven with 5-pound hammer
50 or more Very dense Penetrated only a few inches with 0.5-inch
Steel rod driven with 5-pound hammer 1Developed from Sowers (1979)
SEA130450001/ES020513062946SEA A-1

APPENDIX A SUBSURFACE DATA
TABLE A-2 Consistency of Fine-Grained Soil 1 Geotechnical Report for the APE Yard Helical Pile Test Program
N (blows per foot) Consistency Field Test
Fewer than 2 Very soft Easily penetrated several inches by fist
2 to 4 Soft Easily penetrated several inches by thumb
5 to 8 Firm Can be penetrated several inches by thumb with moderate effort
9 to 15 Stiff Readily indented by thumb, but penetrated only with great effort
16 to 30 Very stiff Readily indented by thumbnail
30 or more Hard Indented with difficulty by thumbnail 1Developed from Sowers (1979)
A.3 Test Boring Logs The boring logs are at the end of this appendix. The soil classifications on the exploration logs are per the American Society for Testing and Materials (ASTM) soil classification, based on the Unified Soil Classification System (USCS). The soil group symbols are marked with parentheses when the classification is based on visual classification alone. When soil classification symbols are separated by commas, then the classification has been confirmed with laboratory testing.
The lines on the boring logs do not define contacts between different soil classifications; the lines are used to separate the descriptions for legibility purposes only. The horizontal datum on the logs is Washington Coordinate System, North Zone North American Datum 1983/1991 (NAD83/91) and vertical datum is North American Vertical Datum 1988 (NAVD88).
Abbreviations listed on borings logs include the following:
bgs below ground surface
A-2 SEA130450001/ES020513062946SEA

0
5
10
SS-1
INT
ER
VA
L (
ft)
NU
MB
ER
AN
D
TY
PE
STANDARD
PENETRATION
TEST RESULTS
6"-6"-6"
26-11-8
(19)
DE
PT
H B
EL
OW
SU
RF
AC
E (
ft)
RE
CO
VE
RY
(in
)
5
6.5
9"
Begin drilling @ 9:00 amSurface Gravels (Fill) Approximately 6 ~ 12 inches.
SOIL DESCRIPTION COMMENTS
DEPTH OF CASING, DRILLING RATE,
DRILLING FLUID LOSS, TESTS, AND
INSTRUMENTATION
SOIL NAME, COLOR, MOISTURE CONTENT, RELATIVE DENSITY
OR CONSISTENCY, SOIL STRUCTURE, MINERALOGY
Truck-mounted Brainard Kilman BK 81, 140-lb auto-hammer with 30-inch drop, Open-Hole Mud Rotary drilling
Approx Elev 19 on 10/15/12 & 11/30/12
461291 5
APE Helical Pile Testing
START:
DRILLING METHOD AND EQUIPMENT:
END: 10/12/2012 S. ShinLOGGER:10/12/2012WATER LEVELS:
SHEET
PROJECT:
SOIL BORING LOG
Approx. 27 ft Holocene Drilling CompanyELEVATION: DRILLING CONTRACTOR:
APE @ Kent, WA (LAT 47.4276, LON -122.2453)
(unique well No. BHR 7 60)
BORING NUMBER: APE-B-1 PROJECT NUMBER:OF1
LOCATION:
10
3-4-5
DR: ~3' bumpy drilling (gravel)
SILTY SAND WITH GRAVEL (SM)
dark gray, medium dense, fine to coarse sand, fine
subrounded gravel, est.10~20% fines.
SILTY SAND (SM)
15
20
25
30
5-5-7
(12)
21.5
18"SS-4A
SS-4B
2-5-9
(14)
25
26.5
15" SS-6
20
11.5
13" SS-23-4-5
(9)
16.5
6" SS-33-2-1
(3)
15
(17' ~ 29')
POORLY GRADED SAND WITH SILT (SP-SM)
dark gray, medium dense, fine to medium sand, est.5~10%
fines.
SILTY SAND (SM or SP-SM)
dark gray, very loose, fine sand, est.5~15% fines.
SILTY SAND (SM)
dark gray, loose, fine sand, est.10~20% fines.
20'~21' SILT WITH SAND (ML)
gray brown, low plasticity. (SS-4B)
21'~22' SILTY SAND (SM)
dark gray, medium dense, fine sand, est 10~20% fines
(SS-4A)
Wood debris in cutting
30
35
40
PROJECT NUMBER: BORING NUMBER: SHEET
461291 APE-B-1 2 OF 5
SOIL BORING LOG
PROJECT: APE Helical Pile Testing LOCATION: APE @ Kent, WA (LAT 47.4276, LON -122.2453)
ELEVATION: Approx. 27 ft DRILLING CONTRACTOR: Holocene Drilling Company
DRILLING METHOD AND EQUIPMENT: Truck-mounted Brainard Kilman BK 81, 140-lb auto-hammer with 30-inch drop, Open-Hole Mud Rotary drilling
WATER LEVELS: Approx Elev 19 on 10/15/12 & 11/30/12 START: 10/12/2012 END: 10/12/2012 LOGGER: S. Shin
DE
PT
H B
EL
OW
SU
RF
AC
E (
ft)
INT
ER
VA
L (
ft)
RE
CO
VE
RY
(in
)
NU
MB
ER
AN
D
TY
PE
STANDARD
PENETRATION
TEST RESULTS
COMMENTS
SOIL NAME, COLOR, MOISTURE CONTENT, RELATIVE DENSITY
OR CONSISTENCY, SOIL STRUCTURE, MINERALOGY
DEPTH OF CASING, DRILLING RATE,
DRILLING FLUID LOSS, TESTS, AND
INSTRUMENTATION6"-6"-6"
POORLY GRADED SAND WITH SILT (SP-SM)
SOIL DESCRIPTION
36.5
7" SS-73-2-6
(8)
wood debris in shoe
wood debris in shoe
31.514" SS-6
14-12-11
(23)similar to above
POORLY GRADED SAND WITH SILT (ML)
similar to above
SILT WITH SAND (ML)
40
2-2-3
35
45
50
55
60
45
46.5
16" SS-915-23-25
(48)
POORLY GRADED SAND WITH SILT (SP-SM)
similar to above.
similar to above but coaser, fine to medium sand.
POORLY GRADED SAND WITH SILT (SP-SM)
dark gray, dense, fine sand, est.5~10% fines.
50
51.5
16" SS-1021-21-23
(44)
wood debris in shoeSILT WITH SAND (ML)
41.5
18" SS-82-2-3
(5)brown, low plasticity, trace of organic matter.
55
56.5
18" SS-1119-24-23
(47)
POORLY GRADED SAND WITH SILT (SP-SM)

60
65
70
PROJECT NUMBER: BORING NUMBER: SHEET
461291 APE-B-1 3 OF 5
SOIL BORING LOG
PROJECT: APE Helical Pile Testing LOCATION: APE @ Kent, WA (LAT 47.4276, LON -122.2453)
ELEVATION: Approx. 27 ft DRILLING CONTRACTOR: Holocene Drilling Company
DRILLING METHOD AND EQUIPMENT: Truck-mounted Brainard Kilman BK 81, 140-lb auto-hammer with 30-inch drop, Open-Hole Mud Rotary drilling
WATER LEVELS: Approx Elev 19 on 10/15/12 & 11/30/12 START: 10/12/2012 END: 10/12/2012 LOGGER: S. Shin
DE
PT
H B
EL
OW
SU
RF
AC
E (
ft)
INT
ER
VA
L (
ft)
RE
CO
VE
RY
(in
)
NU
MB
ER
AN
D
TY
PE
STANDARD
PENETRATION
TEST RESULTS
61.513" SS-12
23-19-14
(33)
POORLY GRADED SAND WITH SILT (SP-SM)
similar to above but finer, fine to medium sand.
POORLY GRADED SAND WITH SILT (SP-SM)
COMMENTS
SOIL NAME, COLOR, MOISTURE CONTENT, RELATIVE DENSITY
OR CONSISTENCY, SOIL STRUCTURE, MINERALOGY
DEPTH OF CASING, DRILLING RATE,
DRILLING FLUID LOSS, TESTS, AND
INSTRUMENTATION6"-6"-6"
SOIL DESCRIPTION
65
66.5
14" SS-1311-11-20
(31)similar to above.
70
14-13-11POORLY GRADED SAND WITH SILT (SP-SM)
75
80
85
90
75'~75.5' SILT WITH SAND (ML)
grayish brown, low plasticiy, est.5~10% sand (SS-15A)
71.5
14" SS-1414-13-11
(24)
POORLY GRADED SAND WITH SILT (SP-SM)
similar to above.
75
76.5
16"SS-15A
SS-15
14-15-21
(36)
75.5'~76.5' POORLY GRADED SAND WITH SILT (SP-SM)
dark gray, dense, fine to medium sand, est.5~10% fines.
85
86.5
13" SS-1710-12-14
(26)
POORLY GRADED SAND WITH SILT (SP-SM)
similar to above but medium dense
80
81.5
15" SS-1614-16-24
(40)
POORLY GRADED SAND WITH SILT (SP-SM)
dark gray, dense, fine to medium sand, est.5~10% fines.

90
95
100
PROJECT NUMBER: BORING NUMBER: SHEET
461291 APE-B-1 4 OF 5
SOIL BORING LOG
PROJECT: APE Helical Pile Testing LOCATION: APE @ Kent, WA (LAT 47.4276, LON -122.2453)
ELEVATION: Approx. 27 ft DRILLING CONTRACTOR: Holocene Drilling Company
DRILLING METHOD AND EQUIPMENT: Truck-mounted Brainard Kilman BK 81, 140-lb auto-hammer with 30-inch drop, Open-Hole Mud Rotary drilling
WATER LEVELS: Approx Elev 19 on 10/15/12 & 11/30/12 START: 10/12/2012 END: 10/12/2012 LOGGER: S. Shin
DE
PT
H B
EL
OW
SU
RF
AC
E (
ft)
INT
ER
VA
L (
ft)
RE
CO
VE
RY
(in
)
NU
MB
ER
AN
D
TY
PE
STANDARD
PENETRATION
TEST RESULTS
6"-6"-6"
91.516" SS-18
22-24-26
(50)
POORLY GRADED SAND WITH SILT (SP-SM)
95
96.5
15" SS-1911-11-18
(29)dark gray, medium dense, fine sand, est.5~10% fines.
COMMENTS
SOIL NAME, COLOR, MOISTURE CONTENT, RELATIVE DENSITY
OR CONSISTENCY, SOIL STRUCTURE, MINERALOGY
DEPTH OF CASING, DRILLING RATE,
DRILLING FLUID LOSS, TESTS, AND
INSTRUMENTATION
POORLY GRADED SAND WITH SILT (SP-SM)
dark gray, dense, fine to medium sand, est.5~10% fines.
SOIL DESCRIPTION
100
16-16-19POORLY GRADED SAND WITH SILT (SP-SM)
105
110
115
120
POORLY GRADED SAND WITH SILT (SP-SM)
dark gray, dense, fine sand, est.5~10% fines.
101.5
13" SS-2016-16-19
(35)
POORLY GRADED SAND WITH SILT (SP-SM)
dark gray, dense, fine to medium sand, est.5~10% fines.
105
106.5
15" SS-2110-18-19
(37)
POORLY GRADED SAND WITH SILT (SP-SM)
simlar to above.
110
111.5
14" SS-2210-11-14
(25)
POORLY GRADED SAND WITH SILT (SP-SM)
dark gray, medium dense, fine sand, est.5~10% fines.
115
116.5
9" SS-2313-15-13
(28)
120
125
130
PROJECT NUMBER: BORING NUMBER: SHEET
461291 APE-B-1 5 OF 5
SOIL BORING LOG
PROJECT: APE Helical Pile Testing LOCATION: APE @ Kent, WA (LAT 47.4276, LON -122.2453)
ELEVATION: Approx. 27 ft DRILLING CONTRACTOR: Holocene Drilling Company
DRILLING METHOD AND EQUIPMENT: Truck-mounted Brainard Kilman BK 81, 140-lb auto-hammer with 30-inch drop, Open-Hole Mud Rotary drilling
WATER LEVELS: Approx Elev 19 on 10/15/12 & 11/30/12 START: 10/12/2012 END: 10/12/2012 LOGGER: S. Shin
DE
PT
H B
EL
OW
SU
RF
AC
E (
ft)
INT
ER
VA
L (
ft)
RE
CO
VE
RY
(in
)
NU
MB
ER
AN
D
TY
PE
STANDARD
PENETRATION
TEST RESULTS
COMMENTS
SOIL NAME, COLOR, MOISTURE CONTENT, RELATIVE DENSITY
OR CONSISTENCY, SOIL STRUCTURE, MINERALOGY
DEPTH OF CASING, DRILLING RATE,
DRILLING FLUID LOSS, TESTS, AND
INSTRUMENTATION6"-6"-6"
121.515" SS-24
8-18-19
(37)
POORLY GRADED SAND WITH SILT (SP-SM)
SOIL DESCRIPTION
dark gray, dense, fine to medium sand, est.5~10% fines.
125
126.5
10" SS-259-15-19
(34)
130
10-13-15POORLY GRADED SAND WITH SILT (SP-SM)
POORLY GRADED SAND WITH SILT (SP-SM)
similar to above
135
140
1" PVC Schedule 40
0'~2' Monument
2'~4' Bentonite
4'~20' Sand
20'~30' Screen
131.5
10" SS-2610-13-15
(28)
135
136.5
8" SS-2711-13-13
(26)
140
141.5
0" SS-286-9-12
(21)
Well information
Well Tag No:
POORLY GRADED SAND WITH SILT (SP-SM)
similar to above
POORLY GRADED SAND WITH SILT (SP-SM)
similar to above
POORLY GRADED SAND WITH SILT (SP-SM)
dark gray, medium dense, fine to medium sand, est.5~10%
fines.
Bottom of Hole @ 141.5'


Appendix B Pile Installation Observations


SEA130450001/ES020513062946SEA B-1
Photo B-1. Pile 2 grout hole.
APPENDIX B
Pile Installation Observations
All piles were installed with American Piledriving Equipment, Inc. (APE) HD70 rotary driver mounted on Caterpillar
336E L Excavator. The drill motor was a Poclain MS125. All piles were 7-inch-outside-diameter (OD), 0.453-inch
wall, API 5CT P-110 steel tubing in 20-foot lengths with threaded 5.5-inch long couplings. Helix sections were 0.75-
inch-thick, T-1 100 ksi plate with a single revolution at 5.25-inch pitch. Where multiple helixes were used, spacing
is 7.0 feet along pipe centerline unless otherwise noted. Drill rotation is single speed at 18 to 19 revolutions per
minute (rpm).
B.� Pile No. �
• Installed October 15, 2012
• Single helix with open end
• No grout
• 80-foot pipe, bottom depth = 78 feet below ground surface (bgs)
• Measure-down inside pipe after installation = 76.3 feet below top of pipe (i.e., 3.7-foot soil plug)
• Installed in 1:20, including time to spot-weld each joint (to allow pipe removal) and with approximately a
15-minute delay to tighten hose.
B.� Pile No. �
• Installed October 15, 2012
• Single helix with closed end and 1.5-inch-diameter grout hole
located at bottom of leading edge of helical flight (see Photo B-1)
• Neat 5-sack grout
• 20-foot pipe, bottom depth 18 feet bgs
• Grout mixer and pump not calibrated
• General procedure:: Screwed pile 5 feet into ground, then mixed
grout and began pumping at approximately 1,000-pounds per
square inch (psi) pressure. Truck at 470 pounds with tip at 5-foot
depth. Truck at 560 pounds with tip at 18. All 5.5 cubic yards
(yd3) of grout pumped. Slight dome evident around pile. Unintended installation procedure.
B.� Pile No. �
• Installed October 26, 2012
• Four helixes in bottom 21 feet, 7 inches
• Sanded 7-sack mix
• 80-foot pipe, bottom depth =78 feet bgs
• Grout added for first 38 feet but questionable take thereafter
• General procedure: Pipe screwed 2 feet into ground. Hoses and pipe filled with grout until starting to emerge
at ground surface. Continue to screw pipe into ground, filling pipe with addition of each 20-foot section and
adding an additional stroke or two during drilling to verify that system was not plugged and pressurizing

APPENDIX B PIPE INSTALLATIONS OBSERVATIONS
system to at least 1,000 psi. Approximately five strokes = 1 cubic foot grout, which fills approximately 5 feet of pipe. Drilled from 18 feet to 38 feet with only 18 feet of grout head in pipe. After installing to 38 feet, backed out pipe to check grout. Filled third section with grout and began drilling, stroking in an additional ten strokes of grout with up to 3,000 psi between 38 feet and 48 feet, then drilling became very slow. No additional grout would leave hole, fourth segment drilled without additional grout (Photo B-2).
• Drilling times
2 to 18 feet: 3 minutes 18 to 28 feet: 6 minutes 38 to58 feet: 17 minutes (with high grout pressure) 58 to78 feet: 13 minutes (no or minimal grout pressure) Total duration including pickup, joining, grout filling was 1 hour, 50 minutes
B.4 Pile No. 4 • Installed October 26, 2012
• Single helix at base, closed end, 3-inch by 1-inch grout hole at bottom side of trailing end of pipe (Photo B-3).
• Sanded 7-sack mix
• Begin pumping grout with tip at 9 feet. At 11 strokes and 1,000 psi, ground visibly heaved approximately 3 to 6 inches maximum, affecting 10-foot-diameter area.
• Grout take and drilling penetration rate are variable. Slow drilling and no grout take, then drilling speed up and grout take of 20 strokes with no pressure. Pressurized up to 2,600 psi.
• At depth of 50 feet, very hard drilling. Had to reverse directions multiple times to penetrate. 50 feet to 58 feet in 17 minutes, but no grout take.
• Total duration was 1 hour, 17 minutes for 58 feet
B.5 Pile No. 5 • Installed November 11, 2012
• Single helix at base, closed end, two 1.5-inch diameter grout holes offset 180 degrees—one hole at bottom trailing edge. Each hole has 6-inch by 4-inch protective guard and 1-inch-long nozzle (Photo B-4).
• Neat cement grout with 0.48 w:c. Photo B-4. Pile 5 grout holes.
Photo B-3. Pile 4 grout hole.
Photo B-2. Picking bottom pile section, Pile 3.
B-2 SEA130450001/ES020513062946SEA

APPENDIX B PIPE INSTALLATIONS OBSERVATIONS
• Easy drilling from approximately 4 feet to 45 feet except for harder zone (wood?) at about 30 feet. Slow drilling 45 feet to 51 feet.
• Pumped enough grout to maintain pipe full and provide small flow to surface while drilling from surface to about 45 feet (maximum 500 psi pressure) (Photo B-5). Drilled to 45 feet to 51 feet with slow progress, only pumping grout (approximately 0.1 yd3) between depth of 49 feet and 51feet at pressures between 700 and 2,000 psi.
• Average drilling progress 4 feet to 45 feet (excluding slow zone at 30 feet and connection time) was 2.5 feet to 3.0 feet per minutes.
• Average joining time was approximately 5 minutes
• Total drilling time for 51 feet was 60 minutes
• Total grout volume was 3.0 yd3 (including approximately 0.5 yd3 in pipes and hoses and approximately 0.5 yd3 leakage through annulus to ground surface.)
TABLE B-1 Pressure/Torque Readings from Gage in Cab: Pile 5 (Provided by APE) Section Number
Depth Below Grade (feet)
Pressure Read from Gage (psi) Pressure Range
Delivered Torque (ft-lb)
1 0 to 18 2,350 Low 14,217
2 18 to 33 2,350 to 2,400 Low 14,217 to 14,544
2 33 to 38 2,700 High 32,724
3 38 to 51 3,200 to 3850 High 38,784 to 46,662
Note: At low pressure, Poclain MS125 drill motor delivers 6,060 ft-lb torque per 1,000 psi drive pressure. At high pressure, it delivers 12,120 ft-lb torque per 1,000 psi drive pressure. Direct drive hydraulic rotary piston motor; pressure readings on drive circuit converted to torque reported accurate to + 3%.
Photo B-5. Grout returned to ground surface at completion of Pile 5 installation.
SEA130450001/ES020513062946SEA B-3


Appendix C Static Load Testing Procedures and Data


APPENDIX C
Static Load Testing Procedures and Data For this preliminary round of testing, only pile head deflection was measured. The static load frame configuration is shown in Figure C-1 and was used for all axial load tests. A single beam of the load frame, placed on the ground surface and braced against four of the axial load frame piles, was used for the lateral load reaction. Jack calibration data are included at the end of this appendix. In all test cases, the reference beam(s) was supported on wood blocks located at least 6 feet away from the test pile or reaction piles and shielded from direct sunlight during daytime tests.
C.1 Pile 5: Single Helix Fully Grouted—Axial Compression This was initially tested on November 9, 2013. The reaction piles consisted of 20-foot-long, 7-inch-diameter pipe with a single 18-inch helix and no grout. Figure C-2 shows the initial frame with jack, reference beams, and dial gages. Initially, two reference beams and dial gauges were used. Loads were applied in 20-kip increments at 5-minute intervals. The test had to be terminated at a load of 255 kips because the pile holding the reaction frame had pulled out.
The reaction frame was reconstructed using 40-foot-long piles, each with three helixes spaced 3 feet apart, starting from 1 foot above the pile toe. On November 28, 2013, Pile 5 was reloaded, this time in 40-kip increments with each load held for 5 minutes. A single W18x98 supported on wood blocks at least 6 feet away from the test pile and reaction piles was used as a reference beam. The test was run slightly beyond what would be considered as the Davisson criteria for a grouted pile with 6-inch diameter in order to truly test the pile’s capacity. Just before the last load increment, there was a sudden shift in the frame and jack–attributed at the time to readjustment of the load frame, which had become somewhat warped. After the test was completed, it was noted that the pipe wall had begun to bulge just below the loading plate, which may have been the cause of the frame and jack shift.
C.2 Pile 5: Single Helix Fully Grouted—Lateral A lateral test was conducted on Pile 5 on November 30, 2012. Figure C-3 shows the lateral load frame set-up. After initial seating, loads were initially applied in 4-kip increments every 10 minutes. After 70 minutes, the hold time was decreased to 5 minutes.
C.3 Pile 1: Single Helix Ungrouted—Axial Compression Pile 1 was tested in axial compression on December 5, 2012. The reaction frame consisted of a 24-foot long W36X231 beam supported by two triple-helix piles on each end. The reaction piles were at least 6.5 feet away from the test pile and the end piles were spaced 2.5 and 3.0 feet apart. The reference beam was a single W18x97 supported on wood blocks. There were problems with the hydraulic pump that operated the loading jack which required restarting the test twice. The pump used to complete the test could not be backed off incrementally, so unloading data was not obtained. Loads were applied in 20-kip increments at 5-minute intervals.
SEA130450001/ES020513062946SEA C-1

APPENDIX C STATIC LOAD TESTING PROCEDURES AND DATA
FIGURE C-1 Axial Capacity Load Frame Configuration
C-2 SEA130450001/ES020513062946SEA

APPENDIX C STATIC LOAD TESTING PROCEDURES AND DATA
FIGURE C-2 Axial Capacity Load Frame Photo
SEA130450001/ES020513062946SEA C-3

APPENDIX C STATIC LOAD TESTING PROCEDURES AND DATA
FIGURE C-3 Lateral Load Frame Photo
C-4 SEA130450001/ES020513062946SEA

APE Helical Pile Testing Lateral Loading
Date: 11/30/2012
Test Pile No. 5
tip=51' bgs
7-inch OD w/ 18-inch single helix Jack = 200 ton capacity
Grouted full length Power Team WIKA Model R2006C 9699231
Logger K. Dawson Serial No. R95 #G100
Comments
1
Test Time Increment Increm Pressure Load Reading Deflection
Number (minute) (psi) (kips) (inches)
0 25 1 0 seating load
4:05 1 0 150 6 0.01
4:15 1 10 150 6 0.011
4:15 2 10 200 8 0.021
4:25 2 20 200 8 0.021
4:25 3 20 300 12 0.049
4:35 3 30 300 12 0.048
4:35 4 30 400 16 0.08
4:45 4 40 400 16 0.077
4:45 5 40 500 20 0.108
4:55 5 50 500 20 0.107
4:55 6 50 600 24 0.132
5:05 6 60 600 24 0.132
5:05 7 60 700 28 0.156
5:15 7 70 700 28 0.156
5:15 8 70 800 32 0.189
5:20 8 75 800 32 0.19 decreased loading duration time
5:20 9 75 900 36 0.225
5:25 9 80 900 36 0.225
5:25 10 80 1000 40 0.256
5:30 10 85 1000 40 0.258
5:30 11 85 1100 44 0.285
5:35 11 90 1100 44 0.287
5:35 12 90 1200 48 0.328
5:40 12 95 1200 48 0.331
5:40 13 95 1300 52 0.368
5:45 13 100 1300 52 0.372
5:45 14 100 1400 56 0.41
5:50 14 105 1400 56 0.415
5:50 15 105 1500 60 0.46
5:55 15 110 1500 60 0.466
5:55 16 110 1600 64 0.503
6:00 16 115 1600 64 0.51
6:00 17 115 1700 68 0.553
6:05 17 120 1700 68 0.561
6:05 18 120 1800 72 0.604
6:10 18 125 1800 72 0.615
6:10 19 125 1900 76 0.69
6:15 19 130 1900 76 0.704
6:15 20 130 2000 80 0.762
6:20 20 135 2000 80 0.8
6:20 21 135 2100 84 0.856
6:25 21 140 2100 84 0.923
6:25 22 140 2200 88 0.97
6:30 22 145 2200 88 0.986
6:30 23 145 2300 92 1.06
6:35 23 150 2300 92 1.18
6:35 24 150 2400 96 1.225
6:40 24 155 2400 96 1.34
6:40 25 155 2500 100 1.4
6:45 25 160 2500 100 1.468
6:45 26 160 2600 104 1.53 gap behind pile measured 18" deep (open hole around grout
6:50 26 170 2600 104 1.629 start unload
6:52 2350 94 1.635
6:55 1820 72.8 1.639
6:56 1820 72.8 1.642
6:57 1820 72.8 1.645
6:58 1500 60 1.618
7:00 1500 60 1.618 steady between beginning and end of minute interval
Jack
Dial Gauge

APE Helical Pile Testing Lateral Loading
Date: 11/30/2012
Test Pile No. 5
tip=51' bgs
7-inch OD w/ 18-inch single helix Jack = 200 ton capacity
Grouted full length Power Team WIKA Model R2006C 9699231
Logger K. Dawson Serial No. R95 #G100
Comments
1
Test Time Increment Increm Pressure Load Reading Deflection
Number (minute) (psi) (kips) (inches)
Jack
Dial Gauge
7:00 1250 50 1.602 steady between beginning and end of minute interval
7:01 1000 40 1.55 steady between beginning and end of minute interval
7:02 750 30 1.376 steady between beginning and end of minute interval
7:03 500 20 1.22 steady between beginning and end of minute interval
7:04 250 10 0.898 steady between beginning and end of minute interval
7:05 200 8 0.831 steady between beginning and end of minute interval
7:19 0 0 0.132 had to remove jack to get to 0 pressure
7:26 0 0 0.124 gap in front of pile ~ 12" deep

APE Helical Pile Testing Lateral Loading New pile installed at location 20' west of P5
Date: 5/18/2013
Test Pile No. 5 6
tip=51' bgs
7-inch OD w/ 18-inch single helix Jack = 200 ton capacity
No Grout Power Team / WIKA Model EDX 220 6
Logger P. Suver Serial No. 352962 Test cert Report #10146A Test Date 11-20-2012
Comments
1
Test Time Increment Increm Pressure Load Reading Deflection Material and depth - 7" OD .408 wall 29# per ft 54ft deep
Number (minute) (psi) (kips) (inches)
0 100 4 0 seating load
4:05 1 0 200 8 0.13
4:15 1 10 200 8 0.13
4:15 2 10 200 8 0.13
4:25 2 20 200 8 0.13 No creep
4:25 3 20 300 12 0.391
4:35 3 30 300 12 0.395
4:35 4 30 300 12 0.431 constant slow creep
4:45 4 40 400 16 0.599
4:45 5 40 400 16 0.601
4:55 5 50 400 16 0.622
4:55 6 50 400 16 0.622
5:05 6 60 400 16 0.632
5:05 7 60 500 16 0.685
5:15 7 70 500 16 0.695
5:15 8 70 500 16 0.71
5:20 8 75 500 16 0.72 Constant creep
5:20 9 75 600 24 0.799
5:25 9 80 600 24 0.81
5:25 10 80 600 24 0.815
5:30 10 85 600 24 0.834 constant creep
5:30 11 85 700 28 0.858
5:35 11 90 700 28 0.86
5:35 12 90 700 28 0.862
5:40 12 95 700 28 0.864
5:40 13 95 700 28 0.867 Creep much slower
5:45 13 100 800 32 0.921
Jack
Dial Gauge
5:45 14 100 800 32 0.93
5:50 14 105 800 32 0.936
5:50 15 105 800 32 0.94
5:55 15 110 800 32 0.94
5:55 16 110 800 32 0.94 Very slow creep
6:00 16 115 900 36 1.099
6:00 17 115 900 36 1.1
6:05 17 120 900 36 1.111
6:05 18 120 900 36 1.121
6:10 18 125 900 36 1.14 Very slow creep
6:10 19 125 1000 40 1.2
6:15 19 130 1000 40 1.22
6:15 20 130 1000 40 1.23
6:20 20 135 1000 40 1.24
6:20 21 135 1000 40 1.25
6:25 21 140 1000 40 1.26
6:25 22 140 1000 40 1.267 no creep at load
6:30 22 145 600 24 1.262
6:30 23 145 600 24 1.25
6:35 23 150 600 24 1.23
6:35 24 150 600 24 1.23 very small rebound?
6:40 24 155 300 12 1.11
6:40 25 155 300 12 1.1
6:45 25 160 300 12 1.075
6:45 26 160 300 12 1.072
6:50 26 170 300 12 1.071 Very small rebound
6:52 290 11.6 0.591
6:55 280 11.2 0.432 Rebound constant as un loading to zero
6:56 270 10.8 0.327
6:57 260 10.4 0.322
6:58 220 8.8 0.312
7:00 200 8 0.312 Rebound constant as un loading to zero

APE Helical Pile Testing Lateral Loading New pile installed at location 20' west of P5
Date: 5/18/2013
Test Pile No. 5 6
tip=51' bgs
7-inch OD w/ 18-inch single helix Jack = 200 ton capacity
No Grout Power Team / WIKA Model EDX 220 6
Logger P. Suver Serial No. 352962 Test cert Report #10146A Test Date 11-20-2012
Comments
1
Test Time Increment Increm Pressure Load Reading Deflection Material and depth - 7" OD .408 wall 29# per ft 54ft deep
Number (minute) (psi) (kips) (inches)
Jack
Dial Gauge
7:00 180 7.2 0.298
7:01 170 6.8 0.287
7:02 160 6.4 0.267
7:03 150 6 0.255 Rebound constant as un loading to zero
7:04 110 4.4 0.245
7:05 90 3.6 0.231
7:19 50 2 0.205
7:26 0 0 0.205 Rebound constant as un loading to zero

APE Helical Pile Load Test
Date 12/5/2012 Pile Length 80 feet D 7 inches
Test Pile No 1 Dr 12 inches
Description Single helix 77' BGS, no grout Davisson X 0.255 inches
Jack #13310A: Power Team R2006C RAM ID#R94, Wika Gauge ID# G100, from Jaxx LLC, Seattle, WA
Logger K. Dawson
Comments
1 Theoretical Davisson
Test Time Increment Increm Pressure Load Reading Deflection Reading Rotation
Calculated
Rotational
Downward
Deflection
Measured
Deflection
minus
Rotational
Deflection
Elastic Pile
Deflection
Combined
Rotational
and Elastic
Pile
Deflection Criteria (without rotation)
Number (minute) (psi) (kips) (inches) (+16th in) (degrees) (inchs) (inches) (inches) (inches) (inches) *flexible metal scale on outside of 7" diam pile
2:10 0 0 0 0 0 0 0 0 0.0000 0.0000 0.000 0.000 possitive rotation=clockwise looking down
2:15 1 5 250 20 0.048 0.048 0 0 0.0000 0.0480 0.071 0.071 0.327
2:20 2 10 500 40 0.132 0.132 0 0 0.0000 0.1320 0.142 0.142 0.398
2:25 2 15 500 40 0.13 0.13 0 0 0.0000 0.1300 0.142 0.142 0.398
2:25 3 15 750 60 0.24 0.24 1 0.511569 0.0075 0.2325 0.213 0.221 0.469
2:30 3 20 750 60 0.233 0.233 1 0.511569 0.0075 0.2255 0.213 0.221 0.469
2:30 4 20 1000 80 0.33 0.33 2 1.023139 0.0149 0.3151 0.284 0.299 0.540
2:35 4 30 1000 80 0.325 0.325 2 1.023139 0.0149 0.3101 0.284 0.299 0.540
2:35 5 30 1250 100 0.448 0.448 3 1.534708 0.0224 0.4256 0.356 0.378 0.611
2:40 5 40 1250 100 0.44 0.44 3 1.534708 0.0224 0.4176 0.356 0.378 0.611
2:40 6 40 1500 120 0.599 0.599 4 2.046278 0.0298 0.5692 0.427 0.457 0.682
2:45 6 50 1500 120 0.594 0.594 4 2.046278 0.0298 0.5642 0.427 0.457 0.682
2:45 7 50 1750 140 0.626 0.626 4 2.046278 0.0298 0.5962 0.498 0.528 0.753
2:50 7 60 1750 140 0.621 0.621 0 0.0000 0.6210 0.498 0.498 0.753 out of hydraulic oil; can't get next load
3:35 RL1 500 40 0.23 0.23 0 0 0.0000 0.2300 0.142 0.142 0.398 new hydraulic pump
3:40 RL2 800 64 0.328 0.328 0 0 0.0000 0.3280 0.228 0.228 0.483
3:55 RL3 1500 120 0.5 0.5 0 0 0.0000 0.5000 0.427 0.427 0.682
3:57 1400 112 0.49 0.49 0 0 0.0000 0.4900 0.398 0.398 0.654 pump failing
0 0 0.126 0.126 0 0 0.0000 0.1260 0.000 0.000 0.255 switch out to new hydraulic pump
950 76 0.341 0.341 0 0 0.0000 0.3410 0.270 0.270 0.526
950 76 0.248 0.341 0 0 0.0000 0.3410 0.270 0.270 0.526 no movement - rezeroed gauge which was tilting
4:30 1750 140 0.488 0.581 0 0 0.0000 0.5810 0.498 0.498 0.753
4:30 2000 160 0.641 0.734 0 0 0.0000 0.7340 0.569 0.569 0.824
4:35 2000 160 0.658 0.751 0 0 0.0000 0.7510 0.569 0.569 0.824
4:40 2250 180 0.962 1.055 0 0 0.0000 1.0550 0.640 0.640 0.895
4:45 2250 180 0.99 1.083 0 0 0.0000 1.0830 0.640 0.640 0.895
4:45 2500 200 1.226 1.319 0 0 0.0000 1.3190 0.711 0.711 0.967 out of stroke on jack
4:50 2350 188 1.239 1.332 0 0 0.0000 1.3320 0.668 0.668 0.924
500 40 0.438 -3 -1.53471 -0.0224 0.4604 0.142 0.120 0.398 hard measurement
Jack
Dial Gauge Rotation

APE Helical Pile Load Test
Date 11/9/2012 Pile Length 52 feet D 18 inches
Test Pile No 5 Dr 12 inches
Description Single helix 51' BGS, neat cement grout full length Davisson X 0.283 inches
Note: load frame pre-tensioned to 400 psi.
Jack #13310A: Power Team R2006C RAM ID#R94, Wika Gauge ID# G100, from Jaxx LLC, Seattle, WA
Logger K. Dawson/D. Dailer
Dgrout=
pileID
Dgrout=
$c$48
Dgrout=
pileID
Dgrout=
$c$48 Comments
1 2 Average Theoretical Theoretical Davisson Davisson
Test Time Increment Increm Pressure Load Reading Deflection Reading Deflection Deflection Deflection Deflection Criteria Criteria
Number (minute) (psi) (kips) 0.042 (inches) 0.2 (inches) (inches) (inches) (inches) (inches) (inches)
3:10 1 0 500 20 0.069 0.011 0.246 0.046 0.0285 0.030 0.010 0.313 0.292
3:15 2 0 1000 40 0.005 0.047 0.255 0.055 0.051 0.060 0.019 0.343 0.302
3:20 2 5 1000 40 0.004 0.046 0.046 0.060 0.019 0.343 0.302
3:20 3 0 1500 60 0.035 0.077 0.275 0.075 0.076 0.090 0.029 0.373 0.312
3:25 3 5 1500 60 0.032 0.074 0.074 0.090 0.029 0.373 0.312
3:25 4 0 2000 80 0.068 0.11 0.288 0.088 0.099 0.121 0.039 0.403 0.321
3:30 4 5 1900 75 0.062 0.104 0.104 0.113 0.036 0.396 0.319
3:30 5 0 2500 100 0.102 0.144 0.307 0.107 0.1255 0.151 0.048 0.433 0.331
3:35 5 5 2300 95 0.096 0.138 0.138 0.143 0.046 0.426 0.328
3:35 6 0 3000 120 0.134 0.176 0.325 0.125 0.1505 0.181 0.058 0.463 0.340
3:40 6 5 2800 115 0.13 0.172 0.172 0.173 0.055 0.456 0.338
3:40 7 0 3500 140 0.16 0.202 0.347 0.147 0.1745 0.211 0.067 0.494 0.350
3:45 7 5 3300 130 0.155 0.197 0.197 0.196 0.063 0.479 0.345
3:45 8 0 4000 160 0.181 0.223 0.371 0.171 0.197 0.241 0.077 0.524 0.360
3:50 8 5 3600 145 0.175 0.217 0.362 0.162 0.1895 0.218 0.070 0.501 0.353
3:50 9 0 4500 180 0.201 0.243 0.392 0.192 0.2175 0.271 0.087 0.554 0.369
3:55 9 5 4000 160 0.192 0.234 0.372 0.172 0.203 0.241 0.077 0.524 0.360
3:55 10 0 5000 200 0.221 0.263 0.413 0.213 0.238 0.301 0.096 0.584 0.379
4:00 10 5 4500 180 0.212 0.254 0.403 0.203 0.2285 0.271 0.087 0.554 0.369
4:00 11 0 5500 220 0.243 0.285 0.437 0.237 0.261 0.331 0.106 0.614 0.389
4:05 11 5 5000 200 0.233 0.275 0.425 0.225 0.25 0.301 0.096 0.584 0.379
4:05 12 0 6000 240 0.265 0.307 0.454 0.254 0.2805 0.362 0.116 0.644 0.398
4:10 12 5 5500 220 0.255 0.297 0.442 0.242 0.2695 0.331 0.106 0.614 0.389
4:10 13 0 6300 255 0.27 0.312 0.458 0.258 0.285 0.384 0.123 0.667 0.406 test ended - max throw of jack at 6"
4:15 13 5 5500 220 0.452 0.252 0.252 0.331 0.106 0.614 0.389
720 1.0848526 0.347 1.367519 0.630
Jack
Dial Gauge

APE Helical Pile Load Test
Date 11/28/2012 Pile Length 52 feet
Test Pile No 5 2nd try (first on 11/9/12)
Description Single helix 51' BGS, neat cement grout full length
Note: continuation of load testing begun on 11-9-12 and halted after reaction frame deformed excessively
Jack #13310A and B in parallel: Power Team R2006C RAM ID#R94, Wika Gauge ID# G100, from Jaxx LLC, Seattle, WA
Logger K. Dawson Dial gages rotating backward
Average
Test Time Increment Increm Pressure Load Reading Deflection Reading Deflection Deflection Comments
Start Time2:42 Number (minute) (psi) (kips) 1.1 (inches) 1.1 (inches) (inches)
2:42
2:47 1 5 500 40 1.052 0.048 1.054 0.046 0.047
2:52 2 10 1000 80 1.017 0.083 1.018 0.082 0.0825
2:57 3 15 1500 120 0.982 0.118 0.981 0.119 0.1185
3:02 4 20 2000 160 0.944 0.156 0.941 0.159 0.1575
3:07 5 25 2500 200 0.9 0.2 0.895 0.205 0.2025
3:12 6 30 3000 240 0.862 0.238 0.854 0.246 0.242
3:17 7 35 3250 260 0.829 0.271 0.818 0.282 0.2765
3:22 8 40 3500 280 0.797 0.303 0.785 0.315 0.309
3:27 9 45 3750 300 0.77 0.33 0.755 0.345 0.3375
3:32 10 50 4000 320 0.745 0.355 0.728 0.372 0.3635
3:37 11 55 4250 340 0.708 0.392 0.69 0.41 0.401
3:42 12 60 4500 360 0.681 0.419 0.663 0.437 0.428
3:47 13 65 4750 380 0.65 0.45 0.63 0.47 0.46
3:52 14 70 5000 400 0.623 0.477 0.601 0.499 0.488
3:57 15 75 5250 420 0.58 0.52 0.56 0.54 0.53
4:02 16 80 5500 440 0.549 0.551 0.528 0.572 0.5615
4:07 17 85 5750 460 0.502 0.598 0.482 0.618 0.608
4:12 18 90 6000 480 0.469 0.631 0.446 0.654 0.6425
4:17 19 95 6250 500 0.429 0.671 0.408 0.692 0.6815
4:22 20 100 6500 520 0.382 0.718 0.362 0.738 0.728
4:27 21 105 6750 540 0.331 0.769 0.315 0.785 0.777
4:32 22 110 7000 560 0.308 0.792 0.287 0.813 0.8025
4:37 23 115 7250 580 0.257 0.843 max out at 0.250 0.843
4:42 24 120 7500 600 0.21 0.89 0.89
4:47 25 125 7750 620 0.158 0.942 0.942
4:52 26 130 8000 640 0.065 1.035 1.035
4:57 27 135 8250 660 0.994 1.106 1.106
deflection equation
reset
5:02 28 140 8500 680 0.915 1.185 1.185
5:28 29 166 8750 700 0.752 1.348 1.348
5:39 30 177 9000 720 0.584 1.516 1.516
5:40 7800 625 0.534 1.566 1.566
frame shifted -
reading unclear
5:42 180 9000 720 0.494 1.606 1.606
5:43 9000 720 0.592 1.508 1.508 unload begin
5:44 5250 420 0.535 1.565 1.565
5:45 4000 320 0.562 1.538 1.538
5:46 3000 240 0.601 1.499 1.499
5:47 2000 160 0.66 1.44 1.44
5:48 1000 80 0.73 1.37 1.37
major shift-weld
between pile head
and plates broke.
Jacks shifted
Dial Gauge
Jack 1 2


Appendix D Dynamic Load Testing Report


APPENDIX D
Dynamic Load Testing Report
SEA130450001/ES020513062946SEA D-1


Robert Miner Dynamic Testing, Inc.Dynamic Measurements and Analyses for Deep Foundations
May 20, 2013Mr. Daniel CollinsAmerican Piledriving Equipment, Inc.7023 South 196th
Kent, WA 98032-2185
Re: Dynamic Pile Measurements and CAPWAP AnalysesPile 1, Ungrouted 7.0" OD Helical, December 8, 2012Pile 5, Grouted 7.0" OD Helical Pile, February, 20, 2013APE Yard, Kent, WA RMDT Job No. 12F60
Dear Sir,
This report presents results obtained from dynamic pile measurements and CAPWAP analysescompleted by Robert Miner Dynamic Testing, Inc. (RMDT) for the project referenced above. The objective of the testing and analysis was evaluation of the soil resistance to pile penetrationduring restrike. PROJECT AND TESTING DETAILS
PilesRestrike tests were completed on two 7.0" OD helical piles installed on the premises ofAmerican Pile Driving, Inc. (APE) in Kent WA. Pile 1 was an ungrouted pile installedapproximately 77 ft below the adjacent soil. Pile 5 was a grouted pile installed approximately47.5 ft below the soil line at the time of the test. We understand that both piles had a wallthickness of 0.453", and the bottom of the helix was located approximately 1 ft above pile tipin each case. For the test of Pile 5 on February 8, 2013 a 6 ft long heavy-wall pile extension(7"OD x 1.0" wall) was in place and our PDA sensors were located at the center of thisextension. For details on each helix or the pile installation please refer to documents preparedby other project participants.
HammersAn APE D50–42 and an APE D100-42 open end diesel hammer were used to test Piles P1 andP5, respectively. For the hammer blows used on our analyses these hammers were operatedmanually using a standard or reduced tripping stroke of approximately 5 to 7 ft. The D50-42and D100-42 have rams weighing approximately 11 and 22 kips, respectively. Instrumentation
Dynamic measurements were made with two strain sensors and two accelerometers bolted tothe surface of the pile near the pile top. Signals from the sensors were processed and stored by a Pile Driving Analyzer® (PDA). For each hammer blow the PDA displayed themeasurements as plots of force and velocity, and computed a variety of results. RMDT’s
Mailing Address: P.O. Box 340, Manchester, WA, 98353, USA Phone: 360-871-5480Location: 2288 Colchester Dr. E., Ste A, Manchester, WA, 98353 Fax: 360-871-5483

APE, Helical Piles P1 & P5 May 20, 2013Page 2
engineer reviewed the measurements and the computed results during and after driving. Appendix A contains general information on our methods for measurement and analysis.
Test Sequence
On December 8, 2012 Piles P1 and P5 were tested during brief restrike tests. Pile P5 was alsotested on February 20, 2013. Analyses given here for Pile P5 are based on the test of February20 because the heavy wall upper pile section was necessary for effective dynamicmeasurements.
PRESENTATION AND DISCUSSION OF RESULTS
Following the field testing RMDT completed CAPWAP® analysis of the soil’s resistance todownward pile movement as the pile was struck by the respective impact hammers. CAPWAPanalysis is an iterative signal matching method which is based on use of the measured forceand velocity as recorded by the Pile Driving Analyzer. Appendix B contains results of the twoCAPWAP analyses and Table 1 summarizes the results.
Table 1. Summary of CAPWAP Results.
Pile Test ApproximateDepth Below
Grade(ft)
Computed Ultimate SoilResistance, kips
Total Shaft Toe
Pile 1 Restrike, 12/8/12 77 170 125 45
Pile 5 Restrike, 2/20/13 48 660 360 300
The resistance values computed with CAPWAP and given in Table 1 are estimates of the ultimate soil resistance for downward axial pile loading.
Pile 1 was twice struck with the D50-42 ram falling from the tripping stroke of approximately 5.5ft, and then once with lowest available fuel setting. These three hammer blows apparentlycaused no net pile advancement. Our CAPWAP analysis yielded an ultimate axial soilresistance of 170 kips, with 125 kips of friction and 25 kips of end bearing. The computed unitfriction resistance (kips per lineal ft) increased gradually with depth and was primarily locatedon the lower 25 ft of the pile.
Pile 5 was struck using only the tripping stroke of the APE D100-42 hammer. Our CAPWAPanalysis yielded an axial resistance of 660 kips derived from 360 kips of friction and 300 kipsof end bearing. The computed shaft friction was primarily located in the lowest 15 ft of the pile.For Pile 5 the grout surrounding the steel section caused a change in the axial pile stiffness andpile impedance. Uncertainty in the dimensions of the grout column caused some uncertaintyin the CAPWAP impedance and soil resistance model. Such uncertainty was expected to havelittle effect on the computed ultimate resistance, but likely did cause a modest increase in the
Robert Miner Dynamic Testing, Inc.

APE, Helical Piles P1 & P5 May 20, 2013Page 3
uncertainty associated with the CAPWAP distribution of shaft friction and the relative balanceof friction and end bearing.
Please to not hesitate to contact us if you have questions regarding this transmittal or the workwe completed for this project.
Sincerely,
Robert Miner, P.E.
Robert Miner Dynamic Testing, Inc. May 20, 2013
3
Robert Miner Dynamic Testing, Inc.


A-1© 1999, Goble Rausche Likins and Associates, Inc.
APPENDIX AAN INTRODUCTION INTO DYNAMIC PILE TESTING METHODS
The following has been written by Goble Rausche Likins and Associates, Inc. and may only be copied with its written permission.
BACKGROUND
Modern procedures of design and construction controlrequire verification of bearing capacity and integrity ofdeep foundations during preconstruction testprograms and also production installation. Dynamicpile testing methods meet this need economically andreliably, and therefore, form an important part of aquality assurance program when deep foundationsare executed. Several dynamic pile testing methodsexist; they have different benefits and limitations anddifferent requirements for proper execution.
The Case Method of dynamic pile testing, namedafter the Case Institute of Technology where it wasdeveloped between 1964 and 1975, requires that asubstantial ram mass (such as that of a pile drivinghammer) impacts the pile top such that the pileundergoes at least a small permanent set. Themethod is therefore also referred to as a “High StrainMethod”. The Case Method requires dynamicmeasurements on the pile or shaft under the ramimpact and then an evaluation of various quantitiesbased on closed form solutions of the wave equation,a partial differential equation describing the motionof a rod under the effect of an impact. Conveniently,measurements and analyses are done by a singlepiece of equipment: the Pile Driving Analyzer® (PDA).However, for bearing capacity evaluations animportant additional method is CAPWAP® whichperforms a much more rigorous analysis of thedynamic records than the simpler Case Method.
A related analysis method is the “Wave EquationAnalysis” which calculates a relationship betweenbearing capacity and pile stress and field blow count.The GRLWEAP™ program performs this analysisand provides a complete set of helpful informationand input data.
The following description deals primarily with theCase Method or “High Strain Test” Method of piletesting, however, for the sake of completeness, the“Low Strain Test” performed with the Pile IntegrityTest™ (PIT), mainly for pile integrity evaluation, willalso be described.
RESULTS FROM DYNAMIC TESTING
There are two main objectives of high strain dynamicpile testing:
• Dynamic Pile Monitoring and• Dynamic Load Testing.
Dynamic pile monitoring is conducted during theinstallation of impact driven piles to achieve a safeand economical pile installation. Dynamic loadtesting, on the other hand, has as its primary goalthe assessment of pile bearing capacity. It isapplicable to both cast insitu piles or drilled shaftsand impact driven piles during restrike.
Dynamic Pile Monitoring
During pile installation, the sensors attached to thepile measure pile top force and velocity. A PDAconditions and processes these signals andcalculates or evaluates:
• Bearing capacity at the time of testing, including anassessment of shaft resistance development anddriving resistance. This information supportsformulation of a driving criterion.
• Dynamic pile stresses, axial and averaged over thepile cross section, both tensile and compressive,during pile driving to limit the potential of damageeither near the pile top or along its length. Bendingstresses can be evaluated at the point of sensorattachment.
• Pile integrity assessment by the PDA is based onthe recognition of certain wave reflections fromalong the pile. If detected early enough, a pile maybe saved from complete destruction. On the otherhand, once damage is recognized measures canbe taken to prevent reoccurrence.
• Hammer performance parameters including theenergy transferred to the pile, the hammer speedin blows per minute and the stroke of open endeddiesel hammers.

A-2
Dynamic Pile Load Testing
Bearing capacity testing of either driven piles ordrilled shafts applies the same basic measurementapproach of dynamic pile monitoring. However, thetest is done independent of the pile installationprocess and therefore a pile driving hammer or otherdynamic loading device may not be available. If aspecial ram has to be mobilized then its weight shouldbe between 0.8 and 2% of the test load (e.g. between4 and 10 tons for a 500 ton test load) to assuresufficient soil resistance activation.
For a successful test, it most important that the test isconducted after a sufficient waiting time following pileinstallation for soil properties approaching their longterm condition or concrete to properly set. Duringtesting, PDA results of pile/shaft stresses andtransferred energy are used to maintain safe stressesand assure sufficient resistance activation. For safeand sufficient testing of drilled shafts, ram energiesare often increased from blow to blow until the testcapacity has been activated. On the other hand,restrike tests on driven piles may require a warmhammer so that the very first blow produces acomplete resistance activation. Data must beevaluated by CAPWAP for bearing capacity.
After the dynamic load test has been conducted withsufficient energy and safe stresses, the CAPWAPanalysis provides the following results:
• Bearing capacity i.e. the mobilized capacity presentat the time of testing
• Resistance distribution including shaft resistanceand end bearing components
• Stresses in pile or shaft calculated for both thestatic load application and the dynamic test. Thesestresses are averages over the cross section anddo not include bending effects or nonuniformcontact stresses, e.g. when the pile toe is onuneven rock.
• Shaft impedance vs depth; this is an estimate of theshaft shape if it differs substantially from theplanned profile
• Dynamic soil parameters for shaft and toe, i.e.damping factors and quakes (related to the dynamic
stiffness of the resistance at the pile/soilinterface.)
MEASUREMENTS
PDA
The basis for the results calculated by the PDA arepile top strain and acceleration measurements whichare converted to force and velocity records,respectively. The PDA conditions, calibrates anddisplays these signals and immediately computesaverage pile force and velocity thereby eliminatingbending effects. Using closed form Case Methodsolutions, based on the one-dimensional linear waveequation, the PDA calculates the results describedin the analytical solutions section below.
HPA
The ram velocity may be directly obtained usingradar technology in the Hammer PerformanceAnalyzer™. For this unit to be applicable, the rammust be visible. The impact velocity results can beautomatically processed with a PC or recorded on astrip chart.
Saximeter™
For open end diesel hammers, the time between twoimpacts indicates the magnitude of the ram fallheight or stroke. This information is not onlymeasured and calculated by the PDA but also by theconvenient, hand-held Saximeter.
PIT
The Pile Integrity Tester™ (PIT) can be used toevaluate defects in concrete piles or shafts whichmay have occurred during driving or casting. Alsotimber piles of limited length can be tested in thatmanner. This so-called "Low Strain Method" or“Pulse-Echo Method” of integrity testing requires onlythe measurement of acceleration at the pile top. Thestress wave producing impact is then generated bya small hand-held hammer and the recordsinterpreted in the time domain. PIT also supportsthe so-called “Transient Response Method” whichrequires the additional measurement of the hammerforce and an analysis in the frequency domain. Thismethod may also be used to evaluate the unknownlength of deep foundations under existing structures.

A-3
ANALYTICAL SOLUTIONSBEARING CAPACITY
Wave Equation
GRL has written the GRLWEAP™ program whichcalculates a relationship between bearing capacity,pile stress and blow count. This relationship is oftencalled the “bearing graph.” Once the blow count isknown from pile installation logs, the bearing graphyields the bearing capacity. This approach requiresno measurements and therefore can be performedduring the design stage of a project, for example forthe selection of hammer, cushion and pile size.
After dynamic pile monitoring and/or dynamic loadtesting has been performed, the “Refined WaveEquation Analysis” or RWEA (see schematic below)is often performed by inputting the PDA andCAPWAP calculated parameters. Then the bearinggraph from the RWEA is the basis for a safe andsufficient driving criteria.
Case Method
The Case Method is a closed form solution based ona few simplifying assumptions such as ideal plasticsoil behavior and an ideally elastic and uniform pile.Given the measured pile top force F(t) and pile topvelocity v(t), the total soil resistance is
2 2R(t) = ½{[F(t) + F(t )] + Z[v(t) - v(t )]} (1)
where
t = a point in time after impact
2t = time t + 2L/cL = pile length below gagesc = (E/D) is the speed of the stress wave½
D = pile mass densityZ = EA/c is the pile impedanceE = elastic modulus of the pile (D c )2
A = pile cross sectional area
dThe total soil resistance consists of a dynamic (R )
sand a static (R ) component. The static componentis therefore
s dR (t) = R(t) - R (t) (2)
The dynamic component may be computed from a
tsoil damping factor, J, and a pile toe velocity, v (t)which is conveniently calculated for the pile toe.Using wave considerations, this approach leadsimmediately to the dynamic resistance
dR (t) = J[F(t) + Zv(t) - R(t)] (3)
and finally to the static resistance by means ofEquation 2.
There are a number of ways in which Eq. 1 through
23 can be evaluated. Most commonly, t is set to thattime at which the static resistance becomes
maximum. The result is the so-called RMX capacity.Damping factors for RMX typically range between0.5 for coarse grained materials to 1.0 for clays. The
RSP capacity (this method is most commonlyreferred to in the literature, yet it is not veryfrequently used) requires damping factors between
0.1 for sand and 1.0 for clay. Another capacity, RA2,determines the capacity at a time when the pile isessentially at rest and thus damping is small; RA2

A-4
therefore requires no damping parameter. In anyevent, the proper Case Method and its associateddamping parameter is most conveniently found aftera CAPWAP analysis has been performed.
The static resistance calculated by Case Method orCAPWAP is the mobilized resistance at the time oftesting. Consideration therefore has to be given to soilsetup or relaxation effects and whether or not asufficient set has been achieved under the testloading that would correspond to a full activation ofthe ultimate soil resistance.
The PDA also calculates an estimate of shaftresistance as the difference between force andvelocity times impedance at the time immediatelyprior to the return of the stress wave from the pile toe.This shaft resistance is not reduced by dampingeffects and is therefore called the total shaft
resistance SFT. A correction for damping effects
produces the static shaft resistance estimate, SFR.
The Case Method solution is simple enough to beevaluated "in real time," i.e. between hammer blows,using the PDA. It is therefore possible to calculate allrelevant results for all hammer blows and plot theseresults as a function of depth or blow number. This isdone in the PDAPLOT program.
CAPWAP The CAse Pile Wave Analysis Program combines thewave equation pile and soil model with the CaseMethod measurements. Thus, the solution includesnot only the total and static bearing capacity valuesbut also the shaft resistance, end bearing, dampingfactors and soil stiffnesses. The method iterativelycalculates a number of unknowns by signal matching.While it is necessary to make hammer performanceassumptions for a GRLWEAP analysis, the CAPWAPprogram works with the pile top measurements.Furthermore, while GRLWEAP and Case Methodrequire certain assumptions regarding the soilbehavior, CAPWAP calculates these soil parameters.
STRESSES
During pile monitoring, it is important thatcompressive stress maxima at pile top and toe andtensile stress maxima somewhere along the pile becalculated for each hammer blow.
At the pile top (location of sensors) both the
maximum compression stress, CSX, and themaximum stress from individual strain transducers,
CSI, are directly obtained from the measurements.Note that CSI is greater than or equal to CSX andthe difference between CSI and CSX is a measureof bending in the plane of the strain transducers.Note also that all stresses calculated for locationsbelow the sensors are averaged over the pile crosssection and therefore do not include componentsfrom either bending or eccentric soil resistanceeffects.
The PDA calculates the compressive stress at the
pile bottom, CSB, assuming (a) a uniform pile and(b) that the pile toe force is the maximum value ofthe total resistance R(t) minus the total shaftresistance, SFT. Again, for this stress estimationuniform resistance force are assumed (e.g. not asloping rock.)
For concrete piles, the maximum tension stress,
TSX, is also of great importance. It occurs at somepoint below the pile top. The maximum tensionstress can be computed from the pile topmeasurements by finding the maximum tension
Uwave (either traveling upward, W , or downward,
dW ) and reducing it by the minimum compressivewave traveling in opposite direction.
uW = ½[F(t) - Zv(t)] (4)
dW = ½[F(t) + Zv(t)] (5)
CAPWAP also calculates tensile and compressivestresses along the pile and, in general, moreaccurately than the PDA. In fact, for non-uniformpiles or piles with joints, cracks or otherdiscontinuities, the closed form solutions from thePDA may be in error.
PILE INTEGRITY
High Strain Tests (PDA)
Stress waves in a pile are reflected wherever the pileimpedance, Z = EA/c = DcA = A o(E D), changes.Therefore, the pile impedance is a measure of thequality of the pile material (E, D, c) and the size of itscross section (A). The reflected waves arrive at thepile top at a time which is greater the farther awayfrom the pile top the reflection occurs. The

A-5
magnitude of the change of the upward travelingwave (calculated from the measured force andvelocity, Eq. 4) indicates the extent of the cross
isectional change. Thus, with $ (BTA) being a relativeintegrity factor which is unity for no impedancechange and zero for the pile end, the following iscalculated by the PDA.
i i i$ = (1 - " )/(1 + " ) (6)
with
i UR UD Di UR" = ½(W - W )/(W - W ) (7)
where
UR is the upward traveling wave at the onset ofWthe reflected wave. It is caused by resistance.
UD is the upwards traveling wave due to theWdamage reflection.
DiW is the maximum downward traveling wave dueto impact.
It can be shown that this formulation is quite accurateas long as individual reflections from different pileimpedance changes have no overlapping effects onthe stress wave reflections.
Without rigorous derivation, it has been proposed toconsider as slight damage when $ is above 0.8 and aserious damage when $ is less than 0.6.
Low Strain Tests (PIT)
The pile top is struck with a held hand hammer andthe resulting pile top velocity is measured, displayedand interpreted for signs of wave reflections. Ingeneral, a comparison of the reflected accelerationleads to a relative measure of extent of damage,again the location of the problem is indicated by thearrival time of the reflection. PIT records can also beinterpreted by the $-Method. However, low straintests do not activate much resistance which simplifies
UREq. 7 since W is then equal to zero.
For drilled shafts and PIT records that clearly show atoe reflection, an approximate shaft profile can becalculated from low strain records using the PITSTOPprogram’s PROFILE routine.
HAMMER PERFORMANCE
The PDA calculates the energy transferred to thepile top from:
oE(t) = I F(t)v(t) dt (8a)t
The maximum of the E(t) curve is the most importantinformation for an overall evaluation of theperformance of a hammer and driving system. This
EMX value allows for a classification of thehammer's performance when presented as the ratedtransfer efficiency, also called energy transfer ratio
(ETR) or global efficiency
T Re = EMX/E (8b)
where
RE is the manufacturer’s rated energy value.
Both Saximeter and PDA calculate the stroke (STK)of an open end diesel hammer using
B LSTK = (g/8) T - h (9)2
where
g is the earth’s gravitational acceleration,
BT is the time between two hammer blows,
Lh is a stroke loss value due to gas compressionand time losses during impact (usually 0.3 ft or0.1 m).
DETERMINATION OF WAVE SPEED
An important facet of dynamic pile testing is anassessment of pile material properties. Since ingeneral force is determined from strain bymultiplication with elastic modulus, E, and crosssectional area, A, the dynamic elastic modulus hasto be determined for pile materials other than steel.In general, the records measured by the PDA clearlyindicate a pile toe reflection as long as pilepenetration per blow is greater than 1 mm or .04inches. The time between the onset of the force andvelocity records at impact and the onset of thereflection from the toe (usually apparent by a localmaximum of the wave up curve) is the so-calledwave travel time, T. Dividing 2L (L is here the lengthof the pile below sensors) by T leads to the stresswave speed in the pile:
c = 2L/T (10)

A-6
The elastic modulus of the pile material is related tothe wave speed according to the linear elastic waveequation theory by
E = c D (11)2
Since the mass density of the pile material, D, isusually well known (an exception is timber for whichsamples should be weighed), the elastic modulus iseasily found from the wave speed. Note, however,that this is a dynamic modulus which is generallyhigher than the static one and that the wave speeddepends to some degree on the strain level of thestress wave. For example, experience shows that thewave speed from PIT is roughly 5% higher than thewave speed observed during a high strain test.
Other Notes:
• If the pile material is nonuniform then the wavespeed c, according to Eq. 10, is an average wavespeed and does not necessarily reflect the pilematerial properties of the location where the strainsensors are attached to the pile top. For example,pile driving often causes fine tension cracks somedistance below the top of concrete piles. Then theaverage c is slower than that at the pile top. It istherefore recommended to determine E in thebeginning of pile driving and not adjust it when theaverage c changes.
• If the pile has such a high resistance that there is noclear indication of a toe reflection then the wavespeed of the pile material must be determined eitherby assumption or by taking a sample of theconcrete and measuring its wave speed in a simplefree column test. Another possibility is to use theproportionality relationship, discussed under “DATAQUALITY CHECKS” to find c as the ratio betweenthe measured velocity and measured strain.
DATA QUALITY CHECKS
Quality data is the first and foremost requirement foraccurate dynamic testing results. It is thereforeimportant that the measurement engineer performingPDA or PIT tests has the experience necessary torecognize measurement problems and takeappropriate corrective action should problemsdevelop. Fortunately, dynamic pile testing allows forcertain data quality checks because two independent
measurements are taken that have to conform tocertain relationships.
Proportionality
As long as there is only a wave traveling in onedirection, as is the case during impact when only adownward traveling wave exists in the pile, force andvelocity measured at the pile top are proportional
F = v Z = v (EA/c) (12a)
This relationship can also be expressed in terms ofstress
F = v (E/c) (12b)
or strain
, = v / c (12c)
This means that the early portion of strain timeswave speed must be equal to the velocity unless theproportionality is affected by high friction near thepile top or by a pile cross sectional change not farbelow the sensors. Checking the proportionality isan excellent means of assuring meaningfulmeasurements.
Measurements are always taken at opposite sides ofthe pile as a means of calculating the average forceand velocity in the pile. The velocity on the two sidesof the pile is very similar even when high bendingexists. Thus, an independent check of the velocitymeasurements is easy and simple.
Strain measurements may differ greatly between thetwo sides of the pile when bending exists. It is evenpossible that tension is measured on one side whilevery high compression exists on the other side of thepile. In extreme cases, bending might be so highthat it leads to a nonlinear stress distribution. Theaveraging of the two strain signals does then notlead to the average pile force and proportionality willnot be achieved.
When testing drilled shafts, measurements of strainmay also be affected by local concrete qualityvariations. It is then often necessary to use fourstrain transducers spaced at 90 degrees around thepile for an improved strain data quality. The use offour transducers is also recommended for large pile

A-7
diameters, particularly when it is difficult to mount thesensors at least two pile widths or diameters belowthe pile top.
LIMITATIONS, ADDITIONAL CONSIDERATIONS
Mobilization of capacity
Estimates of pile capacity from dynamic testing
indicate the mobilized pile capacity at the time of
testing. At very high blow counts (low set per blow),dynamic test methods tend to produce lower boundcapacity estimates as not all resistance (particularlyat and near the toe) is fully activated.
Time dependent soil resistance effects
Static pile capacity from dynamic method calculationsprovide an estimate of the axial pile capacity.Increases and decreases in the pile capacity with timetypically occur (soil setup/relaxation). Therefore,
restrike testing usually yields a better indication
of long term pile capacity than a test at the end of
pile driving. Often a wait period of one or two daysbetween end of driving and restrike is satisfactory fora realistic prediction of pile capacity but this waitingtime depends, among other factors, on thepermeability of the soil.
(A) Soil setup
Because excess positive pore pressures oftendevelop during pile driving in fine grained soil (clays,silts or even fine sands), the capacity of a pile at thetime of driving may often be less than the long termpile capacity. These pore pressures reduce theeffective stress acting on the pile thereby reducing thesoil resistance to pile penetration, and thus the pilecapacity at the time of driving. As these porepressures dissipate, the soil resistance acting on thepile increases as does the axial pile capacity. Thisphenomena is routinely called soil setup or soilfreeze.
(B) Relaxation
Relaxation (capacity reduction with time) has beenobserved for piles driven into weathered shale, andmay take several days to fully develop. Pile capacityestimates based upon initial driving or short termrestrike tests can significantly overpredict long termpile capacity. Therefore, piles driven into shale
should be tested after a minimum one week waiteither statically or dynamically (with particularemphasis than on the first few blows). Relaxationhas also been observed for displacement pilesdriven into dense saturated silts or fine sands due toa negative pore pressure effect at the pile toe.Again, restrike tests should be used, with greatemphasis on early blows.
Capacity results for open pile profiles
Larger diameter open ended pipe piles (or H-pileswhich do not bear on rock) may behave differentlyunder dynamic and static loading conditions. Underdynamic loads the soil inside the pile or between itsflanges may slip and produce internal friction whileunder static loads the plug may move with the pile,thereby creating end bearing over the full pile crosssection. As a result both friction and end bearingcomponents may be different under static anddynamic conditions.
CAPWAP Analysis Results
A portion of the soil resistance calculated on anindividual soil segment in a CAPWAP analysis canusually be shifted up or down the shaft one soilsegment without significantly altering the matchquality. Therefore, use of the CAPWAP resistancedistribution for uplift, downdrag, scour, or othergeotechnical considerations should be made with anunderstanding of these analysis limitations.
Stresses
PDA and CAPWAP calculated stresses are averagevalues over the cross section. Additional allowancehas to be made for bending or non-uniform contactstresses. To prevent damage it is thereforeimportant to maintain good hammer-pile alignmentand to protect the pile toes using appropriate devicesor an increased cross sectional area.
In the United States is has become generallyacceptable to limit the dynamic installation stressesof driven piles to the following levels:
90% of yield strength for steel piles
85% of the concrete compressive strength - aftersubtraction of the effective prestress - forconcrete piles in compression

A-8
100% of effective prestress plus ½ of theconcrete’s tension strength for prestressedpiles in tension
70% of the reinforcement strength for regularlyreinforced concrete piles in tension
300% of the static design allowable stress fortimber
Note that the dynamic stresses may either be directlymeasured at the pile top by the PDA or calculated bythe PDA for other locations along the pile based onthe pile top measurements.
Additional design considerations
Numerous factors have to be considered in pilefoundation design. Some of these considerationsinclude
• additional pile loading from downdrag or negativeskin friction,
• lateral and uplift loading requirements
• effective stress changes (due to changes in watertable, excavations, fills or other changes inoverburden),
• long term settlements in general and settlementfrom underlying weaker layers and/or pile groupeffects,
These factors have not been evaluated by GRL andhave not been considered in the interpretation of thedynamic testing results. The foundation designershould determine if these or any other considerationsare applicable to this project and the foundationdesign.
Wave equation analysis results
The results calculated by the wave equation analysisprogram depend on a variety of hammer, pile andsoil input parameters. Although attempts have beenmade to base the analysis on the best availableinformation, actual field conditions may vary andtherefore stresses and blow counts may differ fromthe predictions reported. Capacity predictionsderived from wave equation analyses should userestrike information. However, because of theuncertainties associated with restrike blow countsand restrike hammer energies, correlations of suchresults with static test capacities with have oftendisplayed considerable scatter.
As for PDA and CAPWAP, the theory on whichGRLWEAP is based is the one-dimensional waveequation. For that reason, stress predictions by thewave equation analysis can only be averages overthe pile cross section. Thus, bending stresses orstress concentrations due to non-uniform impact oruneven soil or rock resistance are not considered inthese results. Stress maxima calculated by the waveequation are usually subjected to the same limits asthose measured directly or calculated frommeasurements by the PDA.

Appendix B
Results of CAPWAP Analysis
Robert Miner Dynamic Testing, Inc.


5 135
-150
0
150
300
ms
kips
23 L/c
Force MsdForce Cpt
5 135
-150
0
150
300
ms
kips
23 L/c
Force MsdVelocity Msd
Pile
0
1
2
3
4
kips
/ft
0
50
100
150
200
kips
Shaft ResistanceDistribution
Pile Forceat Ru
0 50 100 150 2000.000
0.700
1.400
2.100
2.800
Load (kips)
Dis
plac
emen
t (in
)
Pile TopBottom
Ru = 170.0 kipsRs = 125.0 kipsRb = 45.0 kipsRt2 = 25.0 kipsDy = 1.75 inDx = 2.35 in
APE HELICAL PILES; Pile: P1, No Grout, Single Helix; PP7"ODx.453; Blow: 1 (Test: 08-Dec-2012 14:13:) 15-Mar-2013Robert Miner Dynamic Testing, Inc. CAPWAP(R) 2006-3
CAPWAP(R) 2006-3 Licensed to Robert Miner Dynamic Testing, Inc.

APE HELICAL PILES; Pile: P1, No Grout, Single Helix Test: 08-Dec-2012 14:13:PP7"ODx.453; Blow: 1 CAPWAP(R) 2006-3Robert Miner Dynamic Testing, Inc. OP: RMDT
Page 1 Analysis: 15-Mar-2013
CAPWAP SUMMARY RESULTS
Total CAPWAP Capacity: 170.0; along Shaft 125.0; at Toe 45.0 kips
Soil Dist. Depth Ru Force Sum Unit Unit Smith QuakeSgmnt Below Below in Pile of Resist. Resist. DampingNo. Gages Grade Ru (Depth) (Area) Factor
ft ft kips kips kips kips/ft ksf s/ft in
170.01 10.0 9.5 4.3 165.7 4.3 0.45 0.25 0.120 0.1002 16.7 16.2 4.2 161.5 8.5 0.63 0.34 0.120 0.1003 23.4 22.9 5.5 156.0 14.0 0.82 0.45 0.120 0.1004 30.1 29.6 6.0 150.0 20.0 0.90 0.49 0.120 0.1005 36.8 36.3 6.6 143.4 26.6 0.99 0.54 0.120 0.1006 43.5 43.0 8.7 134.7 35.3 1.30 0.71 0.120 0.1007 50.2 49.7 13.0 121.7 48.3 1.94 1.06 0.120 0.1008 56.9 56.4 16.1 105.6 64.4 2.40 1.31 0.120 0.1009 63.6 63.1 19.4 86.2 83.8 2.90 1.58 0.120 0.10010 70.3 69.8 20.1 66.1 103.9 3.00 1.64 0.120 0.10011 77.0 76.5 21.1 45.0 125.0 3.15 1.72 0.120 0.1002nd Toe 25.0 0.126 1.000
Avg. Shaft 11.4 1.63 0.89 0.120 0.100
Toe 20.0 74.84 0.150 0.700
Soil Model Parameters/Extensions Shaft Toe
Case Damping Factor 0.904 0.181Damping Type SmithReloading Level (% of Ru) 100 100Unloading Level (% of Ru) 80Soil Plug Weight (kips) 0.22Soil Support Dashpot 2.300 0.000Soil Support Weight (kips) 1.28 0.00
max. Top Comp. Stress = 31.8 ksi (T= 34.3 ms, max= 1.033 x Top)max. Comp. Stress = 32.9 ksi (Z= 16.7 ft, T= 33.5 ms)max. Tens. Stress = -3.91 ksi (Z= 10.0 ft, T= 130.9 ms)max. Energy (EMX) = 27.5 kip-ft; max. Measured Top Displ. (DMX)= 1.42 in
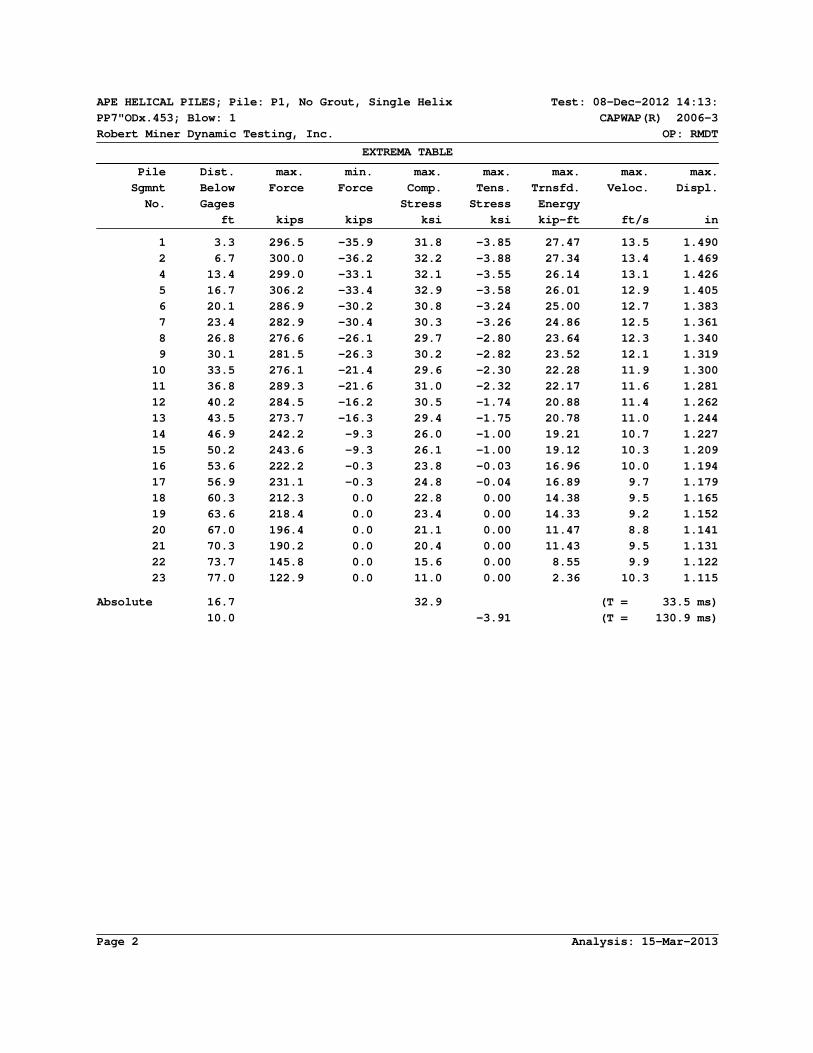
APE HELICAL PILES; Pile: P1, No Grout, Single Helix Test: 08-Dec-2012 14:13:PP7"ODx.453; Blow: 1 CAPWAP(R) 2006-3Robert Miner Dynamic Testing, Inc. OP: RMDT
Page 2 Analysis: 15-Mar-2013
EXTREMA TABLE
Pile Dist. max. min. max. max. max. max. max.Sgmnt Below Force Force Comp. Tens. Trnsfd. Veloc. Displ.No. Gages Stress Stress Energy
ft kips kips ksi ksi kip-ft ft/s in
1 3.3 296.5 -35.9 31.8 -3.85 27.47 13.5 1.4902 6.7 300.0 -36.2 32.2 -3.88 27.34 13.4 1.4694 13.4 299.0 -33.1 32.1 -3.55 26.14 13.1 1.4265 16.7 306.2 -33.4 32.9 -3.58 26.01 12.9 1.4056 20.1 286.9 -30.2 30.8 -3.24 25.00 12.7 1.3837 23.4 282.9 -30.4 30.3 -3.26 24.86 12.5 1.3618 26.8 276.6 -26.1 29.7 -2.80 23.64 12.3 1.3409 30.1 281.5 -26.3 30.2 -2.82 23.52 12.1 1.31910 33.5 276.1 -21.4 29.6 -2.30 22.28 11.9 1.30011 36.8 289.3 -21.6 31.0 -2.32 22.17 11.6 1.28112 40.2 284.5 -16.2 30.5 -1.74 20.88 11.4 1.26213 43.5 273.7 -16.3 29.4 -1.75 20.78 11.0 1.24414 46.9 242.2 -9.3 26.0 -1.00 19.21 10.7 1.22715 50.2 243.6 -9.3 26.1 -1.00 19.12 10.3 1.20916 53.6 222.2 -0.3 23.8 -0.03 16.96 10.0 1.19417 56.9 231.1 -0.3 24.8 -0.04 16.89 9.7 1.17918 60.3 212.3 0.0 22.8 0.00 14.38 9.5 1.16519 63.6 218.4 0.0 23.4 0.00 14.33 9.2 1.15220 67.0 196.4 0.0 21.1 0.00 11.47 8.8 1.14121 70.3 190.2 0.0 20.4 0.00 11.43 9.5 1.13122 73.7 145.8 0.0 15.6 0.00 8.55 9.9 1.12223 77.0 122.9 0.0 11.0 0.00 2.36 10.3 1.115
Absolute 16.7 32.9 (T = 33.5 ms) 10.0 -3.91 (T = 130.9 ms)

APE HELICAL PILES; Pile: P1, No Grout, Single Helix Test: 08-Dec-2012 14:13:PP7"ODx.453; Blow: 1 CAPWAP(R) 2006-3Robert Miner Dynamic Testing, Inc. OP: RMDT
Page 3 Analysis: 15-Mar-2013
CASE METHOD
J = 0.0 0.1 0.2 0.3 0.4 0.5 0.6 0.7 0.8 0.9RP 312.4 293.6 274.7 255.9 237.0 218.2 199.4 180.5 161.7 142.8RX 312.4 293.6 274.7 255.9 237.0 223.7 211.5 199.2 187.0 176.7RU 0.0 0.0 0.0 0.0 0.0 0.0 0.0 0.0 0.0 0.0
RAU = 45.2 (kips); RA2 = 261.0 (kips)
Current CAPWAP Ru = 170.0 (kips); Corresponding J(RP)= 0.76; matches RX9 within 5%
VMX TVP VT1*Z FT1 FMX DMX DFN SET EMX QUSft/s ms kips kips kips in in in kip-ft kips
13.50 26.35 224.1 276.7 299.9 1.422 0.690 0.600 27.3 323.6
PILE PROFILE AND PILE MODEL
Depth Area E-Modulus Spec. Weight Perim.ft in2 ksi lb/ft3 ft
0.00 9.32 29861.2 492.000 1.833 75.00 9.32 29861.2 492.000 1.833 75.00 15.60 29861.2 492.000 1.833 76.00 15.60 29861.2 492.000 1.833 76.00 9.32 29861.2 492.000 1.833 77.00 9.32 29861.2 492.000 1.833
Toe Area 0.267 ft2
Segmnt Dist. Impedance Imped. Tension Compression Perim.Number B.G. Change Slack Eff. Slack Eff.
ft kips/ft/s % in in ft
1 3.35 16.60 0.00 0.000 0.000 -0.000 0.000 1.83323 77.00 19.94 0.00 0.000 0.000 -0.000 0.000 1.833
Pile Damping 1.0 %, Time Incr 0.200 ms, Wave Speed 16771.1 ft/s, 2L/c 9.2 ms

5 185
-400
0
400
800
ms
kips
52 L/c
Force MsdForce Cpt
5 185
-400
0
400
800
ms
kips
52 L/c
Force MsdVelocity Msd
Pile
0
5
10
15
20
kips
/ft
0
175
350
525
700
kips
Shaft ResistanceDistribution
Pile Forceat Ru
0 175 350 525 7000.000
0.500
1.000
1.500
2.000
Load (kips)
Dis
plac
emen
t (in
)
Pile TopBottom
Ru = 660.4 kipsRs = 360.3 kipsRb = 300.1 kipsDy = 1.73 inDx = 1.92 in
APE, HELICAL PILES; Pile: P5, Grouted, Single Helix; PP7''x1.0'' ; Blow: 5 (Test: 20-Feb-2013 10:43:) 15-Mar-2013Robert Miner Dynamic Testing, Inc. CAPWAP(R) 2006-3
CAPWAP(R) 2006-3 Licensed to Robert Miner Dynamic Testing, Inc.

APE, HELICAL PILES; Pile: P5, Grouted, Single Helix Test: 20-Feb-2013 10:43:PP7''x1.0'' ; Blow: 5 CAPWAP(R) 2006-3Robert Miner Dynamic Testing, Inc. OP: RMDT
Page 1 Analysis: 15-Mar-2013
CAPWAP SUMMARY RESULTS
Total CAPWAP Capacity: 660.4; along Shaft 360.3; at Toe 300.1 kips
Soil Dist. Depth Ru Force Sum Unit Unit SmithSgmnt Below Below in Pile of Resist. Resist. DampingNo. Gages Grade Ru (Depth) (Area) Factor
ft ft kips kips kips kips/ft ksf s/ft
660.41 10.2 6.7 0.9 659.5 0.9 0.13 0.07 0.1602 17.0 13.5 6.8 652.7 7.7 1.00 0.55 0.1603 23.8 20.3 13.7 639.0 21.4 2.01 1.10 0.1604 30.6 27.1 24.3 614.7 45.7 3.57 1.95 0.1605 37.4 33.9 76.0 538.7 121.7 11.18 6.10 0.1606 44.2 40.7 118.4 420.3 240.1 17.41 9.50 0.1607 51.0 47.5 120.2 300.1 360.3 17.68 9.64 0.160
Avg. Shaft 51.5 7.59 4.14 0.160
Toe 300.1 1122.90 0.100
Soil Model Parameters/Extensions Shaft Toe
Quake (in) 0.100 0.360Case Damping Factor 1.713 0.892Damping Type SmithUnloading Quake (% of loading quake) 30 100Reloading Level (% of Ru) 100 100Unloading Level (% of Ru) 20Resistance Gap (included in Toe Quake) (in) 0.100Soil Support Dashpot 4.000 0.000Soil Support Weight (kips) 1.30 0.00
max. Top Comp. Stress = 36.8 ksi (T= 36.2 ms, max= 2.088 x Top)max. Comp. Stress = 76.8 ksi (Z= 23.8 ft, T= 37.2 ms)max. Tens. Stress = -9.80 ksi (Z= 23.8 ft, T= 77.1 ms)max. Energy (EMX) = 55.1 kip-ft; max. Measured Top Displ. (DMX)= 1.46 in
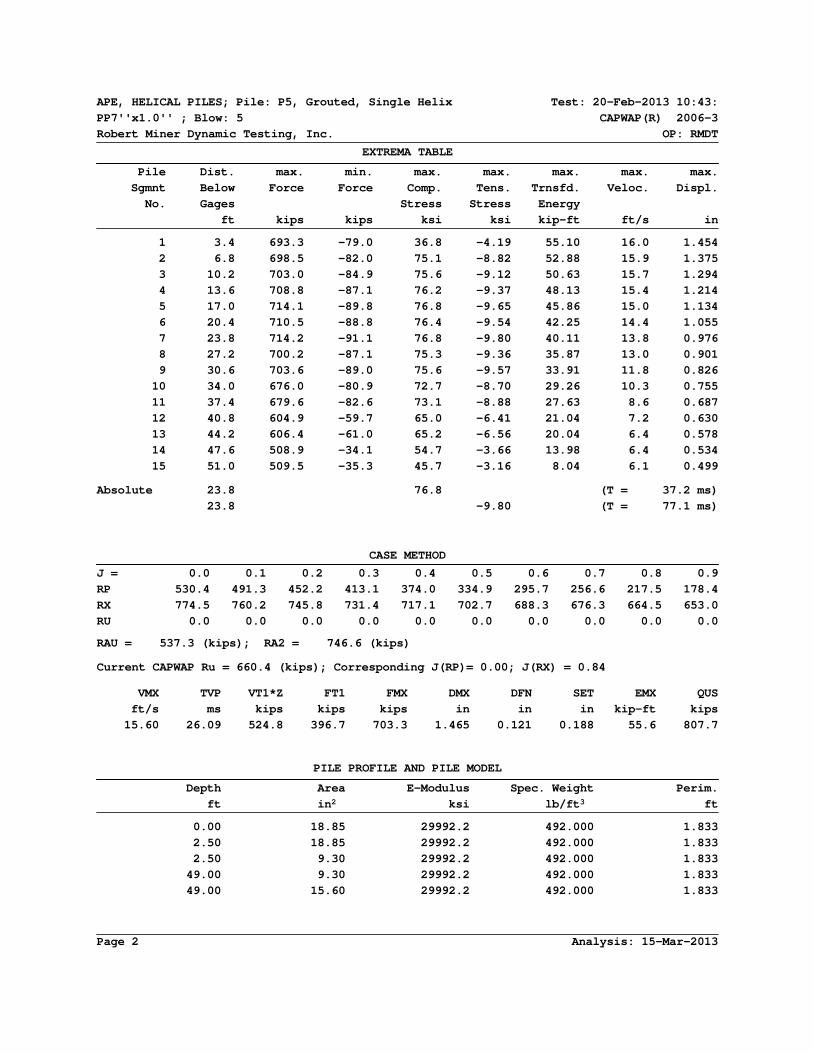
APE, HELICAL PILES; Pile: P5, Grouted, Single Helix Test: 20-Feb-2013 10:43:PP7''x1.0'' ; Blow: 5 CAPWAP(R) 2006-3Robert Miner Dynamic Testing, Inc. OP: RMDT
Page 2 Analysis: 15-Mar-2013
EXTREMA TABLE
Pile Dist. max. min. max. max. max. max. max.Sgmnt Below Force Force Comp. Tens. Trnsfd. Veloc. Displ.No. Gages Stress Stress Energy
ft kips kips ksi ksi kip-ft ft/s in
1 3.4 693.3 -79.0 36.8 -4.19 55.10 16.0 1.4542 6.8 698.5 -82.0 75.1 -8.82 52.88 15.9 1.3753 10.2 703.0 -84.9 75.6 -9.12 50.63 15.7 1.2944 13.6 708.8 -87.1 76.2 -9.37 48.13 15.4 1.2145 17.0 714.1 -89.8 76.8 -9.65 45.86 15.0 1.1346 20.4 710.5 -88.8 76.4 -9.54 42.25 14.4 1.0557 23.8 714.2 -91.1 76.8 -9.80 40.11 13.8 0.9768 27.2 700.2 -87.1 75.3 -9.36 35.87 13.0 0.9019 30.6 703.6 -89.0 75.6 -9.57 33.91 11.8 0.82610 34.0 676.0 -80.9 72.7 -8.70 29.26 10.3 0.75511 37.4 679.6 -82.6 73.1 -8.88 27.63 8.6 0.68712 40.8 604.9 -59.7 65.0 -6.41 21.04 7.2 0.63013 44.2 606.4 -61.0 65.2 -6.56 20.04 6.4 0.57814 47.6 508.9 -34.1 54.7 -3.66 13.98 6.4 0.53415 51.0 509.5 -35.3 45.7 -3.16 8.04 6.1 0.499
Absolute 23.8 76.8 (T = 37.2 ms) 23.8 -9.80 (T = 77.1 ms)
CASE METHOD
J = 0.0 0.1 0.2 0.3 0.4 0.5 0.6 0.7 0.8 0.9RP 530.4 491.3 452.2 413.1 374.0 334.9 295.7 256.6 217.5 178.4RX 774.5 760.2 745.8 731.4 717.1 702.7 688.3 676.3 664.5 653.0RU 0.0 0.0 0.0 0.0 0.0 0.0 0.0 0.0 0.0 0.0
RAU = 537.3 (kips); RA2 = 746.6 (kips)
Current CAPWAP Ru = 660.4 (kips); Corresponding J(RP)= 0.00; J(RX) = 0.84
VMX TVP VT1*Z FT1 FMX DMX DFN SET EMX QUSft/s ms kips kips kips in in in kip-ft kips
15.60 26.09 524.8 396.7 703.3 1.465 0.121 0.188 55.6 807.7
PILE PROFILE AND PILE MODEL
Depth Area E-Modulus Spec. Weight Perim.ft in2 ksi lb/ft3 ft
0.00 18.85 29992.2 492.000 1.833 2.50 18.85 29992.2 492.000 1.833 2.50 9.30 29992.2 492.000 1.833 49.00 9.30 29992.2 492.000 1.833 49.00 15.60 29992.2 492.000 1.833

APE, HELICAL PILES; Pile: P5, Grouted, Single Helix Test: 20-Feb-2013 10:43:PP7''x1.0'' ; Blow: 5 CAPWAP(R) 2006-3Robert Miner Dynamic Testing, Inc. OP: RMDT
Page 3 Analysis: 15-Mar-2013
PILE PROFILE AND PILE MODEL
Depth Area E-Modulus Spec. Weight Perim.ft in2 ksi lb/ft3 ft
50.00 15.60 29992.2 492.000 1.833 50.00 9.30 29992.2 492.000 1.833 51.00 9.30 29992.2 492.000 1.833
Toe Area 0.267 ft2
Segmnt Dist. Impedance Imped. Tension Compression Perim.Number B.G. Change Slack Eff. Slack Eff.
ft kips/ft/s % in in ft
1 3.40 33.65 0.00 0.000 0.000 -0.000 0.000 1.8332 6.80 20.60 24.10 0.000 0.000 -0.000 0.000 1.83313 44.20 21.60 30.12 0.000 0.000 -0.000 0.000 1.83315 51.00 24.91 25.12 0.000 0.000 -0.000 0.000 1.833
Pile Damping 1.0 %, Time Incr 0.202 ms, Wave Speed 16807.9 ft/s, 2L/c 6.1 ms