content of carbon, nitrogen, oxygen, sulfur and phosphorus ... · aquatic microbial ecology aquat...
TRANSCRIPT
AQUATIC MICROBIAL ECOLOGY Aquat Microb Ecol Published March 14
Content of carbon, nitrogen, oxygen, sulfur and phosphorus in native aquatic and cultured bacteria
Kjell Magne Fagerbakke, Mikal Heldal*, Svein Norland
Department of Microbiology, University of Bergen, Jahnebakken 5, N-5020 Bergen, Norway
ABSTRACT: The content of carbon, nitrogen, oxygen, phosphorus and sulfur was measured in individ- ual cells from 6 native aquatic samples and 4 samples of cultured bacteria by X-ray microanalysis using a transmission electron microscope (TEM). The molar C N:P ratio for the pooled sample was 50:lO:l From length and width measurements of unfixed air-dried cells we estimated cell volumes over a total range of 0.0026 to 15.8 pm3. and mean C:volume ratios of 30 to 162 fg for the samples included. For the marine samples we found mean N:C ratios of 0.25 to 0.28, while cells from fresh or brackish waters had mean N:C ratios of 0.17 to 0.20, indicating differences in nutrient availability. The P:C ratios for the samples analyzed varied from 0.040 to 0.090, with a pooled mean of 0.052, which is approxi- mately twice that of the Redfield ratio for PC. For 0:C ratios we estimated a pooled mean of 0.37 and a range of 0.22 to 0.77 for all samples. We may conclude that slow-growing or non-growing cells have low 0 - C ratios. The mean S:C ratio for all samples was 0.031, with a range of 0 016 to 0.084 for the sam- ple means. A general conclus~on is that single-cell analyses of elemental composition give important information on the physiological conditions of cells and on possible nutrient limitations. The rationale for this is the assumption that changes in macromolecular composition are due to nutrient availability.
KEY WORDS: X-ray microanalysis . Carbon Nitrogen . Oxygen - Sulfur . Phosphorus. Volume. Ratios
INTRODUCTION
Bacteria are Important participants in the turnover of organic and inorganic material and are also important for production in aquatic environments. In lakes this secondary production may, in terms of carbon, equal primary production (Morris & Lewis 1992). It has been suggested that the flux of organic C from primary pro- duction strongly regulates bacterial production (Cole et al. 1988), but inorganic nutrients like P and N may also contribute to bacterial growth regulation.
Bacterial biomass is commonly estimated through measurements of total cell numbers, bacterial biovol- ume, and the use of conversion factors for C:volume ratios (Fry 1990 and references therein). C:volume ratios over a broad range have been reported for native aquatic bacteria (Watson et al. 1977, Bratbak 1985, Kogure & Koike 1987, Lee & Fuhrman 1987). Further- more, the N:C and P:C ratios based on bulk measure-
'Addressee for correspondence. E-mail: [email protected]
O Inter-Research 1996
ments reported for bacteria also show large variations (Bratbak 1985, Vadstein & Olsen 1989, Tezuka 1990). Despite the variation, the relative amount of nitrogen and particularly of phosphorus is higher in bacteria than in algae. Goldman et al. (1987) found a molar C:N:P ratio of 45:9:1 for bacteria, whereas the com- monly referred to molar Redfield ratio for algae is 106:16:1 (Redfield et al. 1963).
Despite their importance for an understanding of the microbial ecosystem, relatively few studies of the ele- mental composition of bacteria and of how this compo- sition is influenced by growth conditions have been presented. The elemental composition of bacteria determines the quality of the material that is trans- ported to higher trophic levels by grazing, and it also controls their role in the regeneration process, whether or not they excrete or consume mineral nutrients (Par- ilas 1975, Goldman et al. 1987, Goldman & Dennet 1991). The elemental composition of bacteria also reflects the conditions under which they grow and may point to possible limiting factors (Egli 1991). Several studies have shown that the growth rate of microor-
16 Aquat Microb E
ganisms IS more closely related to the cellular content of a limiting nutrient than to external nutrient concen- trations (Droop 1983, Vadstein et al. 1988)
A large discrepancy between total counts and viable counts of bacteria from aquatic environments may indicate that a considerable fraction of the cells are non-growing, dormant or inactive (Hobbie et al. 197 7, Fry & Zia 1982, Zweifel & Hagstrom 1995). If this non- growing or dormant fraction is nutrient limited, mea- surements of the elemental composition should reveal the limitation to the extent that it is possible to measure structural elements like carbon, nitrogen, and phos- phorus a t single-cell levels.
Most microbiological methods are based on bulk techniques, which determine a population mean for a measured property. However, with the advent of single-cell techniques, e .g . flow cytometry and quanti- tative image analysis, the importance of the hetero- geneity of cultures has been appreciated, a hetei-o- geneity which goes beyond that caused by binary fission alone. Kell et al. (1991) have shown that cul- tures of Micrococcus luteus may have a bimodal distn- bution of autofluorescence. Transmission electron microscopes (TEM) equipped with energy dispersive X-ray detectors have been used for quantitative mea- surements of the elemental composition of single cells (Heldal et al. 1985, Fagerbakke et al. 1991, Norland et al. 1995).
In this study we use a method developed by the authors (Norland et al. 1995) based on X-ray micro- analysis (XRMA) in TEM to measure the major struc- tural elements (carbon, nitrogen, oxygen, phosphorus an.d sulfur) in single bacteria from both cultured and native samples. The objective is to describe the varia- tion of elemental composition within and among sam- ples and to study how nutritional status and growth conditions are reflected in the elemental composition of the cells.
MATERIAL AND METHODS
Native bacteria were sampled from 4 locations on 6 occasions: Raunefjorden, 15 km south of Bergen, F\!crwsy (60" 16' N, 5" ? A ' E) jn J i j n ~ ;7nd Ortoher 1993:
Lake Kalandsvatnet, 10 km south, of Bergen (60" 17' N, 5" 25' E) in October 1992; Tvarminne, Finland (59" 51' N, 23" 16' E) in July 1993; Knebel Vig, Aarhus Bight, Denmark (56" 10' N, 10" 30' E ) in June 1992 and July 1994.
Samples of laboratory-grown bacteria Escherjchia coli and Vibr~o natriegens were obtained from both growing cultures and from cultures in the stationary phase. The cultures and samples were prepared as fol- lows:
Escherichia coli B6 wildtype was grown in a me- dium with a low potassium concentration. NaH2P04 (4.5 mM), Na,HP04 ( 1 mM1, NaNO, (10 mM), KC1 (1 mM), MgSO, (10 mM). The cells were grown in a 100 m1 batch culture at 37°C on a rotary shaker. After 24 h, in the stationary growth phase, samples for XRMA and CHN (carbon, hydrogen, nitrogen) analysis were taken. The culture was then diluted by adding 2 parts (70 ml) l % Nutrient Broth (Oxoid) to 30 m1 of the culture. Samples from exponentially growing bacteria were taken after 1 h of incubation.
Vibrio natriegens NCMB85-I was grown in BHI (brain heart infusion) medium (Oxoid) (37 g 1-' BHI was dissolved in 70% artificial sea water and sterilized). The cells were grown at 35°C in a water bath with shaking. Samples were taken in the mid-exponential growth phase (1 h) and 30 min after the onset of the stationary phase, i.e. 2 h after the start of incubation. Growth was measured as light absorption at 620 nm using a spectrophotometer
The bacteria were harvested by centrifugation onto aluminium grids (100 mesh; Agar Scientific, Stansted, Essex, UK) supported with carbon-coated formvar film. Neither fixatives nor stain were applied. The cells were air-dried at ambient conditions and analyzed in a JEOL 100 CX transmission electron microscope oper- ated in scanning mode and equipped with a Tracor Z- MAX 30 detector featuring silicon crystal and Norvar single window for light-element detection. The micro- scope was operated at 80 kV, with a magnification between 10000 X and 60000x, and the grids were placed between high-purity carbon plates at a 38" nominal take-off angle. X-ray spectra were a.ccumu- lated for 50 S (live time) in a Tracor multichannel ana- lyzer and stored on floppy disks. The scanned area, bacterial length and width were measured on the CRT (cathode ray tube) screen, which was calibrated with latex beads (Agar Scientific) A particle-free area near each bacterium was chosen for the film background spectrum.
Processing of spectra. The spectra were transformed to MS-DOS-compatible binary files using a laboratory computer (MINC, Digital Equipment Corporation). All software and calibration procedures involved were dev~loper l by t h e authors, and the principles involved are described by Norland et al. (1995). Volume was determined by assuming the cell to be cyl~ndrical with hemispherical ends. Dry matter was determined as the sum of all measured elements, assuming a hydrogen content equal to 1/6 of the carbon content.
Due to the wide range of cell sizes included in the analyses and to the skewed (approximately log-nor- mal) distribution of the measured properties of the cells, we chose to calculate all means and standard deviations from log-transformed data. These were
Fagerbakke et al.: Elemental coinposition of native and cultured bacteria 17
then converted back to the linear domain (antilogs of In&) = bln(x) + a I
log-transformed data) for presentation. This implies that all means are geometric, which for this set of data where X and y are the 2 variables, a is the value of y are 10 to 30% lower than the arithmetic ones. We when ln(x) = 0 (i.e. X = 1) and b is the scale coefficient report the standard deviation of log-transformed data and is equal to unity when the 2 variables are propor- as arithmetic coefficients of variation (CV), an approx- tional. imation that holds for small values.
For the ratio of 2 parameters, z and y, xi = z,ly,. The weighted among-group coefficient of variation (CV,) RESULTS was computed using:
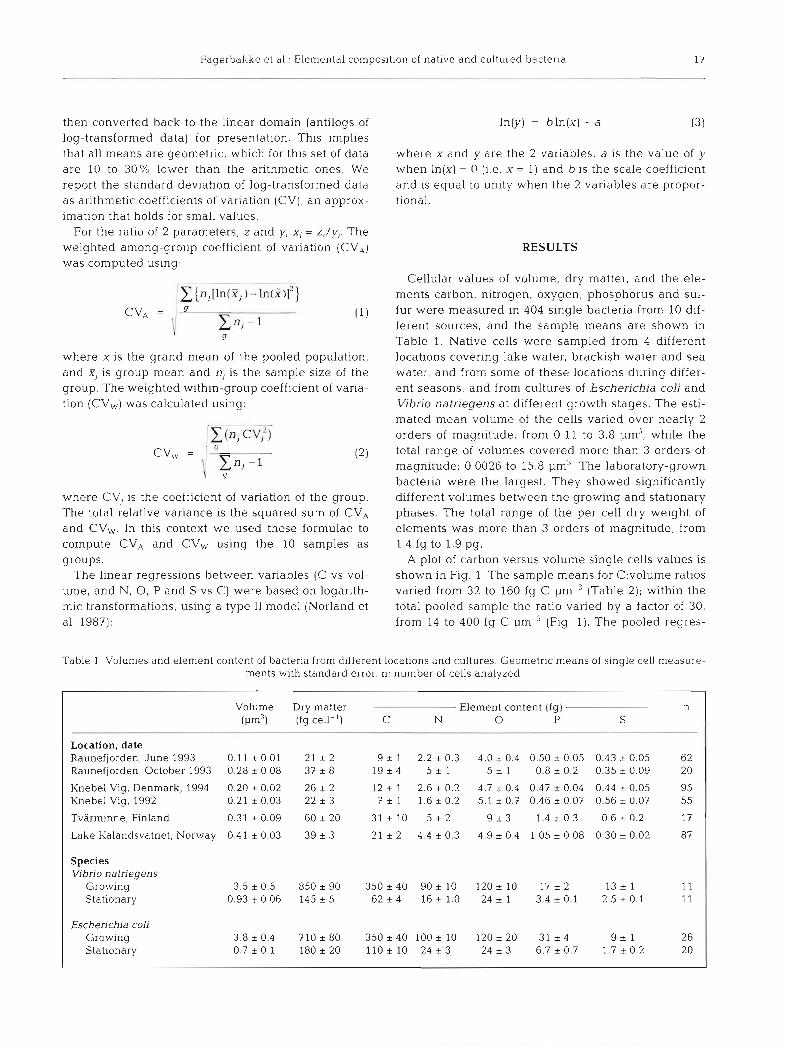
-. - - . Cellular values of volume, dry matter, and the ele- ( ~ { n ~ [ l n ( ~ , )- l ~ i i t } ments carbon, nitrogen, oxygen, phosphorus and sul-
c v A = v " fur were measured in 404 single bacteria from 10 dif- ER, - I ferent sources, and the sample means are shown in 9 Table 1. Native cells were sampled from 4 different
where 2 is the grand mean of the pooled population, locations covering lake water, brackish water and sea and Fl is group mean and n, is the sample size of the water, and from some of these locations during differ- group. The weighted within-group coefficient of varia- ent seasons, and from cultures of Escherichia coli and tion (CVw) was calculated using: Vibrio natriegens at different growth stages. The esti-
mated mean volun~e of the cells varied over nearly 2
IFCqy orders of magnitude, from 0.11 to 3.8 pm" while the total range of volumes covered more than 3 orders of
= v X.,-l magnitude: 0.0026 to 15.8 pm3. The laboratory-grown 9 bacteria were the largest. They showed significantly
where CV, is the coefficient of variation of the group. different volumes between the growing and stationary The total relative variance is the squared sum of CV, phases. The total range of the per cell dry weight of and CVw. In this context we used these formulae to elements was more than 3 orders of magnitude, from compute CV, and CVw using the 10 samples as 1.4 fg to 1.9 pg. groups. A plot of carbon versus volume single cells values is
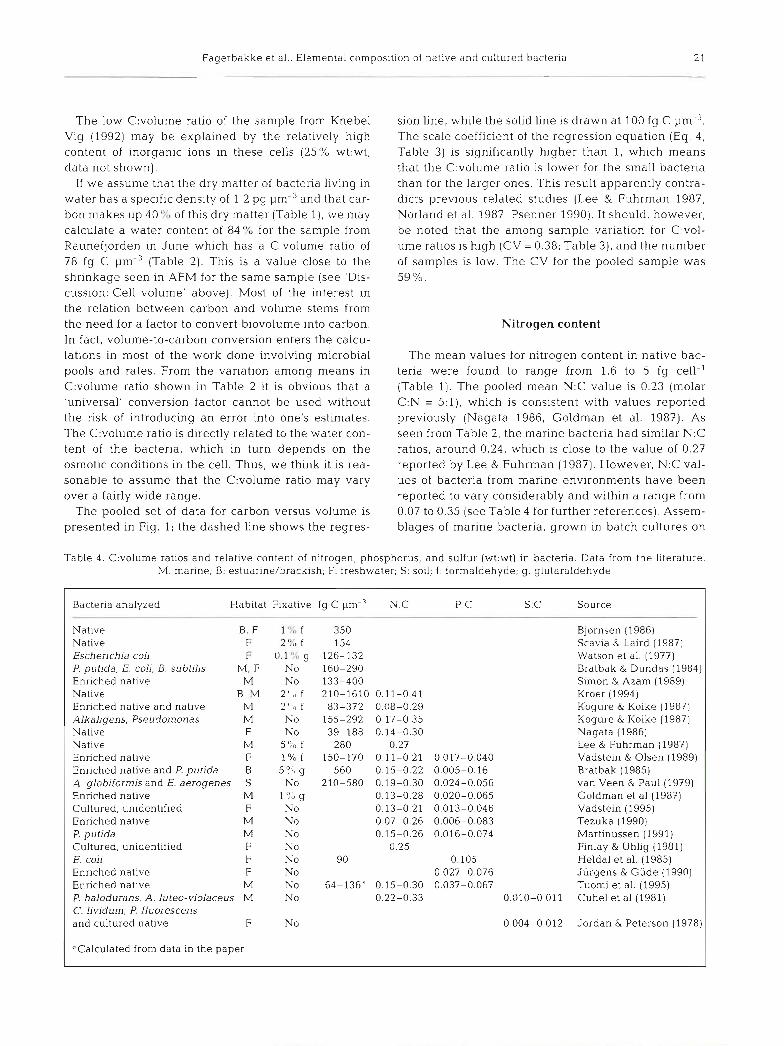
The linear regressions between variables (C vs vol- shown in Fig. 1. The sample means for C:volume ratios ume, and N, 0, P and S vs C) were based on logarith- varied from 32 to 160 fg C p m 3 (Table 2); within the mic transformations, using a type I1 model (Norland et total pooled sample the ratio varied by a factor of 30, al. 1987): from 14 to 400 fg C (Fig. 1). The pooled regres-
Table 1 Volumes and element content of bacteria from different locations and cultures. Geometnc means of s ~ n g l e cell measure- ments with standard error. n: number of cells analyzed
Volume Dry matter Element content (fg) n (pm3) (fg cell-') C N 0 P S
Location, date Raunefjorden, June 1993 0.11 * 0.01 21 i 2 9 k 1 2.2 + 0.3 4.0 i 0.4 0.50 i 0.05 0.43 + 0.05 62 Raunefjorden, October 1993 0.28 * 0.08 37 i 8 1 9 + 4 5 + 1 5 i 1 0.8 i 0.2 0.35 + 0.09 20
Knebel Vig, Denmark, 1994 0.20 + 0.02 26 i 2 12 + 1 2.6 * 0.2 4.7 i 0.4 0.47 i 0.04 0.44 + 0.05 95 Knebel Vig, 1992 0 21 k 0.03 22 * 3 7 5 1 1.6* 0.2 5.1 * 0.7 0.46 2 0.07 0.56 + 0.07 55
Tvarminne, Finland 0.31 + 0.09 6 0 r 20 31 + 10 5 + 2 9 i 3 1.4 + 0.3 0 6 + 0.2 17
Lake Kalandsvatnet, Norway 0.41 + 0.03 39 * 3 21 k 2 4.4 + 0.3 4.9 i 0.4 1.05 i 0.08 0.30 + 0.02 87
Species Vibrio natriegens
Growing 3.5 + 0.5 8 5 0 i 90 350 +40 90 + 10 1 2 0 i 10 17 i 2 1 3 + 1 11 Stationary 0.93 + 0.06 145 i 5 6 2 + 4 1 6 k 1 . 0 2 4 i 1 3 . 4 i 0 . 1 2 . 5 ~ 0 . 1 11
Escherichia coli Growing 3.8+ 0.4 7 1 0 i 8 0 350 +40 1 0 0 2 10 1 2 0 i 20 31 i 4 9 + 1 26 Stationary 0.7 * 0.1 180 i 20 110 + 10 24 + 3 24 i 3 6.7 i 0.7 1.7 + 0.2 20

18 Aquat Microb Ecol 10: 15-27, 1996
Table 2. C:volume ratio and ratios of nitrogen, phosphorus, and oxygen relative to carbon (wt:wt) of the samples in Table 1. Values are glven wlth standard error
" E. coti, growing OoO - A E. coli, stat. a
V. natriegens, growing V. natrie ens, stat.
O Lake ~agndsvatnet 0 Tvarminne
cn - C 0 +? m 0
L I I
C:volume ratio Weight ratio (fg C pm-3) N:C P:C 0 : C S:C
sion of carbon versus volume is expressed in Eq. (4) (Table 3). The regression line (dashed line) from Eq. (4) is shown in Fig. 1 together with the 100 fg C pm-' line (solid line).
Per cell amounts of nitrogen, oxygen, phosphorus and sulfur content versus carbon are shown in Fig. 2. For all these relationships the regressions lines are drawn from Eqs. (5) to (8), Table 3. In addition, the Redfield ratios for N:C and P:C are drawn (dashed lines). The mean pooled N:C ratio is approximately 30% higher than the Redfield ratio, while the pooled P:C ratio is nearly 3 times higher than the Redfield ratio. The mean pooled values of 0 :C and S:C are 0.37 and 0.031, respectively.
Elemental ratios of bacteria from the different loca- tions are presented in Table 2. The sample means for the N:C ratio had values in the range of 0.17 to 0.29. The marine bacteria had means from 0.22 to 0.26 while
Location, date Raunefjorden, June Raunefjorden, October Knebel Vig, 1994 Knebel Vig, 1992
0.07 G.10 1 .OO 10.00 the brackish water and freshwater had means from
Volume (pm3) 0.17 to 0.22. The highest N:C value, 0.29, was found for growing Escherichia coli. The highest mean P:C ratio
Fig. 1. Log-log plot of carbon content versus cell volumes for was found for growing E. coli and in the bacteria sam- all cells analysed. Solid line: 100 fg C pm-3; dashed line: pled from Knebel Vig in 1992, whilst only varia-
regression line
Tvarminne Lake Kalandsvatnet
Species Vibno natriegens
Growing Stationary
Escherichia coli Growing Stationary
Tdbie 3 , Regression equations berween comblnatlons of variables and the contribution to the total variation of their ratios from w~thin-group variation and among-group vanation. Volume (Vl) has the unit pmJ, all elements given in fg
Relation Regression equation Coefficient of var~ation Eq. no Within (CV,,,) Among (CV,)
C vs Volume In(C) = (1.12 * 0.03) X ln(V11 + (4.28 i 0.04) 0.46 0.38 141 N vs C ln(N) = (1.02 k 0.02) X ln(C) - (1.54 * 0.05) 0.42 0.12 (5) P vs C ln(P) = (1.05 c 0.02) X In(C) - (3.10 + 0.07) 0.53 0.24 (6) 0 vs C l n ( 0 ) = (0.94 c 0.03) X In(C) - (0 8 + 0.1) 0.37 0.39 (7) S vs C ln(S) = (1.00 z 0.02) X ln(C) - (3.5 c 0.1) 0.60 0.61 (8)

Fagerbakke et al.: Elemental composition of native and cultured bacteria 19
h
IT, - K a, IT,
P + .- Z
c a, IT,
6
Carbon (fg)
-
-
-
-
Fig. 2. Log-log plot of nitrogen, phosphorus, oxygen and sul- fur versus carbon for all cells analysed. Solid lines: Redfield ratios (nitrogen and phosphorus); dashed lines: regression
lines
A E. coli, growlng A E coli, slat V V, natrlegens. growing v V natriegens. star 0 Lake Kalandsvatnel 0 Tvafm~nne
Raunefjorden, June 0 Raunefjorden, Ocl
Knebel Vig 92 O Knebel Vig 94
-
-
-
4 4
-
0
I I I
-
0
-2
1 0 1 2 3
Canonical axis #l
-
Fig. 3. Canonical variate plot of the first 2 canonical axes (first and second axes explain 45 and 30% of the total dispersion, respectively). L: bacterial length; W: bacterial width; C, N, 0,
P and S are the elements included
A E. coli, growing a E. col;, stat. V V, natnegens, growing V V.natrie ens,stat.
C 0 Lake ~akndsvatnel 0 Tvarminne
tions were determined among the other means. The pooled regressions between nitrogen, phosphorus, oxygen and sulfur versus carbon are given by Eqs. (2) to (5) , Table 3, together with corresponding coeffi- cients of variations within and among groups.
Fig. 3 shows a bivariate plot of the first 2 axes from canonical variate analysis using the 10 samples as groups. The 2 axes shown represent 45 % (Axis 1) and 30% (Axis 2) of the total dispersion. The lengths and directions of the original axes indicate the contribution from each parameter to the dispersion of the cells. For Axis 1 P, S and N versus cell length (L), and 0 are the main contributors, while the contrast between C and N versus 0, L, S and cell width (W) contribute most to the dispersion of Axis 2.
- Raunefjorden, June 0 Raunefjorden, Oct. + Knebel Vlg 92 * Knebel Vig 94
n
(I, P V
0
+ I I l
DISCUSSION
Cell volume
The mean cell volumes for bacteria from the native samples varied from 0.11 to 0.41 pm3. Laboratory- grown Escherichia coli and Vibrio natnegens had mean cell volumes of 3.8 and 3.5 pm3 during growth and 0.7 and 0.4 pm3 during the stationary phase, respectively. We estimated cell volumes from measure- ments of lengths and widths at high magnification ( 1 0 0 0 0 ~ to 60000x enlargements) on air-dried but unfixed and unstained cells. In TEM the contrast is

20 Aquat Microb Ecol 10: 15-27, 1996
usually sufficient to define edges for unstained bacte- ria, but the edges may be blurred at the h.ighest mag- nifications The linear dimensions are generally deter- mined with a precision better than 5 %, giving an error less than 15% on volume. From comparative studies where lengths and widths of E. col1 were measured on living cells (on a wet agar surface, light microscopy) and on air-dried cells (using TEM), we observed that, due to shrinkage, air-dried cells had a volume 10% less than the living cells (authors' unpubl. results). A more marked shrinkage, about a 40 % reduction of vol- ume, was observed for cells fixed (2 % formaldehyde or 1.5 % glutaraldehyde) before air-drying. During drying the cells collapse towards the formvar film due to evap- oration of water, which has a high surface tension. Measurements of heights and widths of bacteria using an atomic force microscope (AFM) (Nano Scope 111, Digital Instruments, Breda, The Netherlands), showed thdl air-dned cells from Raunefjorden (June 1993), har- vested by centrifugation onto mica sheets, had a mean height:width ratio of 0.18 + 0.06. The cross-section pro- files of the cells were nearly rectangular, and appar- ently the cells collapsed towards the surface without a notable change in their width (G. Bratbak & M. Heldal unpubl. results).
Cell volumes were calculated assuming a model con- sisting of a cylinder with hemispherical ends (Heldal et al. 1985, Nagata 1986). Volume estimates will depend on the model chosen, e .g , assuming an ellipsoidal shape will give a 29 % lower volume at a width:length ratio of 2. More emphasis should be placed on volume estimates and the models should be made more adap- tive so that the volume of a wider range of the bacter- ial shapes actually found in nature can be better deter- mined. In this context, image analysis should prove to be an important tool.
Dry matter
In this study the dry weight of cells was calculated as the sum of a11 measurable elements plus an additional contribution from hydrogen assumed to be '/6 (wt:wt) of carbon (Norland et al. 1995). As shown in Table 1, the tzt'! y a n n ~ .Ay - ~f rlrv -- 1 weinhtc for a!! samplps was 3----
between 21 and 850 fg cell-'. In the growing cultures, the per cell dry matter content was 1 order of magni- tude higher than the dry matter content in native bac- teria. The lower part of the size range was made up by very small bacteria. A subpopulation of the 9 smallest bacteria, in terms of dry weight, was treated sepa- rately. This subpopulation, which was comprised of bacteria from 4 different samples, had a mean dry weight of 4 fg, 1.5 fg carbon and a mean volume of 0.04 pm3 Their mean N:C and P:C ratios were not sig-
nificantly different from the means of the pooled sam- ple (0.28 and 0.09, respectively). If we assume that all phosphorus in each of these cells (0.1 fg) was associ- ated with DNA, an amount of 1.2 fg DNA cell-' may be estimated. Most of the phosphorus is bound to the nucleic acid fraction (DNA and RNA). RNA:DNA ratios of cells will vary with growth rates and have been reported to be in the range of 1 to 10 (Skjold et al. 1973, Kato 1994). Therefore, a more realistic estimate for the DNA content would be less than 0.6 fg (genome size of <l000 kb). The weight of 1 Escherichia coli genome (9200 kb, or -0.5 fg P) is 6 fg. Genome sizes of 1.5 to 2 fg (-0.15 fg P) for nat~ve soil bacteria have been reported by Bakken & Olsen (1991). Similar sizes of bacteria have been reported previously by Psenner & Sommaruga (1992). Schut et al. (1993) isolated an ultramicrobacterium with a cell volume of 0.06 pm3 and a DNA content of 1 to 1.5 fg (-0.1 fg P), but in con- trast to Moyer & Morita (1989) it was concluded that these small cells were actively growing.
The C : dry matter ratio of native marine bacteria was generally lower than that for native freshwater bacte- ria due to a higher content of inorganic ions (Mg2', Cl-, Nat, K') in the marine bacteria (authors' unpubl. results). We found mean C:dry matter ratios in the range of 30 to 60% for the various samples; however, C :dry weight ratios as low as 10 % have been reported (Fry 1990).
Carbon-to-volume ratio
Mean C:volume ratios for the samples ranged from 32 to 160 fg pm-3 (Table 2). The lowest of these values is 1 order of magnitude lower than the values com- monly used for conversion between volume and car- bon (Table 4). The mean C:volume ratio for the pooled set of data (Fig 1) was estimated to be 63 f g C pm-3 which is also a value at the lower end of the C:volume ratios given in the literature (Table 4: Fry 1990). For the cultured bacteria, the C:volume values (Table 2) were in the same range as those determined earlier by use of the X-ray TEM method (Heldal et al. 1985, Nissen et al. 1987, Norland et al. 1987, 1995), and values deter- mined by Watson et al. (1977).
The highest C.volume ratio in native bacteria, 103 fg C pm-3, was found in the sample from Tvarminne. Growth conditions may influence the C:volume ratio. as seen for cells in the growing and stationary phases of Escherichia col1 and Vibrio natriegens. For E. coli, the C:volume ratio for stationary phase cells (160 fg C pm-3) was nearly twice that of growing cells (92 fg C pm-3). The reverse situation was found for V. natriegens with 67 fg C pm-3 and 100 fg C pm-3 for sta- tionary phase and growing cells, respectively.
Fagerbakke et al.. Elemental compos~tion of native and cultured bacteria 21
The low C:volume ratio of the sample from Knebel Vig (1992) may be explained by the relatively high content of inorganic ions in these cells (25% wt:wt; data not shown).
If we assume that the dry matter of bacteria living in water has a specific density of 1.2 pg pm-3 and that car- bon makes up 40% of this dry matter (Table l ) , we may calculate a water content of 84% for the sample from Raunefjorden in June which has a C:volume ratio of 78 fg C pm-"Table 2). This is a value close to the shrinkage seen in AFM for the same sample (see 'Dis- cussion: Cell volume' above). Most of the interest in the relation between carbon and volume stems from the need for a factor to convert biovolume into carbon. In fact, volume-to-carbon conversion enters the calcu- lations in most of the work done involving microbial pools and rates. From the variation among means in C:volume ratio shown in Table 2 it is obvious that a 'universal' conversion factor cannot be used without the risk of introducing a n error into one's estimates. The C:volume ratio is directly related to the water con- tent of the bacteria, which in turn depends on the osmotic conditions in the cell. Thus, w e think it is rea- sonable to assume that the C:volume ratio may vary over a fairly wide range.
The pooled set of data for carbon versus volume is presented in Fig. 1; the dashed line shows the regres-
sion line, while the solid line is drawn at 100 fg C pm-3. The scale coefficient of the regression equation (Eq. 4, Table 3) is significantly higher than 1, which means that the C:volume ratio is lower for the small bacteria than for the larger ones. This result apparently contra- dicts previous related studies (Lee & Fuhrman 1987, Norland et al. 1987, Psenner 1990). It should, however, be noted that the among-sample variation for C:vol- urne ratios is high (CV = 0.38; Table 3) , and the number of samples is low. The CV for the pooled sample was 59 %.
Nitrogen content
The mean values for nitrogen content in native bac- teria were found to range from 1.6 to 5 fg cell-' (Table 1). The pooled mean N:C value is 0.23 (molar C:N = 5:1), which is consistent with values reported previously (Nagata 1986, Goldman et al. 1987). As seen from Table 2, the marine bacteria had similar N:C ratios, around 0.24, which is close to the value of 0.27 reported by Lee & Fuhrman (1987). However, N:C val- ues of bacteria from marine environments have been reported to vary considerably and within a range from 0.07 to 0.35 (see Table 4 for further references). Assem- blages of marine bacteria, grown in batch cultures on
Table 4. C:volume ratios and relative content of nitrogen, phosphorus, and sulfur (wt.\vt) in bacteria. Data from the literature M: marine; B: estuarine/brackish; F: freshwater: S: soil; f : formaldehyde; g: glutaraldehyde
l
Bacteria analyzed Habitat Fixative fg C pm-' N:C P.C S:C Source
Native B, F 1% f 350 Bjarnsen (1986) Native F 2%f 154 Scavia & Laird (1987) Eschenchia col1 F O.l%g 126-132 Watson et al. (1977) P. putida, E. coli, B. subtihs M , F No 160-290 Bratbak & Dundas (1984) Enriched natlve M No 133-400 Simon & Azam (1989) Native B , M 2"#1 f 210-1610 0.11-0 4 1 Kroer (1994) Enriched native and native M 2"#, f 83-372 0.08-0.29 Kogure & Koike (1987) Alkaligens, Pseudomonas M No 155-292 0.17-0.35 Kogure & Koike (1987) Native F No 39-188 0.14-0.30 Nagata (1986) Native M 5 % f 280 0.27 Lee & Fuhrman (1987) Enriched native F l % f 150-170 0.1 1-0.21 0.017-0.040 Vadstein & Olsen (1989) Ennched native and P. putida B 50" g 560 0.15-0.22 0.005-0.16 Bratbak (1985) A globiforrnis and E. aerogenes S No 210-580 0.19-0.30 0.024-0.056 van Veen & Paul (1979) Enriched native M 136g 0.13-0.28 0.020-0.065 Goldman et a1 (1987) Cultured, unidentified F No 0.13-0.21 0.013-0.046 Vadstein (1995) Enriched native M No 0.07-0.26 0.006-0.083 Tezuka (1990) P. pu tida M No 0.15-0.26 0.016-0.074 Martinussen (1991) Cultured, unidentified F No 0.25 Finlay & Uhlig (1981) E. coli F No 90 0.105 Heldal et al. (1985) Enriched native F No 0.027-0.076 Jiirgens & Giide (1990) Enriched native M No 64-13fja 0.15-0.30 0.037-0.067 Tuomi et al. (1995) P. halodurans. A. luteo-violaceus M No 0.22-0.33 0.010-0.011 Cuhel et al (1981) C. lividurn. P. fluorescens and cultured native F No 0.004-0.012 Jordan & Peterson (1978)
"Calculated from data in the paper
22 Aquat Microb Ecol 10: 15-27, 1996
substrates with a range of N:C values (0.12 to 0.78), y~elded in the stationary phase cellular N:C values in the range 0.19 to 0.28 (Goldman et al. 1987). Grazer- Lampart et al. (1986), who supplied chemostat cultures of Hyphomicrobium with a range of reservoir N:C val- ues (0.05 to 0.78), found that when free N could be detected (reservoir N:C higher than ca 0.17) the bio- mass N:C was approximately 0.29, whereas when free C was available in the medium (reservoir N:C less than ca 0.09) the biomass N:C was approximately 0.19. Intermediate biomass N:C values were found when both N and C sources were depleted from the medium.
Lower N:C ratios were determ~ned for the bacteria from brackish and fresh waters (Table 2); 0.17 (Tvar- minne) and 0.20 to 0.22 (Lake Kalandsvatnet and Escherichia coli, stationary phase). Zweifel et al. (1993) found a N:C ratio of 0.22 for bacteria from the Baltic Sea, an area in which it has been suggested that bac- terial growth may be limited by nitrogen (Lignell et al. 1992). A higher N:C value (0.29) was found for grow- ing cells of E. coli (Table 2).
Nitrogen is predominantly associated with protein and nucleic acids, with N:C values of 0.32 and 0.46, respectively (Norland et al. 1995). Cellular N:C values much higher than 0.35 should, therefore, be difficult to envisage. Cells grown under conditions which allow storage of carbon may have low N:C and P:C ratios. Conversely, high N:C and P:C ratios may indicate car- bon limitation. Maaloe & Kjeldgaard (1966) have shown that RNA and protein content of bacteria increase with increasing growth rate. The differences found in N:C and P:C values between stationary and growing Escherichia col1 (Table 2) support such a dependency, whereas the data for Vibrio natriegens do not.
The pooled set of data for nitrogen versus carbon content measured at the single-cell level is shown in Fig. 2a, where the dashed line is the regression line and the solid line indicates the Redfield ratio. Table 3 shows the Type I1 regression equation (Eq. 5) for nitro- gen versus carbon based on log-transformed variables. The scale coefficient of Eq. 5 is not significantly differ- ent from unity, implying that no size dependence for N:C exists in our data. The pooled coefficient of varla- tic:: cf the ?!:C vs!~e is 0.44.
Phosphorus-to-carbon ratio
The mean phosphorus content of the bacteria from the samples varied from 0.47 to 31 fg cell-' (Table 1) . The P:C ratios for the various samples are given in Table 2 and vary from 0.040 to 0.090, with a pooled mean value for all samples of 0.052 (molar C:P = 50:1), which is approximately twice the ratio for P:C given by
Redfield et al. (1963) for algae. From the data pre- sented we find that a 'typical' molar C:N:P for bacteria is 50:10:1, a value similar to that found by Goldman et. al. (1987), i.e. 45:9:1. If all phosphorus in the cells were associated with nucleic acids, the mass fraction of nucleic acid in a typical bacterium would be -20% Excess phosphorus in bacteria is commonly stored as polyphosphate, but despite the fact that polyphosphate granules are easily seen in unstained bacteria in TEM (Kjeldstad et al. 1991), such granules were rarely ob- served in the samples included.
In Fig. 2b, phosphorus values are plotted versus car- bon for the pooled sample. The dashed line in Fig. 2b shows the regression line for the logarithmically trans- formed data, while the solid line is the Redfield ratio. A Type I1 regression equation for P versus C is given in Table 3 as Eq. (6). The scale factor indicates that the largest bacteria have a higher P:C ratio than the smaller ones. The coefficient of variation of the P:C ratio for the pooled samples is 0.58.
Oxygen-to-carbon ratio
The mean oxygen content of the native bacteria var- ied in the range of 4 to 9 fg cell-' for the samples included. The mean per cell values for both Vibrio natriegens and Escherichia coli dropped from 120 fg cell-' in the growth phase to 24 fg cell'' in the station- ary phase. In Table 2 the mean 0:C ratios are listed. For the native bacteria these ratios were in the range from 0.23 (Lake Kalandsvatnet) to 0.77 (Knebel Vig, 1992), with a pooled mean for the all samples of 0.37. Generally, this 0 : C ratio is too low to be explained within the limits of the accepted composition of the bacterial cell; the 0 : C of protein is 0.44 and IS even higher for nucleic acids and carbohydrates. The dis- crepancy is probably due to loss of oxygen during analysis (Norland et al. 1995). For E. coli we found a marked reduction of the 0 : C ratio from 0.35 for cells in the growth phase to 0.22 for cells in the stationary phase. In contrast, there was a slight increase in the 0 : C ratios from 0.34 for cells in the growth phase to 0.39 for cells in the stationary phase for V, natriegens. However. lower 0 : C values in the stationary phase are also found for other cultured bacteria and seem to be a general phenomenon (authors' unpubl. results). The lower 0 : C ratio of cells in the stationary phase may only partly be explained by their lower levels of phos- phorus and sulfur. Similarly, the high 0 : C ratio found for the sample from Knebel Vig in 1992 (0.77) can partly be explained by high P:C and S:C ratios in this sample.
Data for the single cell measurements of oxygen ver- sus carbon (Fig. 2c) are summarized in the equation for
Fagerbakke et al.: Elemental composition of native and cultured bacteria 23
the Type 2 regression of the 0 : C relationship (Table 3, Eq. 7) . The scale factor of 0.94 suggests that the 0 : C ratios are higher in small bacteria than in larger ones. One possible explanation for the low oxygen content found in some of these samples may be mass loss of oxygen under the electron beam (Norland et al. 1995). However, since this loss is expected to be dose-depen- d.ent, a greater loss should be expected in small bacte- ria.
The oxygen content of bacteria will give a measure of the oxidation level of the cells. The oxygen fraction of protein, carbohydrates, fats, nucleic acids and poly- phosphates are roughly 0.22, 0.53, 0.08, 0.31, and 0.61, respectively (Norland et al. 1995). One of the major intracellular reserve polymers is glycogen, a carbo- hydrate which may be accumulated in the cells during the stationary phase or under nutrient-limited growth conditions with an excess of carbon sources in the media (Preiss & Romeo 1989). Carbon limitation will most probably lead to a reduced cellular level of carbo- hydrates (glycogen), fats, nucleic acids (RNA), and protein in this order (Preiss & Romeo 1989 and refer- ences therein). The oxygen content of microorganisms is rarely reported in the literature. Luria (1960) re- ported a mass fraction of 0.2, estimated by difference.
Based on the results presented, we suggest that the 0 : C ratios of cells may be a signature for the physio- logical conditions of these cells.
Sulfur-to-carbon ratio
The mean sulfur content for the samples of native bacteria was in the range from 0.30 to 0.56 fg ce l l ' . For Vibrio natriegens and Escherichia coli 13 and 9 fg cell-' and 2.5 and 1.7 fg cell-' were found for growing cells and cells in the stationary phase, respectively (Table 1). The mean S:C ratio for pooled set of data is 0.031, with sample means ranging from 0.016 to 0.084 fg cell-' (Table 2). The high CV for the pooled sample is to some extent due to measurement errors caused by the low level of sulfur in the bacteria. The amounts of sulfur measured were close to the detection limit for the method used, and for about 6% of the cells sulfur was below the detection limit. S:C ratios in the range of 0.004 to 0.012 have been reported by others (Jordan & Peterson 1978, Cuhel et a1 1981). Cellular protein may contribute to the cellular S:C ratio in the range 0.005 to 0.015 (Jordan & Peterson 1978, Simon & Azam 1989). The high S:C ratio of 0.084 found in the bacteria from Knebel Vig in 1992 may partly be explained by a high cellular content of sulfate, since these cells also showed a high 0 : C ratio (0.77). Fur- thermore, a high correlation is found between 0 : C and S:C values; r = 0.81 for the pooled sample (data not
shown), suggesting that sulfur is associated with oxy- gen, e.g. as sulfate.
The high sulfur content in marine bacteria could be related to uptake of the compatible solute dimethylsul- foniopropionate (Dh4SP). DMSP is known to be pro- duced by some algae and are metabolized by bacteria (Kiene 1990, Kiene & Bates 1990, Ledyard et al. 1993). Two of the samples, Knebel Vig (1992) and Raunefjor- den (June 1993), were taken during blooms of Proro- centl-um minimun~ (Prorocentraceae) and Emiliania huxleyi (Prymnesiophyceae), respectively, and both these algae are known to produce DMSP (Matrai & Keller 1994). If similar DMSP concentrations as deter- mined in E. huxleyi (Malin et al. 1993) occur in marine bacteria, DMSP may contribute up to 0.03 to the bacte- rial S:C ratio.
For Escherichia coli, values of < l 5 mM cytoplasmic dissolved sulfur were found in cells grown at a salt con- centration of 0.5 M NaCl (Cayley et al. 1991). This sul- fur content can at the most account for -0.005 of the S:C ratio. However, the ratio we have determined (0.026) for growing E. c011 is higher than the sum of the 2 sulfur fractions based on the data from the literature. In addition, low molecular thiols may participate; how- ever, only low values (<5 mM) have been reported (Smirnova & Oktyabrsky 1995) and may explain approximately 0.001 of the S:C ratio.
Sources of variation
Among-group variance
For each of the ratios presented in Table 2, the among-samples coefficient of variation, CV,, was cal- culated using Eq. ( l ) , and the values are given in Table 3. The lowest CV, is found for N:C (0.12), a value substantially lower than the variation seen in the literature data (Table 4) . Nitrogen is mainly associated with protein and nucleic acids, macromolecules which make up a large fraction of the cellular material, and this will put constraints on the variability of the N:C value. The CV, is also low for P:C (0.24). The large dif- ference in relative variation between S:C, which has the highest CV, (0.61), and N:C shows that a major part of bacterial sulfur is not associated with protein. Furthermore, a high positive correlation between sul- fur and oxygen, which has a CV, of 0.38, suggests that much of this sulfur may be associated with oxygen, e.g. as SO,-2. A high relative variation (CV, = 0.38) was also found for the C:volume ratio, a value that, together with the values listed for the same ratio in Table 4, emphasizes the weak foundation upon which the idea of a universal conversion factor from volume to carbon rests.
24 Aquat Microb Eco:
Within-sample variance
The pooled within-samples coefficient of variation, CV,,, has been calculated using Eq. (2) and the values are given in Table 3. The values are in the range from 0.38 for 0 : C to 0.60 for S:C. The fact that the CV,, increases a s the ratio decreases (Tables 2 & 3) suggests that elements that make up a relatively large part of the cells' dry weight, like oxygen, are more con- strained in their relative variation than elements that make u p a smaller fraction, like sulfur. The C:volume ratio has a C V , of 0.46, the next highest of the ratios, implying that within a community a considerable vari- ability in water content exists.
Contribution from measurement error
In contrast to CV,, CV, includes random measure- ment errors. The within-sample variance for ratlos is the sum of 3 relative variances: the relative variance associated with measurement of carbon, the relative variance associated with the other variable (volume, nitrogen, etc.), and finally the inherent relative biolog- ical variance.
All ratios include carbon as either divisor or divi- dend. The major uncertainty in the measurement of carbon is the local varlation in the thickness of the sup- porting film (Norland e t al. 1995), implying that small bacteria with low mass thickness (i.e. low mass:area) will have a larger error associated with carbon than larger bacteria. This introduces a relative error with a CV of approximately 0.24 for the mean cell and increases to 0.50 for the smaller ones (e.g. Knebel Vig, 1992). About 10% of the bacterla in the pooled sample have a carbon mass thickness below the detection limit for carbon (10 fg C m-'). This error can be reduced by using a thlnner (in terms of carbon) and more even supporting film.
The relative errors associated with nitrogen, oxygen, phosphorus and sulfur are mainly determined by counting statistics (Norland et al. 1995) and are less important. Based on counts under the peaks and in their background, relative errors between 0.03 and n i ,,,, h, ,,+;,,+,A
,L An exception to :his 'GGS ~ i i l f i i i in the sample from Lake Kalandsvatnet, a sample com- prising small bacteria with a low sulfur content, that had a relative error of 0.3. The relative errors of the volume estimates have been d~scussed above. If the estimated contribution due to these 2 sources of rela- tive error is subtracted, the within-sample CVs listed in Table 3 will be reduced by a value between 0.05 (for S:C) and 0.08 (for 0 : C ) .
It can therefore be concluded that most of the rela- tive variation, e .g . seen as scatter around the regres-
sion lines in Figs. 1 & 2, is biological heterogeneity and is not a n artifact of the measurements. To our knocvl- edge, this is the first tlnie that such an extensive list of within-sample variation, based on measurements of single cells, has been presented.
'Elemental' diversity
The relative variation of the elemental composition within a sample may reflect aspects of the physiologi- cal regime in the bacterial community. To obtain a n index that expresses this diversity of the elemental composition, we have subjected each sample to a prin- cipal components analysis (PCA). PCA will replace the original axes (i.e. measured variables) with new orthogonal axes positioned to maximize the relative variation. Thls allows us to determine the 'volume' of the hyper-ellipsoid describing the sample. We used the CV corresponding to the radius in a hyper-sphere with the same 'volume' as a diversity index. This index is a CV that expresses how far from the mean vector the bacteria in the sample are. Vibrio natriegens and Escherichia coli samples had the lowest index, 0.14 and 0.22, and 0.17 and 0.27, for stationary and growing states, respectively. The native samples, however, ranged from 0.42 (Raunefjorden, June) to 0.60 (Tvar- minne). Native samples had a significantly higher diversity index than V natriegens and E. coli, and sam- ples from the stationary phase had a lower index than growing ones for laboratory-grown samples. A signifi- cant part of the heterogeneity seen in our data stems from differences in means between species. These indices should, hence, correlate with traditional spe- cies-based indices, e.g. the Shannon index. Communi- ties in stable environments tend to have a higher spe- cies diversity than communities exposed to seasonal or periodic perturbations (Odum 1971).
Canonical variate analysis
Canonical variate analysis is a multivariate statistical technique that maximizes the among-group variation - , , I - . & : . . - + ^ & ^ , - l ..--.-L:-- rr-..L.:--. L r ; k u L l v e C L L i ~ I I V I I . U , ( I ~ I I I C O I : presentatioiis based on the first 2 canonical axes show the best possi- ble separation of the groups (dispersion). In Fig. 3 sam- ple means of the 10 samples are plotted along with vectors presenting the direction and contnbution from the original variables to the dispersion. The first canon- ical axis, which explains 45 % of the dispersion, may be interpreted as a growth or actlvlty axis separating the growing laboratory cultures from the rest. This separa- tion is mainly brought about by differences in levels of nitrogen, phosphorus or sulfur, probably related to rel-
Fagerbakke et a1 Elementdl con~posltlon of natlve and cultured bacteria 25
atively more protein and nucleic acids in rapidly grow- ing samples. Stationary-phase laboratory cultures are intermediate between growing laboratory cultures and samples of native bacteria. The second canonical axis, which explains 30% of the dispersion, mainly sepa- rates the Knebel Vig (1992) sample with its high levels of oxygen and sulfur from the other samples.
Elemental content and physiological status
The chemical and, thus, the elemental composition of bacteria depends on growth conditions (Maaloe & Kjeldgaard 1966, Grazer-Lampart et al. 1986). Droop (1983) proposed a kinetic model for growth in which he assumes that the growth rate, p, depends on a internal surplus pool of nutrients and that it is controlled by the nutrients with a cell quota, Q, which is relatively clos- est to its minimum,Qo. The Droop model is given by the equation:
where p is growth rate and p , is maximal growth rate. Cell quota, Q, is expressed either on a per cell basis of element or relative to carbon. Q. is the minimum sub- sistence quota of the limiting factor, below which no growth occurs. On this basis more comprehensive models have been proposed, e.g. describing the rela- tionship between external substrate concentration, internal cell quota and growth rate under steady state conditions (Martinussen & Thingstad 1987, Thingstad 1987, Egli 1991). More than one nutrient may be depleted from the medium, but according to this model only a single nutrient may be limitlng growth; other nutrients may, however, control the composition of the biomass (Thingstad 1987).
Using chemostats with a range of N:C values in the reservoir, Grazer-Lampart et al. (1986) found that when only carbon was depleted from the medium the N:C value in the bacteria was 0.29, while when only nitrogen was depleted the N:C value of the bacteria was 0.18 to 0.20. Intermediate values were found when both nutrients were depleted. Similar values (0.31 and 0.18, respectively) may be calculated from Thingstad (1987). The sample means for N:C values reported in the present paper (Table 2) cover the same range. The above results suggests that the following rule of thumb may be used: if the cellular N:C value is 0.3 or higher, there should be free N in the environment; if the cellu- lar N:C value is below 0.2, the bacterial growth is lim- ited by the N supply. If we apply this to the present data, the bacteria in the sample from Tvarminne were growth-limited by nitrogen.
A wide range of Q. for phosphorus has been reported (Vadstein 1995); furthermore, it is well known
that bacteria store large amounts of phosphorus when it is available (luxury uptake). This implies that it is more difficult to make statements about physiological status based on cellular content for this element. How- ever, if we use a 'typical' Q. P:C value (Vadstein 1995) of 0.031, and if we assume that the native bacteria had a growth rate well below p,, we may conclude that the bacteria in our native samples were not P limlted. A possible exception might be the sample from Raune- fjord, October, which had a P:C value of 0.041. This sample showed a clear growth response following phosphorus addition (Tuomi et al. 1995).
Normally, N:C values and especially P:C values are high for native bacteria (Table 2) . Egli (1991) has shown that slow-growing bacteria have a high carbon demand. This suggests that the supply of carbon will control the bacterial composition, and even often limit their growth.
It has been shown by laboratory studies of bacterial growth that chemical composition and cell size are dependent on growth rate (Maaloe & Kjeldgaard 1966, Ingraham et al. 1983). In the discussion above we sug- gest that the relative cellular content of carbon, nitro- gen and phosphorus may point to which element is limiting bacterial growth or is controlling bacterial composition. Neither the data for elemental composi- tion presented here nor data from the literature, how- ever, are particularly useful when it comes to estimat- ing activity or growth rates. Our preliminary results, which suggest that the relative oxygen content is lower in stationary state cells than in exponential growing cells, will be pursued. A wider spectrum of elements than those con~monly dealt with (C, N and P) is required to approach the issue of the relationship be- tween elemental composition and bacterial activity.
Acknowledgements We thank T Frede Thingstad for critlcal r e a d ~ n g of the manuscript, P~r]o T u o m ~ for sampling the bac- teria from Tvarmlnne, J s rn T Karlsen for partlcipat~ng in s a m p l ~ n g at Lake Kalandsvatnet, Gunnar Bratbak for assis- tance w ~ t h the AFM measurements, and Knsten-Olal Fjeld- stad at Espegrend manne station for provld~ng the boat used d u r ~ n g s a m p l ~ n g in Rauneflorden We a re also grateful to Egil S Enchsen for h ~ s c o n t r ~ b u t ~ o n to the electron microscopy. done at the Laboratory for Electron M~croscopy (LEM) w i t h ~ n the Science Faculty of the U n ~ v e r s ~ t y of Bergen The AFM measurements were done at D ~ g ~ t a l Instrument's a p p l ~ c a t ~ o n laboratory, Breda The Netherlands T h ~ s work was supported by the Norwegian Research Counc~l ' s program for marlne pollution, contract no 104330 and MAS2-CT92-0031 (through Frede Thingstad to M H )
LITERATURE CITED
Bakken LR, Olsen RA (1991) DNA content of soil bac t e r~a of d~fferent slze So11 B101 Blochem 21 789-193
Bjornsen PK (1986) Automat~c detennatlon of bacterioplank-
26 Aquat M~crob Ecol 10: 15-27, 1996
ton biomass by image analysis. Appl environ Microbiol51: 1199- 1204
Bratbak G (1985) Bacterial biovolume and biomass estima- tions. Appl environ ~M~crob~ol 49,1488-1493
Bratbak G, Dundas I (1984) Bacterial dry matter content and biomass estimations. Appl environ Microbiol 48:755-757
Cayley S, Lewis BA. Guttman HJ, Record MT Jr (1991) Char- acterization of the cytoplasm of Escherichla colj K-12 as a function of external osmolarity. Implications for protein- DNA interactions in Vivo. J molec Biol 222:281-300
Cole J J , Findlay S, Pace ML (1988) Bacterial production in fresh and salt-water ecosystems a cross-system overview Mar Ecol Prog Ser 43:l-10
Cuhel RL, Taylor CD. Jannasch HW (1981) Assimilatory sulphur metabolism in marine microorganism: sulphur metabolism, proteln synthesis, and growth of Pseudo- monas halodurans and Alteromonas luteo-violaceus dur- ing unpertubed batch growth. Arch Microbiol 13018-13
Droop MR (1983) 25 years of algal growth kinetics. Botanica mar 26:99-112
Egli T (1991) On multiple-nutrient-limited growth of micro- organisms, with special reference to dual limitation by carbon drld nitroyen substrates. Antonie van Leeuwen- hoek 60,225-234
Fagerbakke KM, Heldal M, Norland S (1991) Variation in ele- mental content among and within trichomes in Nostoc cal- cicola 79WA01 measured by x-ray microanalysis. FEMS ~Microbiol Lett 81:227-232
Finlay BJ, Uhlig G (1981) Calorific and carbon values of marine and freshwater protozoa. Helgolander Meeresun- ters 34:401-412
Fry JC (1990) Direct methods and biomass estimation. In: Grigorova R, Norrls JR (eds) Methods in microbiology, Vol22. Academic Press, London, p 41-85
Fry JC. Zia T (1982) Viability of heterotrophic bacteria in freshwater. J gen Mlcrobiol 128:2841-2850
Goldman JC. Caron DA, Dennet MR (1987) Regulation of gross growth efficiency and ammonium regeneration in bacteria by C:N ratio. Limnol Oceanogr 32:1239-1252
Goldrnan JC, Dennet MR (1991) Ammonlum regeneration and carbon utilization by marine bacteria grown on mixed substrates. Mar Biol 109:369-378
Grazer-Lampart S, Egli T, Hamer G (1986) Growth of Hypho- microbium ZV620 In the chernostat: regulation of NH4+- assimilation enzymes and cellular composition. J gen Microbiol 132: 3337-3347
Heldal M, Norland S. Tumyr 0 (1985) X-ray microanalytic method for measurement of dry matter and elemental con- tent of Individual bacteria. Appl environ Microbiol 50: 1251-1257
Hobbie JE, Daley RJ, Jasper S (1977) Use of Nucleopore filters for countlng bactena by fluorescence microscopy. Appl environ Microblol33: 1225-1228
lngraham JL, Maaloe 0, Neidhardt FC (1983) Growth of the vdcie~idi ~ e i i . Sillduel A>>UC;O~S, i i i i . Sundi.r:aiid, MA
Jordan MJ, Peterson BJ (1978) Sulphate uptake as a measure- ment of bacter~al production. Limnol Oceanogr 23: 146-150
Jiirgens K, Giide H (1990) Incorperation and release of phos- phorus by planktonic bactena and phagotrophic flagel- lates. Mar Ecol Prog Ser 59:271-274
Kato K (1994) Planktonic bacterial DNA and RNA synthesis from algal extracellular products in a eutrophic lake. FEMS Mlcrobiol Ecol 15:291-298
Kell DB, Ryder HM, Kaprelyants AS, Westerhof HV (1991) Quantifying heterogeneity: flow cytometry of bacterial cultures. Antonie van Leeuwenhoek 60:145-158
Kiene RP (1990) Dimethyl suphide production from dimethyl- sulfoniopropionate in coastal seawater samples and bacte- nal cultures. Appl environ M~crobiol 56:3292-3297
Kiene RP, Bates TS (1990) Blologicdl re1110vd1 uf d~lnt,thyl sul- phide from seawater. Nature 345:702-705
Kjeldstad B, Heldal M, Nissen H, Evjen K (1991) Changes in polyphosphate composition and localization in Propione- bactenum acnes after near-ultrav~olet ~rradiation. Can J Microbiol 37:562-567
Kogure K, Koike I (1987) Particle counter determination of bacterial biomass in seawater. Appl environ Microbiol53: 274-277
Kroer N (1994) Relationship between biovolume and carbon and nitrogen content of bacterioplankton. FEMS Micro- biol Rev 13:217-224
Ledyard KM, DeLong EF, Dacey JWH (1993) Characterization of a DMSP-degrading bacterial isolate from the Sargasso Sea. Arch Microbiol 160~312-318
Lee S. Fuhrman JA (1987) Relationships between biovolume and biomass of naturally derived marine bacterioplank- ton. Appl environ Microbiol 53:1298-1303
Lignell R, Kaitala S, Kuosa H (1992) Factors controlling phyto- and bacterioplankton in late spring on a salinity gradient in the northern Baltic. Mar Ecol Prog Ser 84: 121-131
Luria SE (1960) The bacterial protoplasm: composition and organization. In: Gunsalus. IC, Stainer RY (eds) The bacte- ria, Vol 1. Academic Press, Inc, New York, p 1-34
Maaloe 0, Kjeldgaard NO (1966) Control of macromolecular synthesis. WG Benjamin, New York
Malin G. Liss STP, Holligan P. Harbour D (1993) Dimethyl sul- phide and dimethylsulphoniopropionate in the north east Atlantic during the summer coccolithophore bloom. Deep Sea Res Part 1 Oceanogr Res Pap 40:1487-1508
Martinussen 1 (1991) Roles of heterotrophic bacteria in the cycling of carbon, nitrogen and phosphorus in the marine pelagic environment. Dr scient thesis, University of Berg en
Martinussen I, Thingstad TF (1987) Utilization of N, P and organic C by heterotrophic bacteria. 11. Comparison of experiments and a mathematical model. Mar Ecol Prog Ser 37:285-293
Matrai PA, Keller MD (1994) Total organic sulfur and di- methylsulfoniopropionate in marine phytoplankton: intra- cellular variat~ons. Mar Biol 119:61-68
Morris DP, Lewis WM J r (1992) Nutrient limitation of bac- terioplankton growth in Lake Dillon, Colorado. Limnol Oceanogr 37.1 179-1 192
Moyer CL, Mor~ta RY (1989) Effect of growth rate and starva- tion-survival on the viability and stability of psychrophilic marine bacteria. Appl environ Microbiol 55:2710-2716
Nagata T (1986) Carbon and nitrogen content of natural planktonic bacteria. Appl environ Microbiol 52:28-32
Nissen H, Heldal M, Norland S (1987) Growth, elemental comi;o;i:Ion ;r;d !=:E;?-::=:: D! pc!yphcsphate hcdies !R
Vlbrio natnegens cultures shifted from phosphate-limited to phosphate-pulsed media. Can J Microbiol 33:583-588
Norland S, Fagerbakke KM, Heldal M (1995) Light element analysis of individual bacteria using X-ray microanalysis. Appl environ Microbiol 61:1357-1362
Norland S, Heldal M, Tumyr 0 (1987) On the relation be- tween dry matter and volume in bacteria. Microbiol Ecol 13:95-101
Odum E 0 (1971) Fundamentals of ecology WB Saunders Company, Ph~ladelph~a
Parnas H (1975) Model for decomposition of organic material by microorganisms. Soil Biol Biochem 7: 161-169

Fagerbakke et al.: Elemental composit~on of native and cultured bacteria 2 7
Preiss J , Romeo T (1989) Physiology, biochemestry and genet- ics of bacterial glycogen synthesis. Adv microb Physiol30: 183-238
Psenner R (1990) From image analysis to chemical analysis of bacteria: a long term study Limnol Oceanogr 35:234-237
Psenner R , Sommaruga R (1992) Are rapid changes in bacter- ~ a l biomass caused by shifts from top-down to bottom-up control. Limnol Oceanogr 35:1092-1100
Redfield JL, Ketchum BH, R~ckards FA (1963) The infuence of organisms on the composition of seawater. In: Hill MN (ed) The sea. John Wiley & Sons, New York, p 26-77
Scavia D, Laird GA (1987) Bacterioplankton in Lake h4ichi- gan: dynamics, control, and significance to carbon flux. Limnol Oceanogr 32:1017-1033
Schut F, deVries EJ, Gottschal JC, Robertson BR. Harder W, Prins RA, Button DK (1993) Isolation of typical marine bac- teria by dilution culture: growth, maintenance, and char- acteristics of isolates under laboratory conditions. Appl environ Microbiol 59:2150-2160
Simon M, Azarn F (1989) Protein content and protein synthe- sis rates of planktonic marine bacteria. Mar Ecol Prog Ser 51:201-213
Skjold AC, Jaurez H, Hedgcoth C (1973) Relationships among deoxyribonucleic acide, ribonucleic acid, and spesific transfer ribonucleic acid in Escherichia coli 1 5 T at various growth rates. J Bacterial 115:177-187
Smirnova G, Oktyabrsky 0 (1995) Betain modulates intracel- lular thiol and potassium levels in Escherichia coli in medium with high osmolarity and alkaline pH. Arch Microbiol 163:76-78
Tezuka Y (1990) Bacterial regeneration of ammonium and phosphate as affected by the carbon:nitrogen:phosphorus ratio of organic substrates. Microb Ecol 19:227-238
Responsible Subject Ed~tor. T. H Blackburn, Aarhus, Denmark
Thingstad TF (1987) Utilization of N, P, and organic C by het- erotrophic bacteria. I. Outline of a chemostat theory with a consistent concept of 'maintenance' metabolism. Mar Ecol Prog Ser 35:99-109
Tuomi P, Fagerbakke KM, Bratbak G , Heldal h4 (1995) Nutri- tional enrichment of a microbial community: the effects on activity, elemental composition, community structure and virus production FEMS Mici-obiol Ecol 16:123-134
Vadstein 0 (1995) The role of heterotrophic, planktomc bac- teria in the cycling of phosphorus in lakes: phosphorus requirements, competitive ability and food web interac- tions. DPhil thesis, University of Trondheim, Norway
Vadstein 0, Jensen A, Olsen Y, Reinertsen H (1988) Growth and phosphorus status of limnetic phytoplankton and bac- teria. Limnol Oceanogr 33:489-503
Vadstein 0, Olsen Y (1989) Chemical composition and phos- phate uptake kinetics of limnetic bacterial communities cultured in chen~ostates under phosphorus limitation. Limnol Oceanogr 34.939-946
van Veen JA, Paul EA (1979) Conversion of biovolume mea- surements of sol1 organisms, growth under various mois- ture tensions, to biomass and their nutrient content. J Bac- teriol 37:686-692
Watson SW, Novitsky TJ, Quinby HL, Valois FW (1977) Determination of bacterial number and biomass in the marine environment. Appl environ Microbiol 33:940-946
Zweifel UL. Hagstrom A (1995) Total counts of marine bacteria include a large fraction of non-nucleotid- containing bacteria (ghosts). Appl environ Microbiol 61: 2180-2185
Zweifel UL, Norrman B, Hagstrom A (1993) Consumption of dissolved organic carbon by marine bacteria and demand for inorganic nutrients. Mar Ecol Prog Ser 101:23-32
Manuscript first received: September 15, 1995 Revised version accepted. October 31, 1995