contamination assessment and remediation of the ... · and resolve the fine-scale wind field...
TRANSCRIPT
www.crccare.com
Cooperative Research Centre for Contamination Assessment and Remediation of the Environment
Advanced Lidar Port Hedland dust study: Broadscale, real-time dust tracking and measurement
TECHNICAL REPORT NO.33

Cooperative Research Centre for Contamination Assessment and Remediation of the Environment, Technical Report series, no. 33 June 2014 Copyright © CRC CARE Pty Ltd, 2014 This book is copyright. Except as permitted under the Australian Copyright Act 1968 (Commonwealth) and subsequent amendments, no part of this publication may be reproduced, stored or transmitted in any form or by any means, electronic or otherwise, without the specific written permission of the copyright owner. ISBN: 978-1-921431-49-4
Enquiries and additional copies: CRC CARE, PO Box 486, Salisbury South, South Australia, Australia 5106 Tel: +61 (0) 2 4985 4941 Fax: +61 (0) 8 8302 3124 www.crccare.com This report should be cited as: CRC CARE 2014, Advanced Lidar Port Hedland dust study: Broadscale, real-time dust tracking and measurement, CRC CARE Technical Report no. 33, CRC for Contamination Assessment and Remediation of the Environment, Newcastle, Australia. Disclaimer: This publication is provided for the purpose of disseminating information relating to scientific and technical matters. Participating organisations of CRC CARE do not accept liability for any loss and/or damage, including financial loss, resulting from the reliance upon any information, advice or recommendations contained in this publication. The contents of this publication should not necessarily be taken to represent the views of the participating organisations. Acknowledgement: CRC CARE acknowledges the contribution Francois Jeaneret (Curtin University), John Sutton (Aeolius Wind Systems) and Frank Yu (Curtin University) towards the writing and compilation of this report.
CRC for Contamination Assessment and Remediation of the Environment
Technical Report no. 33
Advanced Lidar Port Hedland dust study: Broadscale, real-time dust tracking
and measurement June 2014
CRC CARE Technical Report no. 33 i Advanced Lidar Port Hedland dust study: Broadscale, real-time dust tracking and measurement
Executive summary
A study was conducted in Port Hedland, Western Australia to evaluate the performance of a Coherent Doppler Lidar (Light Detection and Ranging; also known as ‘laser radar’) system for monitoring dust emissions and wind fields. The results confirmed that the technology is suitable for use in operational settings to identify dust emission sources, track dust plumes, and resolve the fine-scale wind field dynamics responsible for dust transportation and community exposure.
A novel technique to derive PM10 particle concentration estimates was demonstrated. The accuracy of the technique was confirmed using a calibration procedure where PM10 data from beta attenuation monitoring (BAM) dust monitors were compared to Lidar signal intensity. The technology offers the potential to obtain detailed information on PM10 concentration levels at high spatial and temporal resolution in near real time - the equivalent to a virtual network of thousands of point dust monitors scattered over the Port Hedland area.
The field measurement identified the presence of intense dust plumes arising from ship loading operations. The plumes were directed over the West End precinct of the Port Hedland town site under the prevailing SSE wind conditions during the three week monitoring period. The PM10 concentration levels were estimated at 450+ µg/m3., or potentially up to nine times the NEPM standard, and seven times the Interim Guideline Value recommended by the Port Hedland Dust Management Taskforce. It is noted that the guideline value does not apply in the West End of Port Hedland. Hence there are no existing controls in place to regulate dust impacts on local residents.
The technology can potentially be used for multiple applications at ports and mine sites including routine monitoring, health risk and occupational safety studies, validation of modelling, evaluating dust mitigation strategies, and for over the fence monitoring.
A proposal to develop an expert system to assist industry with managing the dust challenge is proposed. The system would comprise a fully autonomous Lidar system with tailored data post-processing software to provide real time information on relevant dust and atmospheric parameters. The data products could be streamed in real time to a central management authority, and/or to individual companies for interpretation and action, as appropriate.
Suggestions are forwarded on a new policy framework based on Continuous Improvement. The framework will broaden the regulatory basis for managing emissions and provide government and industry with flexibility to address the challenge in a practical and cost-effective manner.
CRC CARE Technical Report no. 33 ii Advanced Lidar Port Hedland dust study: Broadscale, real-time dust tracking and measurement
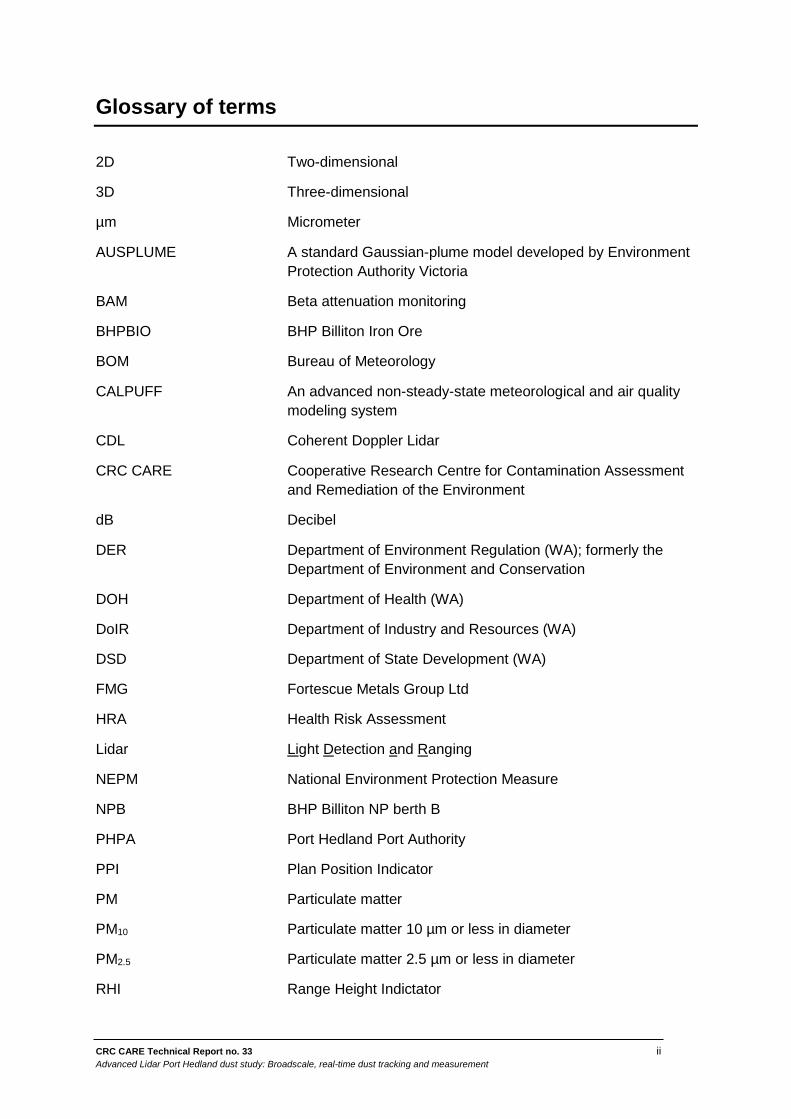
Glossary of terms
2D Two-dimensional
3D Three-dimensional
µm Micrometer
AUSPLUME A standard Gaussian-plume model developed by Environment Protection Authority Victoria
BAM Beta attenuation monitoring
BHPBIO BHP Billiton Iron Ore
BOM Bureau of Meteorology
CALPUFF An advanced non-steady-state meteorological and air quality modeling system
CDL Coherent Doppler Lidar
CRC CARE Cooperative Research Centre for Contamination Assessment and Remediation of the Environment
dB Decibel
DER Department of Environment Regulation (WA); formerly the Department of Environment and Conservation
DOH Department of Health (WA)
DoIR Department of Industry and Resources (WA)
DSD Department of State Development (WA)
FMG Fortescue Metals Group Ltd
HRA Health Risk Assessment
Lidar Light Detection and Ranging
NEPM National Environment Protection Measure
NPB BHP Billiton NP berth B
PHPA Port Hedland Port Authority
PPI Plan Position Indicator
PM Particulate matter
PM10 Particulate matter 10 µm or less in diameter
PM2.5 Particulate matter 2.5 µm or less in diameter
RHI Range Height Indictator
CRC CARE Technical Report no. 33 iii Advanced Lidar Port Hedland dust study: Broadscale, real-time dust tracking and measurement
SSE South-southeast
TSP Total suspended particulate matter (all particles with an aerodynamic diameter of approximately 100 µm or less)
US EPA United States Environment Environmental Protection Agency
USA United States of America
UTC Coordinated Universal Time
VAD Velocity Azimuth Display
WA Western Australia
WRF model Weather Research and Forecasting model
CRC CARE Technical Report no. 33 iv Advanced Lidar Port Hedland dust study: Broadscale, real-time dust tracking and measurement
Contents
Executive summary i Glossary of terms ii Contents iv
1. Introduction 1
2. Port Hedland dust management challenges 2
2.1. CRC CARE Dust Workshop 2 3. Aim and scope of the project 4
4. Lidar technology and applications 5
4.1. Previous experiences 5 5. Lidar deployment at Port Hedland 7
5.1. Site selection and installation 7
5.2. Data acquisition and filtering 7
5.3. Data referencing 9 6. Source identification 10
6.1. Potential dust sources 10
6.1.1. Background particulate material 10
6.1.2. Local industrial activities 10
6.2. Source mapping 10
6.3. Case study 12 7. Dust concentration levels 16
7.1. Measurement validation 16
7.2. Dust concentration estimates 16
7.3. Measurement uncertainty 17 8. Dust dispersion modelling 19
9. Model skill verification using Lidar 21
10. Fine-scale meteorology 23
10.1. Monitoring network 23
10.2. Lidar wind measurement 23
10.3. Lidar Wind products 24
10.3.1. Wind roses 24
10.3.2. VAD analysis 26
10.3.3. Two-dimensional wind retrieval 26
10.3.4. Detection of localised wind structures 27 11. Pathway forward 29
12. References 35
CRC CARE Technical Report no. 33 v Advanced Lidar Port Hedland dust study: Broadscale, real-time dust tracking and measurement
Appendices
Appendix A. Port Hedland Dust Workshop – Port Hedland Health Risk Assessment
36
Appendix B. Proposed air monitoring program 37
Appendix C. Halo Photonics Doppler Lidar 39
Appendix D. CRC CARE previous Doppler Lidar field investigation 41
Appendix E. Examples of Lidar raw signals 43
Appendix F. Backscatter values at NPB emission source 46
Appendix G. Scanning strategy for Lidar calibration 48
Appendix H. Uncertainties and technology evaluation 50
Appendix I. Instrumental accuracy/resolution 52
Appendix J. Lidar-derived and anemometers wind comparison 53
Appendix K. Detection of localised wind structures 58
Appendix L. VAD analysed time series output 61
Tables
Table 1. Mean wind speed and direction difference between Lidar and anemometers
27
Table 2. NPB loading zone coverage by the Lidar beam in Lidar coordinates
47
Figures
Figure 1. Scanning Doppler Lidar 5
Figure 2. The scanning blind spots for the two Lidar scanning positions 8
Figure 3. Examples of dust sources and plume behaviour under a range of operational and meteorological conditions
11-12
Figure 4. Port Hedland Inner Harbor 13
Figure 5. Lidar backscatter time series of the NPB loading zone for week 3 of the deployment period superimposed on columns representing periods where a ship was at berth
14
Figure 6. Lidar-derived dust concentration estimate under calm wind conditions
17
Figure 7. Base case scenario (2004-2005): maximum predicted 24-hour average PM10 ground level concentrations
19
Figure 8. Contour colour scale stretch from < 20 µg/m3 to 120 µg/m3 22
Figure 9. Wind rose at 38 m above sea level 24
CRC CARE Technical Report no. 33 vi Advanced Lidar Port Hedland dust study: Broadscale, real-time dust tracking and measurement
Figure 10. Wind rose at 12m above sea level 25
Figure 11. Wind rose at Port Hedland Airport’ June–August 2004/2005 25
Figure 12. VAD wind profile on 18 August 2011 26
Figure 13. Retrieved wind speed and vectors at above Lidar and backscatter intensity PPI at 0o elevation scan
27
Figure 14. Schematic of expert system for managing dust in Port Hedland 32
Figure 15. Picture of the Doppler Lidar 39
Figure 16. Lidar plots showing horizontal scans of a) backscatter intensity and b) radial wind velocity on 12 December 2008
41
Figure 17. Two-dimensional horizontal wind speeds with wind vector overlay – Composite 45 metre terrain-following wind speed maps (July and October-November 2009)
42
Figure 18. Backscatter pseudo colour plots of PPI scans at different times of deployment
43
Figure 19. Example of Lidar PPI with high levels of dust (PM10) 44
Figure 20. Examples of PPI stack with seven layers during the first week of deployment
44-45
Figure 21. Schematic top view of the Lidar beam pointing at NPB loading zone and the range gates overlapping the ship
47
Figure 22. Schematic view of three beams over the Moore St Station 48
Figure 23. Harbour station: best least square solution of Lidar backscatter signal to overlap the BAM PM10 concentration over the first week of operation
49
Figure 24. Time series of wind speed and direction comparison between Lidar and anemometer at Wilson Street
54
Figure 25. Time series of wind speed and direction comparison between Lidar and anemometer at Harbour Street
55
Figure 26. Time series of wind speed and direction comparison between Lidar and anemometer at Hospital
56
Figure 27. Linear regression of the wind direction comparison 57
Figure 28. An incoming breeze in a thin layer from the ocean to the port around 14:30 UTC was captured by Lidar
59
Figure 29. An incoming breeze in a thin layer from the ocean to the port around 15:05 UTC was captured by Lidar
60
Figure 30. Time series of VAD analysed results over the experimental period at Port Hedland
61-62
CRC CARE Technical Report no. 33 1 Advanced Lidar Port Hedland dust study: Broadscale, real-time dust tracking and measurement
1. Introduction
Air quality is a major issue in Australia. The Australian federal government seeks to protect and improve air quality through national action to reduce emissions of air pollutants that pose threats to human health and the environment. Airborne particulate matter (PM) or dust is one of the many pollutants that contribute to air quality degradation. PM is the sum of all solid and liquid particles suspended in air, many of which are hazardous. The effects associated with exposure to ambient particulate matter include premature mortality, aggravation of respiratory and cardiovascular disease and increased risk of myocardial infarction. Recent epidemiological studies estimate that exposures to PM may result in tens of thousands of excess deaths per year, and many more cases of illness among the US population (US EPA).
Particulate matter can consist of sea salts, pollens, smoke and minerals. It is commonly categorised according to the size of the particles: 1) total suspended particulate matter (TSP), which is all particles with an aerodynamic diameter of approximately 100 µm or less; 2) PM10, particles with a diameter < 10 µm; and 3) PM2.5, particles below 2.5 µm in diameter. Research on health effects has focused increasingly on particles that are 10 micrometres in diameter or smaller (PM10) because those are the particles that generally pass through the throat and nose and enter the lungs.
Significant resources are directed by the mining industry in Australia and overseas towards managing PM exposure to their workforce and local communities. Mining by its nature has the potential to generate high levels of ambient dust during the extractive processes, processing, transporting and shipping through sea ports.
CRC CARE Technical Report no. 33 2 Advanced Lidar Port Hedland dust study: Broadscale, real-time dust tracking and measurement
2. Port Hedland dust management challenges
The task of maintaining acceptable dust levels at the iron ore export facilities in Port Hedland, Western Australia is challenging. The port has experienced extraordinary growth in the last ten years as global demand for minerals increased. Iron ore bulk handling facilities in the inner harbour, including train unloading, crushing and screening, stockpiling and ship loading, generate high amounts of airborne particulate matter that impact on local residential and business facilities. Dust levels regularly exceeded standards adopted by the National Environment Protection Measures (NEPM) for PM10, PM2.5 and State Government guidelines for TSP. The extent of the challenge is underlined by the fact that there were 120 exceedances of the PM10 standard in 2008. The allowable limit under the NEPM is 5 (DSD 2010). The monitoring data at the port also show that the PM2.5 Advisory Standard is also exceeded frequently.
In March 2010, the Western Australian government released an interim guidance document entitled The Port Hedland Air Quality and Noise Management Plan (DSD 2010). The plan was developed by the Port Hedland Dust Management Taskforce, a body established to develop a comprehensive approach to managing dust and noise, improving air quality and managing impacts. The Taskforce was chaired by the Department of State Development (DSD) and comprised representatives of the Town of Port Hedland, the Port Hedland Port Authority (PHPA), iron ore exporters including BHP Billiton Iron Ore (BHPBIO), Fortescue Metals Group Ltd (FMG) and Hancock Iron Ore, and government agencies including Health, Planning, and Environment and Conservation1.
The plan addressed a range of policy and technical issues and contained recommendations for further investigation and research. The Taskforce identified five broad themes for action including:
• Health risk assessment – to identify the level of risk posed by dust to Port Hedland residents.
• Environmental management controls – to determine appropriate air quality assessment criteria for Port Hedland and set a target for monitoring, assessing and managing air quality and noise through an integrated monitoring program.
• Land use planning – to include a structure plan and strategy that incorporates planning controls.
• Industry initiatives – to develop and implement management plans, and reporting to the community, and
• Governance – to assign clear responsibilities for implementation and reporting of the Plan.
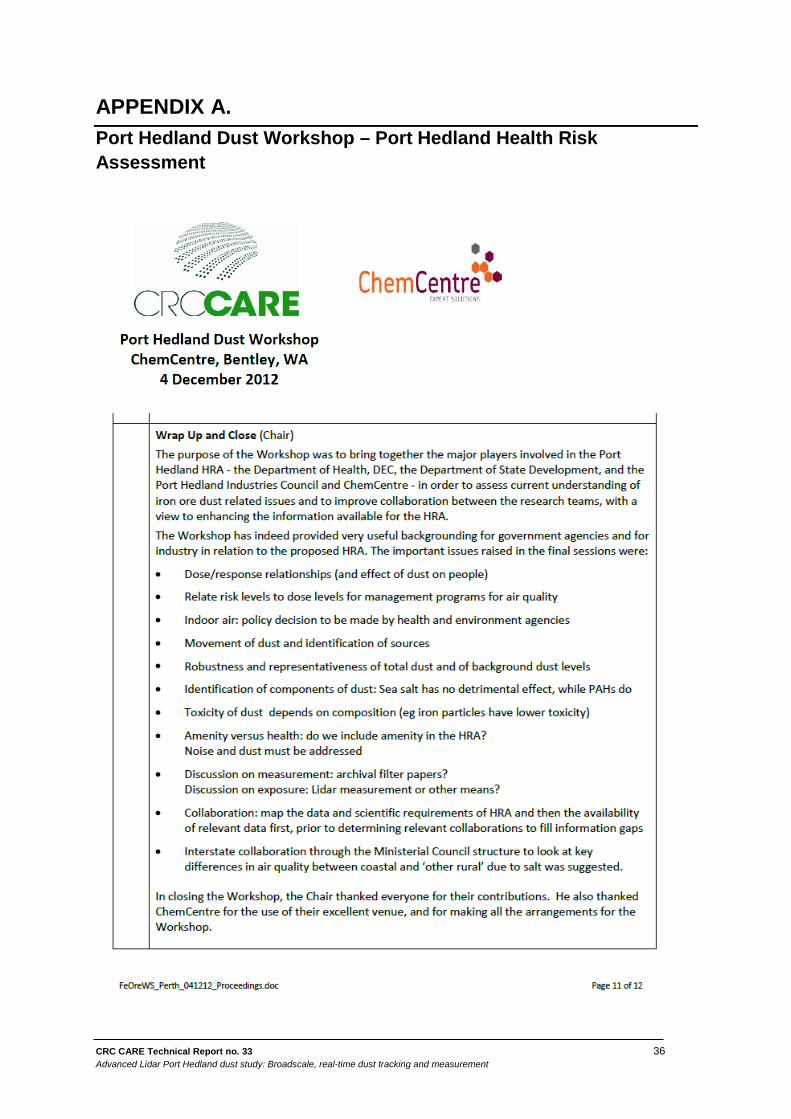
2.1. CRC CARE Dust Workshop
A technical workshop organised by the Cooperative Research Centre for Contamination Assessment and Remediation of the Environment (CRC CARE) was held in December 2012 to discuss the status of current policy and research initiatives relevant to the Port Hedland

CRC CARE Technical Report no. 33 3 Advanced Lidar Port Hedland dust study: Broadscale, real-time dust tracking and measurement
Health Risk Assessment (HRA). The meeting was attended by key organisations involved in HRA including the Department of Health (DOH), the (now) Department of Environment Regulation (DER), the DSD, the Port Hedland Industry Council, BHPBIO, FMG, CRC CARE and the ChemCentre. Key issues arising from the discussions are summarised in Appendix A and include:
• Limited knowledge of the level of iron ore dust exposure to the local population, dose response relationships and toxicity. The possibility of using emerging technologies including Lidar to provide quantitative data on exposure was considered.
• Technical limitations with ambient dust modelling. DER indicated that the dispersion model (AUSPLUME) used by industry for estimating the PM10 exceedances was obsolete and that a non-steady state model such as CALPUFF is more appropriate. The department also identified the following: the requirement to incorporate emissions estimates from proposed Outer Harbour operations into the modelling; develop a consistent and technically defensible emission estimates criteria to be used by industry proponents; and the need to consider the conditions in the western end of the town.
• Need for an enhanced and technically defensible monitoring plan. A key recommendation of the 2010 Port Hedland Taskforce report was the establishment of a local air quality management plan to monitor and assess air quality. The Taskforce recommended the use of an interim guideline measure for air quality for PM10 of 70 µg/m3 (24 hours average) with 10 exceedances per calendar year. The interim guideline was set for a five-year period with the expectation that it would be modified to reflect new evidence-based data on health impacts arising from investigations (Appendix B). Surprisingly, the guidelines did not include air quality criteria for areas of the Port Hedland town site (i.e. the West End) which is subject to the highest dust impacts).
The meeting also discussed progress in implementing the Taskforce’s recommendations on the following:
• Ambient Air Monitoring Network to address the low spatial resolution of existing meteorological and dust concentration data.
• Industry Fence-line Monitoring Program to identify the source, extent and concentration of dust plumes from individual companies. An arrangement of point monitors aligned upwind and downwind of the primary particle sources was proposed.
• Targeted research to address information gaps and provide detailed insight into the major sources of particles emissions, dust transportation processes, and the cost-effective dust management and monitoring strategies.
Whilst installation of additional monitoring instruments will provide improved information on dust behaviour across the broader geographic area, limitations with current point monitoring techniques will lead to ongoing uncertainty regarding: model skill accuracy; the severity and extent of community exposure to localised dust events; and the effectiveness of dust mitigation strategies. Ideally near real-time monitoring of dust at high spatial and temporal resolution across the port facilities is required to achieve the above objectives.
CRC CARE Technical Report no. 33 4 Advanced Lidar Port Hedland dust study: Broadscale, real-time dust tracking and measurement
3. Aim and scope of the project
The aim of this project is to demonstrate the viability of using a commercially available Coherent Doppler Lidar system at Port Hedland for:
• Identifying key emission sources in the inner harbour and tracking plumes
• Measuring dust concentration levels in plumes and the ambient environment, and
• Resolving the fine scale wind field dynamics responsible for dust transportation and exposure.
It should be noted that the project was not designed to undertake a large-scale, systematic assessment of the dust management challenge at the Port. This task requires detailed planning and resourcing by industry stakeholders and is outside the scope of the CRC CARE project.
CRC CARE Technical Report no. 33 5 Advanced Lidar Port Hedland dust study: Broadscale, real-time dust tracking and measurement
4. Lidar technology and applications
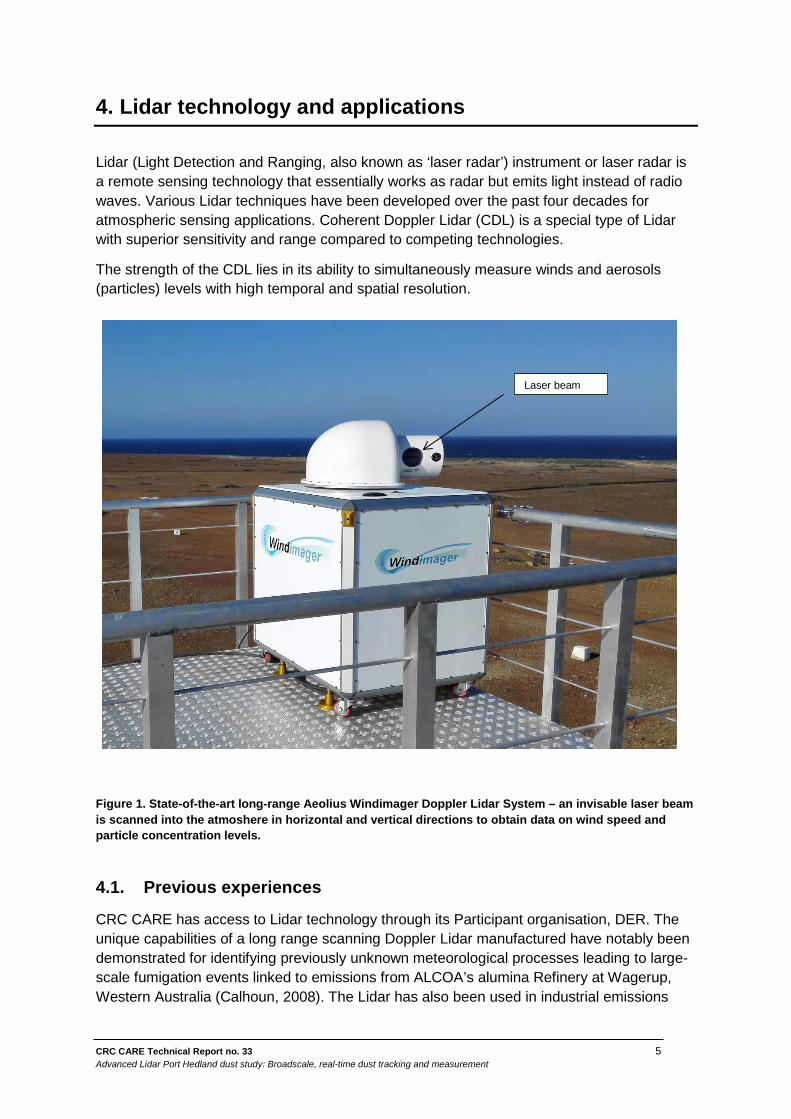
Lidar (Light Detection and Ranging, also known as ‘laser radar’) instrument or laser radar is a remote sensing technology that essentially works as radar but emits light instead of radio waves. Various Lidar techniques have been developed over the past four decades for atmospheric sensing applications. Coherent Doppler Lidar (CDL) is a special type of Lidar with superior sensitivity and range compared to competing technologies.
The strength of the CDL lies in its ability to simultaneously measure winds and aerosols (particles) levels with high temporal and spatial resolution.
Figure 1. State-of-the-art long-range Aeolius Windimager Doppler Lidar System – an invisable laser beam is scanned into the atmoshere in horizontal and vertical directions to obtain data on wind speed and particle concentration levels.
4.1. Previous experiences
CRC CARE has access to Lidar technology through its Participant organisation, DER. The unique capabilities of a long range scanning Doppler Lidar manufactured have notably been demonstrated for identifying previously unknown meteorological processes leading to large-scale fumigation events linked to emissions from ALCOA’s alumina Refinery at Wagerup, Western Australia (Calhoun, 2008). The Lidar has also been used in industrial emissions
Laser beam

CRC CARE Technical Report no. 33 6 Advanced Lidar Port Hedland dust study: Broadscale, real-time dust tracking and measurement
studies to track the propagation of dust and gas emissions at a major cement manufacturing facility in the Perth metropolitan area (Sutton, 2009).
The project team has also deployed a CDL to assess the wind energy resource at the site of the world’s largest wind energy development in northern Kenya (CRC CARE, 2012). The Lake Turkana Wind Power Consortium is planning to construct the world’s largest wind farm consisting of 365 wind turbines to supply up to 30% of Kenya’s current energy. More information about these field investigations is shown in Appendix D.
CRC CARE Technical Report no. 33 7 Advanced Lidar Port Hedland dust study: Broadscale, real-time dust tracking and measurement
5. Lidar deployment at Port Hedland
A compact CDL developed by Halo Photonics (product name is Stream Line) was selected for the field measurement. The instrument is designed for measuring laser radiation backscattered from atmospheric aerosols with a range of approximately 4 km. The lidar detects the Doppler shift of the return and therefore the line-of-site component of the particles velocity or wind speed. It is equipped with a scanner system with 360 degrees horizontal (azimuth) and 180 degrees vertical (elevation) scanning capabilities. Details of the product can be found in Appendix C.
The University of Notre Dame, Indiana, USA was approached to participate in the field measurement using its recently acquired Lidar. The portability of the compact Lidar made it an attractive option for mounting on an elevated platform at the Port.
Prior to transporting the instrument to the site, its performance was evaluated against the more powerful Lockheed Martin system in Fremantle. The trial compared aerosol backscatter and radial wind speed data from the two systems over a six day period. The results confirmed that the Halo Lidar met the minimum operational requirements for the application – it had sufficient range and scanning capability to achieve the required data, and demonstrated its reliability in operating autonomously over extended periods of time under challenging environmental conditions.
5.1. Site selection and installation
Two potential locations for operating the Lidar were identified during a visit to Port Hedland in July 2011. Both sites permitted elevated views over the town site and the wider landscape including views over the iron ore and minerals storage and loading areas and the West End residential area. The first location was a high metal tower episodically used for telecommunication purposes, and the second was the PHPA building. Although both sites were considered suitable for the exercise the PHPA tower was selected for security purposes and access to the computer network and power grid.
The Lidar was installed on the viewing platform of the PHPA on 15 August 2011, thirty meters above the ground using a large crane. The Port Authority provided assistance with the installation and resolving logistical and operational challenges. Following installation the Lidar was tested to ensure its functionality under local conditions.
5.2. Data acquisition and filtering
The Lidar scanning strategy comprised four routines: a series scan through azimuth at constant elevation (termed Plan Position Indicator, or PPI); elevations at constant azimuth (Range Height Indictator or RHI); 360 degrees azimuth at constant high elevation (Velocity Azimuth Display, or VAD); and Lidar beam ‘stares’ above monitoring stations. The measurement was carried out over a three week period from mid-August to the beginning of September 2011 when the instrument ran near continuously.
CRC CARE Technical Report no. 33 8 Advanced Lidar Port Hedland dust study: Broadscale, real-time dust tracking and measurement
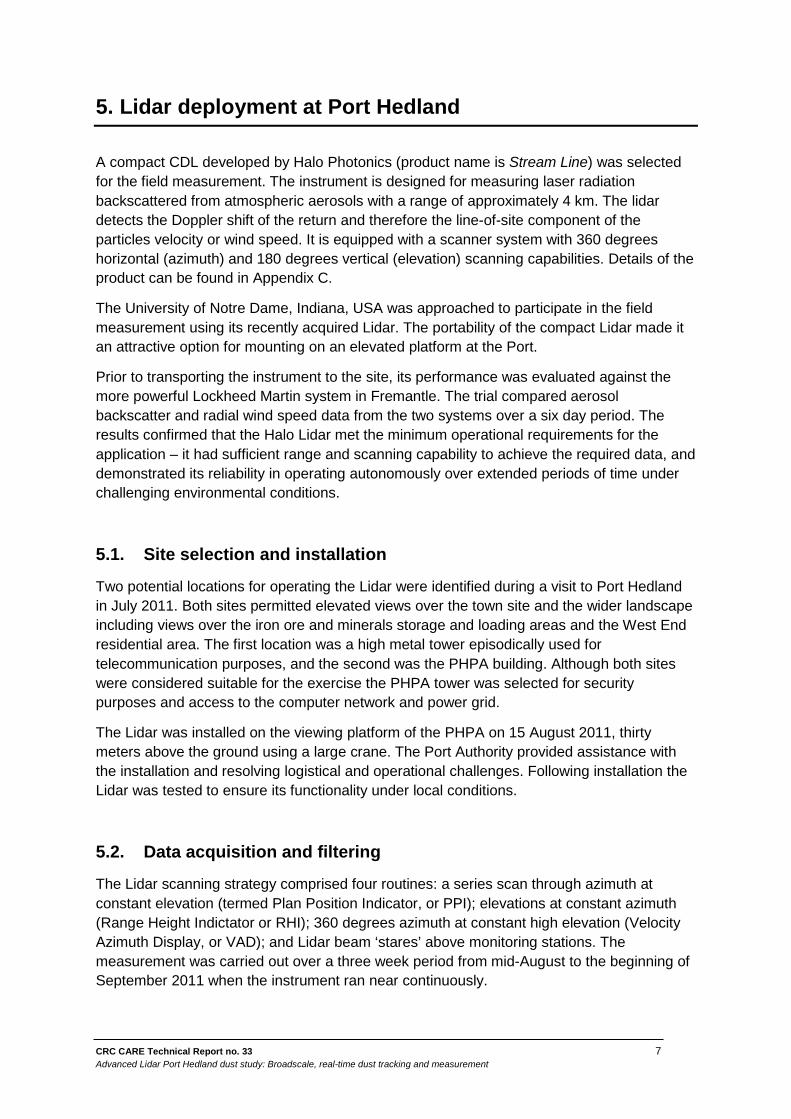
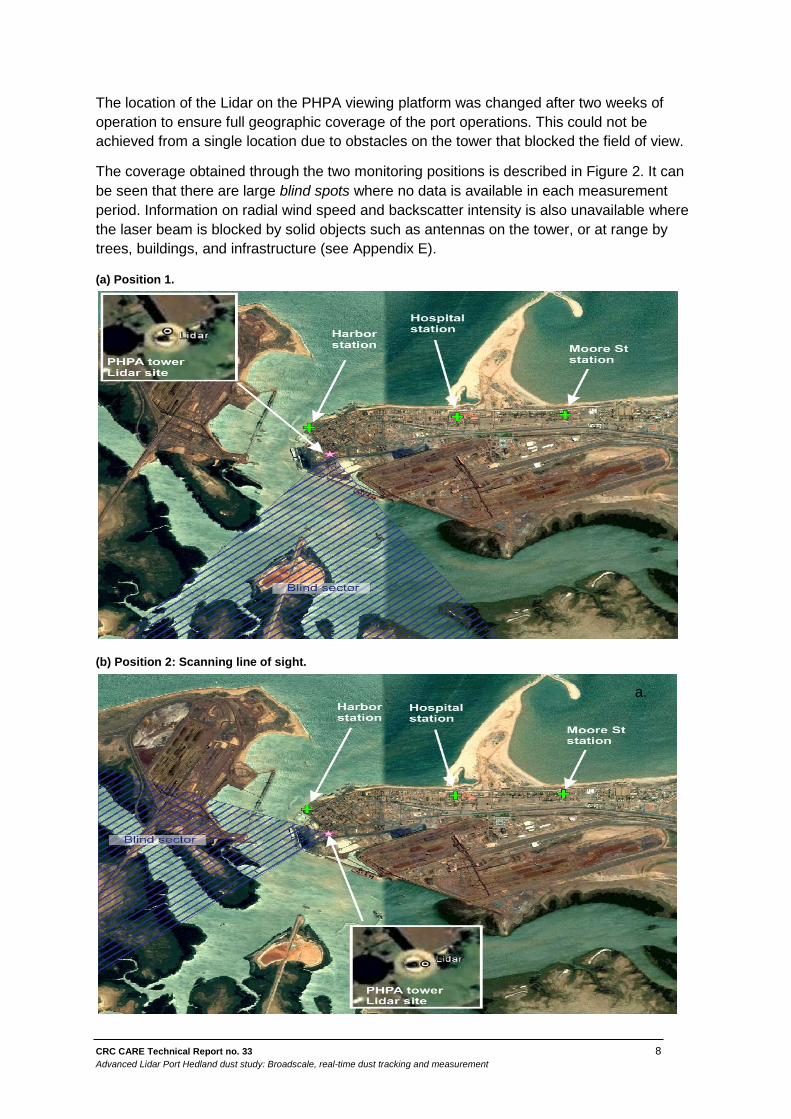
The location of the Lidar on the PHPA viewing platform was changed after two weeks of operation to ensure full geographic coverage of the port operations. This could not be achieved from a single location due to obstacles on the tower that blocked the field of view.
The coverage obtained through the two monitoring positions is described in Figure 2. It can be seen that there are large blind spots where no data is available in each measurement period. Information on radial wind speed and backscatter intensity is also unavailable where the laser beam is blocked by solid objects such as antennas on the tower, or at range by trees, buildings, and infrastructure (see Appendix E).
(a) Position 1.
(b) Position 2: Scanning line of sight.
a.
CRC CARE Technical Report no. 33 9 Advanced Lidar Port Hedland dust study: Broadscale, real-time dust tracking and measurement
Figure 2. The scanning blind spots (blue striped areas) for the two Lidar scanning positions are identified above. Measurement data was obtained for all remaining areas within the Lidar line of sight and range during the four week measurement period. The figure indicates the location of the PHPA tower as well as monitoring stations in the West End.
The raw data from the Lidar scans were filtered to remove systematic noise, the effects from turbulence and hard targets. The results from the data processing are projected onto a coloured background map to provide an accurate representation of the wind and backscatter conditions across the monitored area. The backscatter measurements have also been adjusted to Decibel (dB) scale which made it easier to identify substantial smoke or plume events.
5.3. Data referencing
Additional wind and dust data have been sourced from monitoring stations operated by the Port Hedland Industry Council and PHPA. The data are used to obtain a more detailed understanding of changes in dust concentration across the sampling domain as a function of space and time. Importantly, the data from the fixed monitoring stations was employed to ‘calibrate’ the Lidar-derived dust concentration estimates. This recognises that the backscatter signal of the Lidar is essentially proportional to the aerosols density in the measured volume of air, and enables the dust level estimates to be derived. The calibration of the Lidar data with the particulate concentration levels from monitoring stations makes it possible to follow the dust flow in density unit (Chapter 8).
CRC CARE Technical Report no. 33 10 Advanced Lidar Port Hedland dust study: Broadscale, real-time dust tracking and measurement
6. Source identification
A key recommendation from the Taskforce report is to identify the major sources of particles emission. It was suggested that this may be achieved by using a combination of instruments, including Lidar, to develop three-dimensional (3D) profiles so that ‘hotspots’ from plume emission would be easier to identify.
6.1. Potential dust sources
Previous investigations have identified potential dust sources including background particulate material and local industrial activities.
6.1.1. Background particulate material
This includes windborne soil (crustal material), and marine salt. The crustal material is typically transported over long distances off the continent by strong wind systems and varies in composition and size. Large-scale dust storms typically impact on the port several times a year with dust concentration levels often exceeding 200 µg/m3 for extended periods (hrs). The provision of five exceedances per annum in the PM10 NEPM (adjusted to 10 under the Interim Guideline Measure) was included to account for these natural events.
The second major source of atmospheric particles originates from marine aerosols. This background particle level may vary on a daily and seasonally basis. Its contribution in the absolute ambient particles level may be significant and are currently being quantified by ChemCentre.
6.1.2. Local industrial activities
A significant source of particles is known to originate from minerals export activities (DSD 2012). Facilities such as berths (ship loading), car dumpers, conveyor belts and transfer points, screening, stacking, reclaiming, stockyards, railway lines and roads have been identified as potential sources of particle emission in the port. Most of these are stationary point sources as they are fixed in space and confined to a small area. They are usually visible and readily identifiable.
Bulk and linear dust sources such as open bulk storage facilities, material handling, shipping and road traffic are known to be significant sources of particles. However, these sources can be difficult to quantify using point measurement instruments because the emission signature is often overwhelmed by the background ambient dust concentration levels.
6.2. Source mapping
A series of PPI scans were undertaken using the Lidar. The outputs from the horizontal scans were processed using propriety algorithms developed by the project team and superimposed over a topographic map of the port. The resulting product is a time series of high-resolution images pin pointing the location of dust sources, and the two-dimensional
CRC CARE Technical Report no. 33 11 Advanced Lidar Port Hedland dust study: Broadscale, real-time dust tracking and measurement
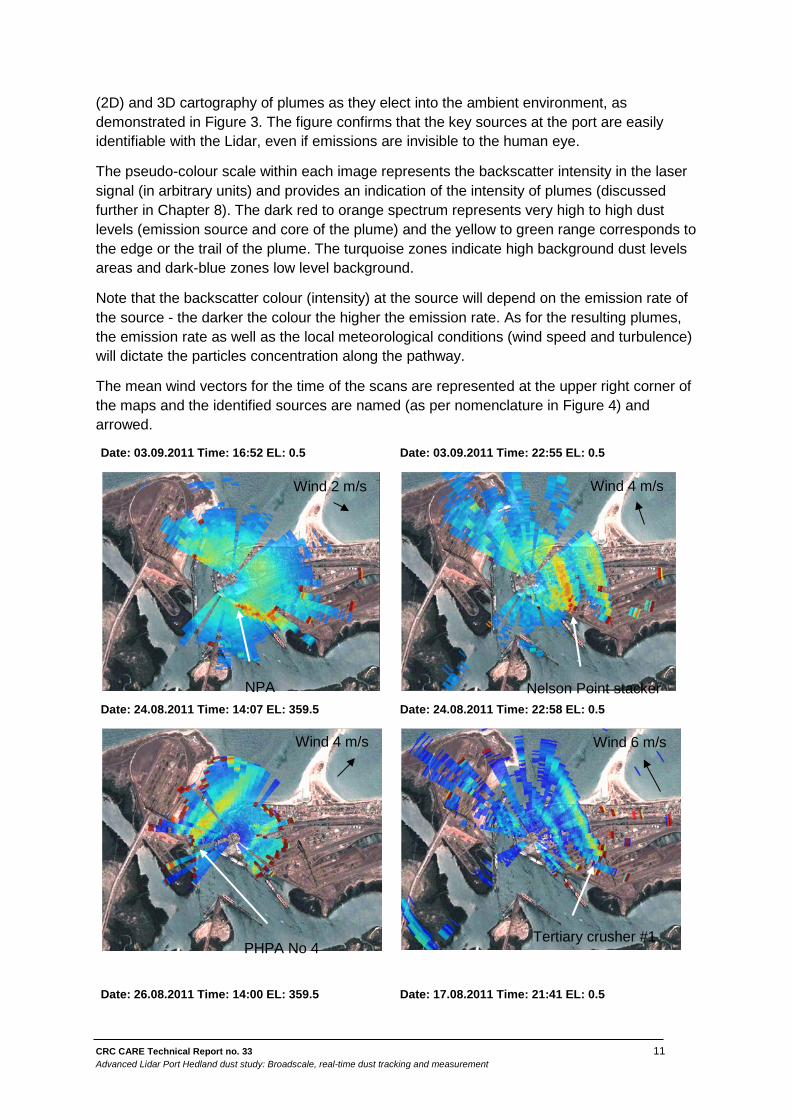
(2D) and 3D cartography of plumes as they elect into the ambient environment, as demonstrated in Figure 3. The figure confirms that the key sources at the port are easily identifiable with the Lidar, even if emissions are invisible to the human eye.
The pseudo-colour scale within each image represents the backscatter intensity in the laser signal (in arbitrary units) and provides an indication of the intensity of plumes (discussed further in Chapter 8). The dark red to orange spectrum represents very high to high dust levels (emission source and core of the plume) and the yellow to green range corresponds to the edge or the trail of the plume. The turquoise zones indicate high background dust levels areas and dark-blue zones low level background.
Note that the backscatter colour (intensity) at the source will depend on the emission rate of the source - the darker the colour the higher the emission rate. As for the resulting plumes, the emission rate as well as the local meteorological conditions (wind speed and turbulence) will dictate the particles concentration along the pathway.
The mean wind vectors for the time of the scans are represented at the upper right corner of the maps and the identified sources are named (as per nomenclature in Figure 4) and arrowed.
Date: 03.09.2011 Time: 16:52 EL: 0.5 Date: 03.09.2011 Time: 22:55 EL: 0.5
Date: 24.08.2011 Time: 14:07 EL: 359.5 Date: 24.08.2011 Time: 22:58 EL: 0.5
Date: 26.08.2011 Time: 14:00 EL: 359.5
Date: 17.08.2011 Time: 21:41 EL: 0.5
Wind 2 m/s
NPA
Wind 4 m/s
Nelson Point stacker
Wind 4 m/s
PHPA No 4
Wind 6 m/s
Tertiary crusher #1
CRC CARE Technical Report no. 33 12 Advanced Lidar Port Hedland dust study: Broadscale, real-time dust tracking and measurement
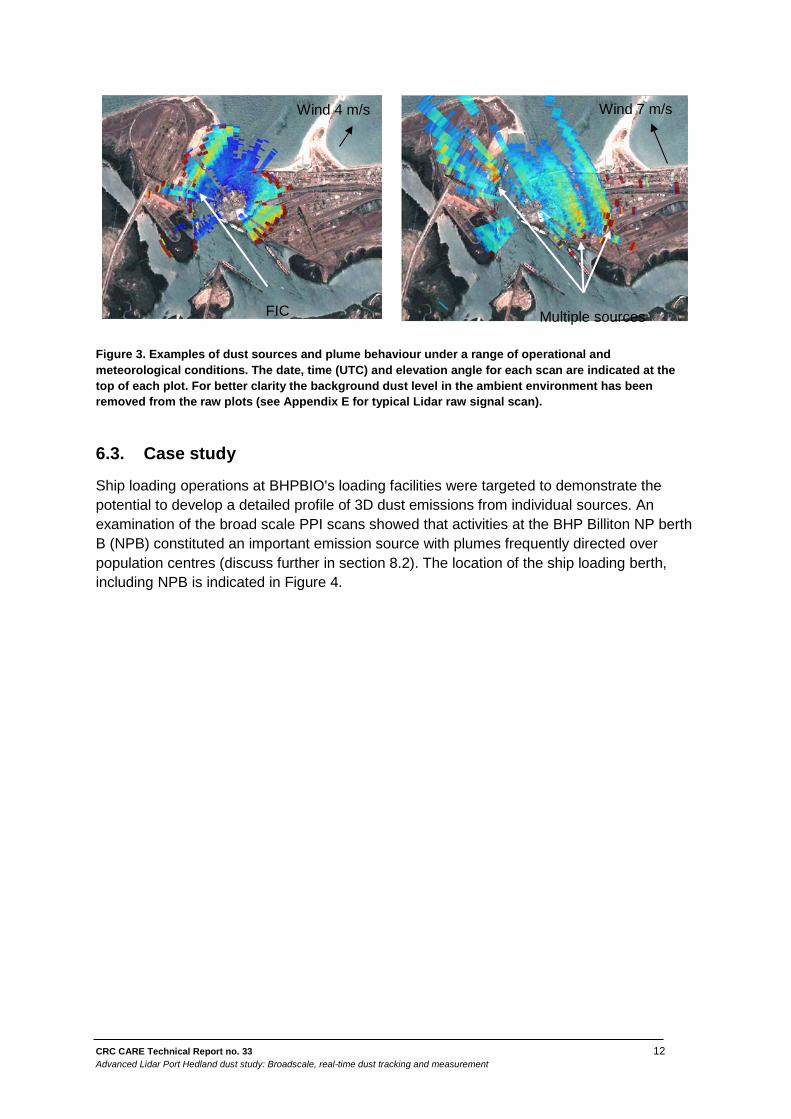
Figure 3. Examples of dust sources and plume behaviour under a range of operational and meteorological conditions. The date, time (UTC) and elevation angle for each scan are indicated at the top of each plot. For better clarity the background dust level in the ambient environment has been removed from the raw plots (see Appendix E for typical Lidar raw signal scan).
6.3. Case study
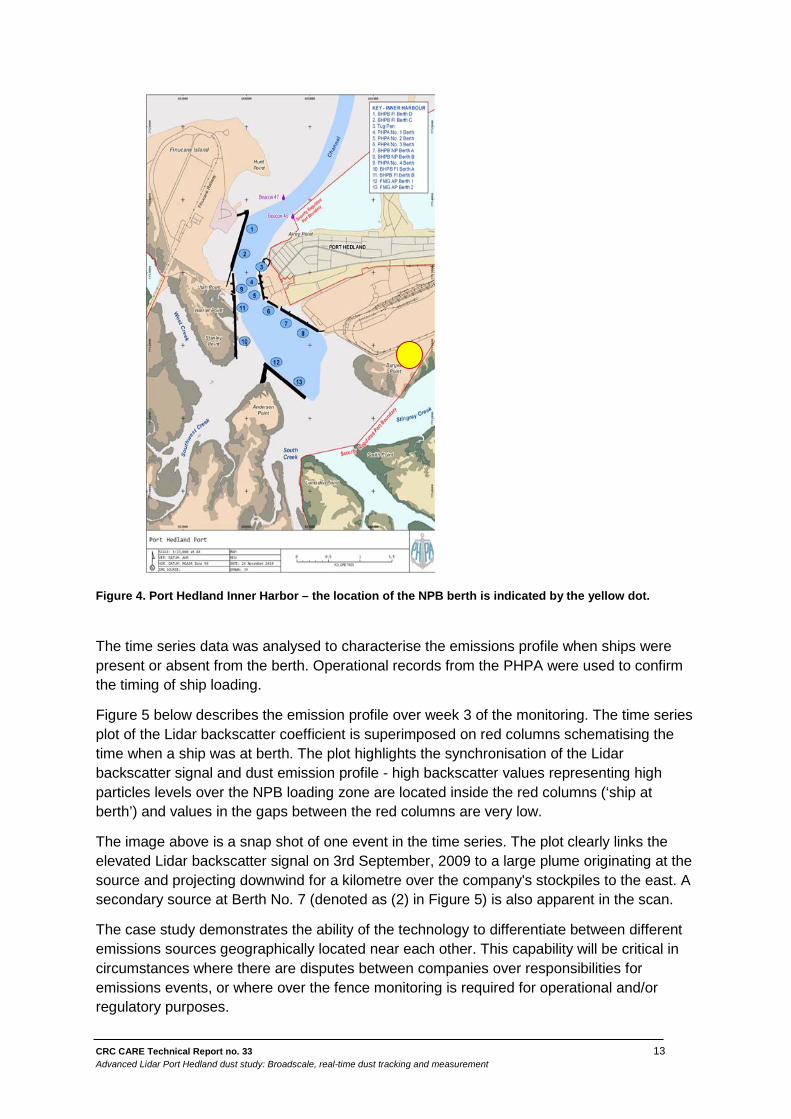
Ship loading operations at BHPBIO's loading facilities were targeted to demonstrate the potential to develop a detailed profile of 3D dust emissions from individual sources. An examination of the broad scale PPI scans showed that activities at the BHP Billiton NP berth B (NPB) constituted an important emission source with plumes frequently directed over population centres (discuss further in section 8.2). The location of the ship loading berth, including NPB is indicated in Figure 4.
Wind 4 m/s
FIC
Wind 7 m/s
Multiple sources
CRC CARE Technical Report no. 33 13 Advanced Lidar Port Hedland dust study: Broadscale, real-time dust tracking and measurement
Figure 4. Port Hedland Inner Harbor – the location of the NPB berth is indicated by the yellow dot.
The time series data was analysed to characterise the emissions profile when ships were present or absent from the berth. Operational records from the PHPA were used to confirm the timing of ship loading.
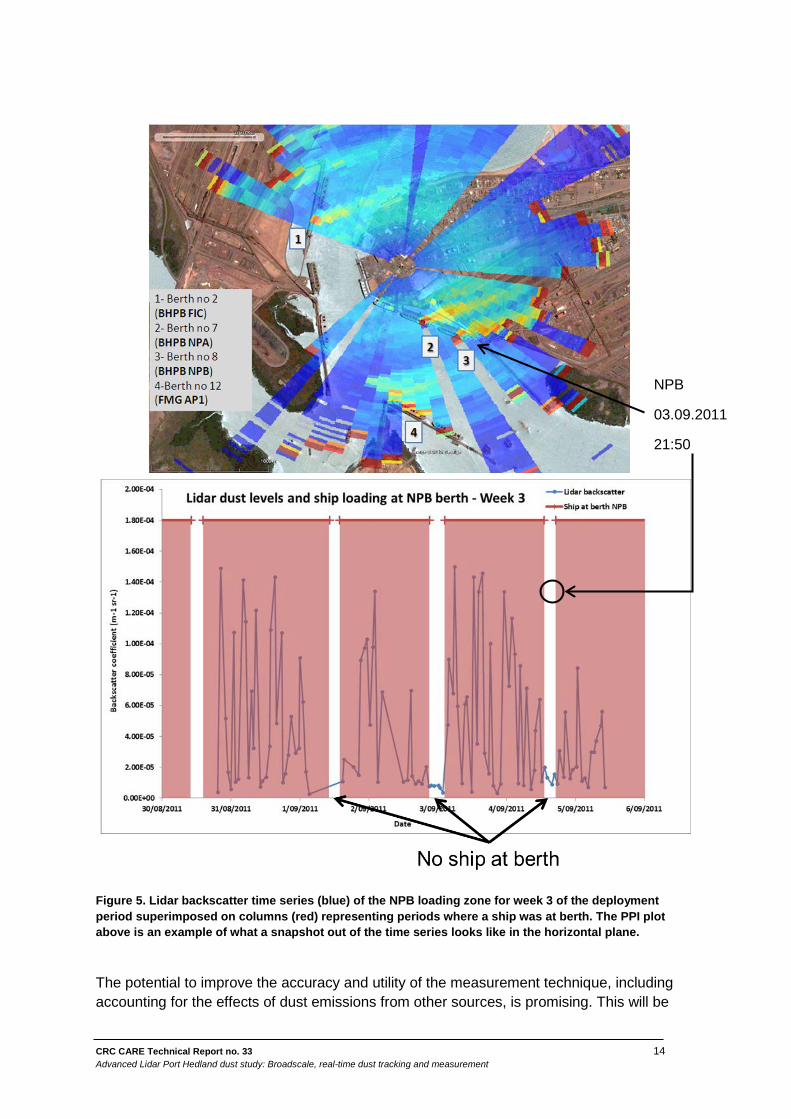
Figure 5 below describes the emission profile over week 3 of the monitoring. The time series plot of the Lidar backscatter coefficient is superimposed on red columns schematising the time when a ship was at berth. The plot highlights the synchronisation of the Lidar backscatter signal and dust emission profile - high backscatter values representing high particles levels over the NPB loading zone are located inside the red columns (‘ship at berth’) and values in the gaps between the red columns are very low.
The image above is a snap shot of one event in the time series. The plot clearly links the elevated Lidar backscatter signal on 3rd September, 2009 to a large plume originating at the source and projecting downwind for a kilometre over the company's stockpiles to the east. A secondary source at Berth No. 7 (denoted as (2) in Figure 5) is also apparent in the scan.
The case study demonstrates the ability of the technology to differentiate between different emissions sources geographically located near each other. This capability will be critical in circumstances where there are disputes between companies over responsibilities for emissions events, or where over the fence monitoring is required for operational and/or regulatory purposes.
CRC CARE Technical Report no. 33 14 Advanced Lidar Port Hedland dust study: Broadscale, real-time dust tracking and measurement
Figure 5. Lidar backscatter time series (blue) of the NPB loading zone for week 3 of the deployment period superimposed on columns (red) representing periods where a ship was at berth. The PPI plot above is an example of what a snapshot out of the time series looks like in the horizontal plane.
The potential to improve the accuracy and utility of the measurement technique, including accounting for the effects of dust emissions from other sources, is promising. This will be
NPB
03.09.2011
21:50

CRC CARE Technical Report no. 33 15 Advanced Lidar Port Hedland dust study: Broadscale, real-time dust tracking and measurement
achieved through the use of optimised scanning strategies with high temporal and spatial resolution around the sources, improved records of ore handling activities, and consideration of background and ambient dust concentration levels at the time of measurement.
CRC CARE Technical Report no. 33 16 Advanced Lidar Port Hedland dust study: Broadscale, real-time dust tracking and measurement
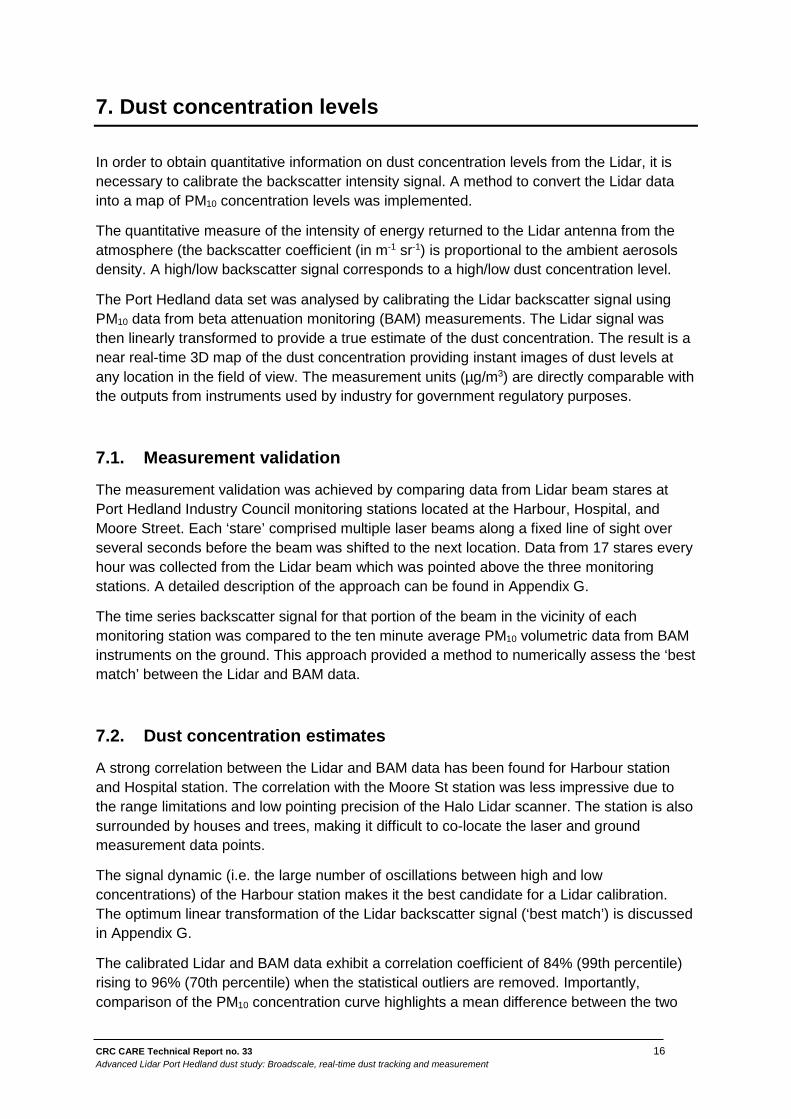
7. Dust concentration levels
In order to obtain quantitative information on dust concentration levels from the Lidar, it is necessary to calibrate the backscatter intensity signal. A method to convert the Lidar data into a map of PM10 concentration levels was implemented.
The quantitative measure of the intensity of energy returned to the Lidar antenna from the atmosphere (the backscatter coefficient (in m-1 sr-1) is proportional to the ambient aerosols density. A high/low backscatter signal corresponds to a high/low dust concentration level.
The Port Hedland data set was analysed by calibrating the Lidar backscatter signal using PM10 data from beta attenuation monitoring (BAM) measurements. The Lidar signal was then linearly transformed to provide a true estimate of the dust concentration. The result is a near real-time 3D map of the dust concentration providing instant images of dust levels at any location in the field of view. The measurement units (µg/m3) are directly comparable with the outputs from instruments used by industry for government regulatory purposes.
7.1. Measurement validation
The measurement validation was achieved by comparing data from Lidar beam stares at Port Hedland Industry Council monitoring stations located at the Harbour, Hospital, and Moore Street. Each ‘stare’ comprised multiple laser beams along a fixed line of sight over several seconds before the beam was shifted to the next location. Data from 17 stares every hour was collected from the Lidar beam which was pointed above the three monitoring stations. A detailed description of the approach can be found in Appendix G.
The time series backscatter signal for that portion of the beam in the vicinity of each monitoring station was compared to the ten minute average PM10 volumetric data from BAM instruments on the ground. This approach provided a method to numerically assess the ‘best match’ between the Lidar and BAM data.
7.2. Dust concentration estimates
A strong correlation between the Lidar and BAM data has been found for Harbour station and Hospital station. The correlation with the Moore St station was less impressive due to the range limitations and low pointing precision of the Halo Lidar scanner. The station is also surrounded by houses and trees, making it difficult to co-locate the laser and ground measurement data points.
The signal dynamic (i.e. the large number of oscillations between high and low concentrations) of the Harbour station makes it the best candidate for a Lidar calibration. The optimum linear transformation of the Lidar backscatter signal (‘best match’) is discussed in Appendix G.
The calibrated Lidar and BAM data exhibit a correlation coefficient of 84% (99th percentile) rising to 96% (70th percentile) when the statistical outliers are removed. Importantly, comparison of the PM10 concentration curve highlights a mean difference between the two
CRC CARE Technical Report no. 33 17 Advanced Lidar Port Hedland dust study: Broadscale, real-time dust tracking and measurement
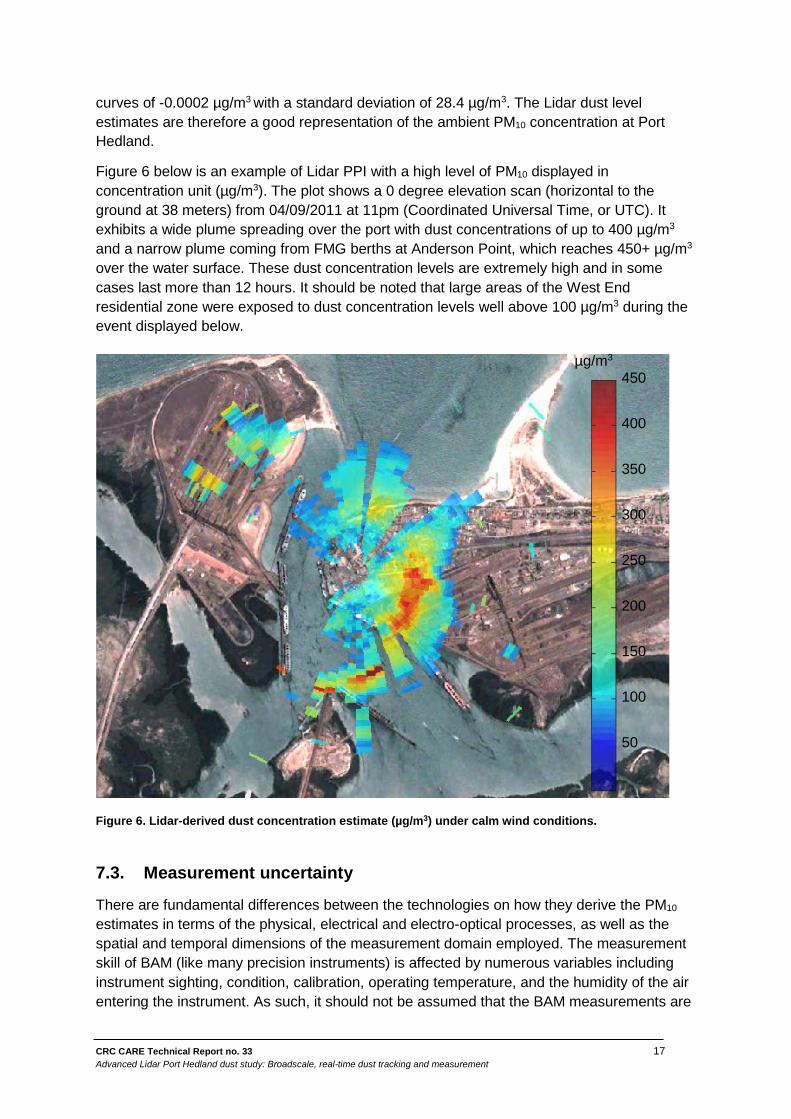
curves of -0.0002 µg/m3 with a standard deviation of 28.4 µg/m3. The Lidar dust level estimates are therefore a good representation of the ambient PM10 concentration at Port Hedland.
Figure 6 below is an example of Lidar PPI with a high level of PM10 displayed in concentration unit (µg/m3). The plot shows a 0 degree elevation scan (horizontal to the ground at 38 meters) from 04/09/2011 at 11pm (Coordinated Universal Time, or UTC). It exhibits a wide plume spreading over the port with dust concentrations of up to 400 µg/m3 and a narrow plume coming from FMG berths at Anderson Point, which reaches 450+ µg/m3 over the water surface. These dust concentration levels are extremely high and in some cases last more than 12 hours. It should be noted that large areas of the West End residential zone were exposed to dust concentration levels well above 100 µg/m3 during the event displayed below.
Figure 6. Lidar-derived dust concentration estimate (µg/m3) under calm wind conditions.
7.3. Measurement uncertainty
There are fundamental differences between the technologies on how they derive the PM10 estimates in terms of the physical, electrical and electro-optical processes, as well as the spatial and temporal dimensions of the measurement domain employed. The measurement skill of BAM (like many precision instruments) is affected by numerous variables including instrument sighting, condition, calibration, operating temperature, and the humidity of the air entering the instrument. As such, it should not be assumed that the BAM measurements are
450
400
350
300
250
200
150
100
50
µg/m3

CRC CARE Technical Report no. 33 18 Advanced Lidar Port Hedland dust study: Broadscale, real-time dust tracking and measurement
accurate, or that any differences in the measurement data from the two instruments are the result of limitations with the Lidar technique.
Each technology has its strengths and weaknesses which need to be considered in the planning and execution of a monitoring strategy. An overview of the strengths and limitations of point measurement technologies and scanning Doppler Lidar is presented in Appendix H.
CRC CARE Technical Report no. 33 19 Advanced Lidar Port Hedland dust study: Broadscale, real-time dust tracking and measurement
8. Dust dispersion modelling
Dust dispersion modelling has been undertaken by BHPBIO and other industry players at the port for over a decade. In most cases the modelling was limited to assessing the impact of changes on operating conditions for individual companies, as opposed to assessing the cumulative impacts from all port operations.
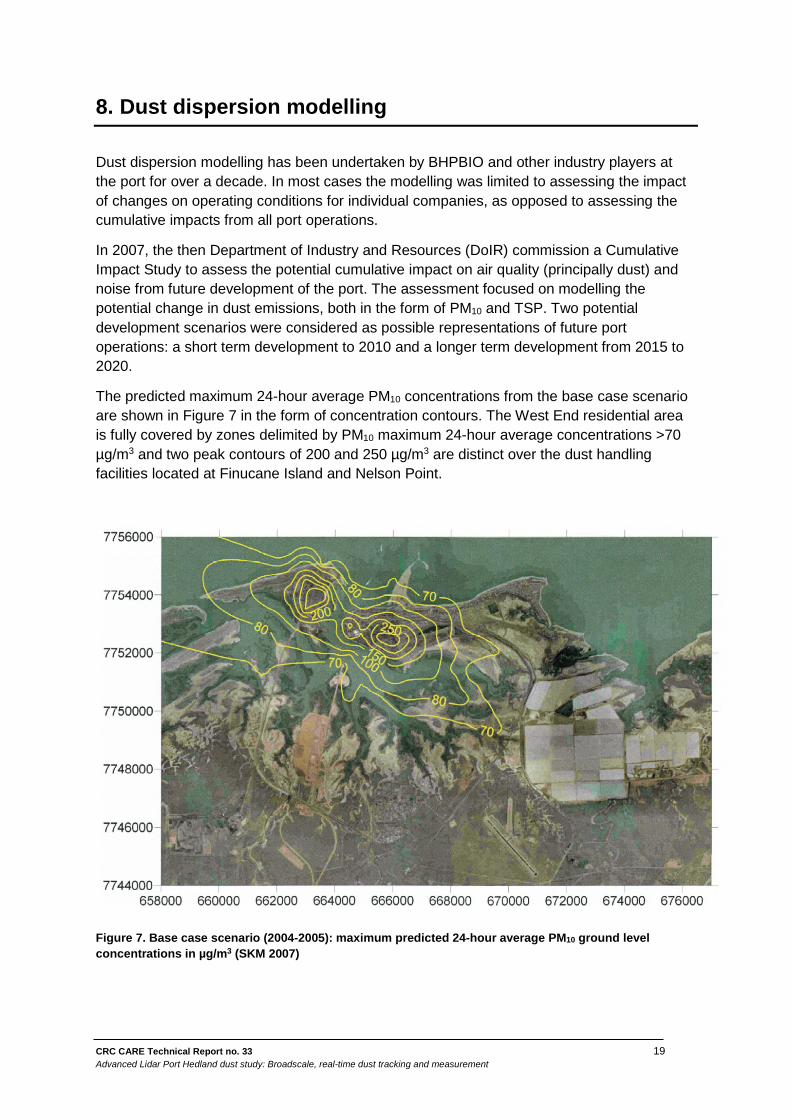
In 2007, the then Department of Industry and Resources (DoIR) commission a Cumulative Impact Study to assess the potential cumulative impact on air quality (principally dust) and noise from future development of the port. The assessment focused on modelling the potential change in dust emissions, both in the form of PM10 and TSP. Two potential development scenarios were considered as possible representations of future port operations: a short term development to 2010 and a longer term development from 2015 to 2020.
The predicted maximum 24-hour average PM10 concentrations from the base case scenario are shown in Figure 7 in the form of concentration contours. The West End residential area is fully covered by zones delimited by PM10 maximum 24-hour average concentrations >70 µg/m3 and two peak contours of 200 and 250 µg/m3 are distinct over the dust handling facilities located at Finucane Island and Nelson Point.
Figure 7. Base case scenario (2004-2005): maximum predicted 24-hour average PM10 ground level concentrations in µg/m3 (SKM 2007)
CRC CARE Technical Report no. 33 20 Advanced Lidar Port Hedland dust study: Broadscale, real-time dust tracking and measurement
As stated previously, the AUSPLUME dispersion model was used to predict dust concentration levels under a range of scenarios. AUSPLUME is a standard Gaussian-plume model developed by Environment Protection Authority Victoria (Australia) (EPA, 2000), and is generally driven by hourly wind speed, wind direction, temperature, PBL height, and stability parameters. Gaussian-plume models are nevertheless limited in their application because of simplifying assumptions such as:
• pollutant material is transported in a straight line instantly (like a beam of light) from source to receptor for a particular hour (no causality effect)
• fundamental steady-state conditions, i.e. doesn’t account for changes in emissions, wind speed or turbulence over the model ‘time-steps’
• terrain underlying the plume is flat and
• spatial uniformity in the meteorology.
In uniform atmospheric and topographical conditions with relatively simple effects, Gaussian-plume models can produce reliable results. In more complex atmospheric and topographical conditions, advanced puff or particle models and meteorological modelling may be required to maintain a similar degree of accuracy.
Port Hedland is located directly on the shore line and is affected by highly variable coastal airflows and significant changes in meteorological conditions over short distances. Advanced models such as the California PUFF model (referred to as CALPUFF) can simulate the effects of coastal areas and terrain effects on pollutant transport and dispersion in a much more realistic way than a steady-state Gaussian-plume model, which assumes spatial uniformity in the meteorology. Lidar-derived wind maps and profiles shown in Chapter 9 are eloquent examples of the complexity of the wind flows over Port Hedland. Wind shear, turbulence, convection, opposing winds and terrain forcing are a few phenomena that may lead to the micro-scale wind field pattern, as seen in Appendix K.
It is understood that the Port Hedland Industry Council is currently undertaking a modelling exercise using CALPUFF. The results of the exercise are currently being assessed by the Department of Environmental Regulation (DER) which has identified deficiencies in the approach.
The CRC CARE Lidar team is also developing a modelling system using the Weather Research and Forecasting (WRF) model and CALPUFF to conduct dust plume dispersion simulation over Port Hedland.
CRC CARE Technical Report no. 33 21 Advanced Lidar Port Hedland dust study: Broadscale, real-time dust tracking and measurement
9. Model skill verification using Lidar
The unique capability of the Lidar to simultaneously generate high-resolution 3D wind fields (discussed further below) and aerosol data provide the opportunity to evaluate the skill of the CALPUFF model under a range of meteorological and operational settings.
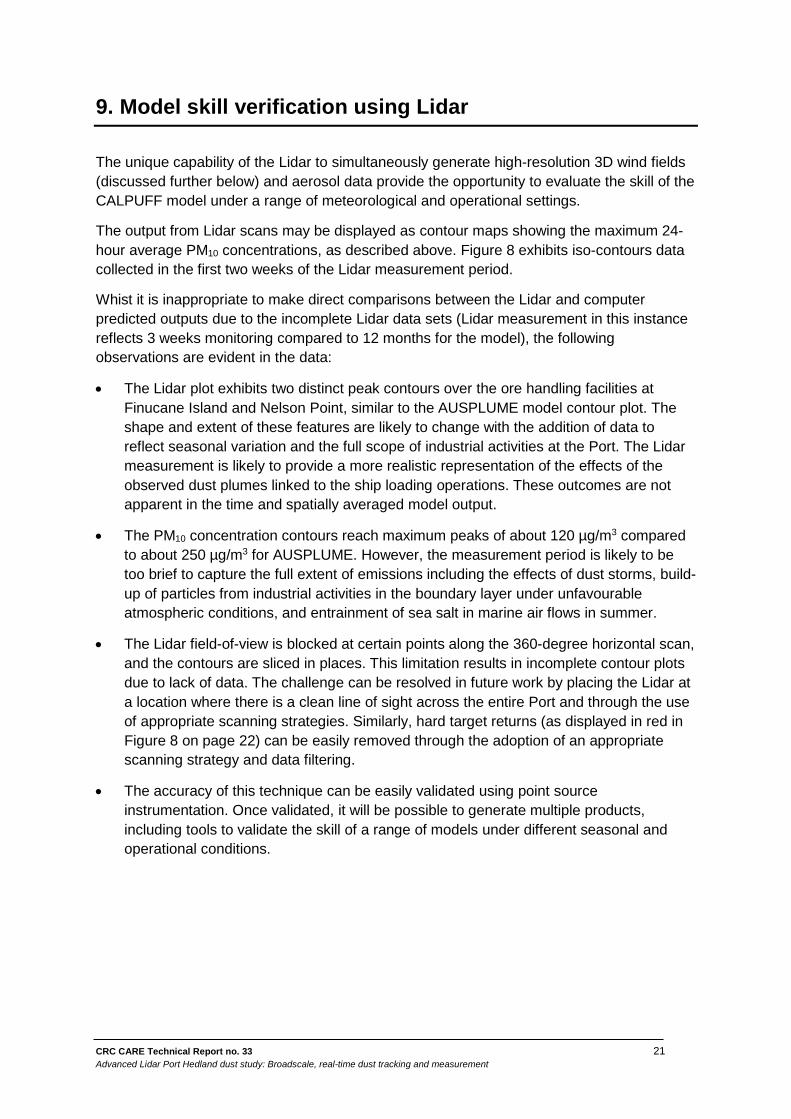
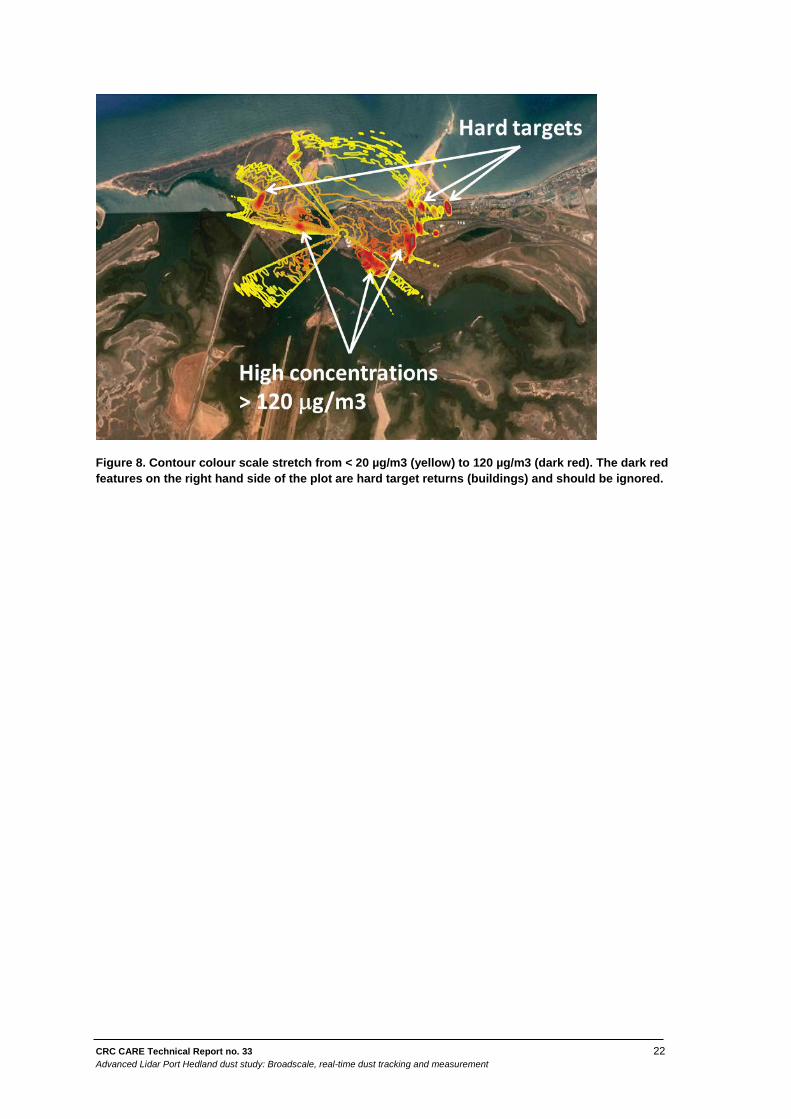
The output from Lidar scans may be displayed as contour maps showing the maximum 24-hour average PM10 concentrations, as described above. Figure 8 exhibits iso-contours data collected in the first two weeks of the Lidar measurement period.
Whist it is inappropriate to make direct comparisons between the Lidar and computer predicted outputs due to the incomplete Lidar data sets (Lidar measurement in this instance reflects 3 weeks monitoring compared to 12 months for the model), the following observations are evident in the data:
• The Lidar plot exhibits two distinct peak contours over the ore handling facilities at Finucane Island and Nelson Point, similar to the AUSPLUME model contour plot. The shape and extent of these features are likely to change with the addition of data to reflect seasonal variation and the full scope of industrial activities at the Port. The Lidar measurement is likely to provide a more realistic representation of the effects of the observed dust plumes linked to the ship loading operations. These outcomes are not apparent in the time and spatially averaged model output.
• The PM10 concentration contours reach maximum peaks of about 120 µg/m3 compared to about 250 µg/m3 for AUSPLUME. However, the measurement period is likely to be too brief to capture the full extent of emissions including the effects of dust storms, build-up of particles from industrial activities in the boundary layer under unfavourable atmospheric conditions, and entrainment of sea salt in marine air flows in summer.
• The Lidar field-of-view is blocked at certain points along the 360-degree horizontal scan, and the contours are sliced in places. This limitation results in incomplete contour plots due to lack of data. The challenge can be resolved in future work by placing the Lidar at a location where there is a clean line of sight across the entire Port and through the use of appropriate scanning strategies. Similarly, hard target returns (as displayed in red in Figure 8 on page 22) can be easily removed through the adoption of an appropriate scanning strategy and data filtering.
• The accuracy of this technique can be easily validated using point source instrumentation. Once validated, it will be possible to generate multiple products, including tools to validate the skill of a range of models under different seasonal and operational conditions.
CRC CARE Technical Report no. 33 22 Advanced Lidar Port Hedland dust study: Broadscale, real-time dust tracking and measurement
Figure 8. Contour colour scale stretch from < 20 µg/m3 (yellow) to 120 µg/m3 (dark red). The dark red features on the right hand side of the plot are hard target returns (buildings) and should be ignored.
CRC CARE Technical Report no. 33 23 Advanced Lidar Port Hedland dust study: Broadscale, real-time dust tracking and measurement
10. Fine-scale meteorology
10.1. Monitoring network
Industry has invested significant resources in establishing environmental monitoring stations for measuring ambient dust concentration levels and key meteorological parameters including wind speed and direction. The number of stations has recently been increased to provide greater geographic coverage and to more accurately determine the dust concentration levels in the background ambient environment.
The wind data is converted to products to meet the planning and operational requirements of industry stakeholders including wind roses (see 9.3.1), vertical wind profiles, and engineering purposes, and licensing reporting to government.
Time series wind data from the Bureau of Meteorology (BOM) site at the airport has also been used in dust modelling studies to support business expansion proposals, and more recently, in policy development. The appropriateness of using the BOM data to represent the wind field dynamics on the coastline has been questioned, given that the station is located 9 km inland from the Port Hedland town site.
Model dependence on supplied data will potentially result in under- or over-predictions of the simulated variables because of the spatial resolution of the monitoring network which is far larger than the model’s 0.5 km scale output.
10.2. Lidar wind measurement
The dual attribute of the CDL in simultaneously monitoring wind and dust levels over a large area represents a cost-effective solution for generating the data products currently used by industry. The unique capability of the technology to map wind fields at high spatial and temporal resolution, and resolve complex meteorological processes will provide new (and potentially critical) insights into plume dispersion and impacts on receiving environments.
Complex meteorological processes including windshear, turbulences and terrain induced forcing wield significant potential impacts on dust behaviour, and cannot be accurately represented at the required spatial scales using the existing network, or through modelling.
Lidar data can be presented in the range of formats currently used by industry, or as advanced digital or visual products. Products include: 2D terrain following wind-maps; images of complex 3D Eddie structures; vertical wind profiles; or maps of large-scale flow features such as the sea breeze or approaching dust storms. The wind vectors can be calculated at spatial resolutions down to 100 m across a 400 km2 domain. This resolution permits comparison with meteorological modelling, thus providing an additional means of independently validating the skill of these tools (see Section 10.3.3 below).
CRC CARE Technical Report no. 33 24 Advanced Lidar Port Hedland dust study: Broadscale, real-time dust tracking and measurement
10.3. Lidar Wind products
Lidar measured radial velocity has been post-processed to analyse the wind conditions over the 3 week operation at Port Hedland. The data outputs were then compared with data from anemometers in the ground-based network. Examples of the data products in the form of wind roses, wind profiles and 2D horizontal wind fields are shown.
10.3.1. Wind roses
The Lidar wind roses analysis displays the overall wind condition during the measurement period using VAD.
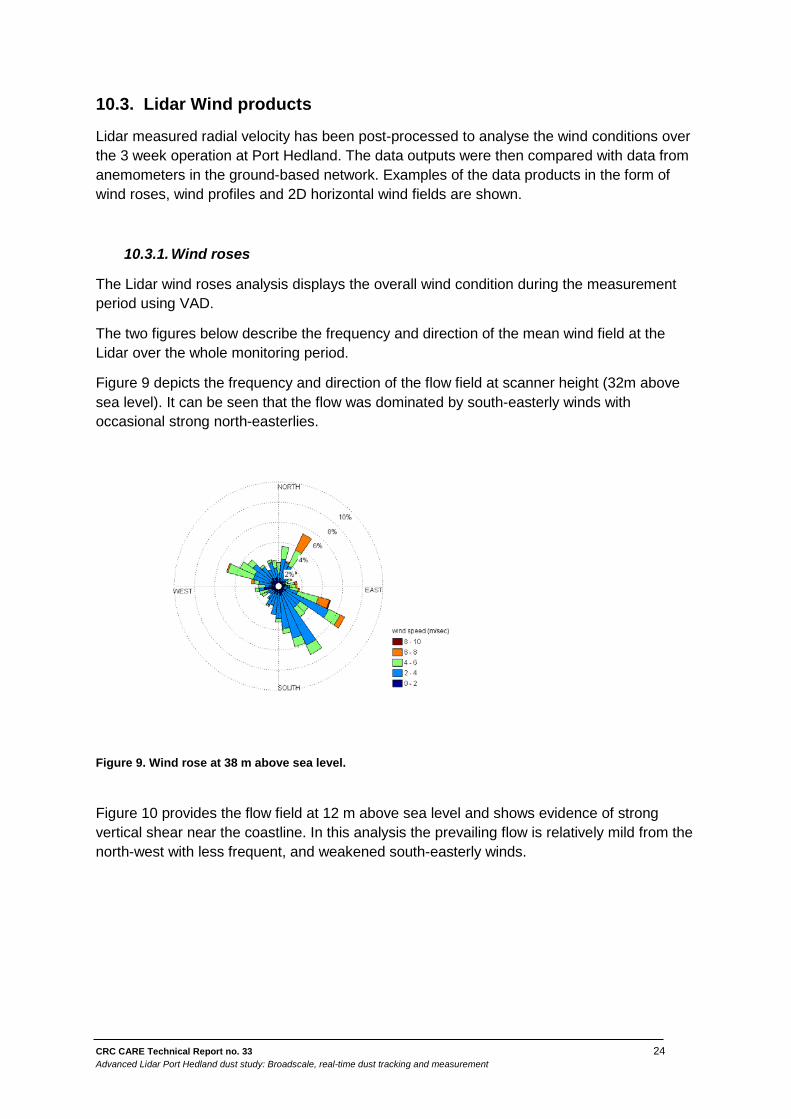
The two figures below describe the frequency and direction of the mean wind field at the Lidar over the whole monitoring period.
Figure 9 depicts the frequency and direction of the flow field at scanner height (32m above sea level). It can be seen that the flow was dominated by south-easterly winds with occasional strong north-easterlies.
Figure 9. Wind rose at 38 m above sea level.
Figure 10 provides the flow field at 12 m above sea level and shows evidence of strong vertical shear near the coastline. In this analysis the prevailing flow is relatively mild from the north-west with less frequent, and weakened south-easterly winds.
CRC CARE Technical Report no. 33 25 Advanced Lidar Port Hedland dust study: Broadscale, real-time dust tracking and measurement
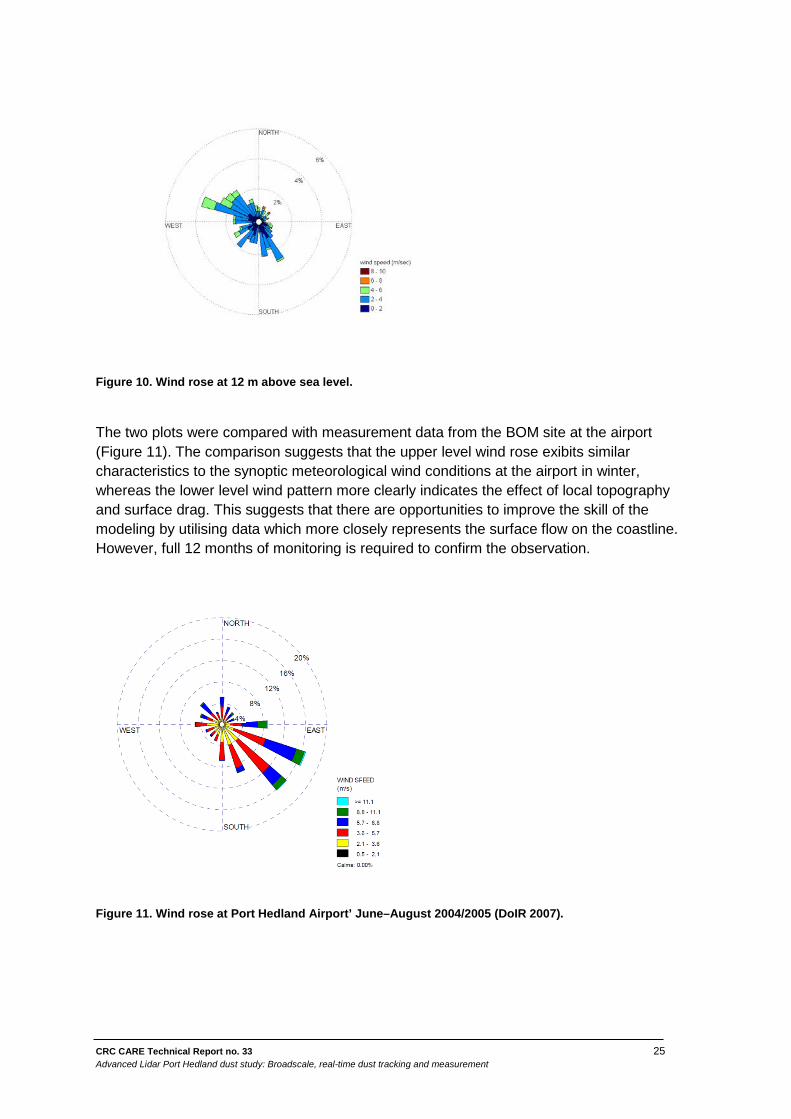
Figure 10. Wind rose at 12 m above sea level.
The two plots were compared with measurement data from the BOM site at the airport (Figure 11). The comparison suggests that the upper level wind rose exibits similar characteristics to the synoptic meteorological wind conditions at the airport in winter, whereas the lower level wind pattern more clearly indicates the effect of local topography and surface drag. This suggests that there are opportunities to improve the skill of the modeling by utilising data which more closely represents the surface flow on the coastline. However, full 12 months of monitoring is required to confirm the observation.
Figure 11. Wind rose at Port Hedland Airport’ June–August 2004/2005 (DoIR 2007).
CRC CARE Technical Report no. 33 26 Advanced Lidar Port Hedland dust study: Broadscale, real-time dust tracking and measurement
10.3.2. VAD analysis
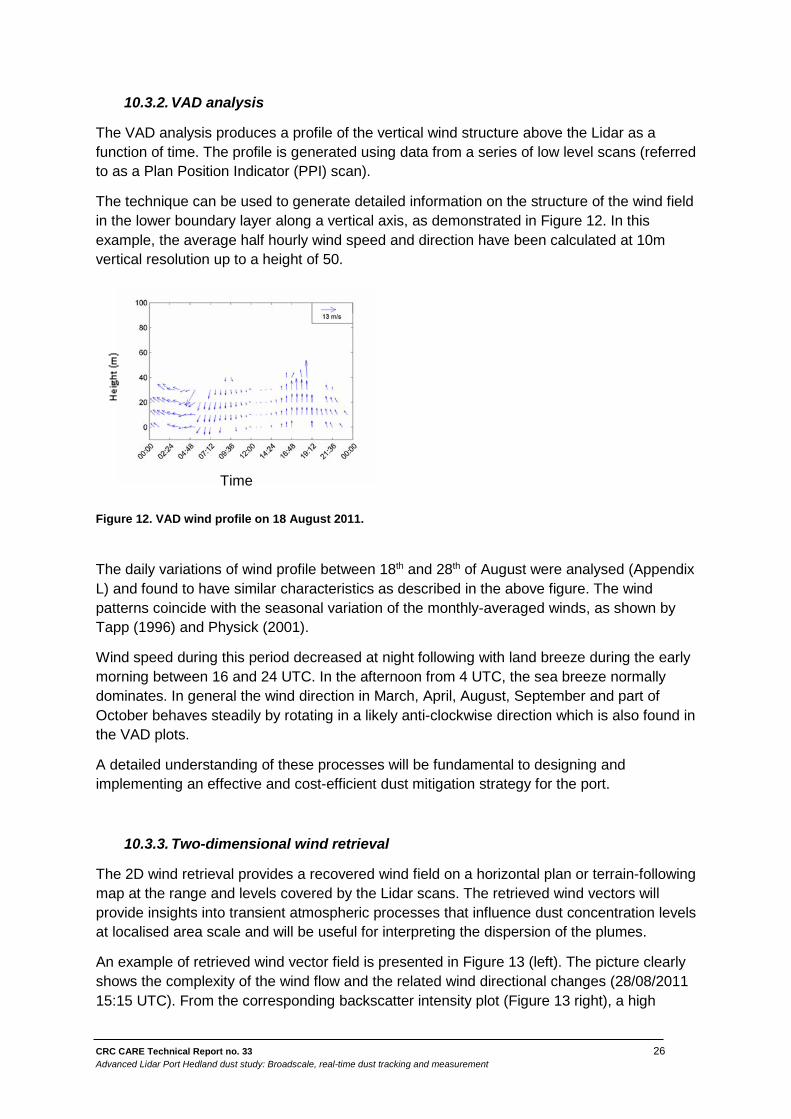
The VAD analysis produces a profile of the vertical wind structure above the Lidar as a function of time. The profile is generated using data from a series of low level scans (referred to as a Plan Position Indicator (PPI) scan).
The technique can be used to generate detailed information on the structure of the wind field in the lower boundary layer along a vertical axis, as demonstrated in Figure 12. In this example, the average half hourly wind speed and direction have been calculated at 10m vertical resolution up to a height of 50.
Figure 12. VAD wind profile on 18 August 2011.
The daily variations of wind profile between 18th and 28th of August were analysed (Appendix L) and found to have similar characteristics as described in the above figure. The wind patterns coincide with the seasonal variation of the monthly-averaged winds, as shown by Tapp (1996) and Physick (2001).
Wind speed during this period decreased at night following with land breeze during the early morning between 16 and 24 UTC. In the afternoon from 4 UTC, the sea breeze normally dominates. In general the wind direction in March, April, August, September and part of October behaves steadily by rotating in a likely anti-clockwise direction which is also found in the VAD plots.
A detailed understanding of these processes will be fundamental to designing and implementing an effective and cost-efficient dust mitigation strategy for the port.
10.3.3. Two-dimensional wind retrieval
The 2D wind retrieval provides a recovered wind field on a horizontal plan or terrain-following map at the range and levels covered by the Lidar scans. The retrieved wind vectors will provide insights into transient atmospheric processes that influence dust concentration levels at localised area scale and will be useful for interpreting the dispersion of the plumes.
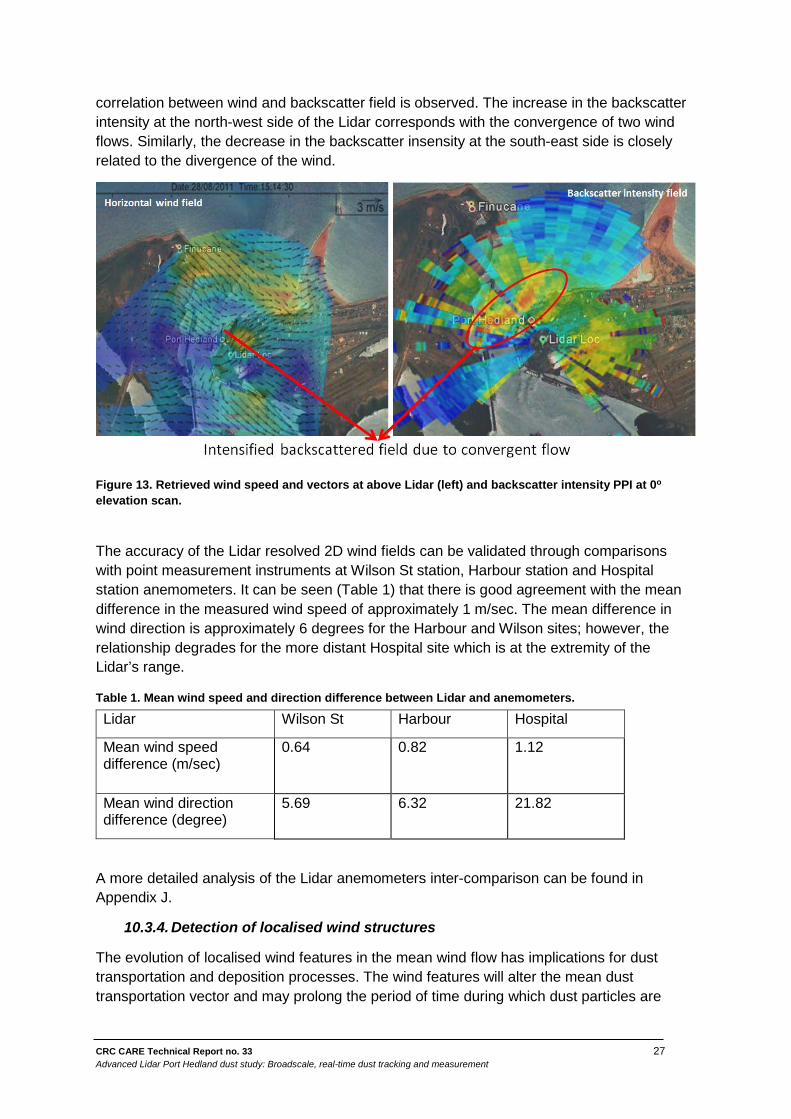
An example of retrieved wind vector field is presented in Figure 13 (left). The picture clearly shows the complexity of the wind flow and the related wind directional changes (28/08/2011 15:15 UTC). From the corresponding backscatter intensity plot (Figure 13 right), a high
Time
CRC CARE Technical Report no. 33 27 Advanced Lidar Port Hedland dust study: Broadscale, real-time dust tracking and measurement
correlation between wind and backscatter field is observed. The increase in the backscatter intensity at the north-west side of the Lidar corresponds with the convergence of two wind flows. Similarly, the decrease in the backscatter insensity at the south-east side is closely related to the divergence of the wind.
Figure 13. Retrieved wind speed and vectors at above Lidar (left) and backscatter intensity PPI at 0o elevation scan.
The accuracy of the Lidar resolved 2D wind fields can be validated through comparisons with point measurement instruments at Wilson St station, Harbour station and Hospital station anemometers. It can be seen (Table 1) that there is good agreement with the mean difference in the measured wind speed of approximately 1 m/sec. The mean difference in wind direction is approximately 6 degrees for the Harbour and Wilson sites; however, the relationship degrades for the more distant Hospital site which is at the extremity of the Lidar’s range.
Table 1. Mean wind speed and direction difference between Lidar and anemometers.
Lidar Wilson St Harbour Hospital
Mean wind speed difference (m/sec)
0.64
0.82 1.12
Mean wind direction difference (degree)
5.69 6.32 21.82
A more detailed analysis of the Lidar anemometers inter-comparison can be found in Appendix J.
10.3.4. Detection of localised wind structures
The evolution of localised wind features in the mean wind flow has implications for dust transportation and deposition processes. The wind features will alter the mean dust transportation vector and may prolong the period of time during which dust particles are

CRC CARE Technical Report no. 33 28 Advanced Lidar Port Hedland dust study: Broadscale, real-time dust tracking and measurement
suspended in the boundary layer. As the frequency of the localised wind flow purtibations increases, significant changes in ambient dust concentration levels can be expected due to the mixing. These conditions may also concentrate dust over a small area and be a key driver of the NEPM exceedances. An mixing event is illustrated in Appendix K. CDL has the unique capability to: firstly, resolve small-scale pertibations; and secondly, provide insights into the critical mechanisms affecting dust transportation and deposition.
CRC CARE Technical Report no. 33 29 Advanced Lidar Port Hedland dust study: Broadscale, real-time dust tracking and measurement
11. Pathway forward
The technology demonstration has identified opportunities for advancing the recommendations of the Taskforce. Opportunities lie in the areas described as follows.
a. Health risk assessment
The Lidar measurement identified that intense dust plumes are regularly directed across populated centres in the West End of Port Hedland. These plumes are linked to specific activities at the BHPBIO ship loading facilities, and FMG’s berths at Anderson Point. The PM10 estimates are very high (potentially five times the Taskforce’s Interim Guideline Measure, and nine times the NEPM) where ship loading is continuously undertaken during SSE winds. The plumes’ size, shape and mean direction change in response to wind direction and turbulence. Importantly, peak concentration levels are unlikely be detected at the local monitoring stations (Harbour, Wilson or Hospital) when the mean wind direction is not in line with the stations. It is noted that approximately 360 people were recorded as being residents in the West End in 2008. A subset of the population is potentially sensitive to elevated dust levels, including young children, the elderly and socially disadvantaged indigenous residents.
An important consideration in assessing the health risk to exposed populations is the extent of exposure and composition of particles (size, shape and chemistry). An investigation to provide quantitative data on particle chemistry commenced in October 2012 (ChemCentre). The CRC CARE sponsored project is analysing data from monitoring sites in Port Hedland and from dust collected by High Volume Dust Samplers.
A limitation of this work is that it is difficult to determine the source of dust collected by the monitoring stations. The source is important as the industry blends different ore types to meet the requirements of its customers. The blend determines the particle chemistry. This challenge can be addressed through a coordinated measurement program using the Lidar to determine the source of emissions, and the on-ground sampling program providing information on particle size and composition. An important objective of the analysis will be to clarify the contribution of marine aerosols in the PM10 profile. The Lidar could also be used to guide decisions on the best location(s) to collect dust to confirm peak exposure levels.
b. Lidar signal calibration
The Lidar backscatter PM10 measurement technique requires a more meticulous approach to obtain an unambiguous conversion of the backscatter coefficient into PM10 concentration. Additional monitoring instruments for measuring laser beam backscatter coefficients, humidity, and atmospheric absorption are required. A new calibration procedure will then be developed. This work can be carried out simultaneously with the exposure study.
c. Model development and refinement
A significant limitation of model skill (whether CALPUFF, AUSPLUME or other tools) relates to the accuracy of the meteorological schemes employed within the model. The Lidar wind field measurement capability provides an opportunity to assess (and
CRC CARE Technical Report no. 33 30 Advanced Lidar Port Hedland dust study: Broadscale, real-time dust tracking and measurement
potentially improve) the skill of the meteorological model. To this end an initiative has commenced to quantify the performance of the WRF model at high spatial resolution under local conditions.
The wind forecasts at various meteorological monitoring stations around the port are being compared to measured data from masts and the Lidar. The preliminary results are encouraging. However, it is obvious that the accuracy of measurements at several monitoring sites is compromised by trees and buildings. An understanding of the skill of the wind forecast component will provide insights into the accuracy of the dust prediction outputs.
d. Emissions flux estimates
Model skill will also be influenced by the accuracy of input variables including emissions rates from various bulk storage and ore handling sources. The task of quantifying emissions fluxes is challenging due to differences in the physical properties of the ore (size, weight, composition), its distribution and orientation to wind direction. The current study has demonstrated the potential to use the Lidar to derive flux estimates from ship loading. The technique can be adapted to deriving time averaged data from dust major sources using a step stare scanning strategy.
e. Effectiveness of dust mitigation strategies
As in the above application the Lidar can be employed to evaluate the effectiveness of various dust mitigation strategies under a range of operational and weather conditions. For example, adjacent stockpiles utilising different dust suppression approaches will be scanned simultaneously, yielding a direct comparison in sets of identical atmospheric conditions.
A dust mitigation strategy will be developed based on detailed knowledge of dust sources, emission levels, atmospheric transport processes, and deposition rates under a range of operational and weather conditions. Industry partners will toned to be actively engaged to ensure practical and cost-effective outcomes.
f. Rationalising the ambient monitoring network
There is a strong case for reviewing the design and configuration of the current monitoring network. The network is largely the product of historical decision-making by individual companies to meet their internal operational requirements and for reporting to the government regulator. In some cases the (Thomas Street, Hospital) monitoring stations are located near buildings and trees, and consequently do not meet accepted industry guidelines for ambient monitoring (AS/NZS35.1.1207).
Despite the recent (positive) initiatives to extend the areal extent of monitoring, and to coordinate data management, the network was not designed to meet the evolving needs of a comprehensive air quality management strategy. Certainly, the current network is not optimised to generate high quality data necessary for validating air quality models in the Port, and is not able to capture the full range of meteorological features and dust deposition processes necessary for the health risk assessment.
The insights into local flow dynamics and plume behaviour from the Lidar together with on-ground validation activities can be used to optimise the design of the ambient
CRC CARE Technical Report no. 33 31 Advanced Lidar Port Hedland dust study: Broadscale, real-time dust tracking and measurement
monitoring network. An appropriately configured and located CDL system will bring near real-time capability for mapping of dust and wind fields to a range of 10 to 15 km with better than 50 m resolution.
g. Rationalising the number of monitoring stations
There is significant potential to reduce operating costs by rationalising the number of monitoring stations whilst simultaneously improving data quality and measurement coverage using the Lidar. An appropriately configured system will elevate the need to install additional infrastructure as industry expands its operations within the harbour or offshore (the proposed outer harbour development).
h. Fence-line monitoring
There are significant challenges with determining the origin and fate of dust emissions using existing monitoring infrastructure. The challenge includes the need to install a network of monitors upwind and downwind of individual company operations to capturing the horizontal and vertical dust profile. In some instances, towers will need to be constructed. Modelling is often used as a surrogate, however, the accuracy of the tools is highly questionable for reasons previously discussed.
The CDL offers a potential solution to the challenge through the ability to pinpoint individual emission sources, map the 3D dust transportation, and distinguish between plume and background sources.
i. Development of an expert system
The possibility of developing an expert system for use at the port should be investigated. The system would comprise a fully autonomous Lidar system and tailored data post-processing software to provide real time information on relevant dust and atmospheric parameters. The data products could be streamed in real time to a central management authority, and/or to individual companies for interpretation and action, as appropriate.
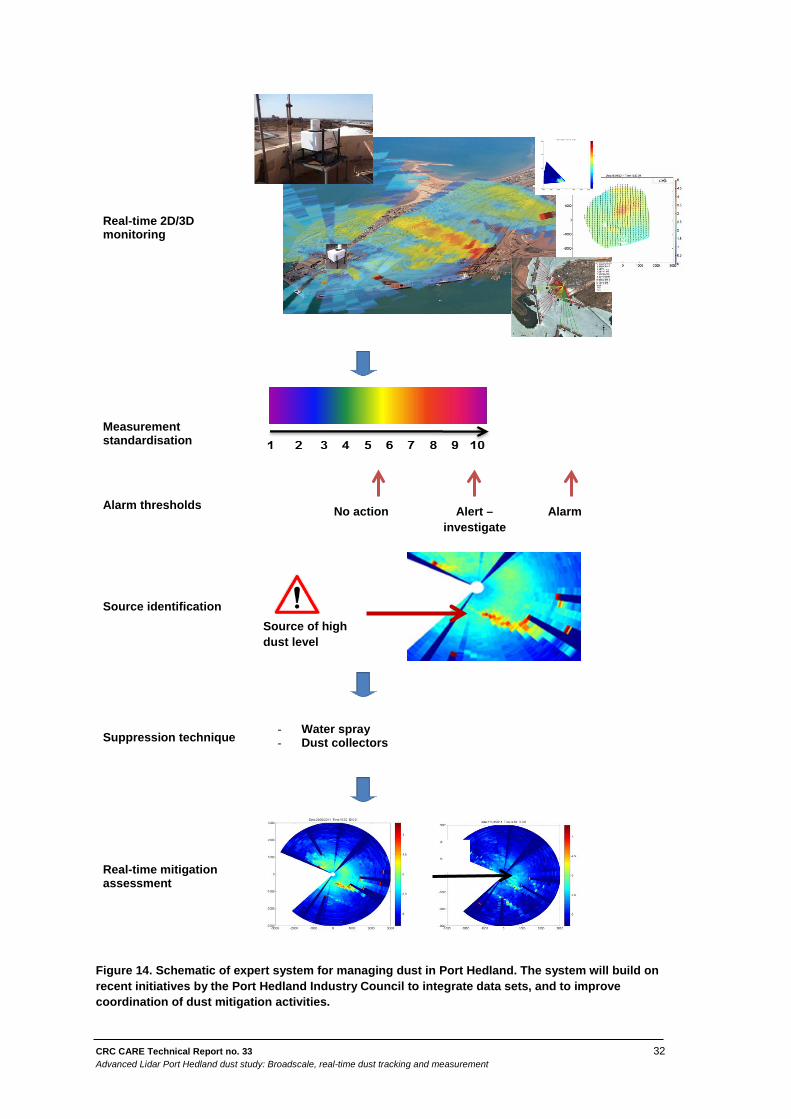
The expert system would provide a number of scanning strategies to address user needs. It would provide a full 360 degree view of dust emissions, emission flux estimates, plume movement, dust path predictions, standard and tailored meteorological products (wind rose, vertical profile, boundary layer height, atmospheric mixing and turbulence, and time series records for modelling). A schematic describing the concept is presented in Figure 14.
The system will incorporate a standardised dust measurement index to provide spatially resolved dust concentration data across all operations. The index will be used by production managers to initiate dust mitigation measures when threshold measurement is approached or exceeded. A multi-stage management and response protocol (MRP) could be employed to clarify intervention targets and ensure consistent responses to operational challenges. The MRP will prescribe minimum response measures, the effectiveness of which can be reviewed and adjusted according to local circumstances. As the system evolves and government and industry policy settings mature, a local emissions trading scheme could be introduced to provide flexibility and encourage efficiency.
CRC CARE Technical Report no. 33 32 Advanced Lidar Port Hedland dust study: Broadscale, real-time dust tracking and measurement
Real-time 2D/3D monitoring
Measurement standardisation
Alarm thresholds
Source identification
Suppression technique
- Water spray - Dust collectors
Real-time mitigation assessment
Figure 14. Schematic of expert system for managing dust in Port Hedland. The system will build on recent initiatives by the Port Hedland Industry Council to integrate data sets, and to improve coordination of dust mitigation activities.
Source of high dust level
Alarm Alert – investigate
No action
CRC CARE Technical Report no. 33 33 Advanced Lidar Port Hedland dust study: Broadscale, real-time dust tracking and measurement
j. Policy considerations
Considerable resources have been expended by government and industry over the past decade in an attempt to address potential health concerns and to mitigate environmental impacts. A subset of the work has focussed on examining the appropriateness of using the PM10 NEPM and PM2.5 advisory standard as the key measure for setting management objectives throughout the air shed. The WA State Government subsequently agreed to provide industry with greater management flexibility with the introduction of a five year Interim Management Guideline until 2015. It is anticipated that the HRA will provide guidance on acceptable exposure levels in different areas of the port.
Whilst it would be inappropriate to speculate on the outcome of the HRA, it is difficult to see how the Government Regulator (DER) can continue to support a policy framework which ignores dust impacts on the most affected population (i.e. the West End). Furthermore, the imposition of the NEPM, or a modified version of the current Management Guideline incorporating more flexible exposure criteria, is unlikely to provide a practical solution to the dust management challenge. The Lidar project has identified that a single policy mechanism such as the 24 hr average PM10 criteria is inappropriate as it masks the impacts of high intensity plumes on specific population centres.
Individuals who are exposed to high intensity plumes (in the order of 550µg) are not interested in the 24 hr average concentration level. Rather they expect the government to ensure that exposure levels are within acceptable limits experienced in other population centres throughout the country. Furthermore, establishing land use controls based on the output of flawed modelling, and arbitrary decisions on the acceptable number of NEPM exceedance, is contested.
k. Continuous improvement framework
An alternative strategy based on the concept of Continuous Improvement is worthy of investigation. The strategy would be underpinned by a comprehensive understanding of dust sources, transportation processes, deposition, and impacts on affected communities.
Aspiration targets could be set for different geographic areas within the defined air quality management zone). The targets could be bound by performance thresholds, similar to those currently used in the Kwinana Environmental Protection Area for managing carbon dioxide (CO2). The targets will include threshold criteria (i.e. peak concentration limits linked to exposure periods, for example 1 hr, 6 hrs, and 24 hrs). This will address the challenge with high exposure from plumes currently experienced in the West End.
The management targets should be set for specified area using criteria from the HRA. The HRC should establish a range of acceptable exposures for PM10 and/or PM2.5.
A systematic assessment of emission sources would follow over a 12-month period. The assessment would describe the emission profile and include a cost-benefit analysis of the (say) top 20% of sources to establish priorities for targeted emission reductions. This information will provide stakeholders with what could be achieved and at what cost.

CRC CARE Technical Report no. 33 34 Advanced Lidar Port Hedland dust study: Broadscale, real-time dust tracking and measurement
Emission reduction targets can then be established within a rolling three-year timeframe until exposure levels on sensitive population centres lie within the range of acceptable PM10 levels, as established by the HRA.
Acknowledgements: we would like to thank the PHPA and the Port Hedland Industries Council for their assistance including provision of the crane for installing the Lidar and providing access to the data from the fixed point monitoring stations. The University of Notre Dame, Indiana, USA is also thanked for providing access and technical support for operating the Halo Lidar.
CRC CARE Technical Report no. 33 35 Advanced Lidar Port Hedland dust study: Broadscale, real-time dust tracking and measurement
12. References
Banta, RM, Newsom, RK, Lundquist, JK, Pichugina, RL, Coulter, RL & Mahrt, L 2002, 'Nocturnal low-level jet characteristics over Kansas during CASES-99', Boundary-Layer Meteorology, 105, pp. 221-252.
Calhoun, R, Retallack, C, Christman, A & Fernando, H 2008, 'Meteorological Mechanisms and Pathways of Pollution Exposure: Coherent Doppler Lidar Deployment in Wagerup', prepared for Department of Environment and Conservation, WA, 2008, 97 pages.
ChemCentre 2012, 'Data collection to support Health Risk Assessment Guidelines', technical report to the Port Hedland Taskforce.
Choukulkar, A, Calhoun, R, and Fernando, HJS 2011, 'The use of Lidar-detected smoke puff evolution for dispersion calculations', Meteorol. Appl. 18, pp. 188–197.
Department of State Development 2010, 'Port Hedland air quality and noise management plan', in The Port Hedland dust management taskforce report, Government of Western Australia, WA.
ENVIRON Australia Pty Ltd. 2004, Port Hedland dust modelling assessment, Fortescue Metals Group Limited, WA.
Pearson, GN, Roberts, PJ, Eacock, JR & Harris, M. 2002, 'Analysis of the performance of a coherent pulsed fiber Lidar for aerosol backscatter applications', Applied Optics, vol. 41, no. 30, pp. 6442-6450.
Physick, WL 2001, Meteorology and air quality of the Pilbara region, CSIRO Atmospheric Research, Aspendale.
Sinclair Knight Merz 2007, Port Hedland cumulative impact study. A report to the taskforce on health, environment and industry sustainability. Department of Industry and Resources, WA.
Sutton, R 2009, Coherent Doppler Lidar for measurement of particulate emissions. Report presented for the award of the degree of Bachelor of Engineering (Mining Environmental Engineering) of the Curtin University of Technology, Kalgoorlie, WA Australia.
Tapp R 1996, A brief investigation of sea breezes along the Pilbara coast between Port Hedland and Dampier. Report to Department of Environmental Protection, Western Australia, September 1996, Climate and Consultancy section, Bureau of Meteorology, Perth, WA.
CRC CARE Technical Report no. 33 36 Advanced Lidar Port Hedland dust study: Broadscale, real-time dust tracking and measurement
APPENDIX A. Port Hedland Dust Workshop – Port Hedland Health Risk Assessment

CRC CARE Technical Report no. 33 37 Advanced Lidar Port Hedland dust study: Broadscale, real-time dust tracking and measurement
APPENDIX B. Proposed air monitoring program
Port Hedland Dust Management Taskforce, 2008
The air monitoring program for the Port Hedland air shed will consist of a consolidated network, involve a number of companies with existing and/or new facilities in the Port Hedland area, and focus on the following three (3) key areas.
Development of ambient air monitoring network
The proposed air monitoring program will address the current challenges with the existing air monitoring network by extending and improving the network. This will ensure that the key issues previously highlighted (for example, spatial resolution) are addressed. The existing air monitoring infrastructure will be reviewed to determine what existing infrastructure is acceptable and what additional infrastructure is required.
All monitoring methodologies used in the network must comply with relevant Australian Standards to ensure that the data collected are of acceptable quality. A combination of ‘continuous’ and filter-based particle monitoring methods will be deployed. Continuous monitoring of particles is required so that dust concentrations over short time periods (e.g. minutes) can be used to identify dust ‘events’ (either natural or from industry activity). Monitoring of additional air pollutants will be considered as the network develops.
The ambient air monitoring network will consist of a minimum of five monitoring stations in Port Hedland, including filter-based monitoring of TSP, continuous monitoring of PM10 and PM2.5 and basic meteorological monitoring. Initially, two or three of these monitoring stations will have both continuous PM2.5 and filter-based TSP monitoring in addition to the other NEPM ‘criteria pollutants’. Monitoring stations with continuous PM10, filter-based TSP and basic meteorological monitoring will also be needed at the Airport, South Hedland and Wedgefield. Two background stations with continuous PM10, filter-based TSP and basic meteorological monitoring will be required as a reliable measure of background dust.
In addition to these air monitoring stations, two comprehensive and properly sited meteorological stations will be located in Port Hedland and another to the south of Port Hedland. Monitoring will be undertaken by a consolidated network of key companies and managed by DER. Air monitoring reports will be provided to DOH for analysis.
Development of programs for industry fence-line monitoring
Practical programs for industry fence-line particle monitoring will be developed for individual companies so that emission targets set for each company are successfully met. These programs will be developed to address both dust management and compliance requirements. Further air monitoring data is required to confirm the boundaries of industrial emission planning control areas.
The sitting of fence-line particle monitors will generally be aligned with adjacent ambient air monitors, both upwind and downwind of primary particle sources. This arrangement will provide data on the contribution of different industry sources to air quality events. Monitors

CRC CARE Technical Report no. 33 38 Advanced Lidar Port Hedland dust study: Broadscale, real-time dust tracking and measurement
must be identical across industries for comparability, with cumulative data providing a sound basis for air quality management strategies.
Development of research to assist in addressing information gaps
There are significant deficiencies in our knowledge of dust management issues, particularly in reference to industry fence-line monitoring of particles. These gaps require the ongoing gathering of information through research projects addressing the key areas of source identification, atmospheric dynamics, dust suppression methods and alternative PM2.5 measurement techniques. The key purpose of this research is to identify cost-effective dust management and monitoring techniques.
Identification of major sources of particle emissions in Port Hedland may be achieved by using a combination of instruments such as Lidar, Sodar, RASS, a flux tower and in situ particle sensors to develop 3D profiles. Using this method, ‘hotspots’ from plume emissions from trains, heavy machinery and stockpiles are easier to identify. The development of alternative particle measurement techniques that provide a more comprehensive assessment of dust levels in an air shed will remove the need for ambient particle monitoring at the point source.
The atmospheric state (e.g. wind direction, turbulence, wind shear) determines not only the dispersion characteristics of particles, but the source of the particles. Research in relation to these dynamics as well as dust suppression methods with specific reference to stockpiles is urgently needed.
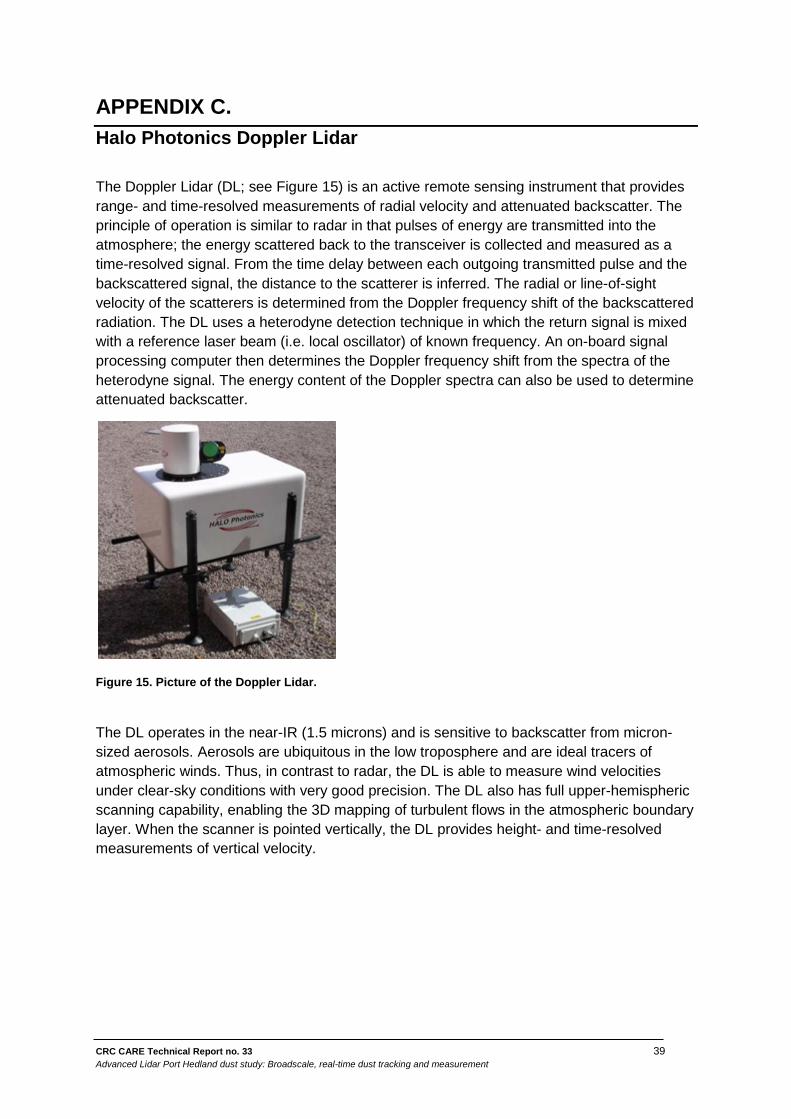
CRC CARE Technical Report no. 33 39 Advanced Lidar Port Hedland dust study: Broadscale, real-time dust tracking and measurement
APPENDIX C. Halo Photonics Doppler Lidar
The Doppler Lidar (DL; see Figure 15) is an active remote sensing instrument that provides range- and time-resolved measurements of radial velocity and attenuated backscatter. The principle of operation is similar to radar in that pulses of energy are transmitted into the atmosphere; the energy scattered back to the transceiver is collected and measured as a time-resolved signal. From the time delay between each outgoing transmitted pulse and the backscattered signal, the distance to the scatterer is inferred. The radial or line-of-sight velocity of the scatterers is determined from the Doppler frequency shift of the backscattered radiation. The DL uses a heterodyne detection technique in which the return signal is mixed with a reference laser beam (i.e. local oscillator) of known frequency. An on-board signal processing computer then determines the Doppler frequency shift from the spectra of the heterodyne signal. The energy content of the Doppler spectra can also be used to determine attenuated backscatter.
Figure 15. Picture of the Doppler Lidar.
The DL operates in the near-IR (1.5 microns) and is sensitive to backscatter from micron-sized aerosols. Aerosols are ubiquitous in the low troposphere and are ideal tracers of atmospheric winds. Thus, in contrast to radar, the DL is able to measure wind velocities under clear-sky conditions with very good precision. The DL also has full upper-hemispheric scanning capability, enabling the 3D mapping of turbulent flows in the atmospheric boundary layer. When the scanner is pointed vertically, the DL provides height- and time-resolved measurements of vertical velocity.
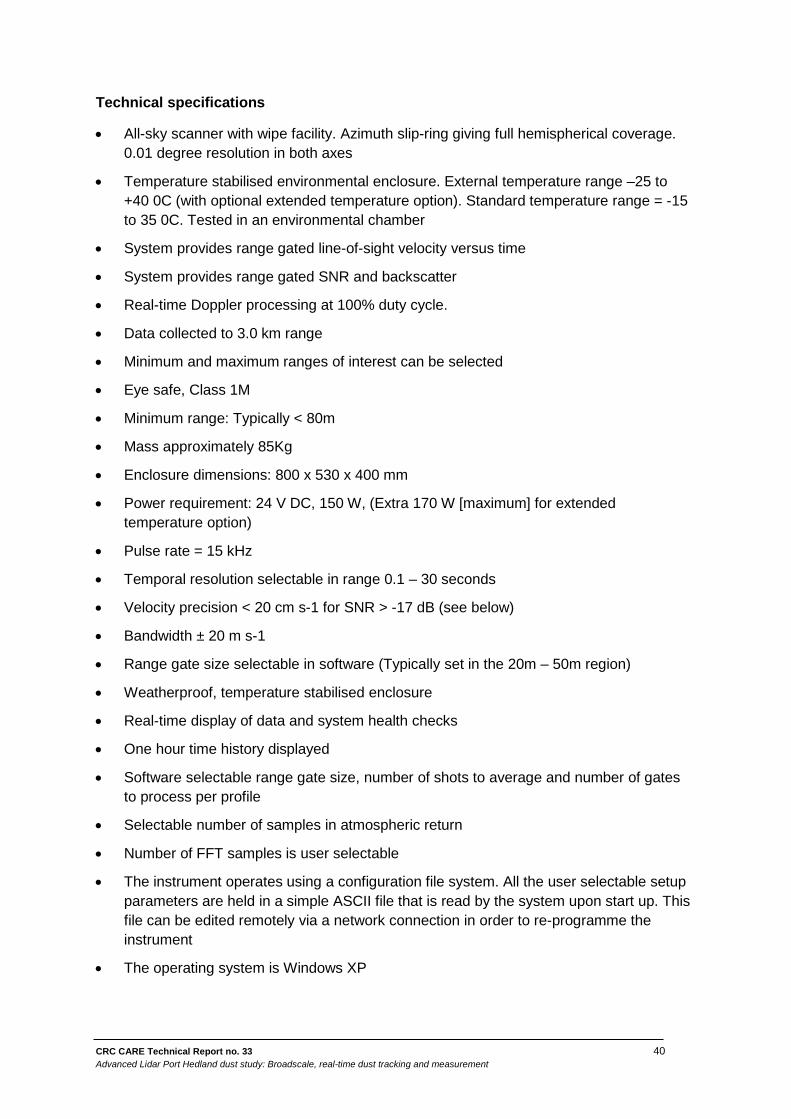
CRC CARE Technical Report no. 33 40 Advanced Lidar Port Hedland dust study: Broadscale, real-time dust tracking and measurement
Technical specifications
• All-sky scanner with wipe facility. Azimuth slip-ring giving full hemispherical coverage. 0.01 degree resolution in both axes
• Temperature stabilised environmental enclosure. External temperature range –25 to +40 0C (with optional extended temperature option). Standard temperature range = -15 to 35 0C. Tested in an environmental chamber
• System provides range gated line-of-sight velocity versus time
• System provides range gated SNR and backscatter
• Real-time Doppler processing at 100% duty cycle.
• Data collected to 3.0 km range
• Minimum and maximum ranges of interest can be selected
• Eye safe, Class 1M
• Minimum range: Typically < 80m
• Mass approximately 85Kg
• Enclosure dimensions: 800 x 530 x 400 mm
• Power requirement: 24 V DC, 150 W, (Extra 170 W [maximum] for extended temperature option)
• Pulse rate = 15 kHz
• Temporal resolution selectable in range 0.1 – 30 seconds
• Velocity precision < 20 cm s-1 for SNR > -17 dB (see below)
• Bandwidth ± 20 m s-1
• Range gate size selectable in software (Typically set in the 20m – 50m region)
• Weatherproof, temperature stabilised enclosure
• Real-time display of data and system health checks
• One hour time history displayed
• Software selectable range gate size, number of shots to average and number of gates to process per profile
• Selectable number of samples in atmospheric return
• Number of FFT samples is user selectable
• The instrument operates using a configuration file system. All the user selectable setup parameters are held in a simple ASCII file that is read by the system upon start up. This file can be edited remotely via a network connection in order to re-programme the instrument
• The operating system is Windows XP
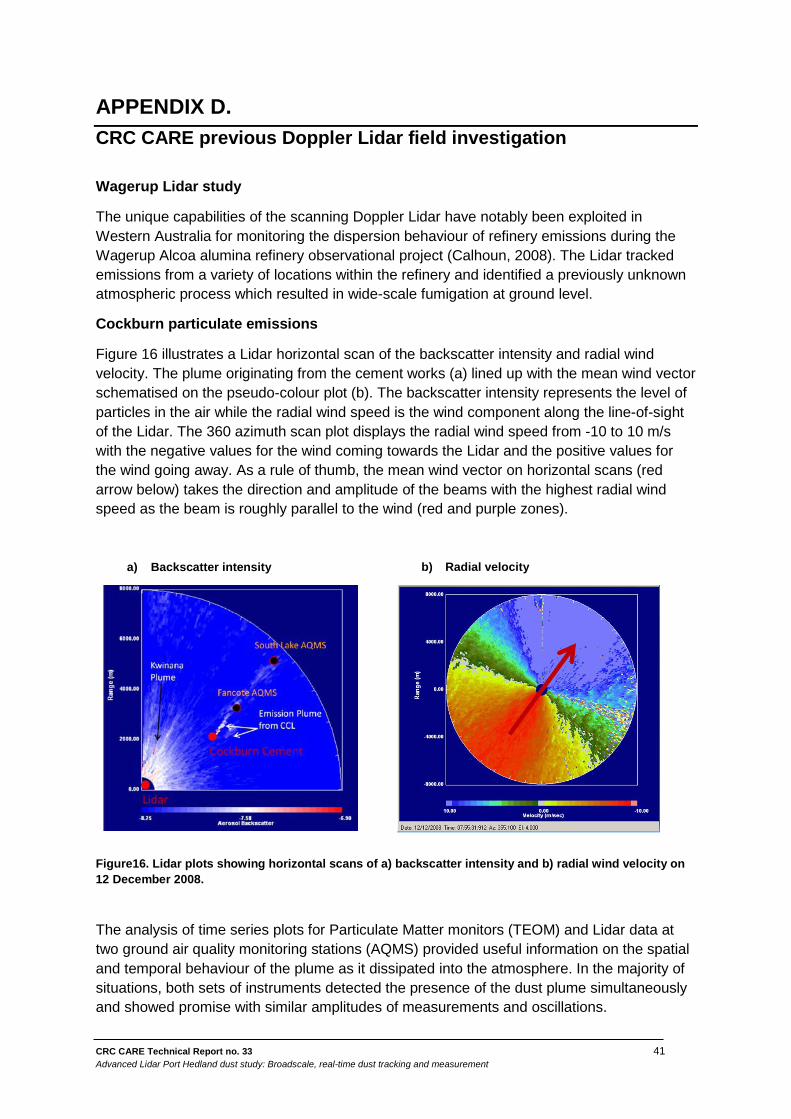
CRC CARE Technical Report no. 33 41 Advanced Lidar Port Hedland dust study: Broadscale, real-time dust tracking and measurement
APPENDIX D. CRC CARE previous Doppler Lidar field investigation
Wagerup Lidar study
The unique capabilities of the scanning Doppler Lidar have notably been exploited in Western Australia for monitoring the dispersion behaviour of refinery emissions during the Wagerup Alcoa alumina refinery observational project (Calhoun, 2008). The Lidar tracked emissions from a variety of locations within the refinery and identified a previously unknown atmospheric process which resulted in wide-scale fumigation at ground level.
Cockburn particulate emissions
Figure 16 illustrates a Lidar horizontal scan of the backscatter intensity and radial wind velocity. The plume originating from the cement works (a) lined up with the mean wind vector schematised on the pseudo-colour plot (b). The backscatter intensity represents the level of particles in the air while the radial wind speed is the wind component along the line-of-sight of the Lidar. The 360 azimuth scan plot displays the radial wind speed from -10 to 10 m/s with the negative values for the wind coming towards the Lidar and the positive values for the wind going away. As a rule of thumb, the mean wind vector on horizontal scans (red arrow below) takes the direction and amplitude of the beams with the highest radial wind speed as the beam is roughly parallel to the wind (red and purple zones).
a) Backscatter intensity b) Radial velocity
Figure16. Lidar plots showing horizontal scans of a) backscatter intensity and b) radial wind velocity on 12 December 2008.
The analysis of time series plots for Particulate Matter monitors (TEOM) and Lidar data at two ground air quality monitoring stations (AQMS) provided useful information on the spatial and temporal behaviour of the plume as it dissipated into the atmosphere. In the majority of situations, both sets of instruments detected the presence of the dust plume simultaneously and showed promise with similar amplitudes of measurements and oscillations.
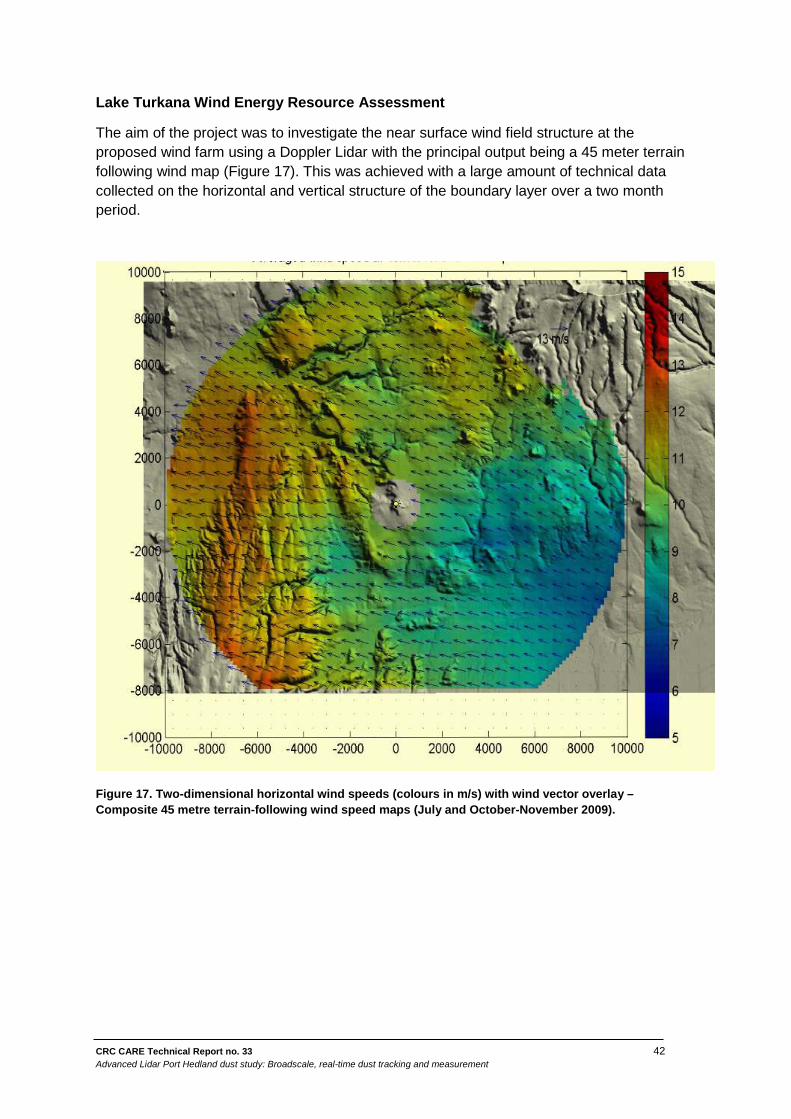
CRC CARE Technical Report no. 33 42 Advanced Lidar Port Hedland dust study: Broadscale, real-time dust tracking and measurement
Lake Turkana Wind Energy Resource Assessment
The aim of the project was to investigate the near surface wind field structure at the proposed wind farm using a Doppler Lidar with the principal output being a 45 meter terrain following wind map (Figure 17). This was achieved with a large amount of technical data collected on the horizontal and vertical structure of the boundary layer over a two month period.
Figure 17. Two-dimensional horizontal wind speeds (colours in m/s) with wind vector overlay – Composite 45 metre terrain-following wind speed maps (July and October-November 2009).
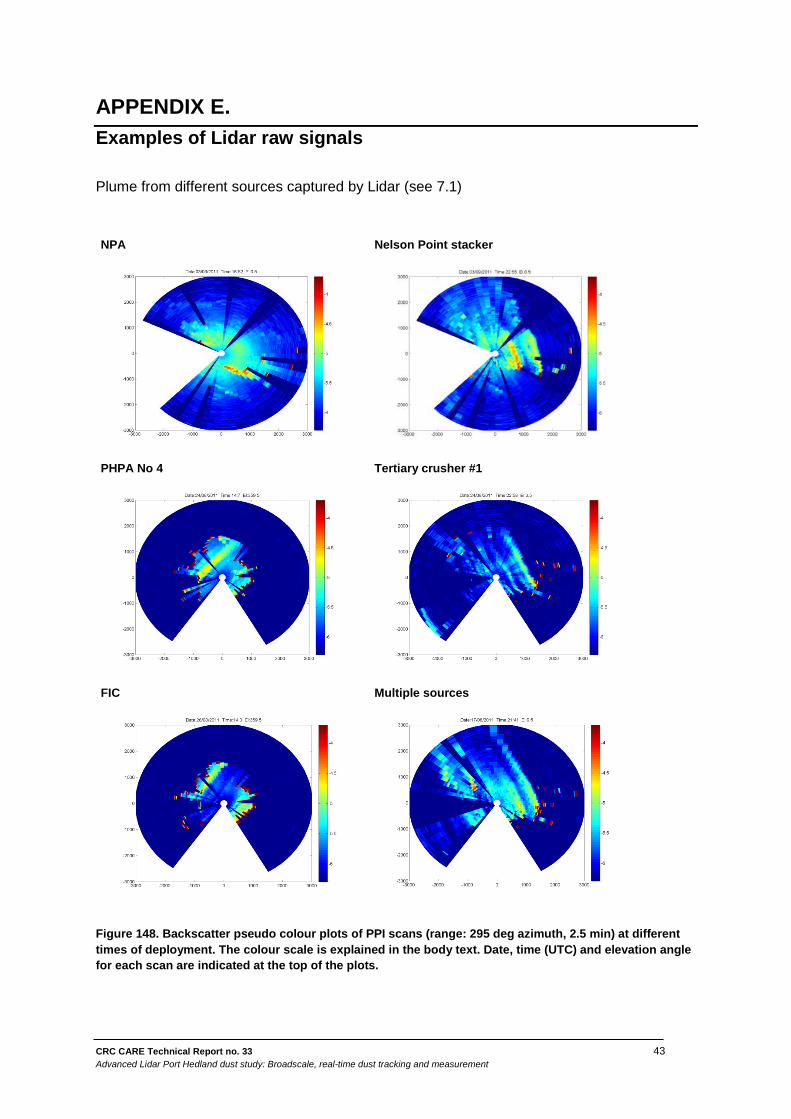
CRC CARE Technical Report no. 33 43 Advanced Lidar Port Hedland dust study: Broadscale, real-time dust tracking and measurement
APPENDIX E. Examples of Lidar raw signals
Plume from different sources captured by Lidar (see 7.1)
NPA Nelson Point stacker
PHPA No 4 Tertiary crusher #1
FIC Multiple sources
Figure 148. Backscatter pseudo colour plots of PPI scans (range: 295 deg azimuth, 2.5 min) at different times of deployment. The colour scale is explained in the body text. Date, time (UTC) and elevation angle for each scan are indicated at the top of the plots.
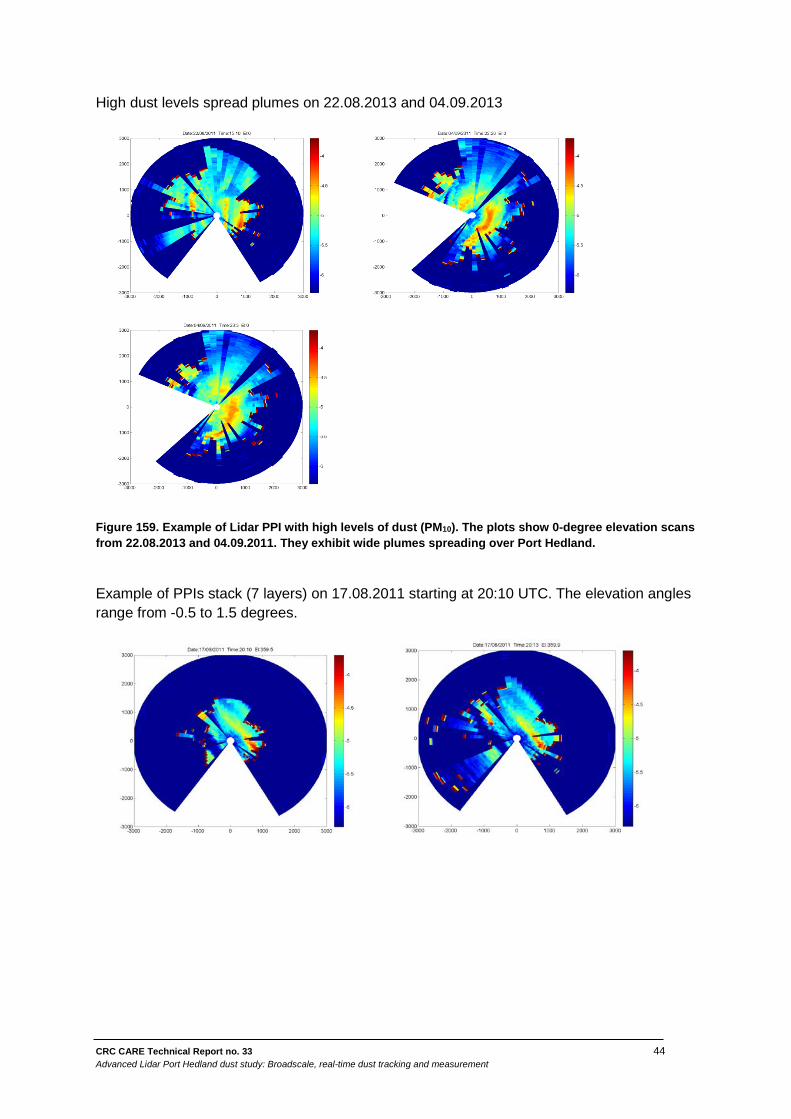
CRC CARE Technical Report no. 33 44 Advanced Lidar Port Hedland dust study: Broadscale, real-time dust tracking and measurement
High dust levels spread plumes on 22.08.2013 and 04.09.2013
Figure 159. Example of Lidar PPI with high levels of dust (PM10). The plots show 0-degree elevation scans from 22.08.2013 and 04.09.2011. They exhibit wide plumes spreading over Port Hedland.
Example of PPIs stack (7 layers) on 17.08.2011 starting at 20:10 UTC. The elevation angles range from -0.5 to 1.5 degrees.
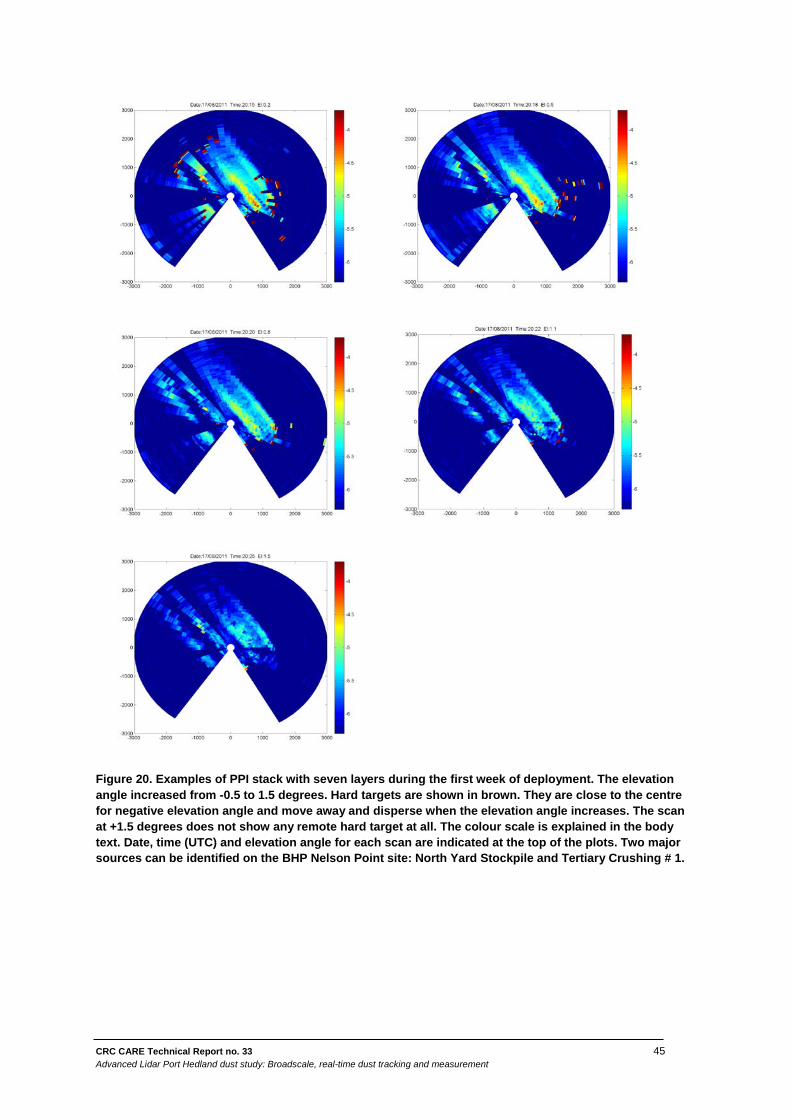
CRC CARE Technical Report no. 33 45 Advanced Lidar Port Hedland dust study: Broadscale, real-time dust tracking and measurement
Figure 20. Examples of PPI stack with seven layers during the first week of deployment. The elevation angle increased from -0.5 to 1.5 degrees. Hard targets are shown in brown. They are close to the centre for negative elevation angle and move away and disperse when the elevation angle increases. The scan at +1.5 degrees does not show any remote hard target at all. The colour scale is explained in the body text. Date, time (UTC) and elevation angle for each scan are indicated at the top of the plots. Two major sources can be identified on the BHP Nelson Point site: North Yard Stockpile and Tertiary Crushing # 1.
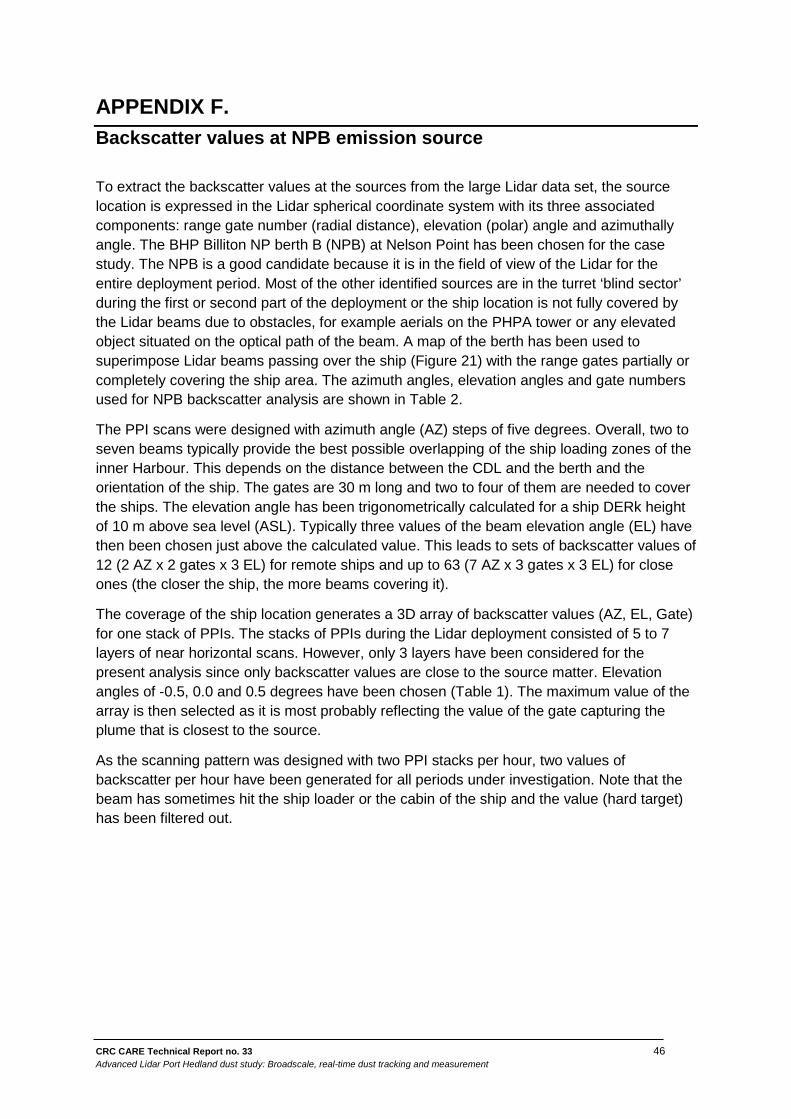
CRC CARE Technical Report no. 33 46 Advanced Lidar Port Hedland dust study: Broadscale, real-time dust tracking and measurement
APPENDIX F. Backscatter values at NPB emission source
To extract the backscatter values at the sources from the large Lidar data set, the source location is expressed in the Lidar spherical coordinate system with its three associated components: range gate number (radial distance), elevation (polar) angle and azimuthally angle. The BHP Billiton NP berth B (NPB) at Nelson Point has been chosen for the case study. The NPB is a good candidate because it is in the field of view of the Lidar for the entire deployment period. Most of the other identified sources are in the turret ‘blind sector’ during the first or second part of the deployment or the ship location is not fully covered by the Lidar beams due to obstacles, for example aerials on the PHPA tower or any elevated object situated on the optical path of the beam. A map of the berth has been used to superimpose Lidar beams passing over the ship (Figure 21) with the range gates partially or completely covering the ship area. The azimuth angles, elevation angles and gate numbers used for NPB backscatter analysis are shown in Table 2.
The PPI scans were designed with azimuth angle (AZ) steps of five degrees. Overall, two to seven beams typically provide the best possible overlapping of the ship loading zones of the inner Harbour. This depends on the distance between the CDL and the berth and the orientation of the ship. The gates are 30 m long and two to four of them are needed to cover the ships. The elevation angle has been trigonometrically calculated for a ship DERk height of 10 m above sea level (ASL). Typically three values of the beam elevation angle (EL) have then been chosen just above the calculated value. This leads to sets of backscatter values of 12 (2 AZ x 2 gates x 3 EL) for remote ships and up to 63 (7 AZ x 3 gates x 3 EL) for close ones (the closer the ship, the more beams covering it).
The coverage of the ship location generates a 3D array of backscatter values (AZ, EL, Gate) for one stack of PPIs. The stacks of PPIs during the Lidar deployment consisted of 5 to 7 layers of near horizontal scans. However, only 3 layers have been considered for the present analysis since only backscatter values are close to the source matter. Elevation angles of -0.5, 0.0 and 0.5 degrees have been chosen (Table 1). The maximum value of the array is then selected as it is most probably reflecting the value of the gate capturing the plume that is closest to the source.
As the scanning pattern was designed with two PPI stacks per hour, two values of backscatter per hour have been generated for all periods under investigation. Note that the beam has sometimes hit the ship loader or the cabin of the ship and the value (hard target) has been filtered out.
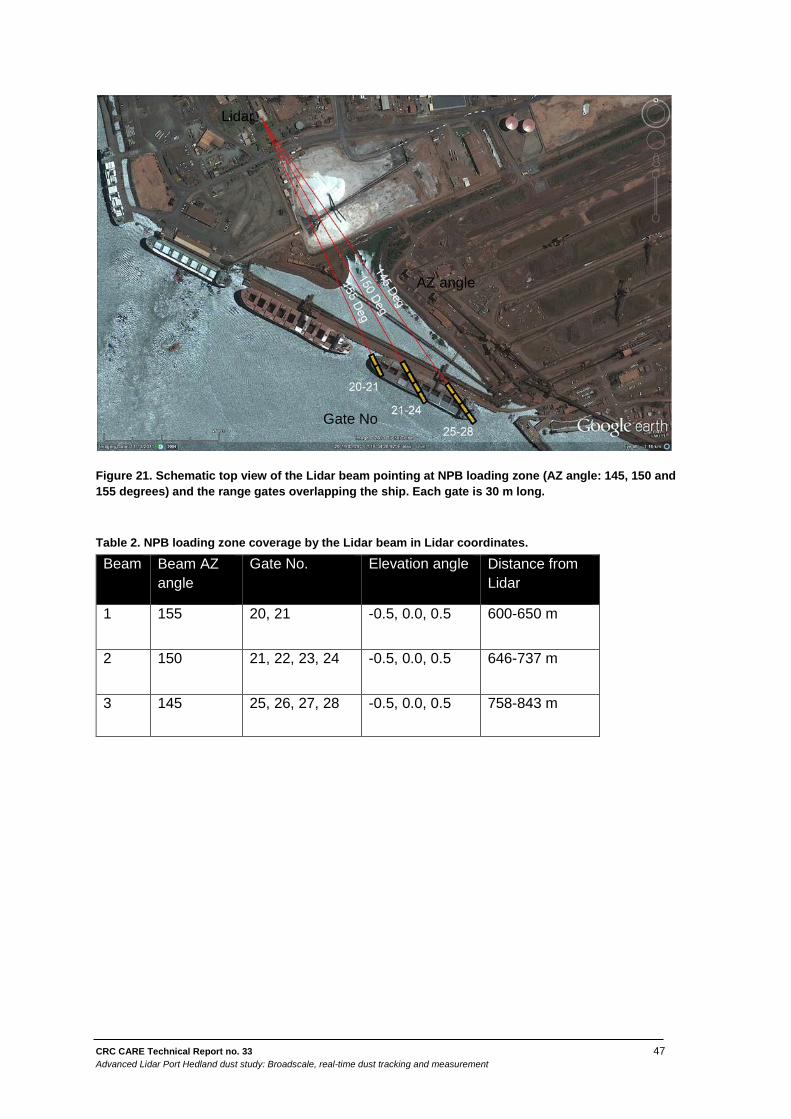
CRC CARE Technical Report no. 33 47 Advanced Lidar Port Hedland dust study: Broadscale, real-time dust tracking and measurement
Figure 21. Schematic top view of the Lidar beam pointing at NPB loading zone (AZ angle: 145, 150 and 155 degrees) and the range gates overlapping the ship. Each gate is 30 m long.
Table 2. NPB loading zone coverage by the Lidar beam in Lidar coordinates.
Beam Beam AZ angle
Gate No. Elevation angle Distance from Lidar
1 155 20, 21 -0.5, 0.0, 0.5 600-650 m
2 150 21, 22, 23, 24 -0.5, 0.0, 0.5 646-737 m
3 145 25, 26, 27, 28 -0.5, 0.0, 0.5 758-843 m
Lidar
Gate No
AZ angle
CRC CARE Technical Report no. 33 48 Advanced Lidar Port Hedland dust study: Broadscale, real-time dust tracking and measurement
APPENDIX G. Scanning strategy for Lidar calibration
During the first week of operation (16.08.2011 – 22.08.2011), Lidar beam stares above the Port Hedland Industry Council PM10 monitoring stations were included in the scanning strategy. The pattern consisted of a series of 17 consecutive sweeps per hour above the three PM10 monitoring stations. Each sweep comprised 3 stares slightly above the stations with one beam centred on the station and two beams on each side with an azimuth shift of ±0.1 degree (for potential pointing misalignment compensation). Three adjacent gates over the stations for each beam have been considered for the analysis. It creates a 3x3 matrix of Lidar backscatter intensities with the central value assigned to the central gate of the central beam overlaying the BAM monitor.
Figure 22. Schematic view of three beams over the Moore St Station. The beams are separated by 0.1 degree azimuth and three adjacent gates have been considered for the analysis.
The 1-week time series of the Lidar backscatter for each gate was compared to the series of BAM PM10 concentrations. It provides the mean to numerically assess the ‘best match’ between the Lidar and BAM curves. The analysis was conducted on the 3x3 matrix of gates for the three stations mentioned above and the gates with the ‘best match’ between the Lidar backscatter and BAM PM10 concentration were selected. The Lidar backscatter intensity being linearly dependent on the aerosol density, a linear transformation of the Lidar signal was utilised. A least square method was applied to optimise the linear Lidar-BAM system solution and the corresponding calibration coefficients were obtained.
PHPA made TSP concentration data available for the entire operational period. The station network consists of nine TSP monitors and two wind sensors. Four TSP stations are located on the east side of the inner harbour (Finucane Island) and five stations on the west side at Utah Point and Stanley Point. These stations provided 24-hour average data. Unfortunately,
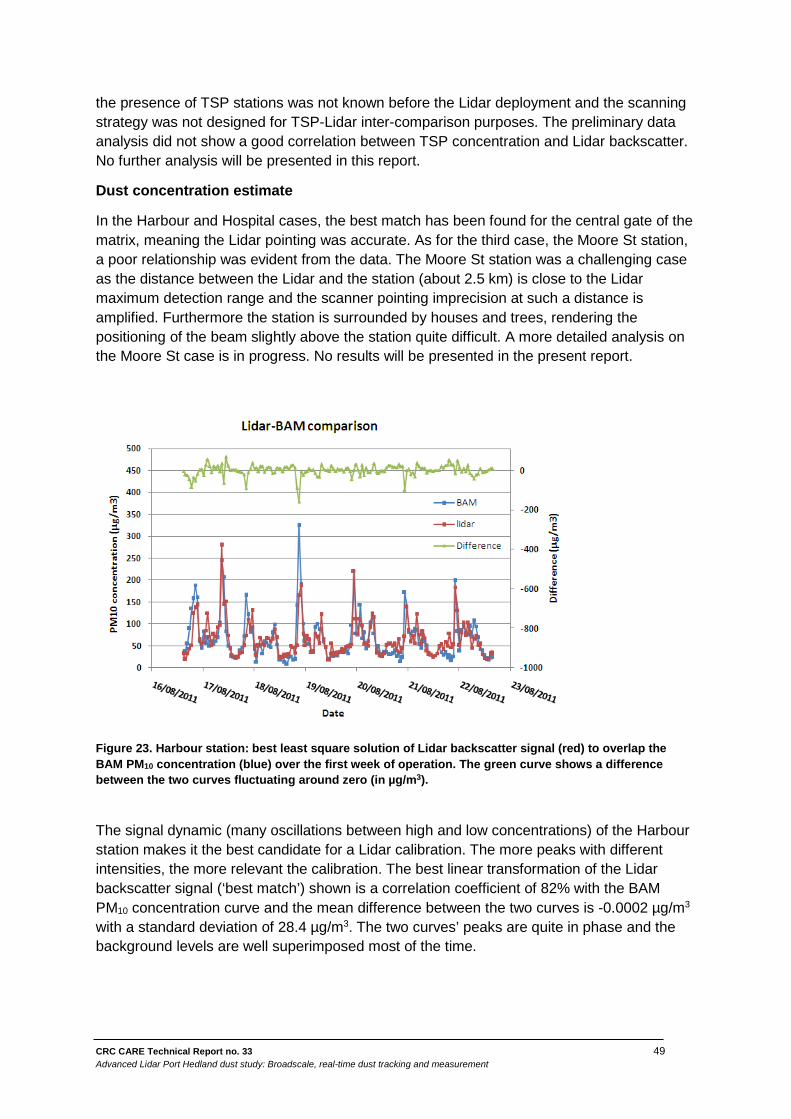
CRC CARE Technical Report no. 33 49 Advanced Lidar Port Hedland dust study: Broadscale, real-time dust tracking and measurement
the presence of TSP stations was not known before the Lidar deployment and the scanning strategy was not designed for TSP-Lidar inter-comparison purposes. The preliminary data analysis did not show a good correlation between TSP concentration and Lidar backscatter. No further analysis will be presented in this report.
Dust concentration estimate
In the Harbour and Hospital cases, the best match has been found for the central gate of the matrix, meaning the Lidar pointing was accurate. As for the third case, the Moore St station, a poor relationship was evident from the data. The Moore St station was a challenging case as the distance between the Lidar and the station (about 2.5 km) is close to the Lidar maximum detection range and the scanner pointing imprecision at such a distance is amplified. Furthermore the station is surrounded by houses and trees, rendering the positioning of the beam slightly above the station quite difficult. A more detailed analysis on the Moore St case is in progress. No results will be presented in the present report.
Figure 23. Harbour station: best least square solution of Lidar backscatter signal (red) to overlap the BAM PM10 concentration (blue) over the first week of operation. The green curve shows a difference between the two curves fluctuating around zero (in µg/m3).
The signal dynamic (many oscillations between high and low concentrations) of the Harbour station makes it the best candidate for a Lidar calibration. The more peaks with different intensities, the more relevant the calibration. The best linear transformation of the Lidar backscatter signal (‘best match’) shown is a correlation coefficient of 82% with the BAM PM10 concentration curve and the mean difference between the two curves is -0.0002 µg/m3
with a standard deviation of 28.4 µg/m3. The two curves’ peaks are quite in phase and the background levels are well superimposed most of the time.
CRC CARE Technical Report no. 33 50 Advanced Lidar Port Hedland dust study: Broadscale, real-time dust tracking and measurement
APPENDIX H. Uncertainties and technology evaluation
Spatial dimension
Sampling volume: BAM PM10 monitors are point monitors sampling ambient air at about 3 m above ground level. The flow rate of sampled air is low (about 20 l/min) and the volume being analysed is consequently quite localised. As described in Chapter [??], the volume sampled by the Lidar laser beam has a pencil-like shape. It is divided in range gates of 30 m of length and a cross-sectional diameter of a few hundred millimetres. The minimum volume sampled by the Halo CDL is one gate. The elongated shape of the gate induces measurement of air masses up to 30 m apart.
Pointing accuracy: The pointing accuracy of the Lidar beam is critical for correctly determining the location of the dust and wind measurement as well as the need to dupicate the data points in space. The alignment procedure for the Halo system consists of levelling the Lidar platform and calibrating the scanner orientation. The platform levelling is performed through the adjustment of telescopic legs and a spirit level and the scanner bearing is obtained against a hard target at a distance from the Lidar with a known position (GPS). The bearing (azimuth angle) can be entered into the control software but there is no setup for the elevation angle calibration. The overall alignment procedure and technology of the Halo CDL is basic and insufficient for high pointing accuracy. A more elaborate alignment system and technique should be put in place for more precise and reliable scanner angle calibration. Therefore, some uncertainty relates to the fact that the Lidar-derived backscatter (and wind) measurement is potentially not performed exactly at the meteorological station location, both in the horizontal and vertical planes.
Temporal dimension
The experiment was designed for a preliminary investigation to determine the utility of using a scanning Doppler Lidar for measuring dust in the ambient environment. The scanning pattern for Lidar-BAM inter-comparison purposes consisted of 17 successive sweeps with 1 second step stares over the stations for about 6.3 min every hour. This is slightly different from the BAM stations which measure continuous 10 minute averages of PM10 concentration. An interpolation is applied to the BAM data to obtain values corresponding to the Lidar time stamps.
The difference in sampling time could actually lead to significant disparities in the results as the Lidar could miss short events of high dust level when pointing to a different station. A better comparison can be achieved if the Lidar is configured to stare at one point monitor during a long time period. Nevertheless, this cannot be achieved when only using a single Lidar for simultaneously measuring long period stares and 3D mapping of winds and plume dispersion.
Aerosols considerations
Particle size: The return signal from the Lidar laser beam (wavelength: 1.55 µm) is essentially composed of photons backscattered by the airborne particles (Mie scattering). Particles are differentiated by their chemical and physical characteristics which lead to
CRC CARE Technical Report no. 33 51 Advanced Lidar Port Hedland dust study: Broadscale, real-time dust tracking and measurement
different optical properties. The Lidar backscatter coefficient is one of these optical properties and is dependent on the particle characteristics, particularly the composition and size of the particle. The Lidar return signal is proportional to the concentration for each particle size weighted by their specific backscatter coefficient. The size distribution of the atmospheric particles mixture therefore plays an important role in the Lidar backscatter intensity. Conversely, BAM monitors measure the concentration of particulate matter with diameter < 10 µm without discerning the size distribution.
The Lidar return signal includes the signal from particles with diameter > 10 µm. It is currently not precisely known how the Lidar signal changes as a function of the particle size distribution. Investigation on this particular issue is part of the ongoing development and is discussed further in Chapter
Water vapour: The effects of humidity on aerosol-component microphysical properties have not been taken into account. With increasing relative humidity values, atmospheric water vapour condenses onto the particles and alters their size and refractive index. This may be applied to hygroscopic particles such as water-soluble or sea-salt components. Even if it makes no sense for insoluble particles such as all mineral components that form Port Hedland dust categories, further investigations will be carried out in the future.
Instrumental biases/uncertainties
Both instruments have their own measurement uncertainties. The accuracy/resolution specifications of the Halo Photonics Lidar and the Met One Instrument BAM are shown in Appendix I.
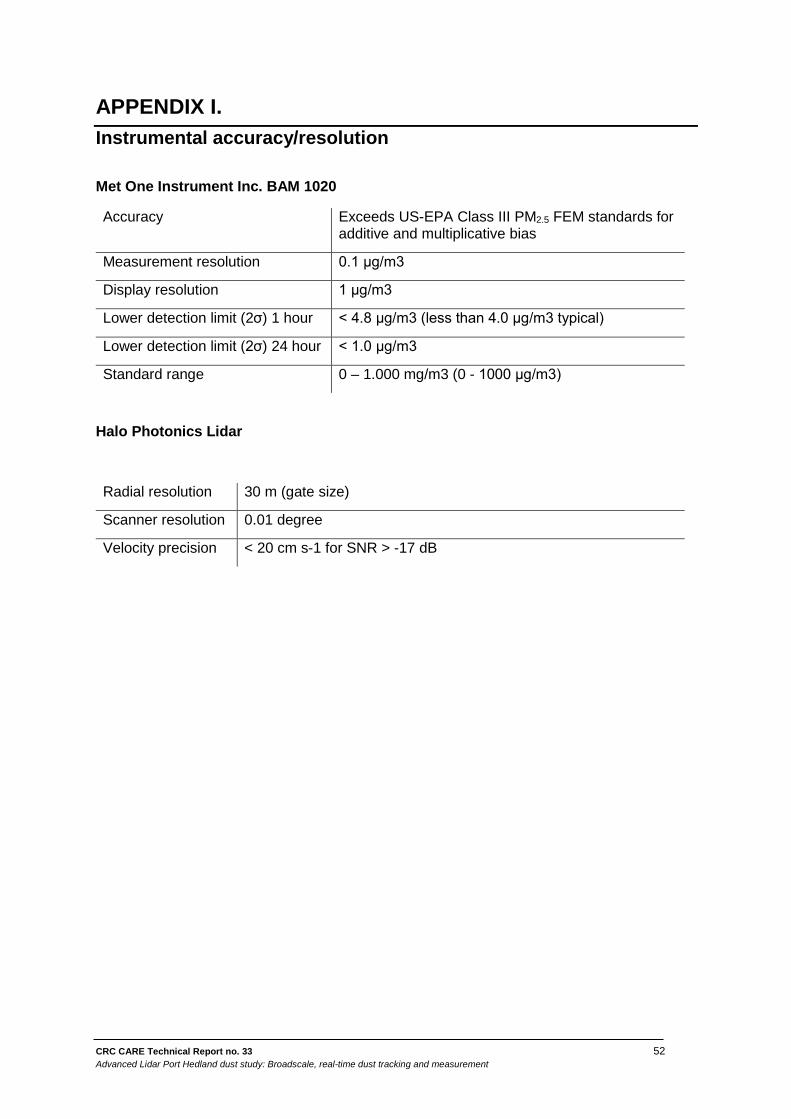
CRC CARE Technical Report no. 33 52 Advanced Lidar Port Hedland dust study: Broadscale, real-time dust tracking and measurement
APPENDIX I. Instrumental accuracy/resolution
Met One Instrument Inc. BAM 1020
Accuracy Exceeds US-EPA Class III PM2.5 FEM standards for additive and multiplicative bias
Measurement resolution 0.1 μg/m3
Display resolution 1 μg/m3
Lower detection limit (2σ) 1 hour < 4.8 μg/m3 (less than 4.0 μg/m3 typical)
Lower detection limit (2σ) 24 hour < 1.0 μg/m3
Standard range 0 – 1.000 mg/m3 (0 - 1000 μg/m3)
Halo Photonics Lidar
Radial resolution 30 m (gate size)
Scanner resolution 0.01 degree
Velocity precision < 20 cm s-1 for SNR > -17 dB
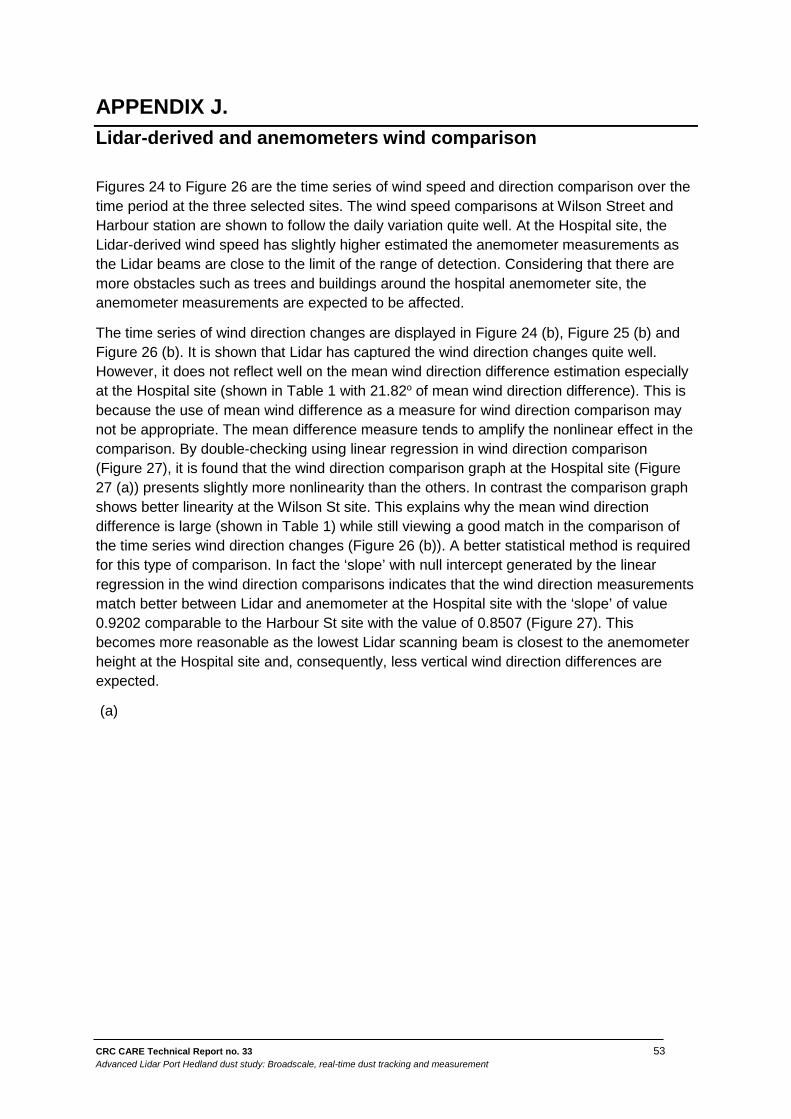
CRC CARE Technical Report no. 33 53 Advanced Lidar Port Hedland dust study: Broadscale, real-time dust tracking and measurement
APPENDIX J. Lidar-derived and anemometers wind comparison
Figures 24 to Figure 26 are the time series of wind speed and direction comparison over the time period at the three selected sites. The wind speed comparisons at Wilson Street and Harbour station are shown to follow the daily variation quite well. At the Hospital site, the Lidar-derived wind speed has slightly higher estimated the anemometer measurements as the Lidar beams are close to the limit of the range of detection. Considering that there are more obstacles such as trees and buildings around the hospital anemometer site, the anemometer measurements are expected to be affected.
The time series of wind direction changes are displayed in Figure 24 (b), Figure 25 (b) and Figure 26 (b). It is shown that Lidar has captured the wind direction changes quite well. However, it does not reflect well on the mean wind direction difference estimation especially at the Hospital site (shown in Table 1 with 21.82o of mean wind direction difference). This is because the use of mean wind difference as a measure for wind direction comparison may not be appropriate. The mean difference measure tends to amplify the nonlinear effect in the comparison. By double-checking using linear regression in wind direction comparison (Figure 27), it is found that the wind direction comparison graph at the Hospital site (Figure 27 (a)) presents slightly more nonlinearity than the others. In contrast the comparison graph shows better linearity at the Wilson St site. This explains why the mean wind direction difference is large (shown in Table 1) while still viewing a good match in the comparison of the time series wind direction changes (Figure 26 (b)). A better statistical method is required for this type of comparison. In fact the ‘slope’ with null intercept generated by the linear regression in the wind direction comparisons indicates that the wind direction measurements match better between Lidar and anemometer at the Hospital site with the ‘slope’ of value 0.9202 comparable to the Harbour St site with the value of 0.8507 (Figure 27). This becomes more reasonable as the lowest Lidar scanning beam is closest to the anemometer height at the Hospital site and, consequently, less vertical wind direction differences are expected.
(a)
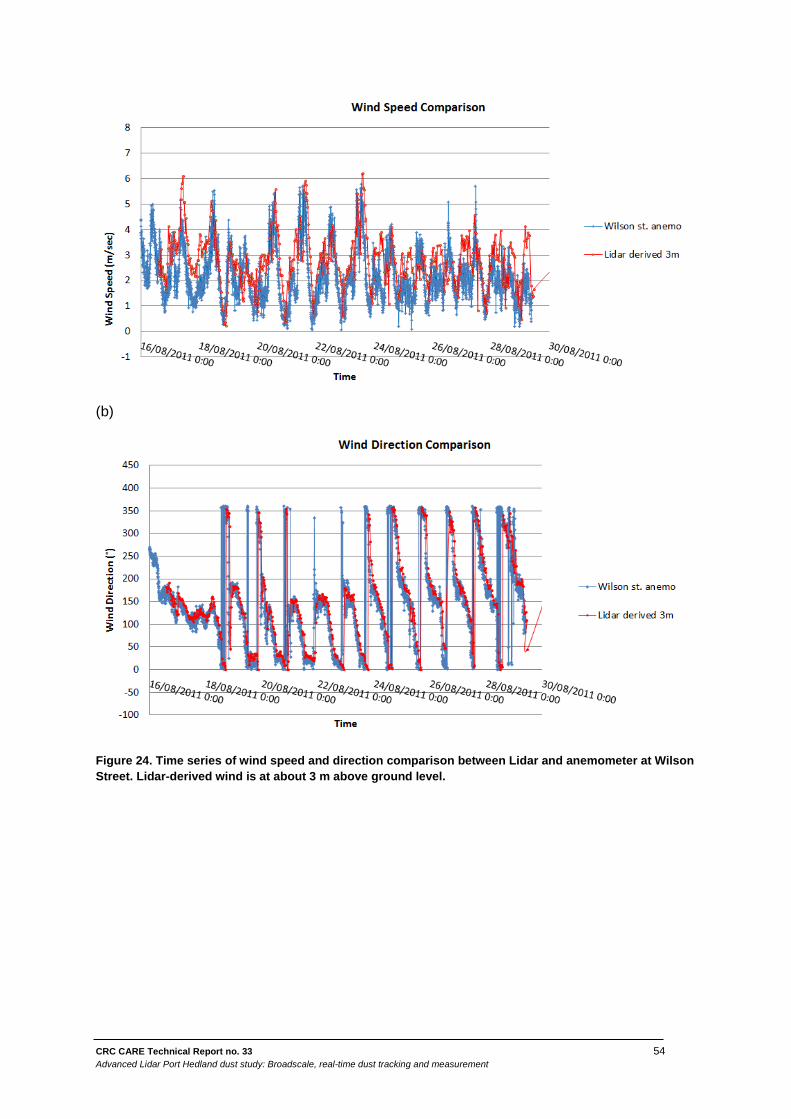
CRC CARE Technical Report no. 33 54 Advanced Lidar Port Hedland dust study: Broadscale, real-time dust tracking and measurement
(b)
Figure 24. Time series of wind speed and direction comparison between Lidar and anemometer at Wilson Street. Lidar-derived wind is at about 3 m above ground level.
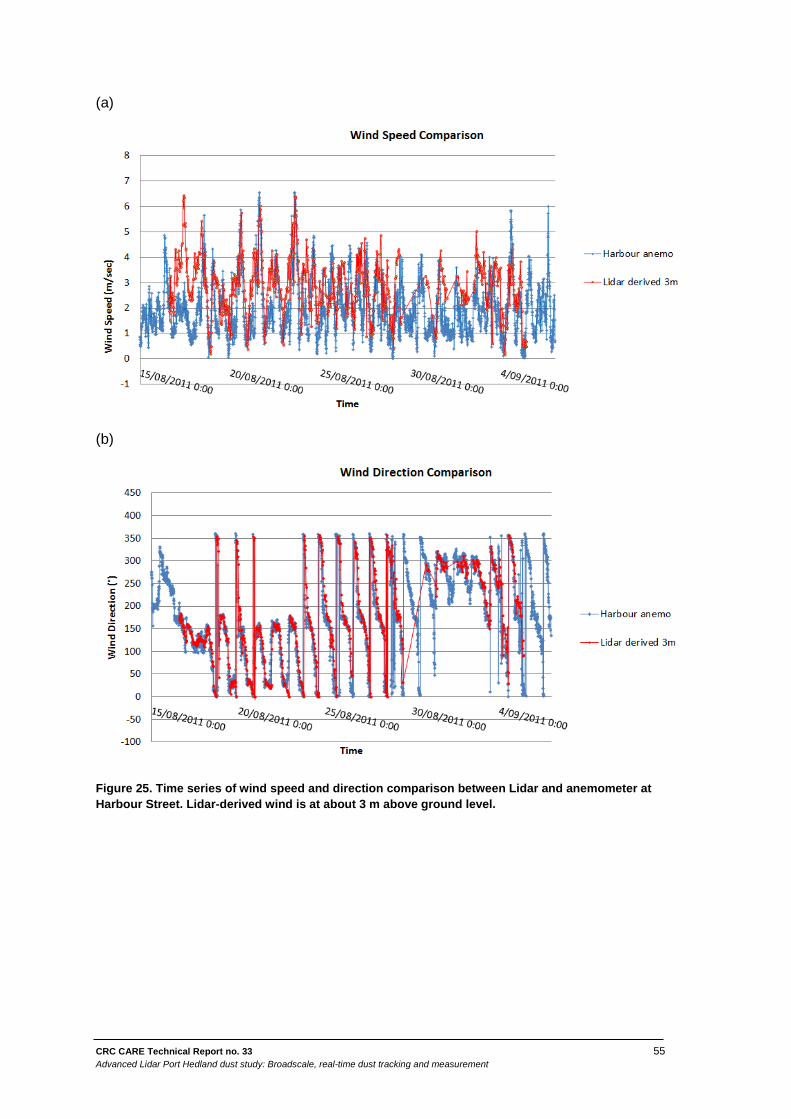
CRC CARE Technical Report no. 33 55 Advanced Lidar Port Hedland dust study: Broadscale, real-time dust tracking and measurement
(a)
(b)
Figure 25. Time series of wind speed and direction comparison between Lidar and anemometer at Harbour Street. Lidar-derived wind is at about 3 m above ground level.
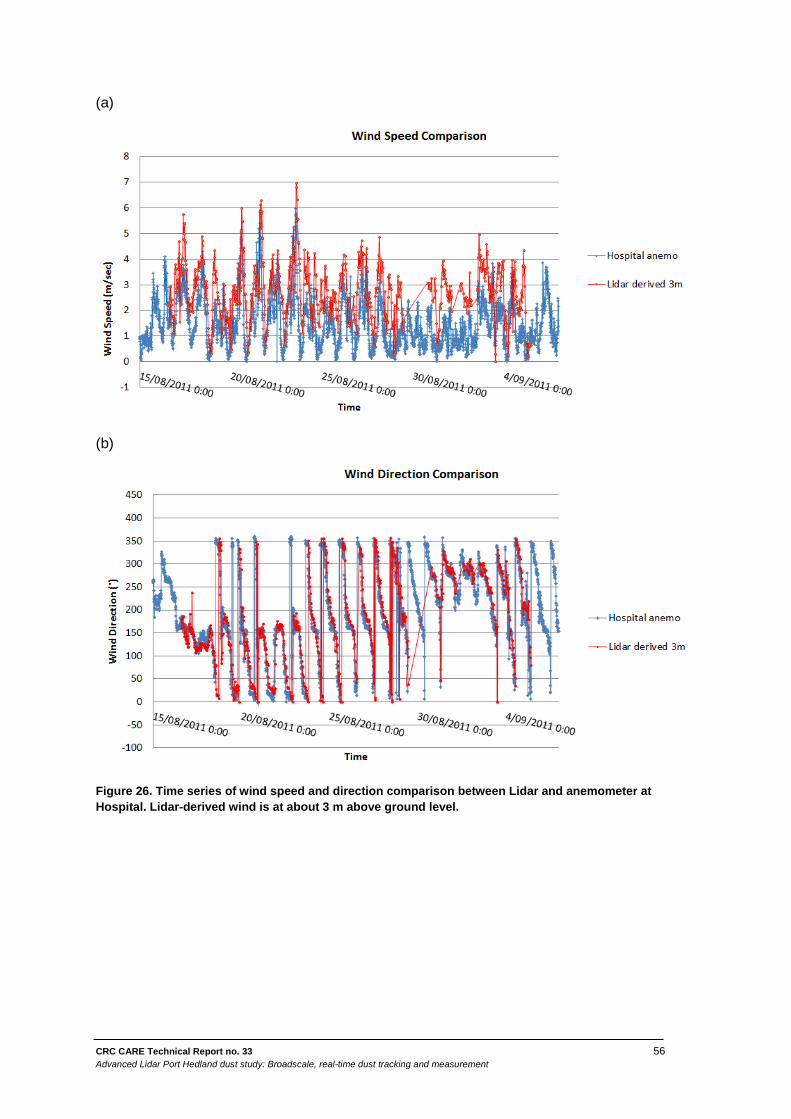
CRC CARE Technical Report no. 33 56 Advanced Lidar Port Hedland dust study: Broadscale, real-time dust tracking and measurement
(a)
(b)
Figure 26. Time series of wind speed and direction comparison between Lidar and anemometer at Hospital. Lidar-derived wind is at about 3 m above ground level.
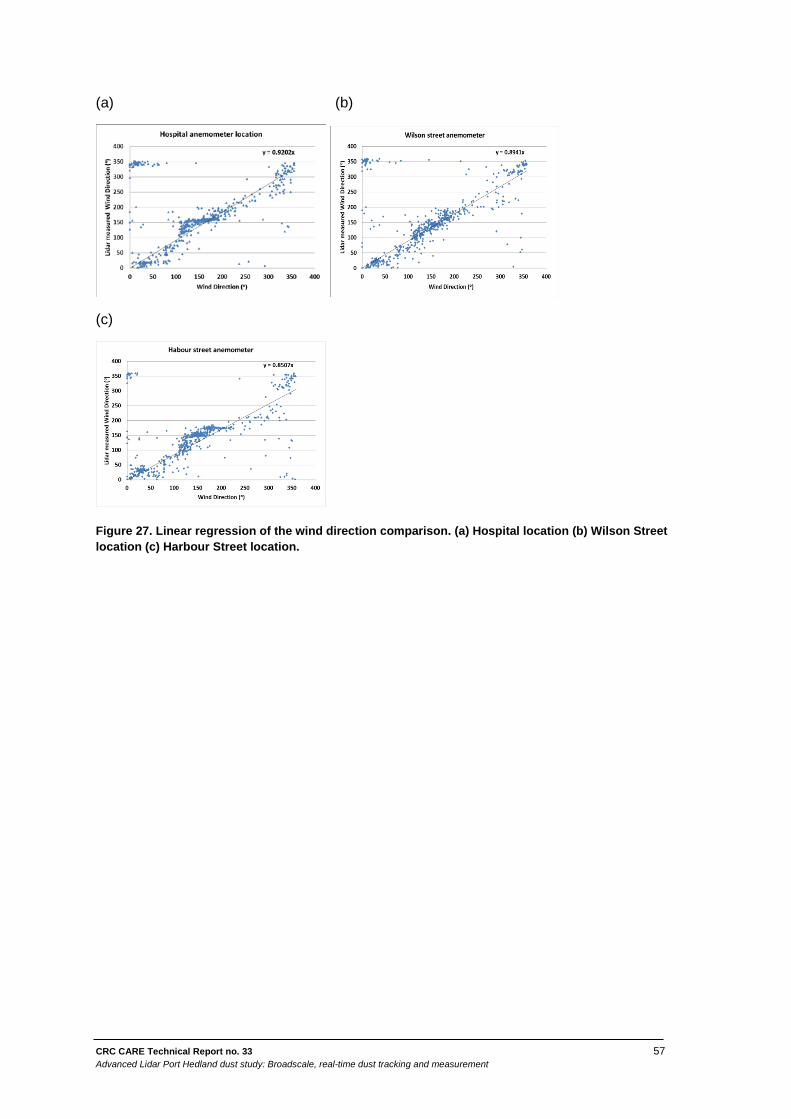
CRC CARE Technical Report no. 33 57 Advanced Lidar Port Hedland dust study: Broadscale, real-time dust tracking and measurement
(a) (b)
(c)
Figure 27. Linear regression of the wind direction comparison. (a) Hospital location (b) Wilson Street location (c) Harbour Street location.
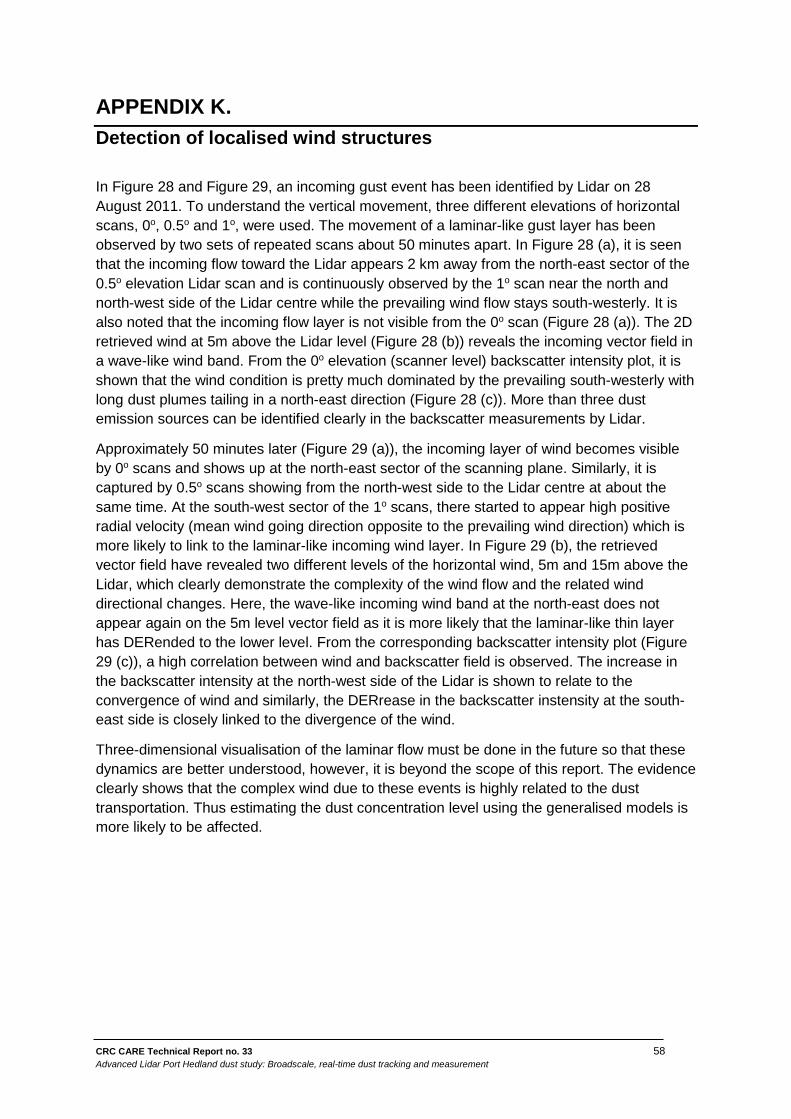
CRC CARE Technical Report no. 33 58 Advanced Lidar Port Hedland dust study: Broadscale, real-time dust tracking and measurement
APPENDIX K. Detection of localised wind structures
In Figure 28 and Figure 29, an incoming gust event has been identified by Lidar on 28 August 2011. To understand the vertical movement, three different elevations of horizontal scans, 0o, 0.5o and 1o, were used. The movement of a laminar-like gust layer has been observed by two sets of repeated scans about 50 minutes apart. In Figure 28 (a), it is seen that the incoming flow toward the Lidar appears 2 km away from the north-east sector of the 0.5o elevation Lidar scan and is continuously observed by the 1o scan near the north and north-west side of the Lidar centre while the prevailing wind flow stays south-westerly. It is also noted that the incoming flow layer is not visible from the 0o scan (Figure 28 (a)). The 2D retrieved wind at 5m above the Lidar level (Figure 28 (b)) reveals the incoming vector field in a wave-like wind band. From the 0o elevation (scanner level) backscatter intensity plot, it is shown that the wind condition is pretty much dominated by the prevailing south-westerly with long dust plumes tailing in a north-east direction (Figure 28 (c)). More than three dust emission sources can be identified clearly in the backscatter measurements by Lidar.
Approximately 50 minutes later (Figure 29 (a)), the incoming layer of wind becomes visible by 0o scans and shows up at the north-east sector of the scanning plane. Similarly, it is captured by 0.5o scans showing from the north-west side to the Lidar centre at about the same time. At the south-west sector of the 1o scans, there started to appear high positive radial velocity (mean wind going direction opposite to the prevailing wind direction) which is more likely to link to the laminar-like incoming wind layer. In Figure 29 (b), the retrieved vector field have revealed two different levels of the horizontal wind, 5m and 15m above the Lidar, which clearly demonstrate the complexity of the wind flow and the related wind directional changes. Here, the wave-like incoming wind band at the north-east does not appear again on the 5m level vector field as it is more likely that the laminar-like thin layer has DERended to the lower level. From the corresponding backscatter intensity plot (Figure 29 (c)), a high correlation between wind and backscatter field is observed. The increase in the backscatter intensity at the north-west side of the Lidar is shown to relate to the convergence of wind and similarly, the DERrease in the backscatter instensity at the south-east side is closely linked to the divergence of the wind.
Three-dimensional visualisation of the laminar flow must be done in the future so that these dynamics are better understood, however, it is beyond the scope of this report. The evidence clearly shows that the complex wind due to these events is highly related to the dust transportation. Thus estimating the dust concentration level using the generalised models is more likely to be affected.
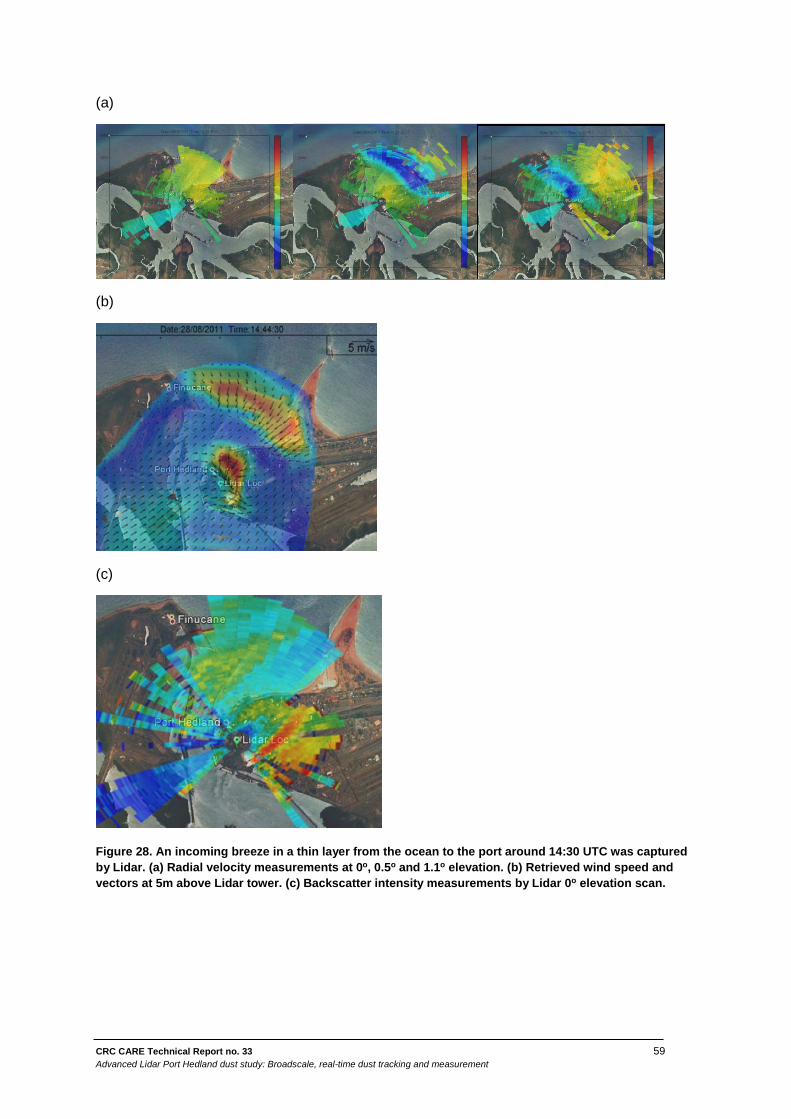
CRC CARE Technical Report no. 33 59 Advanced Lidar Port Hedland dust study: Broadscale, real-time dust tracking and measurement
(a)
(b)
(c)
Figure 28. An incoming breeze in a thin layer from the ocean to the port around 14:30 UTC was captured by Lidar. (a) Radial velocity measurements at 0o, 0.5o and 1.1o elevation. (b) Retrieved wind speed and vectors at 5m above Lidar tower. (c) Backscatter intensity measurements by Lidar 0o elevation scan.
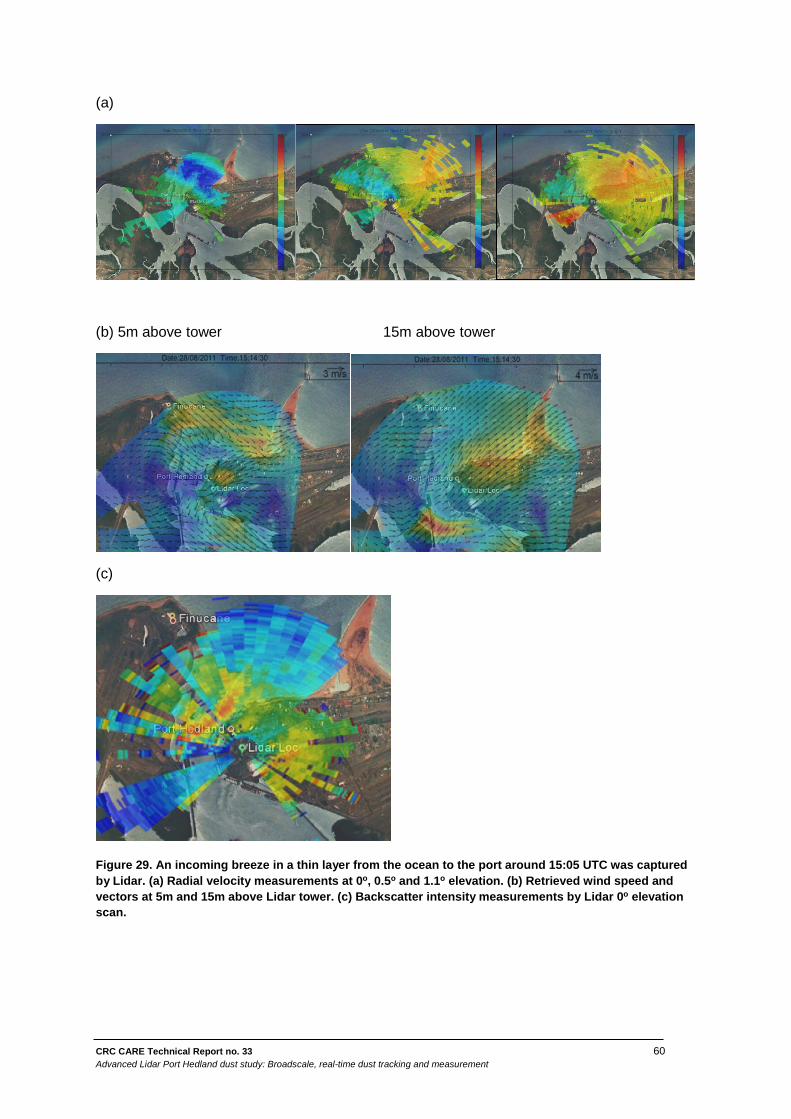
CRC CARE Technical Report no. 33 60 Advanced Lidar Port Hedland dust study: Broadscale, real-time dust tracking and measurement
(a)
(b) 5m above tower 15m above tower
(c)
Figure 29. An incoming breeze in a thin layer from the ocean to the port around 15:05 UTC was captured by Lidar. (a) Radial velocity measurements at 0o, 0.5o and 1.1o elevation. (b) Retrieved wind speed and vectors at 5m and 15m above Lidar tower. (c) Backscatter intensity measurements by Lidar 0o elevation scan.
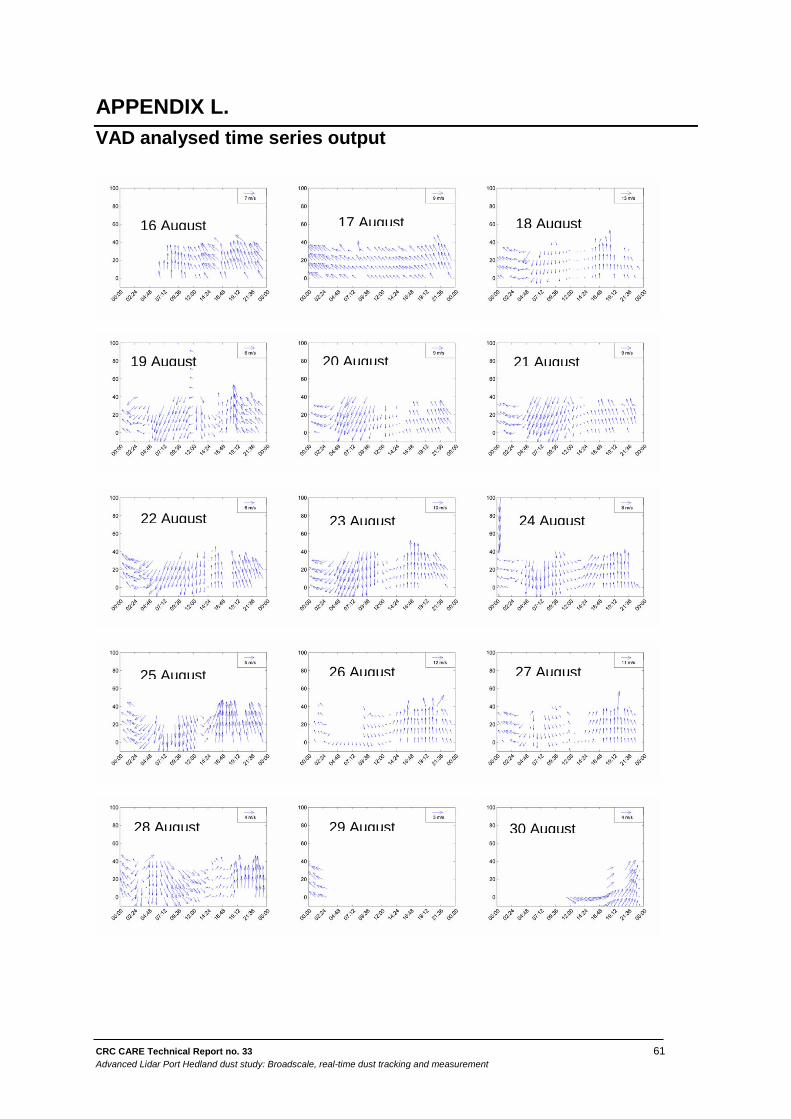
CRC CARE Technical Report no. 33 61 Advanced Lidar Port Hedland dust study: Broadscale, real-time dust tracking and measurement
APPENDIX L. VAD analysed time series output
16 August
17 August
18 August
19 August
20 August
21 August
22 August
23 August
24 August
25 August
26 August
27 August
28 August
29 August
30 August
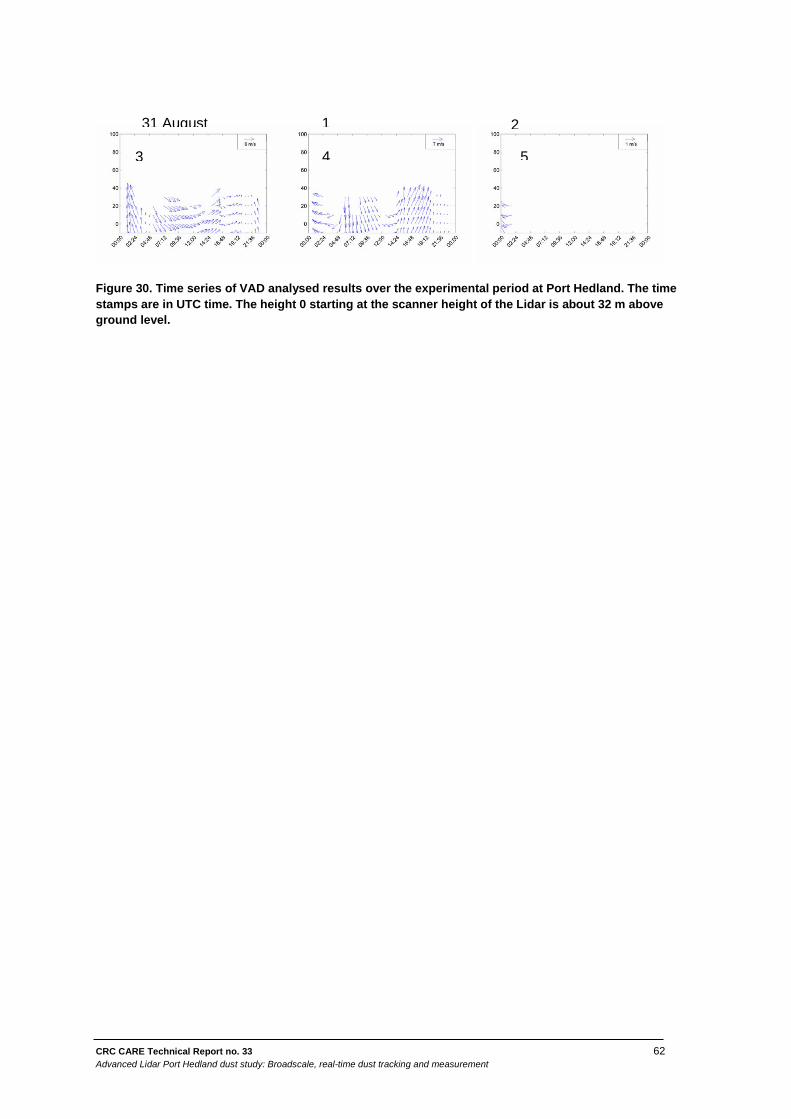
CRC CARE Technical Report no. 33 62 Advanced Lidar Port Hedland dust study: Broadscale, real-time dust tracking and measurement
Figure 30. Time series of VAD analysed results over the experimental period at Port Hedland. The time stamps are in UTC time. The height 0 starting at the scanner height of the Lidar is about 32 m above ground level.
31 August
1
2
3
4
5

CRC CARE ATC Building University of Newcastle Callaghan NSW 2308 Australia
Postal C/- Newcastle University LPO PO Box 18 Callaghan NSW 2308 Australia
Contact usP: +61 2 4985 4941 E: [email protected]
www.crccare.com