contaminated land management guidelines no. 5
TRANSCRIPT
Contaminated Land Management Guidelines No. 5
Site Investigation and Analysis of Soils (Revised 2011)
While every effort has been made to ensure that this guideline is as clear and accurate as possible, the Ministry for the Environment will not be held responsible for any action arising out of its use. This guideline should not be taken as providing a definitive statement for any particular user’s circumstances. All users of these guidelines should satisfy themselves, and their client(s) concerning the application of these guidelines to their situation and in cases where there is uncertainty seek expert advice.
Published in February 2004 by the Ministry for the Environment
PO Box 10-362, Wellington, New Zealand
Revised October 2011
ISBN: 978-0-478-37260-1
ME number: 1073
This document is available on the Ministry for the Environment’s website: www.mfe.govt.nz
Contaminated Land Management Guidelines No. 5 iii
Acknowledgements We would like to thank URS (New Zealand) Ltd and RJ Hill Laboratories Ltd for preparing the original document, particularly Anna MacKenzie and Kevin Tearney (URS), and Dr Peter Robinson (RJ Hill Laboratories). Thanks to the project steering group, who oversaw the development of this document: Dr Simon Buckland (formerly Ministry for the Environment), Helen Davies (Environment Canterbury), Simon Hunt (Caltex New Zealand Ltd), Dr Nick Kim (Environment Waikato) and Sharon Vujnovich (Auckland Regional Council). Thanks also to the environmental consultants, local authority staff and industry representatives who provided comments during the consultation period.

Contaminated Land Management Guidelines No. 5 v
Contents
Acknowledgements iii
Executive Summary ix
1 Introduction 1 1.1 Purpose 1 1.2 Target audience 1 1.3 Scope 2 1.4 Minimum standards 2 1.5 Changes from the 2004 version 3
2 Principles of Site Investigation 4 2.1 Data quality objectives 4
2.1.1 The data quality objective process 4 2.1.2 Applying DQOs to the investigation of a site for hazardous substances 4
2.2 Conceptual site model 6 2.2.1 Contaminant distribution 6 2.2.2 Soil heterogeneity 7 2.2.3 Uncertainty in sampling 7
2.3 Investigation phases 7 2.3.1 Preliminary site investigation (study) 8 2.3.2 Preliminary site inspection 10 2.3.3 Detailed site investigation 11 2.3.4 Supplementary site investigations 11 2.3.5 Site validation investigation 12
3 Preparing for Fieldwork and Soil Sampling 13 3.1 Sampling objectives 13 3.2 Preparing for fieldwork 13 3.3 Sampling and analysis plans 14 3.4 Sample pattern selection 15
3.4.1 Judgemental sampling 16 3.4.2 Systematic sampling 17 3.4.3 Stratified sampling 17
3.5 Field-screening techniques 18 3.5.1 Non-intrusive techniques 18 3.5.2 Soil-screening techniques 19
3.6 Collecting a representative soil sample 19 3.6.1 Number of samples 20 3.6.2 Sampling depth 21 3.6.3 Soil-sampling techniques 21 3.6.4 Composite sampling 24 3.6.5 Background samples 25
3.7 Sample handling and transport 26 3.7.1 Sample logging 26 3.7.2 Sample locations and labels 26
vi Contaminated Land Management Guidelines No. 5
3.7.3 Sample handling 26 3.7.4 Sampling for volatiles 27 3.7.5 Chain of custody procedures 27
3.8 Decontamination 28 3.9 Field quality assurance (QA) / quality control (QC) 28
3.9.1 Field QC 29 3.10 Choice of analytes 31 3.11 Health, safety and environmental considerations 32
3.11.1 Chemical, biological and radiological hazards 33 3.11.2 Physical hazards 34 3.11.3 Environmental hazards 35 3.11.4 Waste handling 35
4 Laboratory Analysis 37 4.1 Selecting a laboratory 37 4.2 Sample handling 37
4.2.1 Planning 37 4.2.2 Documentation 38 4.2.3 Receipt at the laboratory 39 4.2.4 Sample holding times 39 4.2.5 Sample retention after analysis 40
4.3 Hazardous samples 40 4.4 Sample preparation methods 40
4.4.1 Non-homogeneous samples 40 4.4.2 Sub-sampling in the laboratory 41 4.4.3 Compositing 42
4.5 Analytical methods 42 4.5.1 Selecting an analytical method 42 4.5.2 Validating analytical methods 43 4.5.3 Inter-laboratory comparison programmes and certified reference
materials 44 4.5.4 Metals and metalloids 44 4.5.5 Semi-volatile organic compounds (SVOCs) 45 4.5.6 Total petroleum hydrocarbons (TPHs) 45 4.5.7 Volatile organic compounds (VOCs) 46 4.5.8 Soil leaching procedure 47 4.5.9 Other tests not specifically covered 48
4.6 Laboratory QA/QC 48 4.7 Data reporting 49 4.8 Uncertainty of measurement 50
5 Basics of Data Interpretation 51 5.1 Data reporting 51 5.2 The conceptual site model 51
5.2.1 Data assessment 51 5.2.2 Uncertainty in data assessment 52
5.3 Use of soil contaminant standards and guideline values 52 5.4 Using statistical methods for data assessment 53
5.4.1 Statistical summaries 53 5.4.2 Checking for normal distribution 54 5.4.3 Accuracy and precision 56 5.4.4 Outliers 56
Contaminated Land Management Guidelines No. 5 vii
5.5 Reality checks 57 5.6 Common mistakes made in data interpretation 58 5.7 Interpreting numbers close to or below detection limits 58
5.7.1 Numbers close to detection limits 58 5.7.2 Numbers below detection limits 58
5.8 Numbers close to guideline values 59 5.8.1 Nature of the guideline in the site context 60 5.8.2 Variability in the data 60
Appendix A: Example of a Job Safety Analysis Form and an Example Table of Contents for an HSEP 61
Appendix B: Guidance on Sample Numbers 62 Number of sampling points for hot spot detection 62 Number of sampling points needed for determining the average
concentration of an analyte 63 Number of sampling points needed for determining the degree of
contamination 64 Appendix C: New Zealand Geomechanics Society Terminology for Description of
Soils 66 Soil name 66 Strength 67 Moisture condition 67 Plasticity 67 Grading qualifications 68 Weathering 68 Bedding 68 Particle shape 68
Appendix D: Sample Containers and Holding Times 69 Sample containers 69 Holding times 69
Appendix E: Chain of Custody 70 Appendix F: Determination of Method Detection Limits 71
Calculation of method detection limit (MDL) 71 Comparing data from different laboratories 71
Appendix G: Possible Analytical Methods 72 Appendix H: An Example of In-house QC from a New Zealand Laboratory 73
Metals 73 Volatile (VOC) and semi-volatile organic compound (SVOC) analysis 73 Total petroleum hydrocarbons (TPH) 74
Appendix I: Notes on the Upper Confidence Limit 75 Appendix J: Example of Determining Uncertainty Using Replicates 76
Glossary 77
References 82
Additional Information 83
viii Contaminated Land Management Guidelines No. 5
Tables Table 1: The five main investigation phases, and common alternative descriptors 8 Table 2: Soil-sampling techniques 22 Table 3: Sampling methods for volatiles 27 Table 4: Field QC samples 30 Table 5: Hazard identification checklist 33 Table A1: Minimum sampling points required for detection of circular hot spots using a
systematic sampling pattern at 95% confidence level 63 Table A2: Names for different particle sizes 66 Table A3: Proportions 66 Table A4: Fine-grained soils (cohesive) 67 Table A5: Moisture condition 67 Table A6: Bedding characteristics 68 Table A7: Guideline sample holding times for soils 69 Table A8: Analytical methods, and their advantages and disadvantages 72 Table A9: Typical QC used with each batch of analytical soil samples for inductively
coupled plasma − mass spectrometry analysis 73 Table A10: Typical QC used for VOC and SVOC analysis on soils 73 Table A11: Typical QC used for TPH analysis on soils 74 Table A12: Summary of duplicated samples 76 Table A13: Extracted precision data 76
Figures Figure 1: Recommended approach to site investigation 2 Figure 2: The DQO process 4 Figure 3: The DQO process for a site investigation 5 Figure 4: The three sampling patterns 15 Figure 5: Carbon chain length for typical hydrocarbons 46 Figure 6: Illustration of normal distribution and 95% upper confidence limit 54 Figure 7: Lognormal and normal distributions 55
Contaminated Land Management Guidelines No. 5 ix
Executive Summary This guideline on Site Investigation and Analysis of Soils is the fifth document in the Contaminated Land Management Guidelines series produced by the Ministry for the Environment. It is aimed at contaminated land practitioners and regulatory authorities, but may also be of use to owners, potential owners or occupiers of sites where hazardous substances are present or suspected in the soil. The purpose of the document is to promote a nationally consistent approach to the investigation and assessment of contaminated land. We cover the principles of how to plan and conduct investigations, and set out best practice that should be followed for sampling and analysing soils on sites where hazardous substances are present or suspected. We do not cover the collection of other media for site investigations, such as soil gas, groundwater, sediments or surface waters. The guideline highlights four areas of an investigation: • the principles of site investigation • soil sampling • laboratory analysis • the basics of data interpretation. Each of these areas has its own section, following the Introduction. We also set out recommendations for:
• the approach to site investigations
• setting the objectives for the investigation
• undertaking the preliminary site study and inspection
• planning a detailed site investigation
• practical issues to be considered before undertaking fieldwork
• how to conduct an investigation − including the process of planning the soil-sampling strategy, sample collection and handling, and quality assurance requirements
• the minimum number of samples to collect
• selecting a laboratory
• analytical methods to use
• ways of ensuring the data produced are reliable
• applying common statistical methods for data analysis
• assessing the significance of results that are close to guideline values, dealing with outliers and data review steps.

Contaminated Land Management Guidelines No. 5 1
1 Introduction
1.1 Purpose This guideline on Site Investigation and Analysis of Soils is the fifth document in the Contaminated Land Management Guidelines (CLMG) series produced by the Ministry for the Environment. It is designed to be used in conjunction with other documents in the series and other Ministry contaminated land publications. The purpose of the guideline is to promote a nationally consistent approach to the investigation and assessment of contaminated land. Specifically, the guideline provides:
• best practice that should be followed for the sampling and analysis of soils on sites where hazardous substances are present or suspected in soils in New Zealand
• guidance on the principles governing the interpretation of the data obtained. New Zealand guidance documents that address aspects of the overall objective of this guideline are available, including guidelines on the investigation, assessment and monitoring of land potentially contaminated by gasworks residues, petroleum hydrocarbons, timber treatment chemicals and sheep dips. These documents are available from the Ministry for the Environment website (www.mfe.govt.nz). Many of the New Zealand and overseas documents used in the preparation of this guideline are listed in the References and Additional Information sections.
1.2 Target audience This guideline is aimed primarily at contaminated land practitioners and regulatory authorities − in other words, those undertaking and auditing contaminated site investigations. Owners, potential owners or occupiers of sites where hazardous substances are present or suspected may also find this guideline useful for reviewing the work undertaken, or assessing tenders or proposals for work. The guideline could also be helpful to other stakeholders, such as the owners or occupiers of land adjacent to a site where hazardous substances are present.1
The guideline does not set out to provide definitive information required by every stakeholder, but we do provide references to other publications for more specific information not presented here. The appendices also contain supplementary technical information. The overall content of the guideline should assist regulatory authorities and other stakeholders using or assessing contaminated land reports to:
• understand the stated outcomes of the reports in the context of the site investigation objectives
• understand the uncertainties associated with the collection and analysis of soil samples and the interpretation of the ensuing data
1 In line with other guidance in the CLMG series, in this document ‘site’ means an area of land, as defined by
a legal description or part of a legal description, which is under investigation.
2 Contaminated Land Management Guidelines No. 5
• assess whether best practice and/or minimum requirements have been met and work has been undertaken with competency.
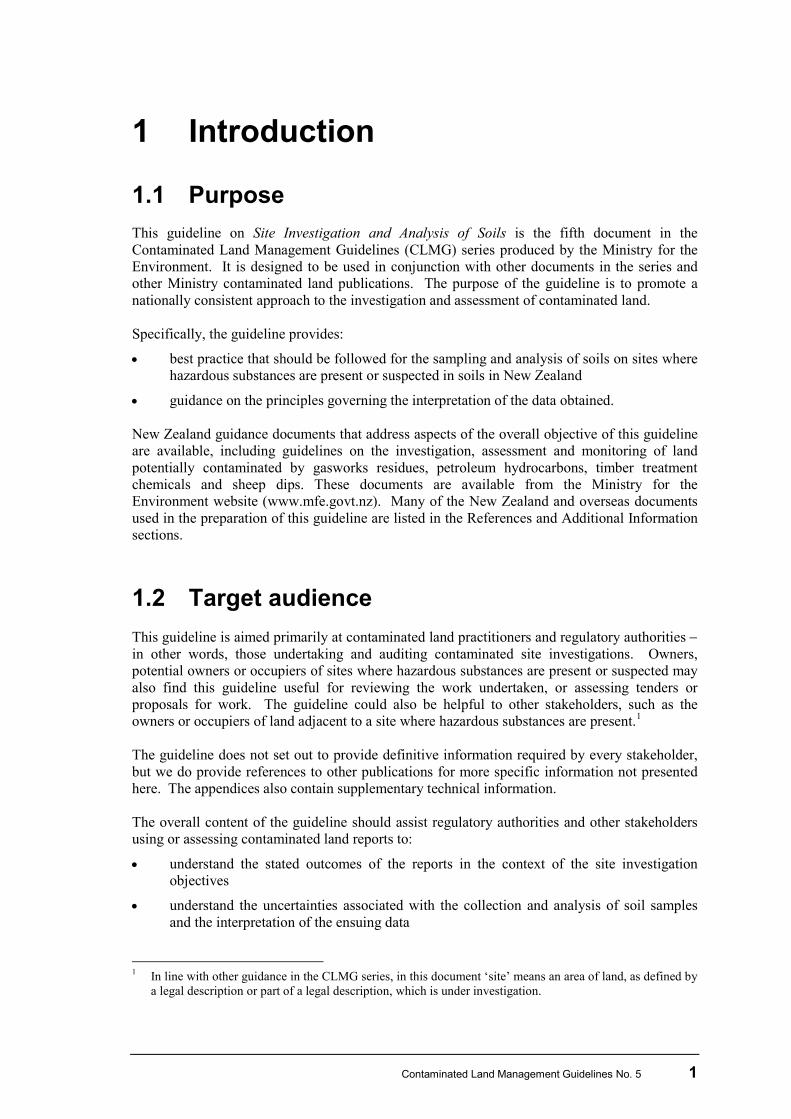
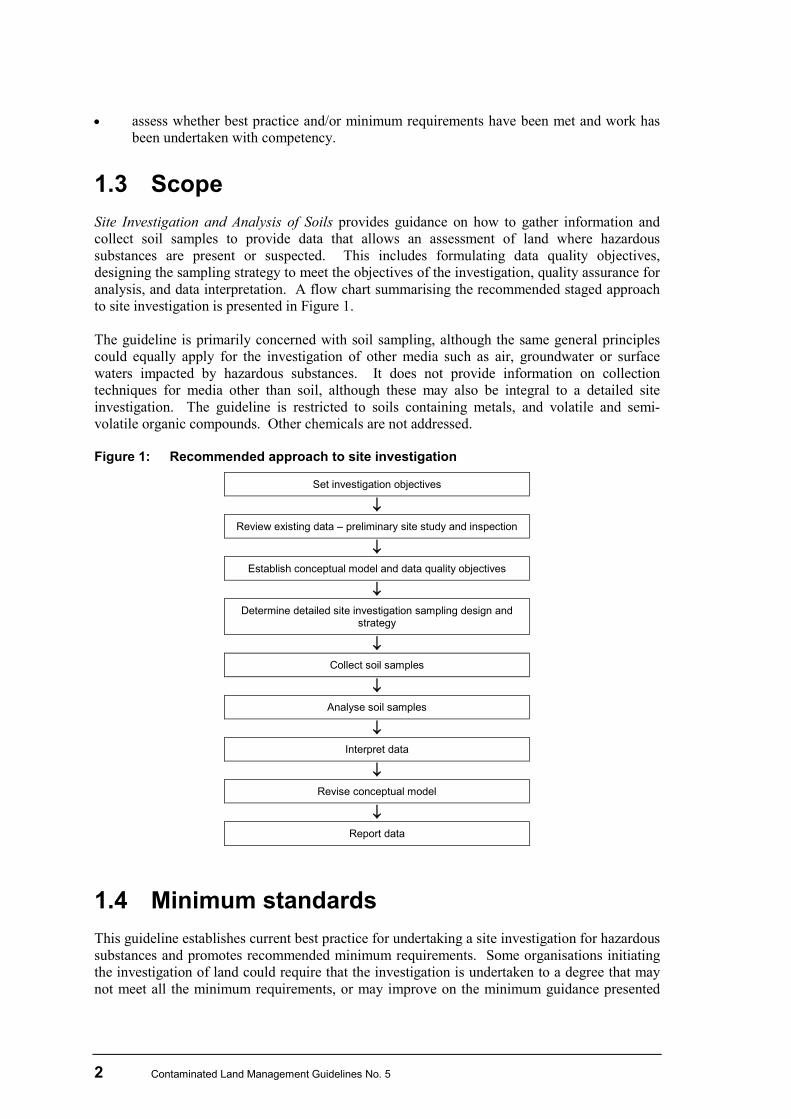
1.3 Scope Site Investigation and Analysis of Soils provides guidance on how to gather information and collect soil samples to provide data that allows an assessment of land where hazardous substances are present or suspected. This includes formulating data quality objectives, designing the sampling strategy to meet the objectives of the investigation, quality assurance for analysis, and data interpretation. A flow chart summarising the recommended staged approach to site investigation is presented in Figure 1. The guideline is primarily concerned with soil sampling, although the same general principles could equally apply for the investigation of other media such as air, groundwater or surface waters impacted by hazardous substances. It does not provide information on collection techniques for media other than soil, although these may also be integral to a detailed site investigation. The guideline is restricted to soils containing metals, and volatile and semi-volatile organic compounds. Other chemicals are not addressed. Figure 1: Recommended approach to site investigation
Set investigation objectives
↓ Review existing data – preliminary site study and inspection
↓ Establish conceptual model and data quality objectives
↓ Determine detailed site investigation sampling design and
strategy
↓ Collect soil samples
↓ Analyse soil samples
↓ Interpret data
↓ Revise conceptual model
↓ Report data
1.4 Minimum standards This guideline establishes current best practice for undertaking a site investigation for hazardous substances and promotes recommended minimum requirements. Some organisations initiating the investigation of land could require that the investigation is undertaken to a degree that may not meet all the minimum requirements, or may improve on the minimum guidance presented
Contaminated Land Management Guidelines No. 5 3
here. It is also possible that the best practice/minimum requirements set out in the guideline are not met. In such cases, the circumstances should be documented in the site investigation report and the implications for the investigation objectives clearly stated.
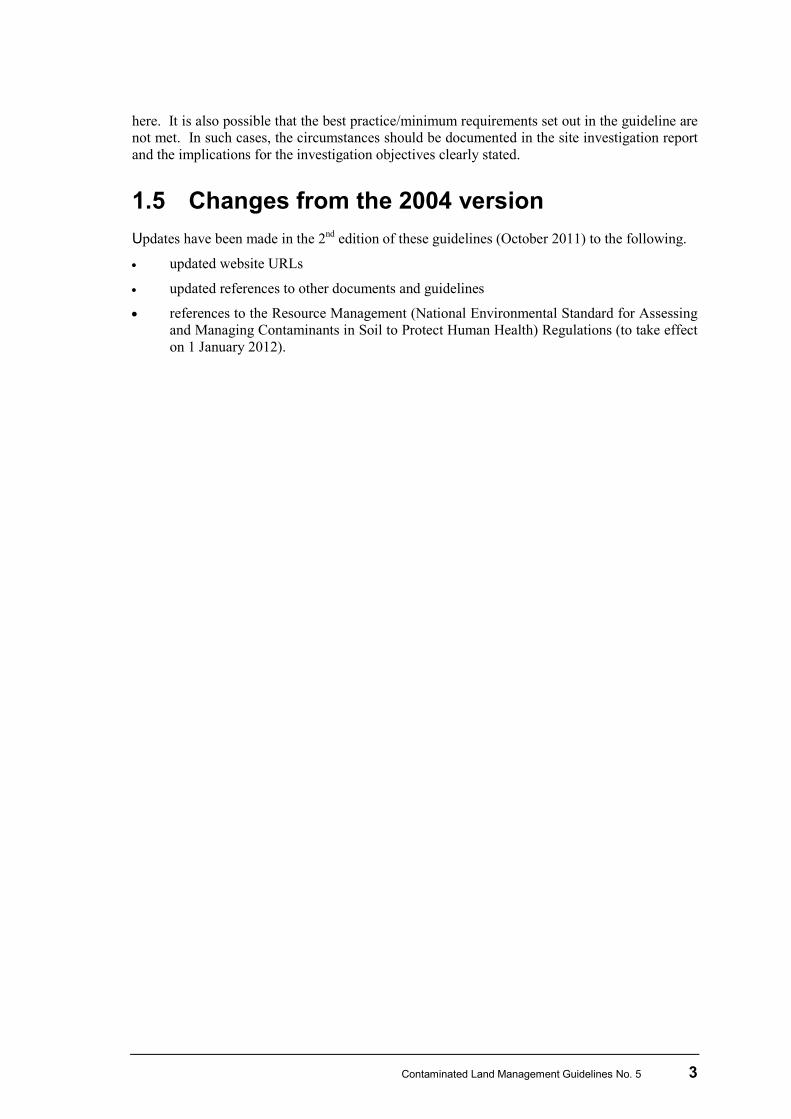
1.5 Changes from the 2004 version Updates have been made in the 2nd edition of these guidelines (October 2011) to the following.
• updated website URLs
• updated references to other documents and guidelines
• references to the Resource Management (National Environmental Standard for Assessing and Managing Contaminants in Soil to Protect Human Health) Regulations (to take effect on 1 January 2012).
4 Contaminated Land Management Guidelines No. 5
2 Principles of Site Investigation
2.1 Data quality objectives
2.1.1 The data quality objective process
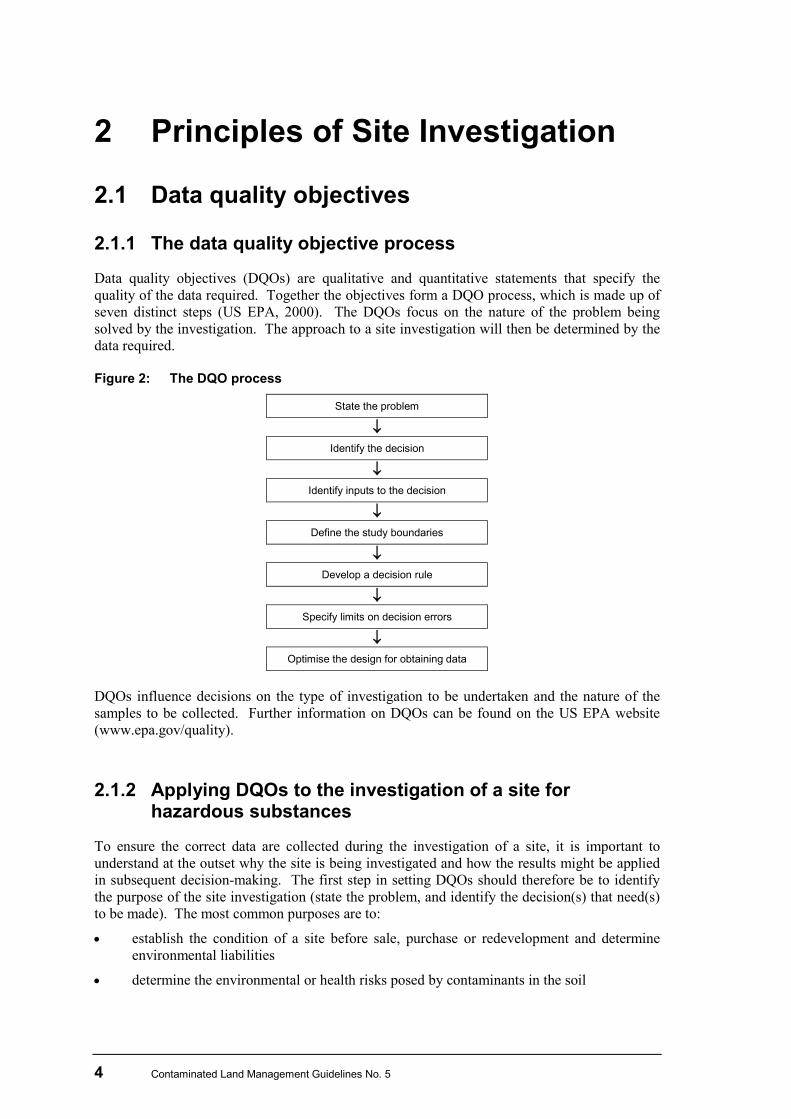
Data quality objectives (DQOs) are qualitative and quantitative statements that specify the quality of the data required. Together the objectives form a DQO process, which is made up of seven distinct steps (US EPA, 2000). The DQOs focus on the nature of the problem being solved by the investigation. The approach to a site investigation will then be determined by the data required. Figure 2: The DQO process
State the problem
↓ Identify the decision
↓ Identify inputs to the decision
↓ Define the study boundaries
↓ Develop a decision rule
↓ Specify limits on decision errors
↓ Optimise the design for obtaining data
DQOs influence decisions on the type of investigation to be undertaken and the nature of the samples to be collected. Further information on DQOs can be found on the US EPA website (www.epa.gov/quality).
2.1.2 Applying DQOs to the investigation of a site for hazardous substances
To ensure the correct data are collected during the investigation of a site, it is important to understand at the outset why the site is being investigated and how the results might be applied in subsequent decision-making. The first step in setting DQOs should therefore be to identify the purpose of the site investigation (state the problem, and identify the decision(s) that need(s) to be made). The most common purposes are to:
• establish the condition of a site before sale, purchase or redevelopment and determine environmental liabilities
• determine the environmental or health risks posed by contaminants in the soil
Contaminated Land Management Guidelines No. 5 5
• determine if hazardous substances in the soil pose a hazard to an ecosystem
• assess the applicability of a particular remediation option
• benchmark the contamination status of a site following clean-up
• establish compliance with the Resource Management Act 1991, regional or district plan, or resource consent.
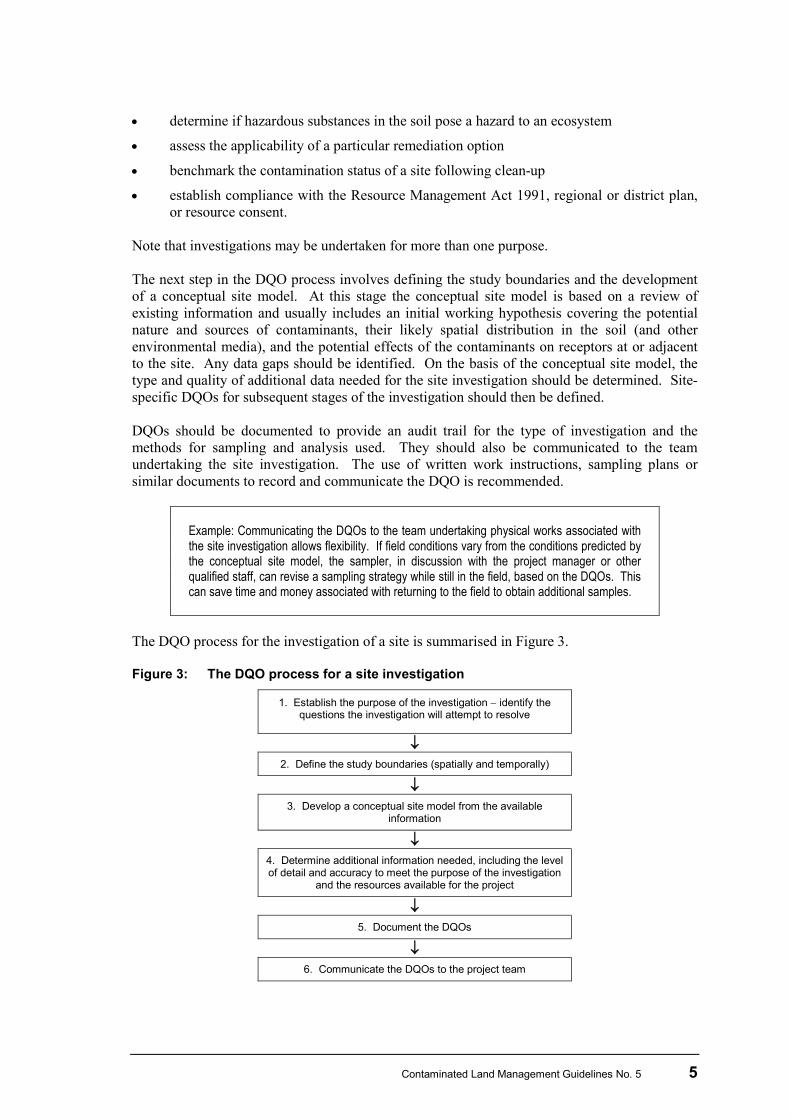
Note that investigations may be undertaken for more than one purpose. The next step in the DQO process involves defining the study boundaries and the development of a conceptual site model. At this stage the conceptual site model is based on a review of existing information and usually includes an initial working hypothesis covering the potential nature and sources of contaminants, their likely spatial distribution in the soil (and other environmental media), and the potential effects of the contaminants on receptors at or adjacent to the site. Any data gaps should be identified. On the basis of the conceptual site model, the type and quality of additional data needed for the site investigation should be determined. Site-specific DQOs for subsequent stages of the investigation should then be defined. DQOs should be documented to provide an audit trail for the type of investigation and the methods for sampling and analysis used. They should also be communicated to the team undertaking the site investigation. The use of written work instructions, sampling plans or similar documents to record and communicate the DQO is recommended.
Example: Communicating the DQOs to the team undertaking physical works associated with the site investigation allows flexibility. If field conditions vary from the conditions predicted by the conceptual site model, the sampler, in discussion with the project manager or other qualified staff, can revise a sampling strategy while still in the field, based on the DQOs. This can save time and money associated with returning to the field to obtain additional samples.
The DQO process for the investigation of a site is summarised in Figure 3. Figure 3: The DQO process for a site investigation
1. Establish the purpose of the investigation − identify the questions the investigation will attempt to resolve
↓ 2. Define the study boundaries (spatially and temporally)
↓ 3. Develop a conceptual site model from the available
information
↓ 4. Determine additional information needed, including the level of detail and accuracy to meet the purpose of the investigation
and the resources available for the project
↓ 5. Document the DQOs
↓ 6. Communicate the DQOs to the project team
6 Contaminated Land Management Guidelines No. 5
The purpose of an investigation can alter as the investigation progresses. Therefore: • the conceptual site model should be updated as more information is obtained • the DQOs should be reviewed as the project proceeds, and revised as necessary.
2.2 Conceptual site model A conceptual site model is a system diagram identifying contaminant sources, routes of exposure (pathways), and what receptors are affected by contaminants moving along those pathways. The conceptual site model, which should be developed before undertaking a detailed site investigation, identifies the zones of the site with different contamination characteristics (eg, whether contaminants in the soil are likely to be on the surface or at depth, distributed over an entire area or in localised ‘hot spots’). Exposure pathways and receptors should be identified for both current and future uses of the site (where appropriate). The model will be based on a review of all available data gathered during the various investigation phases, and should be used to design the detailed site investigation.
2.2.1 Contaminant distribution
When determining the approach for the investigation, the contaminant distribution must be included as part of the soil-sampling strategy, as this will affect the sample locations and the number of samples collected. The contaminant distribution at a site can be affected by a number of factors, including: • the nature of the contaminant source and contaminant type • pathways for migration and dispersion • the type and physical nature of the soils/geology • any physical disturbance of the contaminants. Both lateral and vertical contaminant distribution must be considered. Contaminant distribution within soil and fill materials is usually highly variable and depends on the make-up of the soil and fill. The type and physical properties of natural soils and the depth to groundwater may also vary within a site. These factors can contribute to the variable distribution of contaminants with depth in the soil profile. Vertical and lateral contaminant distributions are also affected by the physical characteristics of the contaminant source and release mode.
Example: A loss from an above-ground tank could cause contamination of the soil profile from the ground surface down to the water table. A loss from the base of an underground storage tank could cause soil contamination below the base of the tank pit only, with little or no impact on nearby surface soils.
Contaminated Land Management Guidelines No. 5 7
2.2.2 Soil heterogeneity
The soil profile within a site where hazardous substances are present or suspected can be variable, comprising a mix of natural soils (‘natural ground’) and fill materials (‘made ground’). Fill often comprises a complex mix of materials, including plant remains, scrap wood, scrap metal, soil and ash. Fill materials can have a marked effect on the migration of contaminants through the soil, and can also be a source of contaminants (eg, heavy metals present in ash fill). It is also sometimes difficult in the field to distinguish certain types of fill from the natural soils. Soil samples are often sorted in the field to remove rocks and coarse fractions such as boulders and cobbles, because it is often not feasible to collect these size fractions due to the container size. Such field screening can bias the sample, however. The proportion by weight or volume of any fraction removed must be estimated, and any data interpretation should take account of the influence of strata that were not sampled within the site investigation. The laboratory can also bias the sample by sieving (see section 4.4.1), and clear instructions should be provided to the laboratory on how samples are to be handled.
2.2.3 Uncertainty in sampling
To establish the contaminant distribution at a site, small quantities of soil are collected and submitted for analysis. There is always some uncertainty about the representativeness of the samples to actual site conditions due to a number of factors, including:
• cross-contamination
• variations in local conditions, which can affect the vertical and lateral distribution of contaminants
• the selective nature of the sampling process. To minimise the uncertainty, the soil sampling must take these variables into consideration and incorporate a thorough understanding of the site conditions and history. A quality assurance programme must be considered as part of any soil-sampling investigation (see section 3.9).
2.3 Investigation phases The investigation of a site where hazardous substances are present or suspected should be undertaken in phases. The five main investigation phases identified in this guideline and common alternative terms used to describe each phase are presented in Table 1.2
2 The nomenclature describing these main investigation phases is not fully consistent within the industry,
although general correlation of different but similar terms for the various investigation phases is possible.
8 Contaminated Land Management Guidelines No. 5
Table 1: The five main investigation phases, and common alternative descriptors
Main investigation phases
This guideline Common alternative descriptor
Preliminary site investigation (study) Preliminary site study, stage 1; Phase 1 desk top study; Phase 1 background information study; Phase 1 contaminated site audit; Phase 1 environmental site assessment (ESA)
Preliminary site inspection Site walkover survey; Phase 1 site inspection
Detailed site investigation Stage 2; Phase 2 field investigation; Phase 2 ESA; environmental benchmarking
Supplementary site investigation Additional phase 2 ESA; Phase 3 ESA
Site validation investigation Remediation validation investigation; soil benchmarking
The phased approach enables information on the conceptual site model to be collected. Information from each phase should be assessed to build up an overall picture of the site. The phases required for an investigation and the scope of each phase should be determined by the DQOs. Not all phases will be required at every site, and the scope within each phase should be tailored to meet the specific DQOs.
2.3.1 Preliminary site investigation (study)
The main objective of the preliminary site investigation (study) is to provide background information relevant to the DQOs. For a full site investigation, information on the present and past uses of the site should be included in order to identify the nature of potential contaminants, their likely location and significance, and potential pathways for migration within the site or off-site. The preliminary site investigation involves gathering and compiling information about the site to form the initial conceptual site model. It is often combined with a preliminary site inspection. Information gathered in the preliminary site investigation and preliminary site inspection should be documented in a preliminary site investigation report (see Contaminated Land Management Guideline No. 1: Reporting on Contaminated Sites in New Zealand (Revised 2011) Ministry for the Environment, 2001), and where possible supporting information should be appended to the report. The preliminary site investigation should identify the sources of contamination, pathways for release and environmental receptors. The scope of the preliminary site investigation should include the following.
Site identification
The site must be identified, including the site name, address, legal description, site boundaries, a map reference and geographic co-ordinates. Information on site identification can be obtained from the site owners/occupiers, maps, rates demands and from current certificates of title. The land area where contaminants may be present, or suspected, may not correspond with legal boundaries, and site identification should establish the boundaries of the study.
Site history
A chronological history of the site and previous site uses should be traced from the present day back to the initial use (if possible). The previous activities and processes on the site, and the chemicals and products used, stored or disposed of at the site, should be identified. Any
Contaminated Land Management Guidelines No. 5 9
previous investigation and remediation work should be reviewed and gaps in the information recorded. The sources of information for the site history may include:
• interviews with site personnel and neighbours (usually undertaken during the preliminary site inspection), covering questions relating to site history, any known incidents, management practices, waste disposal, and any chemical storage areas
• a review of discharge permits, consents or licences (eg, land-use consents; consents to discharge to air, water or ground; trade waste consents; and dangerous goods [hazardous substances] licences)
• a review of available environmental reports, environmental incident investigation reports, tank removal records, process descriptions, waste disposal and chemical inventories, material safety data sheets and newspaper articles
• local authority record reviews, including land information memoranda (LIM) and regional council databases
• certificates of title
• a review of historical society records, and any relevant literature relating to the site
• the layout of current and historical facilities, and site drainage plans
• photographic records, including aerial photos. A New Zealand list of activities and industries that are considered to have a higher potential for land contamination, referred to as the Hazardous Activities and Industries List (HAIL) (Ministry for the Environment, 2011b), is published separately. This list should be used to assist in identifying current or historical activities or industries where hazardous substances are used that could cause land contamination.
Topography and hydrology
The site hydrology assessment should include information on the nearest surface watercourses to the site, the location of surface water drains and stormwater drainage channels, the direction of surface water flow, and information on surface water discharges and abstractions and flooding (if relevant). Typical information sources include topographical maps and regional council records, as well as observations made during site inspections.
Geology and hydrogeology
The site geology assessment should include a description of the types of strata and soil types and information on fill material (if present). Information sources include published geological survey maps and memoirs, New Zealand soil classification publications, and information from previous environmental or geotechnical investigations. The site hydrogeology assessment should include information on: • the extent and use of groundwater aquifers in the area • local and regional direction of groundwater flow • anticipated depth to groundwater • seasonal or tidal influences
10 Contaminated Land Management Guidelines No. 5
• springs • local groundwater abstraction and use • local groundwater and/or surface water monitoring information • preferential pathways to groundwater (soak holes, etc.). Information sources include regional council records on groundwater, and previous site investigation records.
2.3.2 Preliminary site inspection
The preliminary site inspection is undertaken as part of, or following, the preliminary site study. The objective in this phase is to augment or confirm the findings of the preliminary site study and identify any information that may assist with the design of the detailed site investigation. Before undertaking a site visit, the potential hazards that may be encountered during the visit should be assessed and appropriate health and safety precautions taken (see sections 3.2 and 3.11). Information gathered during a preliminary site inspection typically includes:
• general site condition, current use, local topography and surrounding environmental setting
• location and condition of surface watercourses, local surface drainage systems, ponds and springs, and information on groundwater use, wells and drains
• visible signs of contamination or potential contamination, such as evidence of spills or leaks, surface staining, chemical storage on unsealed ground, stressed vegetation and odours
• visible signs of areas of fill, stockpiled material, ground disturbance, burnt areas and former building foundations
• location of chemical storage and transfer areas, bunding, waste storage areas, discharges to ground and existing tanks, pits, drains, pipelines and sumps
• adjacent, surrounding, or up gradient land uses and the potential for contamination from these sources
• location of former buildings, processes or activities undertaken on the site.
Information to assist with the design of site investigations
The following information may help with the design of site investigations:
• access constraints, including the location of buildings and hardstand, canopies, the location of underground services, and other issues that could pose physical challenges to the design and implementation of future site investigations
• location of any physical hazards such as overhead power cables
• availability of water and electrical supply for use during site investigations
• field readings of soil vapours in drains, sumps and trenches
Contaminated Land Management Guidelines No. 5 11
• collection of surface samples or suspect materials to assist with subsequent phases of investigation (eg, collection of a sample of suspected asbestos material, or hydrocarbon-stained soil for product identification).
2.3.3 Detailed site investigation
A detailed site investigation may be required to confirm or qualify the findings of the initial preliminary site investigation report. This will involve intrusive techniques to collect field data and soil samples for analytical testing to determine the concentrations of contaminants of concern. The scope of the detailed site investigation should be defined by the DQOs. Soil samples should be analysed for contaminants identified on the basis of the preliminary site study and/or preliminary site inspection. Samples may initially be analysed for a broad screen of contaminants which, based on experience, have typically been found on similar sites. The results from the detailed site investigation should be assessed against the DQO, and the conceptual site model updated. The information gathered during the detailed site inspection should be documented in a detailed site investigation report (see Contaminated Land Management Guideline No. 1: Reporting on Contaminated Sites in New Zealand (Revised 2011), Ministry for the Environment, 2001). Before undertaking the physical works of the detailed site investigation, the potential hazards at the site should be assessed and appropriate health and safety precautions taken (see sections 3.2 and 3.11). Any authorisation required (ie, resource consents, etc.) should be obtained before commencing work. This guideline does not cover the collection of other environmental media for testing, including (but not limited to) soil gas, groundwater, surface water and sediments, although these may also be considered as part of a detailed site investigation.
2.3.4 Supplementary site investigations
Supplementary site investigations are usually undertaken to provide:
• data on areas of concern not investigated during the detailed site investigation
• a clearer delineation or definition of a particular area or depth of contamination
• information to address specific technical matters (eg, to confirm the applicability of a particular remedial option)
• ‘certainty’ regarding environmental liability. The scope of the supplementary site investigation should be defined by the DQOs.
12 Contaminated Land Management Guidelines No. 5
Example: The objective of a supplementary site investigation is to establish whether vacuum extraction is an appropriate method for removing the bulk of volatile hydrocarbons from soil above the shallow water table, in the vicinity of a former underground storage tank. The DQOs require that soil properties such as grain size and porosity, together with the lateral extent of the impacted soil, are delineated by means of shallow soil sampling and analysis. This will allow the physical attributes of the vacuum extraction array to be designed. In this case, detailed information on maximum and average concentrations of the various contaminants of concern and their distribution throughout the soil profile are not important.
The other process and requirements for supplementary site investigations are similar to those set out for the detailed site investigation (section 2.3.3).
2.3.5 Site validation investigation
Site validation is undertaken after completing remediation activities on a site. The objective is to demonstrate that the concentrations of hazardous substances or other contaminants of concern that may remain in the soil within a site or part of a site meet the remediation criteria set out in a remedial action plan or similar document. The site validation and the level of confidence required in the data should be defined by the DQOs given in the remedial action plan. However, not all site validation investigations need to meet the same level of confidence, since this will be dependent on the decisions being made based on the data.
Example: A tailings dam containing acidic soils at a mine had been recently landscaped and covered with clean topsoil, although the remediated site was never validated. Areas of no vegetation growth were noted several years after rehabilitation. If a validation investigation had been undertaken, the remaining areas of excessively acidic soil would have been discovered and further soil cover imported.
The information from the site validation investigation should be documented in a site validation report. In the case of the removal of an underground storage tank, the site validation investigation should address all the issues included in the Report form for the removal and replacement of petroleum underground storage tanks and underground equipment (see Contaminated Land Management Guideline No. 1: Reporting on Contaminated Sites in New Zealand (Revised 2011), Ministry for the Environment, 2001). The other process requirements for site validation investigations are similar to those set out for the detailed site investigation described in section 2.3.3 of this document.
Contaminated Land Management Guidelines No. 5 13
3 Preparing for Fieldwork and Soil Sampling
3.1 Sampling objectives The first stage in soil investigations is to establish clear sampling objectives. These must define why and how samples are being collected, and lead to the formulation of the sampling strategy (eg, where to collect the samples). The sampling objectives will be site specific and depend on the purpose of the investigation (as defined by the DQOs). Common sampling objectives include:
• to establish the type and location of sources of contamination
• to establish the nature, degree and extent of contaminant distribution (both vertically and laterally)
• to verify that the contamination on site has been reduced to below an established value (eg, following clean-up of a chemical spill)
• to determine the nature of material for waste characterisation. In some instances it could be appropriate to establish different sampling objectives for different areas within a site. This is often done when stratified sampling is used at a site (section 3.4.3).
3.2 Preparing for fieldwork Before commencing fieldwork you should:
• obtain the necessary permits from the regional council or territorial authority for undertaking the works (eg, land-use consents for borehole installation)
• obtain permission for access to the site and individual sampling locations, which may include access to neighbouring properties, and notify the relevant authorities and neighbours (eg, permission from the New Zealand Transport Agency to sample below a state highway)
• check clearance of underground and above-ground services
• ensure the availability of suitably trained and qualified site personnel
• review the sampling and analysis plan and obtain the appropriate sampling equipment, including containers from the analytical laboratory and storage containers, and make sample transport arrangements
• check and calibrate field instruments, as necessary
• arrange for sampling equipment decontamination
• arrange for the suitable disposal of excess soil, wash water and any contaminated materials (such as gloves) generated during the works
• ensure the availability and suitability of the required contractors
14 Contaminated Land Management Guidelines No. 5
• prepare a health, safety and environment plan (HSEP),3
– an assessment of the on-site hazards which should include:
– measures to eliminate, isolate or minimise these hazards for the tasks proposed – emergency response measures – site-specific training needs – protective equipment.
An example of a job safety analysis form within an HSEP is presented in Appendix A. Adequate preparation beforehand should ensure that on-site work is carried out safely and minimises unnecessary delays in the field.
3.3 Sampling and analysis plans A sampling and analysis plan should be prepared as part of the process of establishing DQOs. It should be a working document that is utilised by field staff undertaking the sampling. As a minimum, the following items should be included in the plan:
• purpose of the investigation
• sampling objectives
• information about the site (location, history and conceptual site model with contaminants identified)
• sampling pattern and strategy to be used
• field screening or on-site testing requirements
• location, depth, type and number of samples to collect
• sampling method(s) to be used
• order of sample collection (where practical, sampling should start at the part of the site suspected to be least contaminated to minimise the possibility of any cross-contamination)
• quality assurance / quality control requirements
• decontamination procedures
• handling and sample preservation requirements
• sample transport and holding times
• laboratory contact details. The form, content and level of detail documented in the sampling and analysis plan will be site specific.
3 Also refer to any appropriate Occupational Safety and Health guidance; eg, Health and Safety Guidelines
on the Clean-up of Contaminated Sites (OSH, 1994).
Contaminated Land Management Guidelines No. 5 15
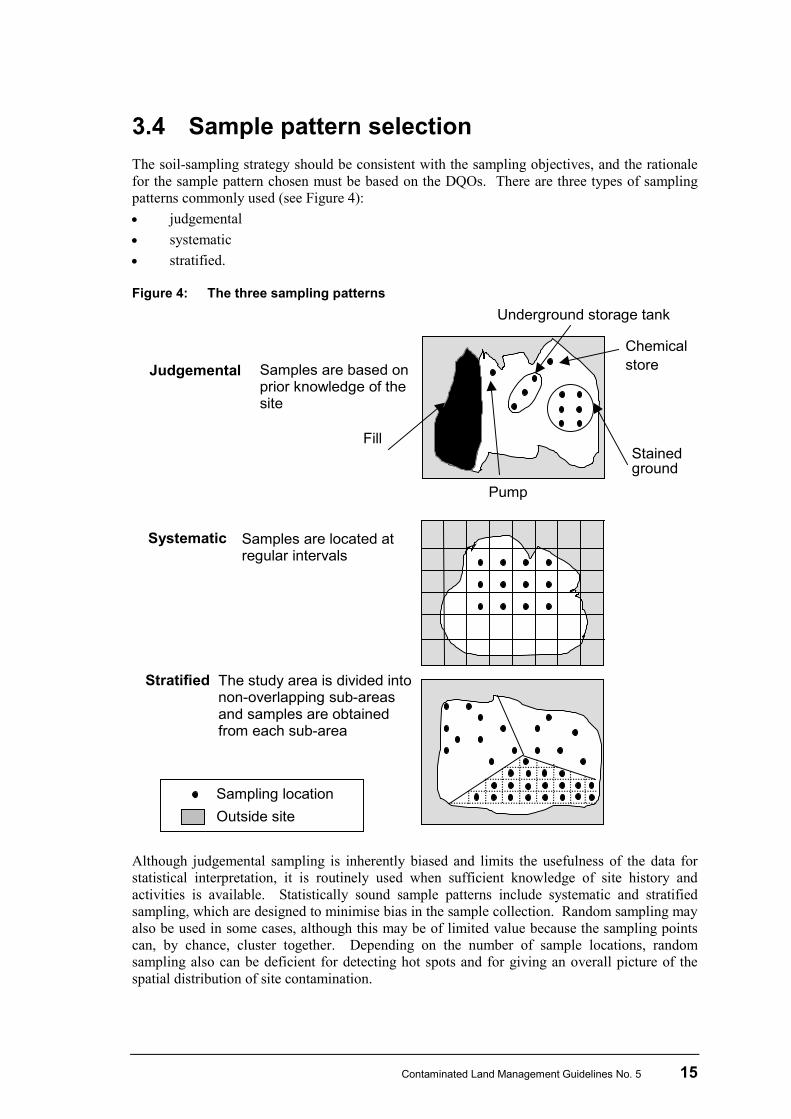
3.4 Sample pattern selection The soil-sampling strategy should be consistent with the sampling objectives, and the rationale for the sample pattern chosen must be based on the DQOs. There are three types of sampling patterns commonly used (see Figure 4): • judgemental • systematic • stratified. Figure 4: The three sampling patterns
Judgemental Samples are based onprior knowledge of thesite
Systematic Samples are located atregular intervals
Stratified The study area is divided intonon-overlapping sub-areasand samples are obtainedfrom each sub-area
Sampling locationOutside site
Stainedground
Chemicalstore
Underground storage tank
Pump
Fill
Although judgemental sampling is inherently biased and limits the usefulness of the data for statistical interpretation, it is routinely used when sufficient knowledge of site history and activities is available. Statistically sound sample patterns include systematic and stratified sampling, which are designed to minimise bias in the sample collection. Random sampling may also be used in some cases, although this may be of limited value because the sampling points can, by chance, cluster together. Depending on the number of sample locations, random sampling also can be deficient for detecting hot spots and for giving an overall picture of the spatial distribution of site contamination.
16 Contaminated Land Management Guidelines No. 5
In practice, an investigation of a site for the presence of hazardous substances normally involves the use of more than one sampling pattern. If a predetermined sampling point needs to be relocated (eg, due to a physical obstruction), then the deviation from the sampling pattern should be documented. Further information on sampling patterns can be found in the following references:
• US EPA (2002) Guidance on Choosing a Sampling Design for Environmental Data Collection for Use in Developing a Quality Assurance Project Plan, EPA QA/G-5S
• The Centre for Research into the Built Environment (1994) UK Contaminated Land Research Report CLR 4: Sampling strategies for contaminated land. The Centre for Research into the Built Environment, Nottingham Trent University, Nottingham.
3.4.1 Judgemental sampling
Judgemental sampling is also referred to as targeted, selective, strategic or model-based sampling. Sample locations are selected based on prior knowledge of contaminant distribution established from the site history, evidence of staining, and professional judgement. Only use judgemental sampling when there is reliable information about the site (eg, site history, the location of specific areas of concern is known). Judgemental sampling can be used to:
• provide insight into what chemicals may be present in relation to particular activities that have occurred
• confirm the presence or level of contamination at a specific location (eg, a ‘worst case’ location)
• provide screening information to assist the scoping of subsequent investigation phases. The advantages of judgmental sampling are that it is less expensive than statistical sample designs and can be efficient and easy to implement. One major limitation, however, is the introduction of bias due to the sample pattern. However, this approach is often used for sites where reliable site history data identify areas of possible contaminants on an otherwise ‘clean’ site. Care must be taken when interpreting the results of judgmental sampling, because the validity of the data is dependent on knowledge of the site and professional judgement. Owing to the bias introduced, judgemental sampling should not be used for validation sampling, and a statistically designed investigation is recommended for the collection of validation samples.
Example: A timber treatment site is being investigated using judgemental sampling. Based on the preliminary site inspection, aerial photographs and discussions with workers, samples are located around the edge of the drip pad, along vehicle tracks where treated timber is carried, under an above-ground diesel tank, and under the piles of treated timber stored in the yard. Samples are also taken at the bulk Copper Chromium Arsenic solution delivery point, the point where the PCP antisapstain bath used to be located, and the area where sludge from the treatment operations used to be dumped.
Contaminated Land Management Guidelines No. 5 17
3.4.2 Systematic sampling
Systematic sampling, also referred to as non-targeted or grid sampling, is a statistically based sampling strategy. Sample locations are selected at regular intervals throughout the site area on a grid pattern, with the first sampling location chosen at random to lessen bias. Grid patterns include square grid, triangular, radial and herringbone, and are selected on the basis of factors such as the size and geometry of contamination hotspots and the overall site size. Situations appropriate to the use of systematic sampling include: • site validation of both residual soil and backfill material • to detect hotspots (see Appendix D) • estimating the mean concentrations of contaminants • general site characterisation in the absence of adequate site history information. Systematic sampling has the advantage of being practical and convenient to use in the field. In areas where contamination is suspected to exhibit periodic spatial variations (eg, grape vines spaced at regular intervals), locations must be designed in a way to avoid introducing a bias to the samples; for example, by choosing appropriate grid spacing. A disadvantage of systematic sampling is that the number of sampling locations could be large and it may not be as cost effective as other designs if prior information on site use is available.
Example: An automotive dismantler’s yard is to be redeveloped for residential use. Over its 20-year life, car parts and machinery have been stored all over the site. An appropriately sized grid is used over the entire site because contamination could be present at any location on the site.
3.4.3 Stratified sampling
In stratified sampling the site is divided into non-overlapping sub-areas, with differing sampling densities and patterns. The sub-areas are identified as regions of the site that are expected to be uniform in character, and sampling points within these areas are selected systematically or judgementally. Prior knowledge of the sampling sub-areas is combined with likely contaminant behaviour to determine where to sample and to reduce the number of samples. The number of samples within each sub-area is proportional to the relative size of the site and sub-area. The basis for the selection of sub-areas may include: • geological features • the layout of current process or storage facilities • site history • lateral and vertical distribution of contamination • intended future use of the sub-area. Stratified sampling is used for investigating large and complex sites or when an area can be subdivided on the basis of anticipated contamination levels (eg, based on knowledge of site history).
18 Contaminated Land Management Guidelines No. 5
Example: A known chemical manufacturing company owns a two-hectare parcel of land. A detailed site history (affidavits from site owners, aerial photograph search, etc.) reveals that before ownership by the chemical company the site was used as pasture. Since purchase, only the front hectare has been used by the chemical company – the rear hectare has been leased out and retained in pastoral use. A stratified sampling pattern would split the site into the two one-hectare blocks. Judgemental sampling would be used at locations around the manufacturing plant, material storage areas, etc., with a grid (systematic sampling) over the rest of the front hectare. The rear hectare could be sampled using six composites each made up from four sub-samples (section 3.6.4).
3.5 Field-screening techniques Field-screening techniques can be used before a detailed site investigation, or as part of the investigation strategy. Field-screening methods are used to:
• define the soil contamination cost-effectively and assist in limiting the extent of an investigation
• refine the sampling locations
• identify samples to be analysed. Any field-screening technique must be appropriately validated. The use of a field-screening technique may not remove the requirement for intrusive ground investigation and laboratory analysis. These techniques require expertise to use: all equipment must be appropriately calibrated, and the work undertaken by trained staff. The limitations of the field-screening techniques should be specified in the reporting stage (eg, instrumental interference, depth limitations).
3.5.1 Non-intrusive techniques
Geophysical surveys are non-intrusive techniques used to identify irregularities or hidden features in the subsurface (eg, the edge of a landfill, buried objects and the location of foundations). Geophysical surveys involve taking measurements of the subsurface properties such as conductivity and electrical resistivity. The work should be performed and the results interpreted by qualified specialists. The choice of geophysical techniques used will depend on the site-specific conditions, such as the purpose of the survey, ground conditions, depth to the water table, etc. Another example of a non-intrusive technique is the use of infra-red photography to determine the areas of contaminated ground, landfill gases and stressed vegetation.
Contaminated Land Management Guidelines No. 5 19
3.5.2 Soil-screening techniques
Soil-screening techniques are field measurements taken to identify contamination, and they can be used to determine which samples to analyse, or where to position a sample borehole or test pit. Soil-screening techniques are used to detect the soil concentrations in the ground by taking in-situ or ex-situ measurements (eg, before excavations). Field soil-screening techniques are constantly being developed. The following discussion refers to the most common techniques, but you should identify any other techniques that might be more appropriate to the site under investigation and/or their DQOs. In situ field screening involves the use of instruments such as portable photoionisation detectors (PID), flame ionisation detectors (FID) or X-ray fluorescence (XRF) detectors, to take measurements across the site. For soil gases, measurements are taken by either drilling a narrow-diameter probe hole into the soil, or inserting metal probes into the ground to measure the vapour concentration. The absence of vapour readings in the soil does not necessarily indicate the absence of contamination, and confirmatory soil sampling should also be undertaken. Ex-situ field-screening techniques use portable field instruments to measure the concentrations in samples of soil collected from the ground. Headspace analysis for soil vapours is a widely used technique in which a soil sample is collected in a bag/container. The headspace in the bag/container is measured after a set time and the results used to determine which samples to analyse. Field screening for volatiles should not be undertaken on the same sample that is submitted for analysis, and duplicate samples must be collected. Other examples of soil-screening equipment include portable gas chromatography instruments for hydrocarbons, immunoassay kits to measure hydrocarbons, and hand-held Geiger counters to measure radiation.
3.6 Collecting a representative soil sample A representative soil sample is one that represents the actual environmental conditions. It is dependent on good sample design, the method used to collect the sample and how it is handled. The sampling and analysis plan must set out the minimum number of samples to be taken and specify sampling depths, in line with the sampling objectives. There should be sufficient flexibility in the sampling and analysis plan to enable additional samples to be collected as a result of on-site observations, which may differ from the conceptual site model. Professional experience and judgement should be used.
20 Contaminated Land Management Guidelines No. 5
3.6.1 Number of samples
The number of samples collected is determined by the intended use of the data, the level of confidence required for the investigation, the area of the site, site-specific constraints/limitations, and budget. The sampling and analysis plan should specify the number of samples to be collected, and the vertical and lateral locations. A staged approach to investigations is used, in which a greater number of samples are collected in the field, with selected analyses undertaken on selected samples. Provided the samples have been stored correctly and holding times for the samples are sufficient, further analyses on samples can be subsequently undertaken once the initial results are received and the conceptual site model has been updated. The number of samples may be weighted towards near-surface sampling for assessing health and ecological risks from exposure to soil contaminants (eg, via skin contact for human health risk). If groundwater is considered to be a potential pathway or receptor, then an increased number of samples collected from near the water table may be selected for analysis. A method for calculating the minimum number of sample locations based on the design of an investigation using statistical methods is provided in Appendix B. The appropriateness of the sampling rationale must be justified in the context of each individual site investigation. Table A1 in Appendix B summarises the minimum sampling points required for detecting circular hot spots with 95% confidence using a systematic sampling pattern, based on site area and grid size. This guideline sets out the minimum number of sampling points required, and any variations to the minimum requirements should be justified. Specific guidance on the minimum number of samples required for the investigation of oil storage tanks and lines is provided in Guidelines for Assessing and Managing Petroleum Hydrocarbon Contaminated Sites in New Zealand (Revised 2011) (Ministry for the Environment, 1999). We must emphasise that these are guidance numbers and represent the minimum number of sampling locations, and that further samples may be required to produce representative data for contamination at a site (eg, several tanks may be included in one tank pit, so the guidance on the minimum number of samples of five per tank pit may need to be increased).
Example: A paddock on a farm contains a buried offal pit, including bags of pesticides. Anecdotal information collected from local residents suggests that the pit lies within a one-hectare corner of the paddock and that the original dimensions of the pit were approximately 20 metres in diameter. Using the formulas given in Appendix B, it is determined that to locate the pit (based on a circular hot spot of radius 10 metres), a square grid size of 17 metres should be used. For a one-hectare site, this equates to a minimum of 35 sample locations. Additional samples at various depths may also be required.
Contaminated Land Management Guidelines No. 5 21
3.6.2 Sampling depth
Sampling depths must be based on known site conditions and the likely distribution of the contaminants of interest, and should be defined in the sampling and analysis plan. If there is uncertainty about the probable vertical behaviour of a given contaminant in a particular soil, collect soil samples at various depths. Soil samples should be collected at two or more depths to establish the vertical extent of contamination. The sample depth and the soil profile (eg, fill material, topsoil, humus/leaf litter) from which the sample was collected must be recorded and considered as part of the data interpretation (section 5.2.1). Soil samples can be collected from throughout the soil profile, from the surface (0–15 cm), at regular intervals (say every 1.0 m), at any change in strata, and at the depth at which contamination is anticipated or observed. Samples should generally not be collected from across different strata (for example across the boundary between natural ground and fill). Surface samples are defined as no deeper than 15 cm, and are typically collected from 0–7.5 cm. The collection of surface soil samples deeper than 15 cm increases the possibility of dilution of the surface soil sample by mixing with less contaminated subsurface soils. Depths of surface soil samples will be dependent on the DQOs, and 0–7.5 cm is commonly used to represent the direct human exposure pathway, whereas 0–15 cm is commonly used to represent the home produce exposure pathway, because the latter covers the significant root zone. When sampling for volatiles, be aware that volatiles are readily lost from the surface layers of soil so they are not normally collected from surface layers unless investigating a spill of chemicals that has just occurred (depending on site-specific DQOs).
Example: A petrol loss from the base of an underground storage tank has caused contamination below the base of the tank pit only, with little or no impact on shallower soils. The top 1 m of the ground surrounding the tank is made up of boiler ash containing arsenic and residual diesel from an earlier surface spill. The sampling objectives are directed at assessing the impact of benzene on groundwater, which lies several metres below the base of the tank. No sampling of the fill materials is undertaken during the site investigation, and soil samples need to be collected at the depth of the base of the tank, and down to the groundwater table.
3.6.3 Soil-sampling techniques
There are a number of different soil-sampling techniques available, and the actual method used will depend on a variety of factors, including the objectives of the investigation, cost, access, degree of disturbance, and reinstatement. Often a variety of methods are used as part of an investigation, but whichever technique is used, the soil sampling must be undertaken in a manner that retains the sample integrity. The following techniques can be considered when undertaking soil sampling: • surface and shallow subsurface grab sampling • hand auger sampling • test pit sampling • borehole sampling.
22 Contaminated Land Management Guidelines No. 5
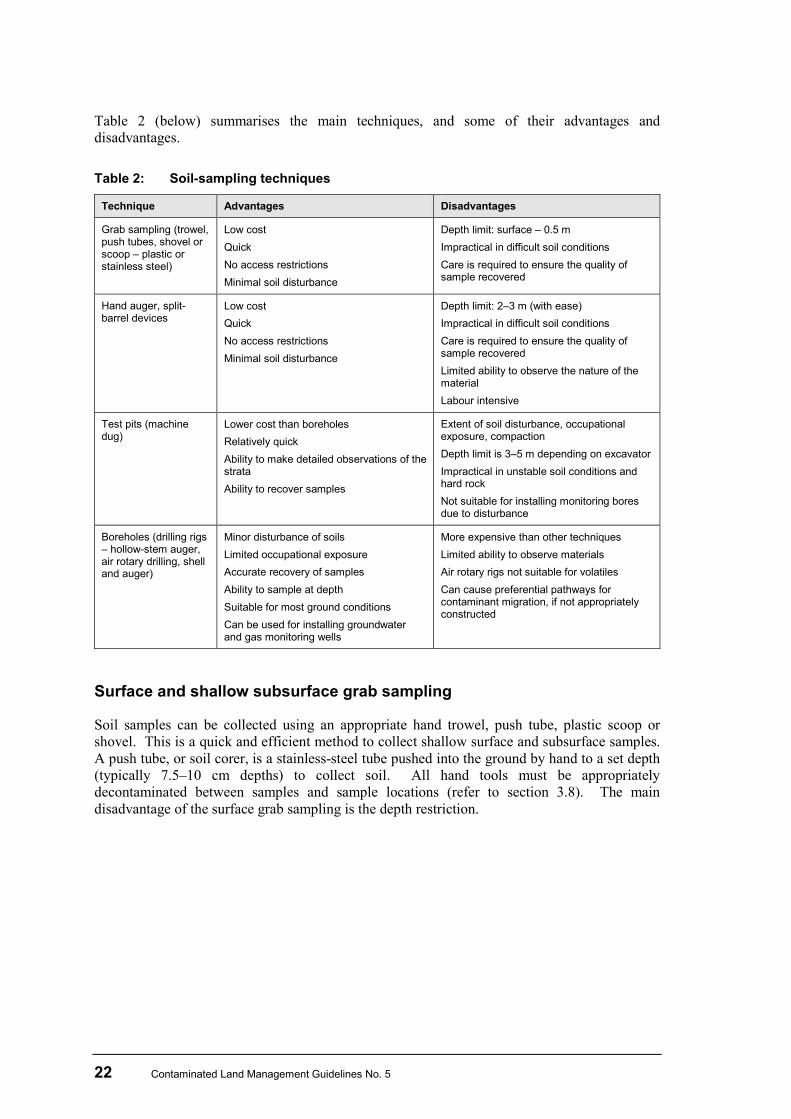
Table 2 (below) summarises the main techniques, and some of their advantages and disadvantages. Table 2: Soil-sampling techniques
Technique Advantages Disadvantages
Grab sampling (trowel, push tubes, shovel or scoop – plastic or stainless steel)
Low cost Quick No access restrictions Minimal soil disturbance
Depth limit: surface – 0.5 m Impractical in difficult soil conditions Care is required to ensure the quality of sample recovered
Hand auger, split-barrel devices
Low cost Quick No access restrictions Minimal soil disturbance
Depth limit: 2–3 m (with ease) Impractical in difficult soil conditions Care is required to ensure the quality of sample recovered Limited ability to observe the nature of the material Labour intensive
Test pits (machine dug)
Lower cost than boreholes Relatively quick Ability to make detailed observations of the strata Ability to recover samples
Extent of soil disturbance, occupational exposure, compaction Depth limit is 3–5 m depending on excavator Impractical in unstable soil conditions and hard rock Not suitable for installing monitoring bores due to disturbance
Boreholes (drilling rigs – hollow-stem auger, air rotary drilling, shell and auger)
Minor disturbance of soils Limited occupational exposure Accurate recovery of samples Ability to sample at depth Suitable for most ground conditions Can be used for installing groundwater and gas monitoring wells
More expensive than other techniques Limited ability to observe materials Air rotary rigs not suitable for volatiles Can cause preferential pathways for contaminant migration, if not appropriately constructed
Surface and shallow subsurface grab sampling
Soil samples can be collected using an appropriate hand trowel, push tube, plastic scoop or shovel. This is a quick and efficient method to collect shallow surface and subsurface samples. A push tube, or soil corer, is a stainless-steel tube pushed into the ground by hand to a set depth (typically 7.5–10 cm depths) to collect soil. All hand tools must be appropriately decontaminated between samples and sample locations (refer to section 3.8). The main disadvantage of the surface grab sampling is the depth restriction.
Contaminated Land Management Guidelines No. 5 23
Hand auger sampling
A hand auger is a sampling device manually or mechanically driven into the soil, with typical dimensions excavated of between 6 cm and 15 cm in diameter. Sampling depths up to 2–3 m can be easily achieved, depending on soil type, and greater depths are sometimes possible. Soil samples can be collected from the auger head or from an auger fitted with a split-spoon-type sampler. Augers may be used to sample locations with restricted access, and a monitoring well may also be installed in the hole excavated. Disadvantages of auger sampling are the limited sample size, depth restrictions and the potential for cross-contamination with depth if the sample is collected off the auger flight. Some loss of volatiles can occur from samples collected from the auger head or flight.
Test pit sampling
Test pits are excavated using a backhoe excavator, but may also be hand dug. Typical dimensions are rectangular pits of around 3 m length, 1 m breadth and 3–4 m depth. The test pit size will depend on the stability of the pit, strata, bucket size, and reach of the backhoe. Collect soil samples from the centre of the excavator bucket. Take care to avoid cross-contamination. Test pit excavations may be hazardous due to the possibility of slumping, or a build up of hazardous gases. No person should enter a pit if the depth is greater than 1.5 m, and assess shallower pits for stability and the potential for hazardous gases to be present if a person is to enter the excavation. Further safety guidance is provided in Approved Code of Practice for Safety in Excavation and Shafts for Foundations (OSH, 1995). Test pits enable visual inspection of the shallow strata and can be extended into trenches to observe the extent of strata or visible contamination. A disadvantage of test pits is the disturbance caused to the ground, and for this reason they are not suitable for collecting undisturbed soil samples or for installing wells for groundwater or soil gas monitoring. When excavating test pits, the excavated material should be laid out at the side of the pit in the order of excavation. When reinstating test pits, the spoil excavated must be replaced in the same order that it was excavated (material from the base of the pit is returned to the base, and so on).
Borehole sampling
Boreholes can be drilled using different types of drilling rigs and are suitable for soil sampling and for installing soil gas and groundwater monitoring devices. Boreholes are typically 150 mm to 200 mm in diameter and extend to many metres in depth. The type of drilling rig will depend on the depth of the bore, geology, and the nature of the proposed scope of works. Drilling rigs commonly used for soil sampling include a continuous-flight auger, hollow-stem auger and air rotary. Split-spoon or push-tube-type samplers can be fitted for collecting soil samples. A disadvantage is the possibility of introducing preferential pathways for the migration of contaminants, so appropriate drilling and borehole construction techniques must be used to minimise this.
24 Contaminated Land Management Guidelines No. 5
Do not use air rotary drilling for collecting samples to be analysed for volatile contaminants, as the air affects the integrity of the sample collected. Drill in a manner to avoid introducing contaminants, with minimal water added during drilling. Use non-hydrocarbon-based oil on the rig and casing if sampling for organic compounds to avoid interference with analytical parameters to be tested. The advantages of boreholes include the collection of undisturbed samples at depth, and the option to install correctly constructed groundwater or soil-gas monitoring wells. Factors to take into account when selecting the sampling technique should include: • the DQOs • target analytes • sampling depth • physical constraints at the site (height and access obstructions, topography) • ground conditions (ground cover, soil type, stability, groundwater depth) • reinstatement requirements • cost • health, safety and environmental implications associated with the sampling techniques.
3.6.4 Composite sampling
Composite sampling consists of collecting individual samples from different locations and bulking and mixing an equal mass of the samples (called sub-samples) together to form one composite sample. A composite sample can then be analysed, and represents the average of the constituent sub-samples. The use of composite sampling should only be undertaken by experienced site investigators after full consideration of the site history. Use sample compositing with caution because high contaminant concentrations in one or more of the samples making up the composite can be masked by a dilution effect of the other samples. The decision to use composite sampling must be made with reference to the site DQOs. The investigation of horticultural land and broad-scale contamination typically uses composite techniques, often with more than four sub-samples per composite. This method is appropriate where low-concentration, uniform contamination is present and can be confirmed by site history. Composite sampling can be cost effective because the number of samples to be analysed is reduced. However, costs are incurred at the laboratory for preparing the composites and you may need to retest individual sub-samples. For this reason compositing should be done in the laboratory and individual samples retained. Additional information on compositing in the laboratory is provided in section 4.4.3. Compositing can be used to characterise a stockpile of material; for example, to determine an acceptable disposal location, or for characterising sites with similar contaminant levels (such as horticultural sites). Soils containing or suspected of containing volatile organic compounds are not suitable for compositing.
Contaminated Land Management Guidelines No. 5 25
The following guidelines apply to the use of composites.
• A reliable and comprehensive site history has been compiled for the site, so areas of hot spots or broad-scale contamination are known.
• All composite samples are made up of the same number and weight of sub-samples.
• No more than four sub-samples should be used to make up the composite, although the number is governed by the analytical detection limits.
• Sub-samples are usually taken from adjacent locations and from similar depths (from the same soil/fill horizon), and must not be heterogeneous (eg, one sub-sample a gravel, the other a clay).
• Sub-samples should be taken from areas with similar history (similar contaminants and contaminant distribution).
• Compositing must be undertaken in the laboratory, and original samples retained for possible retesting.
• Compositing is not suitable for volatile substances, because the mixing procedure results in loss of volatiles.
• Compositing is not suitable for soils that are not easily mixed (eg, clay) or for soils with different moisture contents.
• When comparing composite results against guideline values, the guideline value must be adjusted by dividing the value by the number of sub-samples in the composite:
Adjusted guideline value = compositein subsamples ofNumber
valueGuideline
3.6.5 Background samples
Background samples are collected in the area near the site that is not affected by the contaminant sources on the site. If required by the DQOs, at least one background sample should be collected. Background samples are used as a reference point to represent undisturbed natural soil at or near the surface. In practice, obtaining true background samples can be difficult owing to general anthropogenic sources of contamination in the areas surrounding most sites where hazardous substances are present or suspected. Background samples can help to show whether contaminants present on a site are due to wider area effects, either natural or artificial. Suitable locations for background samples should be chosen based on the: • site geology (background concentrations of metals are related to the parent rock types) • site history (should indicate no disturbance at the location) • topography (sample collection should not be from any low-lying areas, such as ditches,
but from areas of raised ground). Some regional councils have information on background levels of common contaminants (usually metals) in the main types of natural soils within their region.
26 Contaminated Land Management Guidelines No. 5
3.7 Sample handling and transport 3.7.1 Sample logging
All soil samples collected must be inspected and the soil profile logged using a consistent method and format for soil descriptions. Record any general observations on the soil-sampling locations, weather conditions, ground surface, topography, and preferential pathways for contaminant migration. Identify the location and depth of samples collected on a location plan. The recommended method for logging soil samples is the New Zealand Geomechanics Society terminology for description of soils in the field, as presented in Appendix C. The soil description should include the general appearance, colour, soil type, strength, moisture content and particle shape. For environmental investigations, record the evidence of contamination (visual signs, obvious odours) and specific information on the nature of any fill materials. Also record any obvious odours, but for health reasons do not undertake any direct smelling of samples. Avoid directly handling the soil with bare hands on suspected contaminated sites by wearing appropriate gloves.
3.7.2 Sample locations and labels
Once a soil sample is collected it should be clearly and uniquely labelled. Records kept for each sample should include:
• a unique sample reference number (avoid numbers and letters that are easily confused, such as 1 and l, or O and 0))
• date, time, depth and location collected
• sampler’s name
• any site observations and weather conditions. Keep the sampling records in a field notebook, which must identify the site, exact sampling location and any observations or measurements that could influence the interpretation of the results. The sample locations can be documented by photographs with a reference location marked on a board. The sampling records should be taken with a waterproof pen or pencil, and dated and signed.
3.7.3 Sample handling
Sample containers should be supplied by the analytical laboratory and must be clean and of an appropriate size for the analyses to be undertaken. Recommended sample containers and guideline sample holding times before analysis are presented in Appendix D. The sample containers should be handled so as to ensure the integrity of the sample is not compromised during storage. Keep samples in sealed containers away from sources of heat and protected from light, and deliver to the laboratory for analysis. Recommended holding times are used as a guide to the length of time samples may be held prior to analysis, and will vary depending on the parameters to be analysed.
Contaminated Land Management Guidelines No. 5 27
3.7.4 Sampling for volatiles
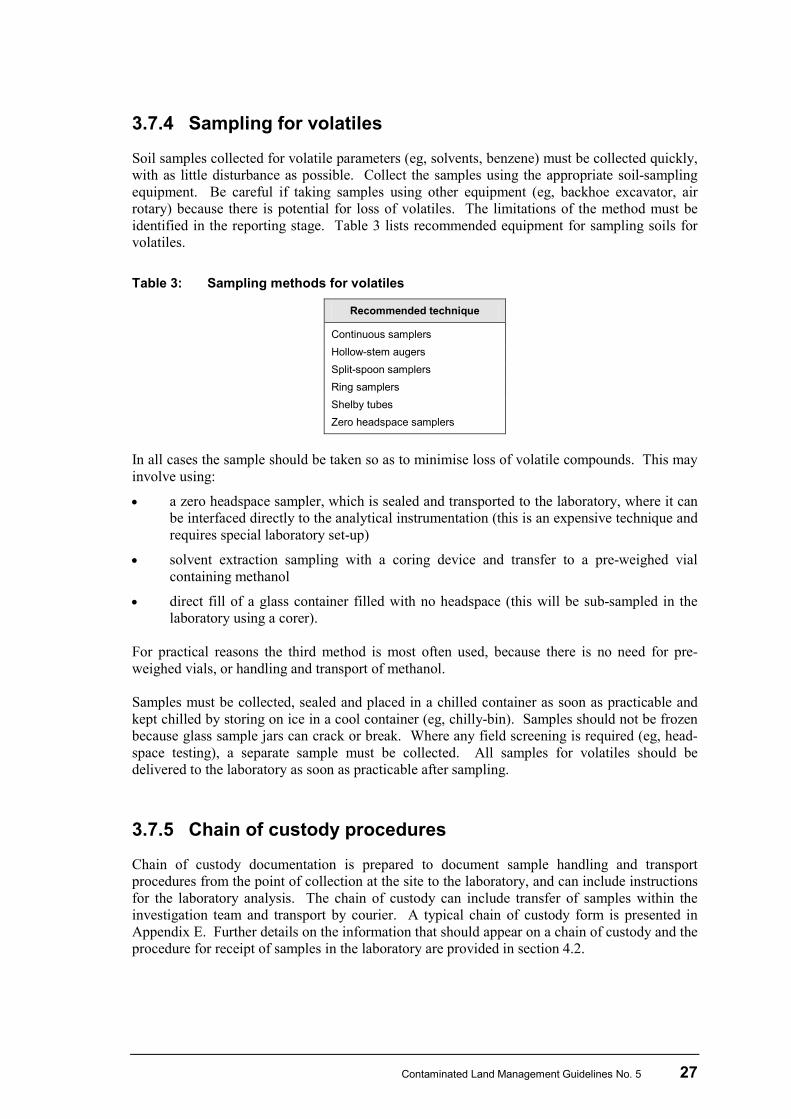
Soil samples collected for volatile parameters (eg, solvents, benzene) must be collected quickly, with as little disturbance as possible. Collect the samples using the appropriate soil-sampling equipment. Be careful if taking samples using other equipment (eg, backhoe excavator, air rotary) because there is potential for loss of volatiles. The limitations of the method must be identified in the reporting stage. Table 3 lists recommended equipment for sampling soils for volatiles. Table 3: Sampling methods for volatiles
Recommended technique
Continuous samplers Hollow-stem augers Split-spoon samplers Ring samplers Shelby tubes Zero headspace samplers
In all cases the sample should be taken so as to minimise loss of volatile compounds. This may involve using:
• a zero headspace sampler, which is sealed and transported to the laboratory, where it can be interfaced directly to the analytical instrumentation (this is an expensive technique and requires special laboratory set-up)
• solvent extraction sampling with a coring device and transfer to a pre-weighed vial containing methanol
• direct fill of a glass container filled with no headspace (this will be sub-sampled in the laboratory using a corer).
For practical reasons the third method is most often used, because there is no need for pre-weighed vials, or handling and transport of methanol. Samples must be collected, sealed and placed in a chilled container as soon as practicable and kept chilled by storing on ice in a cool container (eg, chilly-bin). Samples should not be frozen because glass sample jars can crack or break. Where any field screening is required (eg, head-space testing), a separate sample must be collected. All samples for volatiles should be delivered to the laboratory as soon as practicable after sampling.
3.7.5 Chain of custody procedures
Chain of custody documentation is prepared to document sample handling and transport procedures from the point of collection at the site to the laboratory, and can include instructions for the laboratory analysis. The chain of custody can include transfer of samples within the investigation team and transport by courier. A typical chain of custody form is presented in Appendix E. Further details on the information that should appear on a chain of custody and the procedure for receipt of samples in the laboratory are provided in section 4.2.
28 Contaminated Land Management Guidelines No. 5
3.8 Decontamination Decontamination procedures include the process of washing, rinsing and removing material from exposed surfaces of equipment and clothing that can, or has, come into contact with the sample. Any decontamination must be undertaken in a manner that avoids contaminating areas to be sampled, or the spread of contamination around or off the site. Take care to ensure vehicles do not become contaminated, and avoid future cross-contamination. Collect all decontamination waste and wash water for proper disposal. Rinsate blanks (see section 3.9) can be collected to assess the effectiveness of the decontamination process. The level of decontamination adopted should be practical and commensurate with the DQOs. It will not be necessary to observe the same level of decontamination in every case. Decontamination procedures may include the following.
• Personnel handling soil samples should replace gloves between each sample.
• Scrape or brush off any soil adhering to the sampling equipment, clothing or boots.
• Wash equipment in detergent (phosphate-free, where required).
• Rinse with tap water, followed by a rinse in high-purity analytical-grade deionised water.
• For some equipment, the following additional measures may be required: – for metal analysis, rinse in dilute nitric acid then rinse in high-purity analytical-grade
deionised water – for gross organic contamination, rinse with water, then acetone followed (in some
cases) by hexane (acetone and hexane solvents should not be used if sampling for volatile organics).
• Store tools so as to prevent recontamination (eg, wrap in clean aluminium foil when sampling for organics).
Large sampling equipment, such as the backhoe bucket and drill casings that come into contact with the soil, should be cleaned between sampling locations on a dedicated area as follows. • Remove any loose soil by brushing, scraping or wiping. • Steam clean or wash with a high-pressure washer. • Rinse with potable water.
3.9 Field quality assurance (QA) / quality control (QC)
Soil samples collected during an investigation should be as fully representative as possible of the area to be characterised and the location sampled. Common sources of errors and uncertainty that can arise in the sampling and analysis of soils include: • poor sampling design • inappropriate sampling procedure • improper labelling of samples (eg, illegible or missing) • improper handling and storage of samples • laboratory errors.
Contaminated Land Management Guidelines No. 5 29
In general, the bias associated with field sampling is usually more significant than the errors associated with analytical methods. Common situations that give rise to errors and uncertainty in soil sampling include:
• samples are not collected from the correct depths or locations
• samples are contaminated using contaminated probes, utensils or other instruments when making field measurements
• decontamination is not undertaken between samples, leading to cross-contamination between samples
• the parameter of interest is volatile, and samples are exposed to air for a prolonged period
• samples are exposed to vehicle exhaust fumes, lubricants and other external sources of contaminants.
Quality assurance (QA) and quality control (QC) programmes for field sampling are required to control sampling errors to an acceptable level, as set out in the DQOs. The QA/QC procedures should consider all the stages of the investigation, including the:
• qualifications and experience of staff carrying out the work, particularly the field staff
• qualification, accreditation and experience of sub-contractors (including the laboratory)
• appropriate sample collection methods, cleaning and calibration of equipment, collection of field QC samples
• accurate recording of the work carried out and data collection, including any observations or conditions at the time of sampling that may assist in interpreting the data
• chain of custody procedures and sample storage
• reviews and audits of the work being carried out, including data reporting and interpretation.
The two data quality indicators most often used in field sampling to measure compliance with DQOs are bias and precision. Precision is defined as a measure of random variation in data and is a measure of reproducibility. Bias is defined as a systematic deviation (error) in data, and it affects accuracy (ie, proximity to the true value). Precision is typically estimated using duplicate samples, and bias can be assessed using blank sample types (see sections 3.9.1 and 5.4.3).
3.9.1 Field QC
Field QC procedures should be in place to manage sampling errors and should be documented in the sampling and analysis plan. Procedures should include the collection of field QC samples and technical review steps during the data collection process. The number of QC samples taken will be dependent on the DQOs and the type of investigation undertaken. Greater confidence in site assessments can be achieved by taking QC samples and by increasing the number of samples taken. Field QC procedures are used to measure the uncertainty in the data from sampling, handling and laboratory errors. Table 4 summarises the recommended number of field QC samples that should be included when collecting soil samples.
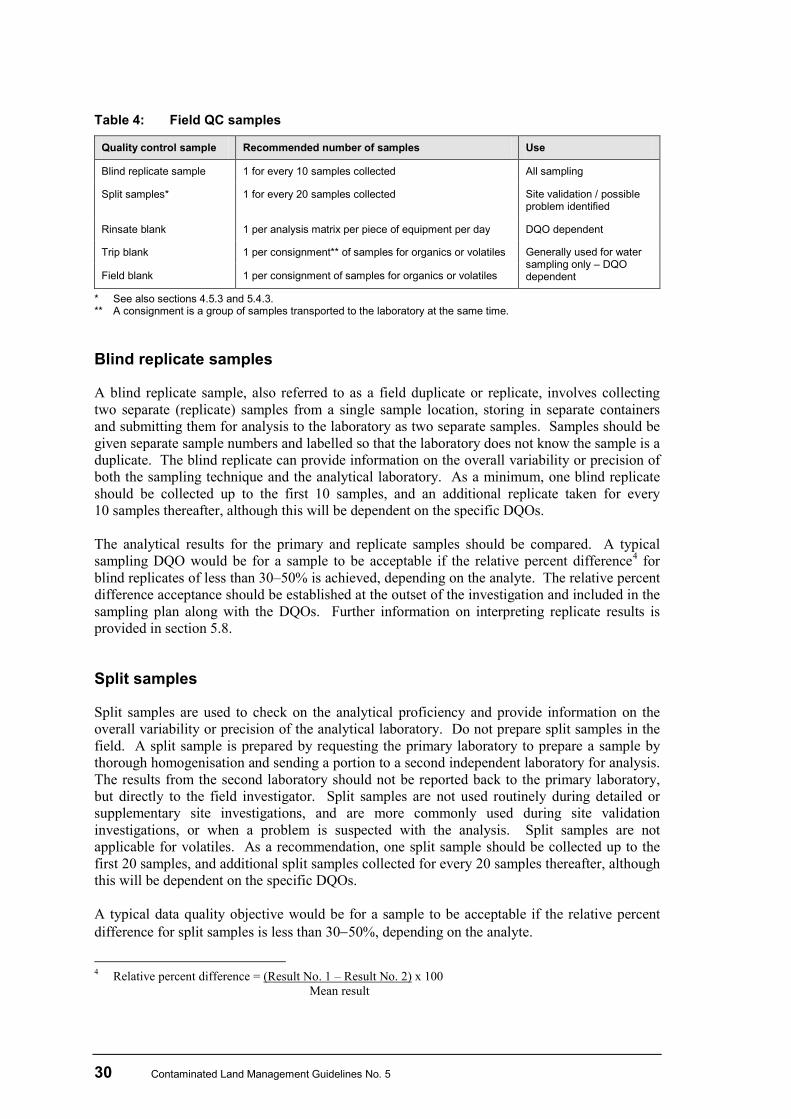
30 Contaminated Land Management Guidelines No. 5
Table 4: Field QC samples
Quality control sample Recommended number of samples Use
Blind replicate sample 1 for every 10 samples collected All sampling
Split samples* 1 for every 20 samples collected Site validation / possible problem identified
Rinsate blank 1 per analysis matrix per piece of equipment per day DQO dependent
Trip blank 1 per consignment** of samples for organics or volatiles Generally used for water sampling only – DQO dependent Field blank 1 per consignment of samples for organics or volatiles
* See also sections 4.5.3 and 5.4.3. ** A consignment is a group of samples transported to the laboratory at the same time.
Blind replicate samples
A blind replicate sample, also referred to as a field duplicate or replicate, involves collecting two separate (replicate) samples from a single sample location, storing in separate containers and submitting them for analysis to the laboratory as two separate samples. Samples should be given separate sample numbers and labelled so that the laboratory does not know the sample is a duplicate. The blind replicate can provide information on the overall variability or precision of both the sampling technique and the analytical laboratory. As a minimum, one blind replicate should be collected up to the first 10 samples, and an additional replicate taken for every 10 samples thereafter, although this will be dependent on the specific DQOs. The analytical results for the primary and replicate samples should be compared. A typical sampling DQO would be for a sample to be acceptable if the relative percent difference4
for blind replicates of less than 30–50% is achieved, depending on the analyte. The relative percent difference acceptance should be established at the outset of the investigation and included in the sampling plan along with the DQOs. Further information on interpreting replicate results is provided in section 5.8.
Split samples
Split samples are used to check on the analytical proficiency and provide information on the overall variability or precision of the analytical laboratory. Do not prepare split samples in the field. A split sample is prepared by requesting the primary laboratory to prepare a sample by thorough homogenisation and sending a portion to a second independent laboratory for analysis. The results from the second laboratory should not be reported back to the primary laboratory, but directly to the field investigator. Split samples are not used routinely during detailed or supplementary site investigations, and are more commonly used during site validation investigations, or when a problem is suspected with the analysis. Split samples are not applicable for volatiles. As a recommendation, one split sample should be collected up to the first 20 samples, and additional split samples collected for every 20 samples thereafter, although this will be dependent on the specific DQOs. A typical data quality objective would be for a sample to be acceptable if the relative percent difference for split samples is less than 30−50%, depending on the analyte.
4 Relative percent difference = (Result No. 1 – Result No. 2) x 100
Mean result
Contaminated Land Management Guidelines No. 5 31
Equipment rinsate blank samples
An equipment rinsate blank is collected after equipment decontamination and is obtained by running deionised water through the sampling equipment and collecting the water. The blank is tested for any residual contamination, which assesses the potential for cross-contamination between samples as a result of poor decontamination procedures. Rinsate blanks for soil sampling are collected from equipment that comes in direct contact with the samples (eg, auger head, trowel), and where cross-contamination of samples is likely to affect the validity of the sampling and assessment process. The recommended practice is to collect one rinsate blank per day, per sampling technique/team, although again this is dependent on the site investigation DQOs. The sample should be analysed if there are indications of cross-contamination or field contamination.
Trip and field blank samples
Field blanks, in conjunction with trip blanks, are normally used when sampling volatile organics and undertaking baseline studies. Section 5.8 provides further information on interpreting field blank results. One trip blank and one field blank are typically collected per consignment of samples, depending on the DQOs. A consignment is a sample group (usually 20–30 samples) that is transported to the laboratory at the same time. Trip blanks are sample bottles filled with deionised water, and originate in the laboratory with the sample containers. They are kept with the soil samples, remain unopened in the field, and are returned to the laboratory. The trip blank is used to identify compounds that may have been introduced into the soil samples during transport or storage. Field blanks are sample bottles filled with deionised water in the field and kept open during the duration of the sampling, then returned with the soil samples to the laboratory. Analysis of the field blank is used to identify any compounds that may have been introduced to the sample during sample collection (eg, from air deposition or vapours).
3.10 Choice of analytes The choice of analytes must be consistent with the findings of the preliminary site inspection, the DQOs and any field investigation observations and measurements. Information on the current and historical activities at the site − in particular any known incidents, leaks or spills of chemicals − should provide the basis for determining the contaminants of interest. The conceptual site model for the site should be used to help determine where contaminants are likely to be in the soil profile. Contaminated Land Management Guideline Schedule B (Ministry for the Environment, 2004b) identifies contaminants commonly associated with certain activities or industrial processes. The analytical techniques available for soil samples range from broad-screening techniques, to detailed analysis for individual parameters. The choice of analytical method will be determined by the DQOs. Discuss analysis requirements with the laboratory to ensure the detection limits for the tests requested will be appropriate for the purposes of the investigation. Typically, when comparing results to guideline values, the detection limit should be at least 1/10th of the guideline value,
32 Contaminated Land Management Guidelines No. 5
and detection limits must always be below the guideline. Further guidance on method detection limits is provided in Appendix F. The choice of analytes will influence the amount of sample to be collected, and appropriate sample containers and preservation requirements must be decided before the investigation commences. For volatile soil analyses, the main preservation requirements are keeping samples chilled and out of direct sunlight.
3.11 Health, safety and environmental considerations
Health, safety and environmental considerations are an important part of any contaminated site investigation, because there are risks including toxic effects, physical injury and harm to workers and the environment which must be assessed and managed. Occupational Health and Safety requirements for fieldwork are covered under the Health and Safety in Employment Act 1992 (as amended), which places an emphasis on employees at work to take responsibility for the wellbeing of themselves and others at work. In addition, Section 17 of the Resource Management Act 1991 places a duty on each person to avoid, remedy or mitigate any adverse effect on the environment arising from an activity. Refer to the relevant legislation, documents and approved codes of practices. A list of commonly used material is included in the References and Additional Information sections. A health, safety and environment plan (HSEP) should be prepared as part of the planning for site work. This should identify all potential hazards and steps that should be taken to eliminate, isolate or minimise these hazards. The site HSEP is used to inform workers of potential physical and chemical hazards, health and safety responsibilities, normal work precautions, monitoring requirements, and action levels and emergency provisions. A job safety analysis is a recommended method to document the different tasks undertaken as part of the site investigation. Site-specific training needs should also be identified to ensure all site workers know how to carry out the work safely. Table 5 is a checklist for identifying the hazards encountered during a site investigation. These can be categorised as: • chemical, biological and radiological hazards • physical hazards • environmental hazards. An example table of contents for an HSEP and an example of a job safety analysis form within an HSEP are included in Appendix A.
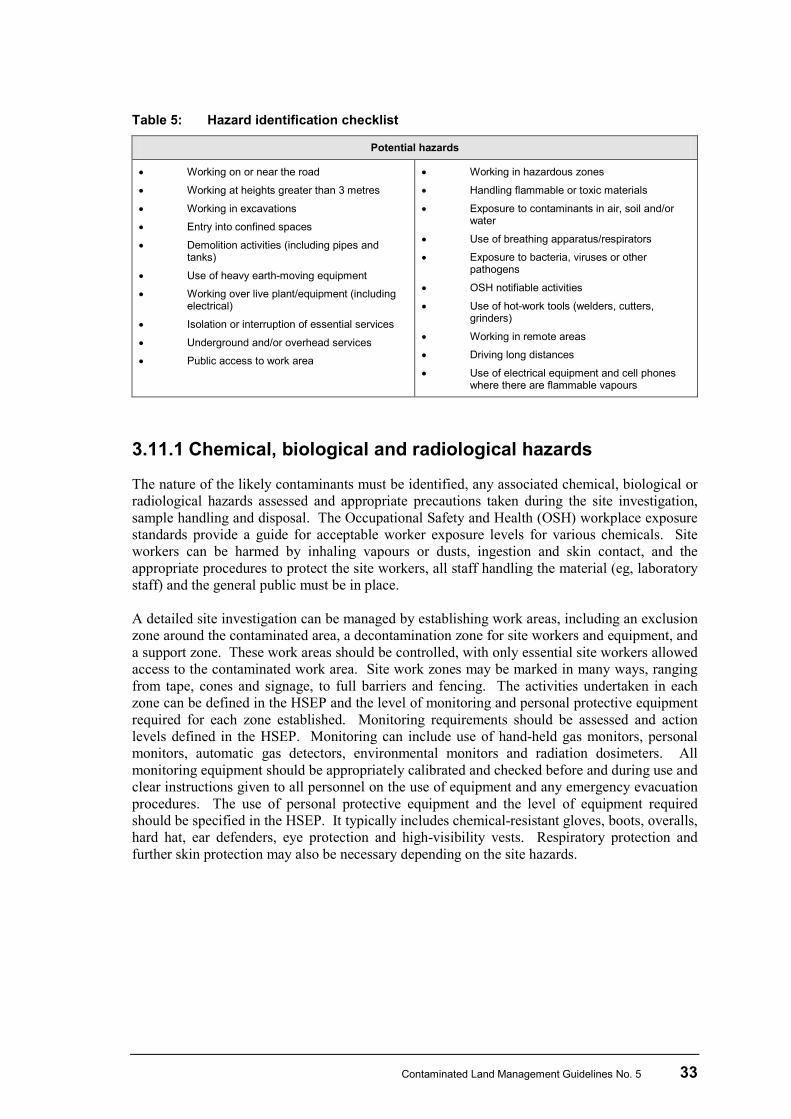
Contaminated Land Management Guidelines No. 5 33
Table 5: Hazard identification checklist
Potential hazards
• Working on or near the road
• Working at heights greater than 3 metres
• Working in excavations
• Entry into confined spaces
• Demolition activities (including pipes and tanks)
• Use of heavy earth-moving equipment
• Working over live plant/equipment (including electrical)
• Isolation or interruption of essential services
• Underground and/or overhead services
• Public access to work area
• Working in hazardous zones
• Handling flammable or toxic materials
• Exposure to contaminants in air, soil and/or water
• Use of breathing apparatus/respirators
• Exposure to bacteria, viruses or other pathogens
• OSH notifiable activities
• Use of hot-work tools (welders, cutters, grinders)
• Working in remote areas
• Driving long distances
• Use of electrical equipment and cell phones where there are flammable vapours
3.11.1 Chemical, biological and radiological hazards
The nature of the likely contaminants must be identified, any associated chemical, biological or radiological hazards assessed and appropriate precautions taken during the site investigation, sample handling and disposal. The Occupational Safety and Health (OSH) workplace exposure standards provide a guide for acceptable worker exposure levels for various chemicals. Site workers can be harmed by inhaling vapours or dusts, ingestion and skin contact, and the appropriate procedures to protect the site workers, all staff handling the material (eg, laboratory staff) and the general public must be in place. A detailed site investigation can be managed by establishing work areas, including an exclusion zone around the contaminated area, a decontamination zone for site workers and equipment, and a support zone. These work areas should be controlled, with only essential site workers allowed access to the contaminated work area. Site work zones may be marked in many ways, ranging from tape, cones and signage, to full barriers and fencing. The activities undertaken in each zone can be defined in the HSEP and the level of monitoring and personal protective equipment required for each zone established. Monitoring requirements should be assessed and action levels defined in the HSEP. Monitoring can include use of hand-held gas monitors, personal monitors, automatic gas detectors, environmental monitors and radiation dosimeters. All monitoring equipment should be appropriately calibrated and checked before and during use and clear instructions given to all personnel on the use of equipment and any emergency evacuation procedures. The use of personal protective equipment and the level of equipment required should be specified in the HSEP. It typically includes chemical-resistant gloves, boots, overalls, hard hat, ear defenders, eye protection and high-visibility vests. Respiratory protection and further skin protection may also be necessary depending on the site hazards.
34 Contaminated Land Management Guidelines No. 5
3.11.2 Physical hazards
The physical hazards at a site should be assessed and can include the following.
Underground and above-ground services
The presence of underground and above-ground services can pose a hazard during contaminated site investigations. Underground services, including electricity and gas, present a very serious and potentially fatal hazard if damaged. Above-ground power lines can cause electrical shocks through contact and arcing with conductors (eg, a drill rig or surveyor’s pole). Procedures must be in place to identify and manage these hazards, including marking out no-go areas within the minimum clearance distances from overhead power lines and obtaining information on the location of underground services from service plans from site owners, occupiers and utility companies, tracing out the location of the underground services using detection equipment, and hand-digging to a depth that should be clear of the services.
Deep excavations
Excavations deeper than 1.5 m are considered a confined space, and should not be entered. Appropriate training of personnel is required for confined space entry, and excavations should then be appropriately battered or shored. There are hazards associated with slips, trips and falls into pits, and they should never be left unguarded. There is the potential for gases to be released from open pits and gases can accumulate in trenches. All pits and bores should be backfilled and capped or appropriately fenced and labelled. The reinstatement of pits should be done in an appropriate manner, as outlined in section 3.6.3.
Using machinery
Hazards associated with using machinery and equipment include the use of equipment on soft, sloping or unstable ground, vibrations, noise generation, restricted vision during moving operations (lifting, reversing, swing), rotating equipment on drill rigs, bursting hoses, and equipment breakage. All equipment should be operated by appropriately trained operatives and should be inspected and maintained in safe working order. Any fieldwork around machinery should be undertaken with clear communication signals agreed between the machine operator and the field investigator on sampling and emergency procedures.
Dust and odour
Dust and odour are potentially hazardous to site workers through contaminant exposure and can pose a hazard to the occupiers of surrounding land. Procedures to minimise dust include restricting certain activities on the site during dry and windy conditions, damping down the work area, limitations to vehicle access, speed control measures, and installing windbreaks.
Contaminated Land Management Guidelines No. 5 35
3.11.3 Environmental hazards
Any hazards to the environment posed by the contaminants, or by disturbance of the contaminants by the nature of the works should be assessed. Environmental risks include damaging rare habitats or endangered species, creating contamination pathways to groundwater, introducing contaminants into previously uncontaminated strata, uncontrolled run-off water, and inappropriate disposal of waste spoil. Potential environmental hazards such as animal bites, insect stings, sunburn, heat and cold stress should be considered. Procedures to manage environmental hazards should be identified as part of the planning for the site investigation works, and appropriate consents obtained before undertaking the works.
Groundwater protection
If groundwater is assessed to be sensitive in the preliminary site study, then steps must be taken to protect it during the works if there is potential for disturbance of the ground to affect groundwater quality. Steps to avoid contaminating groundwater include the use of appropriate bore construction techniques to isolate aquifers when drilling, and restricting the depth of excavations if contaminants are present at or near the water table, or are likely to be mobilised as a result of the intrusive investigations.
Soil protection
Take care to avoid spreading contamination into previously uncontaminated areas of the site. Controls on the movement of equipment and vehicles from contaminated to uncontaminated areas should be in place. During excavation works, contaminated spoil material should be handled appropriately. Remove contaminated spoil for off-site treatment and/or disposal. If returned to the ground (eg, when backfilling a test pit), the spoil should be returned to the pit in the order in which it was excavated (see section 3.6.3).
Habitat protection
Take special care when undertaking works in areas where plants and animals are protected. Identify the effects of the site activity and undertake appropriate measures to minimise any adverse effects. Measures could include timing the schedule of the works at certain times (eg, not during breeding season), using investigation techniques with minimal disturbance (eg, hand auger rather than machine-dug test pits), and relocating sampling locations to areas with less impact on habitat.
3.11.4 Waste handling
Investigations on sites where hazardous substances are present can lead to the production of range of wastes, including: • wash water and solid residues from decontamination procedures • waste gloves, cloths and plastic sheeting from handling and cleaning tools • excess excavated soil from sampling locations.
36 Contaminated Land Management Guidelines No. 5
Each of these wastes could be contaminated and must be handled so as to minimise the risks associated with the hazardous substances. Take care to prevent contamination from spreading onto neighbouring properties or roads. Contaminated wastewaters may be disposed of via the site wastewater treatment system, if available, subject to the necessary approvals. Waste spoil and contaminated field-sampling equipment such as gloves, overalls and plastic sheeting are usually stored temporarily, before off-site treatment or disposal. Store the waste securely in a labelled container (eg, a drum or skip), and review and assess the results of the analysis to determine the waste classification (hazardous or non-hazardous). Consult the New Zealand Waste List (L-Code) to determine if the waste is listed as hazardous, or assess the material to determine if it contains hazardous substances, characteristics or generates hazardous leachate. Examples of hazardous characteristics include flammability, toxicity and corrosiveness. Thresholds for hazard characteristics are provided in the User Guide to the HSNO Thresholds and Classification (2001). Guidance on identifying hazardous waste is available from the Ministry for the Environment website (www.mfe.govt.nz). Once classified, the waste material should be treated and disposed of in accordance with the local treatment or disposal facility consent conditions. It may require stabilisation or treatment if the concentrations in the waste exceed landfill waste acceptance criteria. Guidelines for the management of hazardous wastes require appropriate records on hazardous waste management to be kept, including the type and quantity of waste generated, transported and disposed of. If hazardous waste is stored, treated or disposed of on-site, then records must also be kept for future reference.
Contaminated Land Management Guidelines No. 5 37
4 Laboratory Analysis
4.1 Selecting a laboratory Analytical laboratories must be selected on the basis of their experience and ability to carry out the selected analyses to the required standard. This suitability can be verified in a number of ways including:
• accreditation by bodies such as IANZ5 or NATA6 to NZS/ISO/IEC7
• an audit of the laboratory, or by reviewing the results of external auditing by some other party
Guide 17025
• past experience of the type of work undertaken at the laboratory
• participation by the laboratory in inter-laboratory comparison programmes. Accreditation by an independent third-party auditing body such as IANZ or NATA provides formal recognition that the laboratory meets the minimum standards of Guide 17025. To achieve accreditation a laboratory must prove that they have suitable technical expertise, facilities, instrumentation and quality management systems in place to carry out the testing involved. Documentation of staff training, test methods, quality procedures, equipment calibration and maintenance, document control, response to laboratory client queries, corrective and preventive actions, and ongoing auditing are required. Personnel from both the auditing agency and independent technical assessors carry out the audit leading to accreditation. Note that a laboratory’s being accredited does not imply that all test methods used in the laboratory are accredited. To achieve accreditation for an individual test method the laboratory must demonstrate to an independent technical assessor that they have a documented test method procedure, have validated the method (see section 4.5.2), have suitable equipment, and have staff with the knowledge, experience and competence to carry out the test as documented. The laboratory must also be using the test method on a regular basis, and for this reason some rarely used methods may not be specifically accredited.
4.2 Sample handling 4.2.1 Planning
Effective site investigations require planning, and the analytical test requirements should be discussed with the laboratory before you do any sample collection. This discussion with the laboratory should cover: • the matrices to be sampled • required analytes • analysis method
5 International Accreditation New Zealand. 6 National Association of Testing Authorities, Australia. 7 New Zealand Standard / International Organisation for Standardisation / International Electrotechnical Commission.
38 Contaminated Land Management Guidelines No. 5
• method detection limits (MDL), or practical quantitation limits (PQL) • sample collection containers • preservation requirements • storage and transport conditions • provision of trip blanks • required turnaround for results (a non-routine ‘priority’ turnaround may need special
organisation with the laboratory) • compositing of samples • dealing with non-homogeneous samples • sample retention after testing.
4.2.2 Documentation
The chain of custody form (see Section 3.7.5 and Appendix E) must accompany samples to the laboratory. It details the links in the transfer of samples from collection to arrival. The chain of custody must contain at least the following information: • time and date the samples are collected • name of person transferring the samples • time and date the samples are received at the laboratory • name of person receiving the samples • name and contact details of who to report to • urgency of analysis (routine or priority turnaround) • consignment identifier or job reference. For each sample there must be a record of: • unique identifier (which must match those on the containers) • matrix (eg, soil) • the tests required, with minimum detection limit (DL)/PQL • whether specific test methods are required (these should be discussed with the laboratory
beforehand). Other useful information you can supply to the laboratory includes:
• how the laboratory results are to be reported (eg, any combination of hard copy, fax, phone, electronic)
• an indication of possible levels of contaminants in the sample, especially if high (this is very useful for the laboratory, because high levels of analytes may contaminate laboratory equipment, cause cross-contamination of other samples, and require re-analysis using smaller sample amounts, or dilutions, which slows turnaround)
• a laboratory quote or reference number if required for pre-arranged work
• the name, address and contact details of another laboratory if split samples are to be forwarded for analysis and reported/invoiced direct to the person submitting the samples.
Contaminated Land Management Guidelines No. 5 39
4.2.3 Receipt at the laboratory
Each consignment of samples should be given a unique identification reference by the laboratory, and each sample in the consignment should also be individually identifiable. All samples must be able to be tracked through every stage of analysis in the laboratory. Upon receipt at the laboratory, all samples should be unpacked, checked against the chain of custody and placed in appropriate storage as soon as possible. The chain of custody should be completed with the date and time of receipt, laboratory identifier, the name of the laboratory representative responsible for the samples, and any comments if necessary (eg, names on chain of custody not matching those on the containers, containers missing or broken, sample temperature or temperature of the sample container). The completed chain of custody should be faxed to the indicated contact person to confirm sample receipt.
4.2.4 Sample holding times
Recommended sample containers and guideline sample holding times before analysis are given in Appendix D. Holding times are not standards and are useful for reference only, as times may vary depending on the particular sample matrix. Once a sample has been collected, the nature of the analytes present may change as the result of: • loss by volatilisation • degradation by exposure to light • degradation be exposure to oxygen or other chemicals • degradation by living organisms. The rate of sample degradation or loss will depend on the analyte, matrix and other factors present (eg, oxygen, light, soil microbes, moisture, temperature), and the site conditions. These changes can be minimised by collecting samples in appropriate containers, using preservatives (if appropriate), keeping samples chilled, cold or frozen and undertaking analysis as soon as possible. Sample preservation methods should be documented.
Example: The recommended holding time before extraction of polycyclic aromatic hydrocarbons (PAHs) is 14 days, although there is unlikely to be any significant change in PAH concentrations after sampling where contamination occurred several years ago, even over a period of several months. However, PAHs collected from a deep excavation, where the environment was anoxic, may undergo rapid changes on exposure to light and oxygen.
Guideline holding times before analysis should be taken into consideration when setting the DQOs, and should take account of: • required turnaround • regulatory (legal) requirements • location and transport considerations • number of samples and laboratory capacity.
40 Contaminated Land Management Guidelines No. 5
4.2.5 Sample retention after analysis
Samples can be retained at the laboratory for a length of time after the tests have been carried out in case further tests are requested or there are queries regarding the results. The time for which samples are held will depend on the analysis (eg, microbiology samples would not be retained, while samples for metals can be stored almost indefinitely), matrix, storage conditions and space considerations. Any special requirements should be discussed with the laboratory in advance. The nature of the analytes and possible loss/degradation should be taken into consideration when requesting further analyses from retained samples.
4.3 Hazardous samples It should be standard practice for laboratories to treat all samples as ‘potentially hazardous’ and to use appropriate protective clothing, such as laboratory coats, gloves and safety glasses, as required. The site investigation health, safety and environment plan (HSEP) should identify any chemical, biological or radiation hazards and the laboratory should be informed of these (see section 3.11.1). Samples known to be particularly hazardous should be clearly identified on the container and may need special packaging and transport to the laboratory. An example would be free hydrocarbon product being sent for identification. Transportation of these samples requires consideration of the Land Transport Act. Laboratories should have a procedure in place for identifying, labelling, storing and disposing of hazardous samples and waste. Any hazardous samples and hazardous waste generated by the laboratory analysis should be stored in a dedicated area and removed by hazardous waste contractors. In some situations this may include returning the samples to the waste generator for disposal/treatment with the other material on site.
4.4 Sample preparation methods 4.4.1 Non-homogeneous samples
All soil samples received at a laboratory should be treated as inhomogeneous and should be homogenised before a sub-sample is removed for analysis, although (as outlined in section 4.4.3) this must not be done in a manner to cause loss of analytes. Samples for volatile analyses must remain as undisturbed as possible. Homogenisation is the process by which a sample is mixed to obtain consistency throughout the sample prior to analysis. Unrepresentative material such as twigs, leaves and stones are often removed by the laboratory, if requested to do so. Larger cobbles etc. may be removed in the field (see section 2.3.2). The particle size of the sample is often reduced to ensure uniformity of the sample, and this can be done by crushing and grinding. Certain soils samples such as fill material, clays, shingly soils and very oily soils can be difficult to mix and may require special treatment. The method for dealing with non-homogeneous
Contaminated Land Management Guidelines No. 5 41
samples should be discussed with the laboratory ahead of sample receipt at the laboratory. The options for dealing with non-homogeneous samples will depend on the DQOs. Practices that can be used by the laboratory to deal with inhomogeneity include the following.
• Sieve the sample using a 2 mm sieve, and record the proportion of the fractions separated. Analyse the sub-2 mm fraction.
• Reduce the particle size by crushing and grinding to pulverise the sample so that the whole sample is included in the analysis.
• Sub-sample (see section 4.4.2) by separating the material of interest and analyse (eg, visible hydrocarbon contamination coating gravels). The free-phase hydrocarbons can be separated analysed for product identification and a visual estimate of the amount of free phase given.
In the first instance the sub-2 mm fraction may make up only a very small portion of the whole sample (by weight or by volume) and this will bias high the results if they are applied to the original sample. To overcome this, the proportion of the under and over 2 mm fractions will need to be determined so a correction factor can be applied. The second approach will give a more correct value for the overall sample, assuming the analytes are stable to the grinding process, but may not reflect the DQOs requirements.
4.4.2 Sub-sampling in the laboratory
Sub-sampling in the laboratory is necessary to reduce the sample size for analysis. Containers of up to 1 kg are typically supplied to the laboratory for analysis and a number of analyses are usually carried out from the sample, but only a few grams of material are used for individual analyses. The sub-sampling procedure must be carried out after the sample has been homogenised by the laboratory, and must be undertaken in an unbiased manner to ensure that the sub-sample is truly representative of the original sample. It is essential that the sub-sampling procedure does not alter the overall nature of the sample, or cause loss of target analytes for any reason. The method of sub-sampling will depend on both the analytes to be determined, and the sample. Methods of sub-sampling include the following.
• Long-pile method – the sample is laid out in a long pile during the unloading process, the pile is separated into two equal piles by using a shovel and placing alternate shovel loads to either side to form two mounds. Then one mound is randomly selected and the process continued to reduce the sample size.
• Cone and quarter method – the sample is piled into a cone shape with a flattened top, and the cone divided into quarters. The opposite quarters are discarded and the remaining quarters mixed together to form a second cone. The process is repeated until the desired sample size is reached
• Riffle methods – a riffle is a trough divided into a number of compartments, with doors that open on alternate sides. On each pass through the riffle, soil samples are separated and the sample size is halved.
42 Contaminated Land Management Guidelines No. 5
Sub-samples for analysis of volatiles (volatile organic compounds, BTEX8
and total petroleum hydrocarbons) should be taken using a technique such as coring, which minimises losses and gives a reasonably representative sub-sample.
Example of sample preparation: if only metals and non-volatile organics (eg, PCBs) are to be determined, the sample may be spread out on a tray, thoroughly mixed, quartered, and opposite quarters returned to the original container for retention as ‘field moist’ samples. The rest of the sample is air dried at 35°C overnight before lightly grinding in a mortar and pestle and passing through a 2 mm sieve. The dried, sieved sample is then further sub-sampled as part of the analytical procedure (eg, only 0.5–1.0 g is used for metals analysis).
4.4.3 Compositing
Compositing in the laboratory involves mixing together equal quantities of individual samples to make one composite sample for analysis. This is often done to enable more cost-effective investigations to be undertaken. (Further details on the collection of samples for compositing are provided in section 3.6.4.) Samples for analysis of volatile and semi volatile constituents such as polycyclic aromatic hydrocarbons and total petroleum hydrocarbons must not be composited owing to the potential for the loss of volatiles, leading to under-reporting of the concentrations in the sample. All samples should be thoroughly homogenised before compositing; for example, by spreading on a tray, mixing, quartering, returning opposite quarters to the original container and using the remaining quarters in the composite. Homogenising and compositing of individual samples must not compromise the integrity of the target analytes. The remaining homogenised constituent samples should be retained so they can be reanalysed separately at a later date if further individual analysis is required.
4.5 Analytical methods 4.5.1 Selecting an analytical method
Analytical methods must meet the requirements of the DQOs. Factors to consider when selecting a method include:
• the required detection limits (eg, screening methods for initial investigations, specific methods to trace levels for final clean-up validation)
• the required turnaround time for results − lower detection limits usually require more work in the laboratory, which takes more time
• cost
• the required technique (eg, is the extraction method appropriate for comparison with the guidelines?).
8 Benzene, toluene, ethylbenzene and xylene(s).
Contaminated Land Management Guidelines No. 5 43
There is almost always a trade-off between turnaround, detection limit and cost. A number of different common instrumental methods can be used for analysing substances in soils, and methods for metals and organics are summarised in Appendix G. Screening test methods are generally less rigorous than ‘reference’ procedures. They may be suitable for monitoring the progress of a site remediation, although the precision may not be acceptable for a site validation. Any method can be used provided the laboratory has validated the method for the analytes and matrix under investigation. In practice, most laboratories base their methods on a standard from a body such as US EPA, ASTM9 or APHA/AWWA/WEF.10
www.epa.gov/region01/oarm/testmeth.pdf
Further guidance on obtaining copies of US EPA methods is available on the US EPA website ( ). An individual laboratory may modify the method to use different equipment or new innovations. Any modification must be fully validated by the laboratory. This allows the introduction of methods using new technology or different techniques, provided the method is fully validated first. Validation data must be available on request.
4.5.2 Validating analytical methods
The laboratory should be able to provide a validation report for any methods used. This must include: • specificity for the compounds being analysed • analytical range • recovery efficiency from the matrix • method detection limit (the level of quantification can then be calculated, as outlined in
Appendix F) • precision, both within batch and between batches. Where possible the validation report should include: • results of inter-laboratory comparison programmes • results for certified reference materials, if these are available • stability of the analytes in the matrix • stability of the analytes in any extract/digest • comparison with other methods for the same analyte. The validation report should also include acceptable ranges for laboratory QC analyses such as blanks, spikes, replicates and QC samples.
9 American Society for Testing and Materials. 10 American Public Health Association, American Water Works Association, Water Environment Federation.
44 Contaminated Land Management Guidelines No. 5
4.5.3 Inter-laboratory comparison programmes and certified reference materials
Laboratories should validate the analytical methods against appropriate certified reference materials, where available. Certified reference materials are not available for all analytes and are normally used as part of a method validation (due to expense), rather than as part of the routine laboratory QC samples. Inter-laboratory comparison programmes can be used to demonstrate the ability of a laboratory to undertake analyses on specific sample matrices, and performance results in the programmes can also be used in method validation. Ongoing participation and monitoring of the results of comparison programme performances should form part of a laboratory QA programme.
4.5.4 Metals and metalloids
The choice of analytes and metallic elements of interest will be dependent on the site history, and previous and proposed land uses (see section 2.2.1). In general, low levels of trace metals occur naturally in the environment, but elevated concentrations of metals may indicate land where hazardous materials have been used. The metallic parameters that are toxic and harmful to human health and that are commonly analysed in soil include arsenic, boron, cadmium, chromium, copper, mercury, nickel, lead and zinc. This group, with the exclusion of boron, are commonly referred to as ‘heavy metals’, although arsenic is not strictly a metal but a metalloid. For specific sites, other metals (eg, silver) or metalloids (eg, antimony) may be of interest, depending on the activities undertaken at the site. Metals in soils are present in a number of different forms, including soluble ions and complexes, metal hydroxides, sulphides, precipitates, and insoluble complexes. The soils can be analysed for total metals or extractable metals, and must first be dried to ensure the results can be presented on a weight per weight (often mg/kg dry weight) basis. The extraction method used will determine the fraction of the metals analysed. If required by the nature of the site, speciation of metals such as chromium VI or arsenic III may be requested. These require specific test methods and cannot be analysed from the total recoverable digest described below. For detailed site investigations the most common fraction to analyse (US EPA) is total recoverable metals, being the fraction of the metals that is likely to be extracted or leached from the sample under normal environmental conditions, not the total material bound to the soil silicate matrix. Preparing the sample involves drying and grinding the sample, passing it through a 2 mm sieve to produce a homogeneous sample, and then taking a sub-sample of the soil material for digestion. US EPA Method 200.2 for total recoverable metals involves digestion in nitric and hydrochloric acids. This digestion method does not totally destroy the silica matrix and does not fully extract strongly interstitially held metals, but represents the readily extractable fraction of the metals present. Analysis of the digest, using matrix-matched standards for calibration, can be carried out by any suitably validated instrumental technique (see Appendix G). If required, total metals can be determined using x-ray fluorescence spectroscopy, and field instrumentation is available for this purpose (see section 3.5), or by carrying out a hydrofluoric/aqua regia digestion before instrumental analysis (see Appendix G).
Contaminated Land Management Guidelines No. 5 45
4.5.5 Semi-volatile organic compounds (SVOCs)
Analytical techniques for organic compounds follow the general steps of preparing the sample, extracting the compounds of interest from the soil matrix, clean-up, and analysis of the extract. A separate sub-sample is dried and the moisture content determined, and results are corrected to mg/kg dry weight. Semi-volatile organic compounds (SVOCs) are compounds which are extractable into a non-polar solvent (eg, hexane, dichloromethane or supercritical carbon dioxide) and are thermally stable under the conditions of analysis (usually GC-MS, vaporisation at about 320°C, temperature programme from around 50°C to 350°C). The extraction may be modified by extracting at high pH (the ‘base-neutral extractables’) and again at low pH (the ‘acid extractables’). These extracts may then be combined to give the base-neutral and acid extractables, sometimes referred to as BNA analysis but referred to as SVOC in New Zealand. Analysis for SVOC is usually undertaken as a screening test for soil investigations. A very large number of compounds fall within this definition, including organochlorine pesticides, other pesticides, polycyclic aromatic hydrocarbons, phthalates, phenols, some hydrocarbons, polychlorinated biphenyls (PCBs) and industrial chemicals. The SVOC screen method should be calibrated for a number of these compounds (typically 80 or more), which are determined by specific testing requirements, availability of standard mixes and practicality. The calibrated compounds are selected from the extensive lists given in the US EPA method SW-846, which covers the main toxic compounds in solid waste. Non-calibrated compounds, with semi-quantitative data, may also be reported by identifying peaks in the chromatogram by comparison with database library mass spectra (a library search report). Note that large concentrations of any one compound (or compounds), especially hydrocarbons, will result in higher than normal detection limits being reported. Analytical methods are also available to analyse specific SVOC compounds, including the organochlorine pesticides, PCB congeners, polycyclic aromatic hydrocarbons and dioxins. The analysis is undertaken on the specific groups if the target parameters are known. The advantages of using specific organic analyses, as opposed to the SVOC screen method, are that the method provides lower detection limits, suffers from less interference, and is more accurate than a screen analysis. The disadvantages of using specific tests are the time and costs for analysis compared to the screening method.
4.5.6 Total petroleum hydrocarbons (TPHs)
The total petroleum hydrocarbon (TPH) test is a non-specific test based on extracting compounds from the soil matrix into an organic solvent, and measuring the concentration of compounds dissolved in the solvent, usually using a gas chromatography flame ionisation detector. It is a very useful test for site investigations, and the shape of the chromatogram can be used to help identify the type of contamination present. The TPH test will determine all compounds that are soluble in the solvent, including petroleum hydrocarbon as well as other organic compounds. The TPH analysis is a misnomer when applied to sites where hazardous substances are present, as the results could also include many compounds that are not petroleum related, such as naturally occurring compounds (eg, terpenes) or other industrial chemicals (eg, solvents).
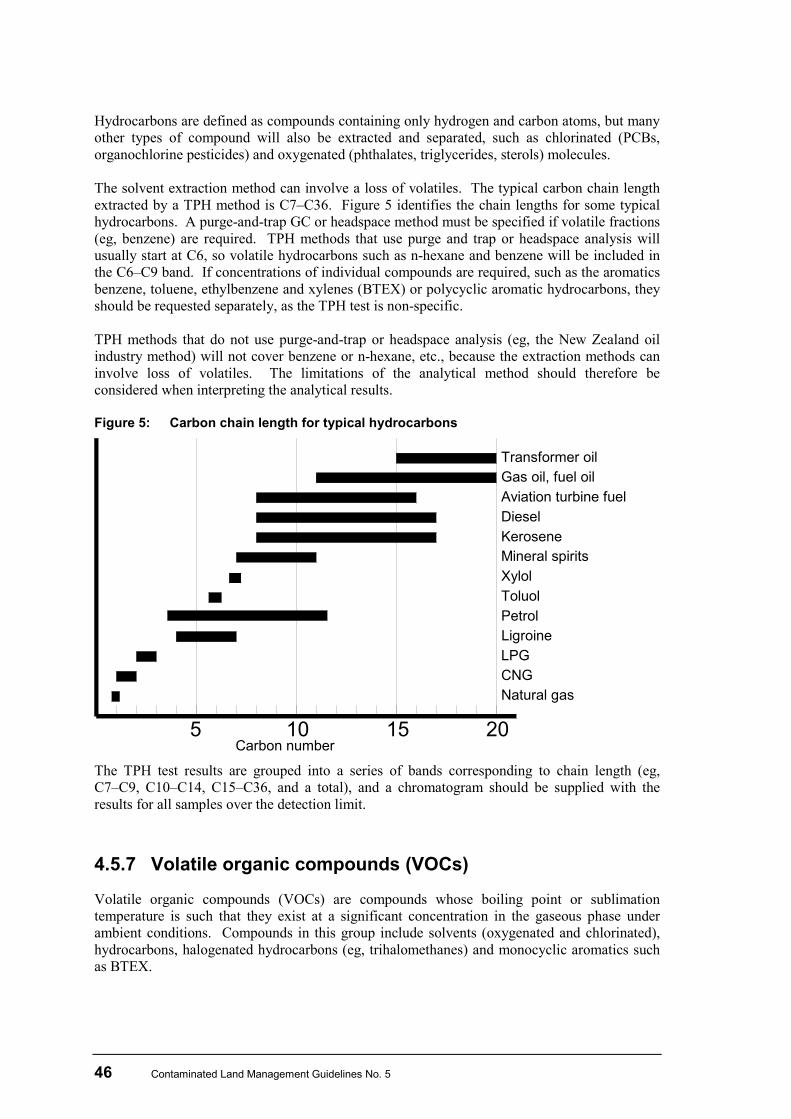
46 Contaminated Land Management Guidelines No. 5
Hydrocarbons are defined as compounds containing only hydrogen and carbon atoms, but many other types of compound will also be extracted and separated, such as chlorinated (PCBs, organochlorine pesticides) and oxygenated (phthalates, triglycerides, sterols) molecules. The solvent extraction method can involve a loss of volatiles. The typical carbon chain length extracted by a TPH method is C7–C36. Figure 5 identifies the chain lengths for some typical hydrocarbons. A purge-and-trap GC or headspace method must be specified if volatile fractions (eg, benzene) are required. TPH methods that use purge and trap or headspace analysis will usually start at C6, so volatile hydrocarbons such as n-hexane and benzene will be included in the C6–C9 band. If concentrations of individual compounds are required, such as the aromatics benzene, toluene, ethylbenzene and xylenes (BTEX) or polycyclic aromatic hydrocarbons, they should be requested separately, as the TPH test is non-specific. TPH methods that do not use purge-and-trap or headspace analysis (eg, the New Zealand oil industry method) will not cover benzene or n-hexane, etc., because the extraction methods can involve loss of volatiles. The limitations of the analytical method should therefore be considered when interpreting the analytical results. Figure 5: Carbon chain length for typical hydrocarbons
Carbon number5 10
Diesel
Mineral spirits
Natural gas
15 20
Toluol
LPG
Petrol
CNG
Xylol
Kerosene
Aviation turbine fuelGas oil, fuel oilTransformer oil
Ligroine
The TPH test results are grouped into a series of bands corresponding to chain length (eg, C7–C9, C10–C14, C15–C36, and a total), and a chromatogram should be supplied with the results for all samples over the detection limit.
4.5.7 Volatile organic compounds (VOCs)
Volatile organic compounds (VOCs) are compounds whose boiling point or sublimation temperature is such that they exist at a significant concentration in the gaseous phase under ambient conditions. Compounds in this group include solvents (oxygenated and chlorinated), hydrocarbons, halogenated hydrocarbons (eg, trihalomethanes) and monocyclic aromatics such as BTEX.
Contaminated Land Management Guidelines No. 5 47
Analysis for VOCs is used as a screening test, and the method should be calibrated for a number of these compounds determined by the specific testing requirements, availability of standard mixes and practicality. The calibrated compounds are usually selected from the extensive lists given in the US EPA methods and will cover the main toxic compounds. Non-calibrated compounds, with semi-quantitative data, may also be reported by identifying peaks in the chromatogram by comparison with database library mass spectra (a library search report). Note that large concentrations of any one compound (or compounds), especially hydrocarbons, will result in higher than normal detection limits being reported. Volatile hydrocarbons, except for the monocyclic aromatic hydrocarbons (eg, BTEX and the trimethylbenzenes), are not usually included in VOC analysis.
VOCs in soil samples
The soil sample should be sub-sampled as soon as possible after receipt in the laboratory. This should be carried out while the sample is cool or cold, and is preferably done by using a cork borer to take the sub-sample, which is immediately transferred to a pre-weighed extraction vial containing methanol. The sample weight is determined and the volatile compounds extracted into the methanol using tumbling or ultrasonic extraction. The methanol extract can then be analysed using headspace or purge-and-trap gas chromatography − mass spectrometry (GC−MS) (see Appendix G).
Benzene, toluene, ethylbenzene and xylenes (BTEX) in soil samples
BTEX are a sub-set of the VOCs, so they are generally analysed using the same GC–MS method, with only the BTEX compounds reported. A simpler technique using GC with a photo-ionisation detector may also be used. The GC–MS method gives the certainty of absolute compound identification and should be used if complicated hydrocarbon matrices are anticipated.
4.5.8 Soil leaching procedure
Analytical tests to determine the leaching characteristics of soils are used to determine the potential for contaminants to mobilise from the soil phase to the water phase. A leaching test is a procedure in which soil contaminants are extracted into a liquid phase, and the resultant extract − the leachate − can be analysed for the parameters of interest. Two types of leaching tests commonly used are:
• toxicity characteristic leaching procedure, which is the US EPA Method 1311 used for evaluating whether a waste material is hazardous or non-hazardous under municipal landfill conditions
• synthetic precipitation leaching procedure, which is the US EPA Method 1312 designed to mimic the effect of acidic rainfall on wastes and soils, and thus the possible leaching of contaminants into ground or surface waters. The extractant fluid used is generally water, but this must be specified, and operationally it is very similar to the toxicity characteristic procedure.
48 Contaminated Land Management Guidelines No. 5
The limitations of the leaching tests are that they cannot be used for all types of chemicals, and are generally used for metals and certain organic parameters. VOCs require a special type of extraction apparatus (a zero headspace extractor) in order to minimise loss of the volatile compounds during the extraction procedure, and the final filtering is done via the extractor under gas pressure. The extract is collected directly into a VOC vial ready for analysis. Complications associated with the procedure include problems with obtaining representative samples (particularly for waste material), and maintaining the exacting conditions during the extraction, giving rise to poor precision in inter-laboratory comparisons.
4.5.9 Other tests not specifically covered
Other tests may be required, depending on the activities that have been carried out at the site under investigation. The principles of proper method validation and quality control procedures should apply when selecting a suitable laboratory to undertake the analyses.
4.6 Laboratory QA/QC Laboratories selected for analysis should be accredited and so must be able to demonstrate the procedures and checks in place to ensure accurate testing and reporting of analyses. As a minimum, every batch of analyses should include: • calibrating standards • a laboratory ‘blank’ • replicates, at an appropriate frequency (usually 1:10 or 1:20) − this is a test of both
sample homogeneity and laboratory precision. Where possible, every batch of analyses should include:
• ‘spiked’ samples − these are difficult to prepare in such a way that the spike is in the same form as in the native soil, because an analyte added to a soil sample will be adsorbed on the outside of the soil particles, but in the soil itself the analyte may be right throughout the particles
• laboratory QC samples − for soils these are usually well-homogenised samples, which the laboratory has analysed many times to determine mean and standard deviation for the analytes.
It is not possible to prepare stable QC samples for some analytes, such as VOCs. Only data that have passed the internal laboratory QC tests will be valid for reporting from the laboratory. If the laboratory has a ‘QC failure’ − such as duplicates not matching within the limits determined in the validation report, contaminated blanks, or poor spike or surrogate recoveries − then the analysis must not be approved for reporting and the whole batch will need to be repeated. Occasionally, the analyst may decide that there is an obvious valid reason for the failure (most commonly matrix interference), and the data would be reported with appropriate comments.
Contaminated Land Management Guidelines No. 5 49
For this reason, any laboratory QC data that are reported to the client should always fall within the acceptable limits as determined during method validation, so a laboratory QC report can prove that the laboratory has, in fact, carried out the QC work. An example of typical QC data and limits is given in Appendix H.
4.7 Data reporting The laboratory report should include the following information: • client company and contact name • batch identifier or job reference • date received. For each sample there should be:
• the sample identity, usually as written by the sampler on the container
• the result for each analyte, including specific definition (eg, ‘total copper’, not just ‘copper’); dry matter percentage should be requested separately if required, because it is not always determined as part of the test method (eg, testing for metals only does not need a dry matter percentage)
• appropriate units, which should be specific (eg, ‘mg/kg dry weight’ or ‘mg/kg as received’, not just ‘mg/kg’); specific comments should also be included if the sample received is not in the normal form of ‘field moist’ for soils (eg, ‘already dried and sieved’, ‘freeze-dried’, etc.)
• a description of the test method used, including any extraction/digestion procedure, and the source reference if appropriate
• the accreditation status of the method
• the method detection limit or level of quantification LOQ (some method detection limits may not be achievable in certain samples due to matrix interferences, or limited sample size).
Laboratory QA/QC data are used by the laboratory to ensure that results are acceptable for reporting. No results should be reported if the laboratory QA/QC does not meet the set criteria, unless a specific comment is added to the report. The field investigator should request to see the laboratory QA/QC criteria, and data must be made available on request, and provided if required as part of the results package. An indication of the uncertainty of measurement for each test result must be made available on request, and be provided if required as part of the results package.
50 Contaminated Land Management Guidelines No. 5
4.8 Uncertainty of measurement For every numerical result reported by a laboratory there will be an associated uncertainty. NZS/ISO/IEC 17025-1999 requires that a laboratory estimate the uncertainty of measurement in such a way that “the estimate is reasonable, must not give a wrong impression of the measurement and must take into account all sources of that uncertainty”. This uncertainty is due to a large number of factors including, but not restricted to: • sub-sampling variations • incomplete homogeneity of the sample • concentration of the analytes (instrument noise is relatively higher at low contaminant
concentrations) • purity of calibrating standards (there is no such thing as 100% pure) • inherent uncertainty in balances, volumetric glassware, etc. • uncertainty in visual estimations (eg, reading the meniscus in a burette) • variations in extractability of analytes • variations in instrument response • uncertainty in the final reading (eg, absorbance using a spectrophotometer, ‘counts’ in a
GC–MS). Precision (ie, repeatability) is only one component of the overall uncertainty in a measurement. All analytical results have an uncertainty. This may vary from a few percent for simple one- or two-step procedures, such as a weighing or titration, to 100% (or more) for a complex organic analytical analysis involving extraction, concentration, clean-up, derivatisation, concentration and chromatographic determination at close to detection limits. Knowledge of the measurement uncertainty is essential for interpreting the results against the DQOs.
Contaminated Land Management Guidelines No. 5 51
5 Basics of Data Interpretation
5.1 Data reporting An investigation report should be prepared in accordance with Contaminated Land Management Guidelines No. 1: Reporting on Contaminated Sites in New Zealand (Revised 2011) (Ministry for the Environment, 2001). Data generated during a site investigation should be collated and presented in a logical form to enable the information to be assessed. Data are generated at different stages of the investigation and include information collated from the desk research, site walkover study, field screening, field observations, chain of custody documentation and analytical results. Data from the site history research − which may include old site layout plans, photographs, material safety data sheets and permits − should be included in the report. Analytical data should be tabulated using the appropriate number of significant figures, and laboratory certificates of analysis must be appended. Analytical results can be presented on a site plan to indicate sample locations, numbers and depths for different concentration ranges in different colours. Concentration contours for specific sample depths can be useful to show plumes, but use these with caution in areas where a small number of sample locations are used and they may be misleading. Uncertainty in contouring is usually identified by using broken contour lines.
5.2 The conceptual site model Data generated from a site investigation should be related to the conceptual site model for the site, to see if the information makes sense in relation to the anticipated model conditions. The information should be assessed in the context of the model to determine the location, extent, trends and likely movement of the contamination through the soil profile. Analytical and field results should enable the conceptual site model to be refined, and issues relating to source, pathway and target identified and assessed.
5.2.1 Data assessment
The assessment of site data requires a review of all sources of information, including the conceptual site model and field and analytical results, and consideration of the site’s use and intended uses. When interpreting the soil analytical results, the uncertainty in the data and any limitations in the sampling and analytical method must be understood. Data are often assessed by comparing results with guideline values as an initial screen of the data. The appropriateness of the values in the context of the site, exposure pathways and analyses must be considered. (Further information on the use of guidelines is provided in section 5.3.) Professional judgement must be exercised if averaged concentrations are being used for comparison against guidelines. Averages must be used in the context of the exposure pathways, and in some instances may not be appropriate because they can ‘hide’ hot spot information. (Further details on statistical summaries are provided in section 5.4.1.)
52 Contaminated Land Management Guidelines No. 5
The interpretation of numbers close to guidelines can be done using statistical methods, provided the assumptions and limitations of the statistical method are appropriate and a designed statistical investigation sampling pattern has been used. The recommended method is to use the upper confidence limit of the arithmetic mean (for further discussion see Appendix I). When comparing results to a long-term guideline value, the result will be acceptable if the 95% upper confidence limit is at or below the guideline, provided no result is more than twice the guideline value. Further guidance is provided in Contaminated Sites: Sampling design guidelines (New South Wales Environment Protection Authority, 1995) and Supplemental Guidance to RAGS: Calculating the concentration term (US EPA, 1992).
5.2.2 Uncertainty in data assessment
Limitations and uncertainties of the data must be identified, and any assumptions made in interpreting the data clearly stated. Uncertainty in the data can be determined from the use of replicate samples, which provide an indication of the precision of sampling and analysis procedure. Replicate samples should be collected from different locations and the mean and standard deviation calculated for the individual replicates. The information on precision can then be used when comparing results to the guideline value. An example of such a calculation is included in the spreadsheet in Appendix J (see also section 5.8).
5.3 Use of soil contaminant standards and guideline values
The National Environmental Standard (NES) for Assessing and Managing Contaminants in Soil to Protect Human Health provides a suite of 12 soil contaminant standards and five land-use exposure scenarios that are legally binding. The way they were derived and a site-specific methodology to derive soil guideline values is contained in Methodology for Deriving Standards for Contaminants in Soil to Protect Human Health (Ministry for the Environment, 2011a). A variety of guidelines are available in New Zealand and overseas, and are commonly used for assessing data generated from site investigations. Only guideline documents that are appropriate to the site conditions should be used, and practitioners are cautioned to have a thorough understanding of the basis of the derivation of the guideline numbers before applying them on a site-specific basis. The hierarchy for the selection of a guideline value for a contaminant not included within the NES is set out in Contaminated Land Management Guidelines No. 2: Hierarchy and Application in New Zealand of Environmental Guideline Values (Revised 2011) (Ministry for the Environment, 2003) and should be followed.
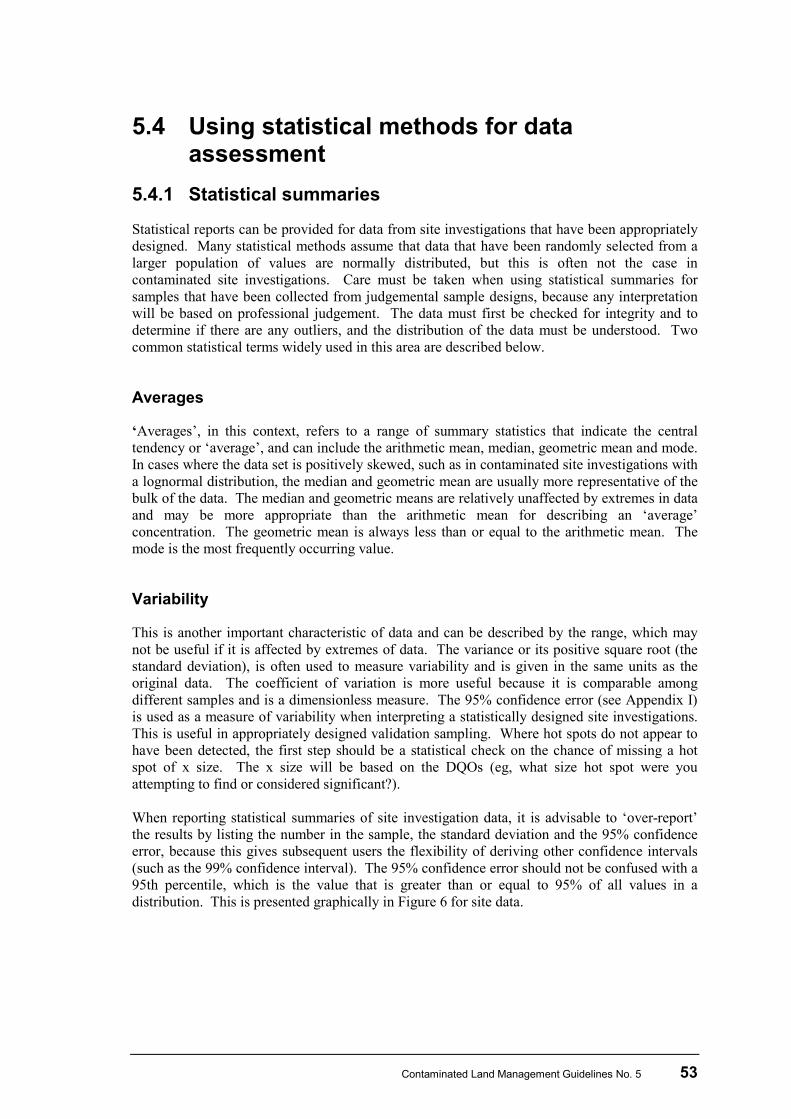
Contaminated Land Management Guidelines No. 5 53
5.4 Using statistical methods for data assessment
5.4.1 Statistical summaries
Statistical reports can be provided for data from site investigations that have been appropriately designed. Many statistical methods assume that data that have been randomly selected from a larger population of values are normally distributed, but this is often not the case in contaminated site investigations. Care must be taken when using statistical summaries for samples that have been collected from judgemental sample designs, because any interpretation will be based on professional judgement. The data must first be checked for integrity and to determine if there are any outliers, and the distribution of the data must be understood. Two common statistical terms widely used in this area are described below.
Averages
‘Averages’, in this context, refers to a range of summary statistics that indicate the central tendency or ‘average’, and can include the arithmetic mean, median, geometric mean and mode. In cases where the data set is positively skewed, such as in contaminated site investigations with a lognormal distribution, the median and geometric mean are usually more representative of the bulk of the data. The median and geometric means are relatively unaffected by extremes in data and may be more appropriate than the arithmetic mean for describing an ‘average’ concentration. The geometric mean is always less than or equal to the arithmetic mean. The mode is the most frequently occurring value.
Variability
This is another important characteristic of data and can be described by the range, which may not be useful if it is affected by extremes of data. The variance or its positive square root (the standard deviation), is often used to measure variability and is given in the same units as the original data. The coefficient of variation is more useful because it is comparable among different samples and is a dimensionless measure. The 95% confidence error (see Appendix I) is used as a measure of variability when interpreting a statistically designed site investigations. This is useful in appropriately designed validation sampling. Where hot spots do not appear to have been detected, the first step should be a statistical check on the chance of missing a hot spot of x size. The x size will be based on the DQOs (eg, what size hot spot were you attempting to find or considered significant?). When reporting statistical summaries of site investigation data, it is advisable to ‘over-report’ the results by listing the number in the sample, the standard deviation and the 95% confidence error, because this gives subsequent users the flexibility of deriving other confidence intervals (such as the 99% confidence interval). The 95% confidence error should not be confused with a 95th percentile, which is the value that is greater than or equal to 95% of all values in a distribution. This is presented graphically in Figure 6 for site data.
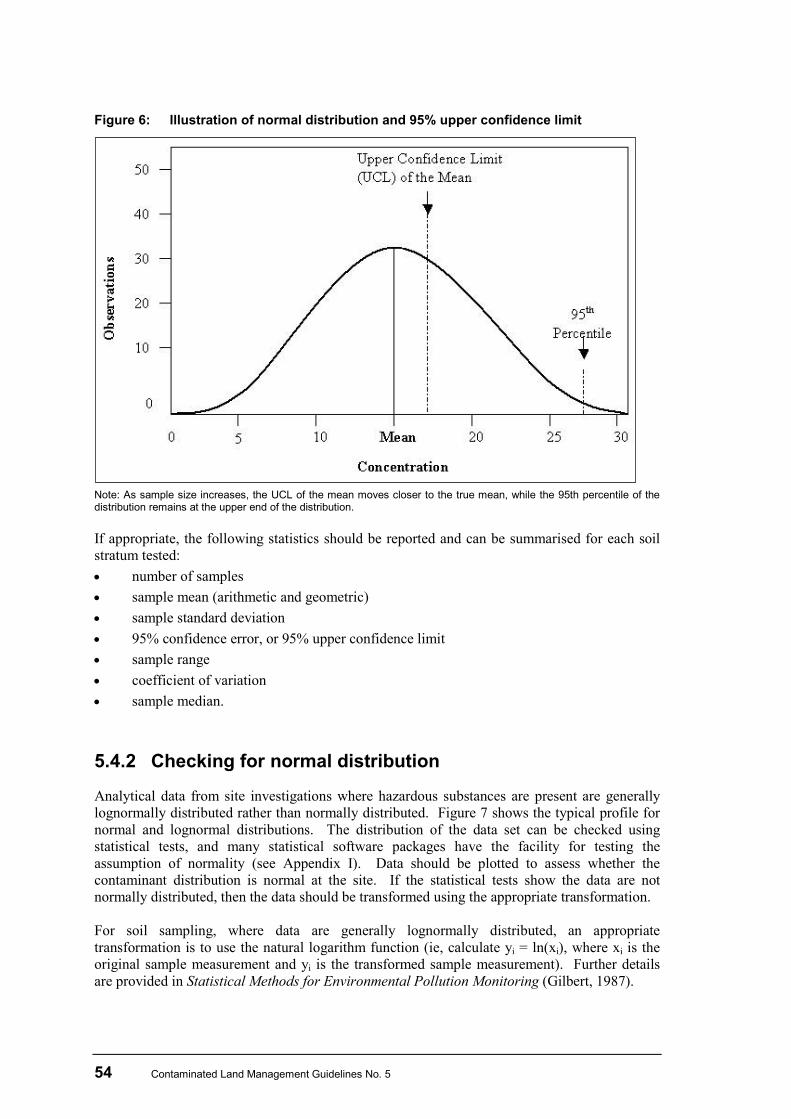
54 Contaminated Land Management Guidelines No. 5
Figure 6: Illustration of normal distribution and 95% upper confidence limit
Note: As sample size increases, the UCL of the mean moves closer to the true mean, while the 95th percentile of the distribution remains at the upper end of the distribution. If appropriate, the following statistics should be reported and can be summarised for each soil stratum tested: • number of samples • sample mean (arithmetic and geometric) • sample standard deviation • 95% confidence error, or 95% upper confidence limit • sample range • coefficient of variation • sample median.
5.4.2 Checking for normal distribution
Analytical data from site investigations where hazardous substances are present are generally lognormally distributed rather than normally distributed. Figure 7 shows the typical profile for normal and lognormal distributions. The distribution of the data set can be checked using statistical tests, and many statistical software packages have the facility for testing the assumption of normality (see Appendix I). Data should be plotted to assess whether the contaminant distribution is normal at the site. If the statistical tests show the data are not normally distributed, then the data should be transformed using the appropriate transformation. For soil sampling, where data are generally lognormally distributed, an appropriate transformation is to use the natural logarithm function (ie, calculate yi = ln(xi), where xi is the original sample measurement and yi is the transformed sample measurement). Further details are provided in Statistical Methods for Environmental Pollution Monitoring (Gilbert, 1987).
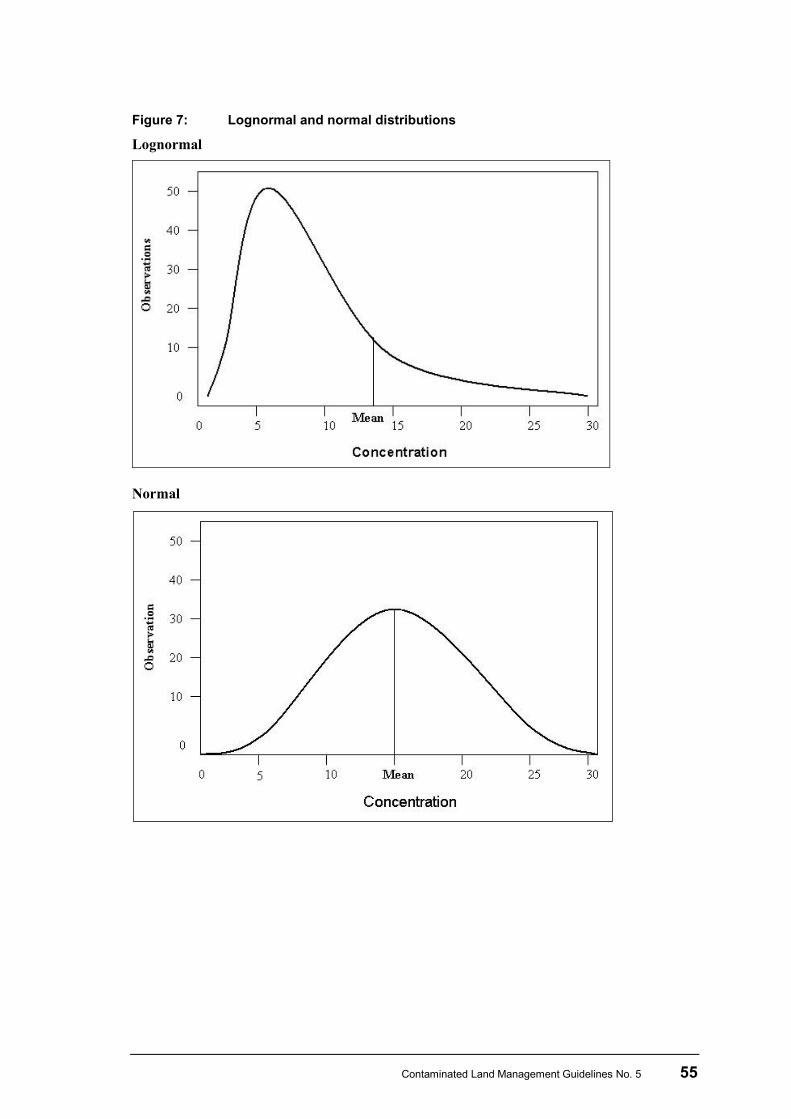
Contaminated Land Management Guidelines No. 5 55
Figure 7: Lognormal and normal distributions
Lognormal
Normal
56 Contaminated Land Management Guidelines No. 5
5.4.3 Accuracy and precision
Validation information relating to accuracy and precision of the measurements should form part of any significant contaminated site investigation report. In analytical chemistry, accuracy refers to how close a measured value is to the true value. The true value is usually not known (that was the point of undertaking the measurement). However, analytical measurements are sometimes prone to systematic errors that can compromise accuracy. Accuracy is usually assessed by one of two methods:
• sending duplicate samples for analysis in a different laboratory (inter-laboratory comparison), or
• analysing samples of a certified reference material. Certified reference materials are homogeneous reference samples that have been previously analysed, and in which the true values of contaminants can be assumed. These are available in a range of sample types, such as soils, plants and foods, but are not available for all analytes. They essentially represent inter-laboratory comparison in a bottle, and are available from a number of international standards agencies, including LGC (UK), the International Atomic Energy Association (IAEA, Vienna) and the National Institute of Standards and Technology (NIST, USA). Analytical precision refers to the spread of results, and is usually assessed by repeated measurements of the same sample. Precision is described by the measures of variability outlined in section 5.4.1. The most common statistic used to describe precision is the coefficient of variation. The use of replicates in soil sampling can give an indication of the precision in the sampling and analysis process.
5.4.4 Outliers
An outlier is one observation in a set of data that appears to be excessively high or low with respect to the mean value suggested by the other observations. Outliers may arise from analytical or sampling difficulties, but may also represent actual site contamination (eg, a hot spot). In other words, an outlier may be spurious or genuine. Each outlier should be evaluated to determine if it is a real result. The prevalence of spurious analytical outliers gets higher as the relative concentrations being measured decrease. One reason for this is that minor sample contamination effects (via contact with the atmosphere, sampler, sample container, analyst, laboratory reagents and equipment or instrumental technique) make up a greater part of the overall measurement as the concentration being measured decreases. Due to differences in the magnitudes being measured, spurious outliers are more common in trace background analyses than in contaminated site investigation soil analyses. The decision to identify an excessively high or low result as an outlier and discard it from the data set requires care and justification. Outliers must be looked at critically to ensure data are not mistakenly ‘lost’ from a site investigation. Where spurious outliers are identified, the original number must not be removed from the site investigation report. Instead, suspected outliers in the data set should be clearly identified (eg, with an asterisk and footnote). Reasons for the identification of the suspect observation should be provided in the text or a footnote.
Contaminated Land Management Guidelines No. 5 57
There is a range of statistical methods for identifying outlying observations, but they all suffer from the problem that in order to definitively identify an outlier, the nature of the underlying population from which the samples were drawn must be known with reasonable certainty. The best way to get a good idea of the nature of the underlying population is to analyse at least 30 samples. In small data sets (less than 30 samples), statistical methods for outlier rejection should be used only as a last recourse. An outlier should only be rejected if a back check reveals an error. Otherwise it is a real result that requires an explanation. The recommended checks when excluding outliers include the following.
• Check any calculations for errors.
• Check for the presence of a gross error in your methodology (eg, any recording error, laboratory error, abnormal conditions during sampling, poor sampling technique).
• Determine whether or not the suspect data point is consistent with the precision of the method (if this is known).
• Retest the suspect sample by repeating the analysis, or collect another sample for testing, to enlarge the overall data set. A single spurious result may become less obvious and have less impact on the mean; or, if it is an outlier, it may look worse.
• Check the observation against the reality of the site (see section 5.5). For example, a high concentration of arsenic in pastoral soil samples might be an outlier, unless the sampling point happens to coincide with the last known location of the old sheep dip, or an unknown location. Further investigation may be required to define the area the sample represents.
5.5 Reality checks An assessment of the validity of the data should be made and any uncertainty in the accuracy of the data explained. In particular, the data from the field and laboratory QA/QC must be within the acceptable criteria and any variability or exceedance in acceptability criteria explained. Any uncertainty in the accuracy of the data must also be clarified. A checklist for the data is recommended, as follows.
• Are the site history data consistent with the field observations made during the site walkover (eg, is there evidence of a tank pit, building foundations or ground disturbance in the anticipated locations based on desk research)?
• Is the labelling on the sample jars the same as on the chain of custody sheet and site plan? (An independent person, other than the field sampler, is best to do this check.)
• Are any data missing (eg, from the chain of custody or from the laboratory)?
• Are the units correct?
• Are the laboratory data consistent with field observations (eg, are high results consistent with field observations on contamination)?
• Have all the data been correctly transposed from the laboratory/field records to the report tables and site plan/figures, including the correct units for analysis? An independent peer review of the data should be carried out.
58 Contaminated Land Management Guidelines No. 5
5.6 Common mistakes made in data interpretation
Common mistakes and pitfalls to be avoided in data interpretation include:
• failing to identify information gaps in the data, such as insufficient numbers of sample results at a specific location or depth to enable a full conclusion to be drawn
• drawing definite conclusions in the absence of supporting data
• considering laboratory numbers in isolation from other supporting evidence (ie, not considering the conceptual site model or the field notes)
• assuming that contaminant results below detection limits imply the contaminant does not exist in the soil
• assuming natural strata within the site are the same as background soil (which may not be so if the natural strata have been affected by contaminants)
• using an inappropriately designed site investigation strategy (eg, using judgemental targeted sampling for a site validation, or collecting soil samples from the incorrect depth based on the conceptual site model)
• collecting an unrepresentative sample (eg, taking the soil samples using inappropriate methods, such as using air-flush drilling techniques for volatiles).
5.7 Interpreting numbers close to or below detection limits
5.7.1 Numbers close to detection limits
The interpretation of numbers close to method detection limits has uncertainty associated with the measurement in the laboratory due to the small signal being generated by the contaminant relative to the noise associated with the analytical equipment. There is also uncertainty due to the potential for sample contamination, which becomes more significant when undertaking trace level analysis.
5.7.2 Numbers below detection limits
Numbers below detection limits (also referred to as censored data) do not imply that the contaminant does not exist in the soil sample, only that the analytical method was not sufficiently sensitive to be able to detect that level of contaminants. The contaminant may be present at a concentration below the reported detection limit, or it may not be present in the sample at all (the concentration in the sample is zero). If numbers below detection limits are required for comparison against guideline values, then if possible the analysis should be undertaken again using a method with a more sensitive detection limit (the detection limit must be below the guideline value). When interpreting numbers below detection limits, the numbers should not be treated as ‘missing’, and non-detected results must not be omitted from the results.
Contaminated Land Management Guidelines No. 5 59
The numbers below detection limits can be interpreted in a number of ways: • treat the observation as zero • use the numerical value of the detection limit • use the numerical value of half the detection limit (this is the recommended method if
there is reason to believe the contaminant is present in a sample). Data below the detection limit can cause problems with statistical analysis, as any of the above ways of data interpretation introduces constant values, and biases the results. Any data set with a significant proportion of results (eg, over 25%) below the detection limit should not have any form of confidence intervals reported. In other cases, the statistical analysis of the data should be performed twice − once using the detection limit (or half the detection limit) as the replacement value, and once using zero − to see if the results differ markedly. If they do, more sophisticated statistical methods are required. If they do not differ markedly, then the small proportion of the data set that is below the detection limit has little influence on the statistical analysis, and the results can be used.
5.8 Numbers close to guideline values Numbers close to guidelines should be interpreted with consideration to the following issues:
• the nature of the guideline (eg, risk-based clean-up level, background or ‘investigation level’)
• the context of the site
• variability in the data (and sampling design). It is very rare for repeated analysis of the same sample to yield exactly the same result. The variability in results obtained from repeated analysis of the same sample represents the analytical precision (see section 5.4.3). In cases where replicate samples are collected from the same location and repeatedly analysed, this variability represents a combination of ‘sampling and analytical’ precision. Where sufficient data on the precision of a given measurement are available, it is possible to better define the area around the guideline value where analytical results are ambiguous. An example of this procedure is given in Appendix J, where the sample design was sufficient to assess ‘sampling and analytical’ precision.
Example: In the case outlined in Appendix J, the precision of any given soil arsenic measurement (represented by the Student’s t-test 95% confidence interval) was found to be plus or minus 5.5% of the measurement. This implied that, for that site and circumstances, 19 out of 20 analytical measurements of a sample containing 30 mg/kg arsenic would be in the region 28.4 mg/kg to 31.6 mg/kg. The practical upshot of this is that any result in this region is analytically indistinguishable from 30 mg/kg, which is the human health guideline value. In terms of practical implementation, analytical values below 28.4 mg/kg are taken to be ‘below guideline’, those in the range 28.4 mg/kg to 31.6 mg/kg are taken to be ‘at guideline’, and those above 31.6 mg/kg are taken to be ‘above guideline’.
60 Contaminated Land Management Guidelines No. 5
5.8.1 Nature of the guideline in the site context
The guideline used and its appropriateness with respect to site-specific conditions should be considered and assessed. The results should always be assessed in the context of the site, proposed land use and DQOs, and be related to the known information about the site history, sources of contamination and pathways for migration and target receptors. The basis for the derivation of any guideline should be understood and the suitability for use considered in the context of the site.
5.8.2 Variability in the data
When comparing results to guideline values, there are three possible outcomes in terms of how the results of any one measurement may relate to the guideline:
• concentrations in the area represented by the samples are clearly below the guideline value
• concentrations in the area represented by the samples are indistinguishable from the guideline value, because they are in the window around the guideline represented by ordinary sampling and analytical variability
• concentrations in the area represented by the samples are clearly above the guideline value.
The 95% upper confidence limit of the arithmetic mean can be used for interpreting numbers against a specified level (see Appendix I), and is applicable only where a statistically designed investigation has been undertaken. The use of judgemental sampling may preclude statistical methods, because the sampling design is biased. When using judgemental sampling, the confidence intervals cannot be reported and professional judgement is required. The use of blanks and replicates is required to assist in interpreting the data.
Use of blanks
The blank analytical results should be reported, and if any corrections to analytical results are made based on the blank results these must be clearly documented. When comparing results to guidelines for common contaminants, assess the significance of the results with caution. Examples include phthalate esters from plastic laboratory tubing, and traces of zinc from a range of sources (from galvanised iron to skin flakes), contamination from which becomes more important as the concentration being measured decreases. The use of blanks is important for determining the presence of common contaminants. Common organic contaminants include acetone, 2-butanone (or methyl ethyl ketone), methylene chloride (or dichloromethane), toluene and phthalate esters as defined by the US EPA. The recommended procedure for common laboratory contaminants is that sample results should be considered as positive only if the concentrations in the sample exceed 10 times the maximum amount detected in any blank. For other contaminants detected in the blank, the sample results should be considered positive if the sample exceeds five times the amount detected in any blank.
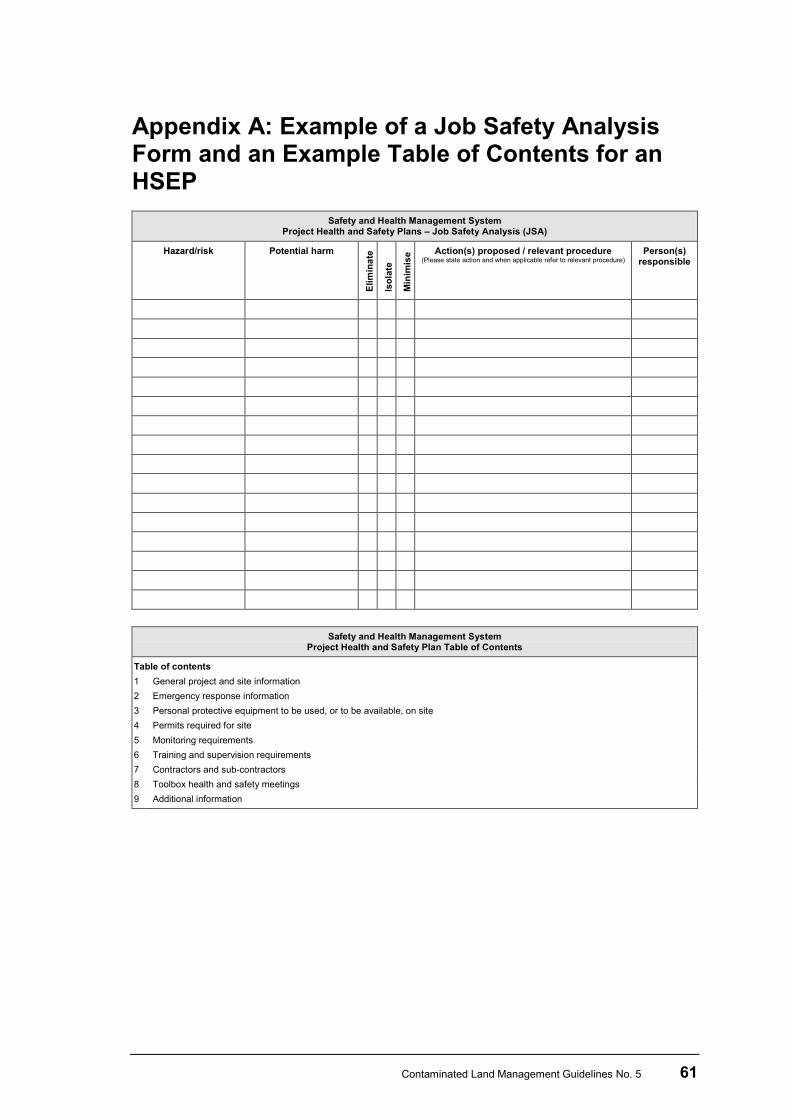
Contaminated Land Management Guidelines No. 5 61
Appendix A: Example of a Job Safety Analysis Form and an Example Table of Contents for an HSEP
Safety and Health Management System Project Health and Safety Plans – Job Safety Analysis (JSA)
Hazard/risk Potential harm
Elim
inat
e
Isol
ate
Min
imis
e Action(s) proposed / relevant procedure (Please state action and when applicable refer to relevant procedure)
Person(s) responsible
Safety and Health Management System
Project Health and Safety Plan Table of Contents
Table of contents 1 General project and site information 2 Emergency response information 3 Personal protective equipment to be used, or to be available, on site 4 Permits required for site 5 Monitoring requirements 6 Training and supervision requirements 7 Contractors and sub-contractors 8 Toolbox health and safety meetings 9 Additional information
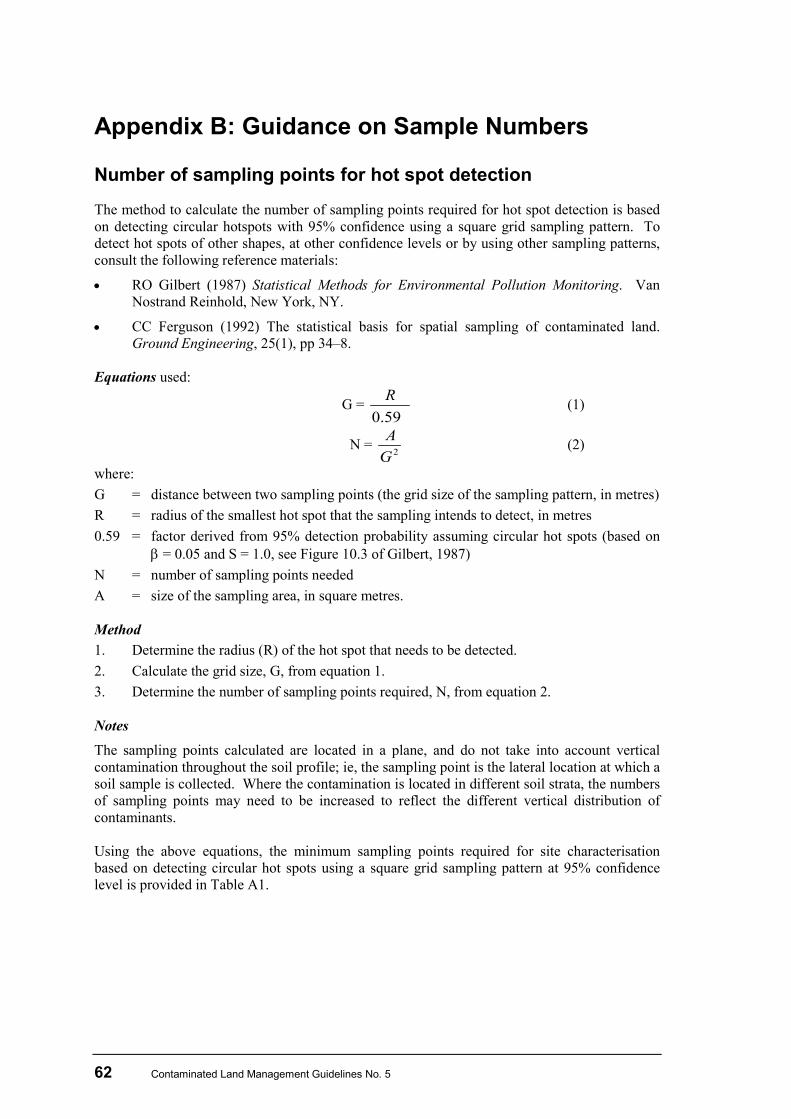
62 Contaminated Land Management Guidelines No. 5
Appendix B: Guidance on Sample Numbers
Number of sampling points for hot spot detection
The method to calculate the number of sampling points required for hot spot detection is based on detecting circular hotspots with 95% confidence using a square grid sampling pattern. To detect hot spots of other shapes, at other confidence levels or by using other sampling patterns, consult the following reference materials:
• RO Gilbert (1987) Statistical Methods for Environmental Pollution Monitoring. Van Nostrand Reinhold, New York, NY.
• CC Ferguson (1992) The statistical basis for spatial sampling of contaminated land. Ground Engineering, 25(1), pp 34–8.
Equations used:
G = 59.0R (1)
N = 2GA (2)
where: G = distance between two sampling points (the grid size of the sampling pattern, in metres) R = radius of the smallest hot spot that the sampling intends to detect, in metres 0.59 = factor derived from 95% detection probability assuming circular hot spots (based on
β = 0.05 and S = 1.0, see Figure 10.3 of Gilbert, 1987) N = number of sampling points needed A = size of the sampling area, in square metres. Method 1. Determine the radius (R) of the hot spot that needs to be detected. 2. Calculate the grid size, G, from equation 1. 3. Determine the number of sampling points required, N, from equation 2. Notes
The sampling points calculated are located in a plane, and do not take into account vertical contamination throughout the soil profile; ie, the sampling point is the lateral location at which a soil sample is collected. Where the contamination is located in different soil strata, the numbers of sampling points may need to be increased to reflect the different vertical distribution of contaminants. Using the above equations, the minimum sampling points required for site characterisation based on detecting circular hot spots using a square grid sampling pattern at 95% confidence level is provided in Table A1.
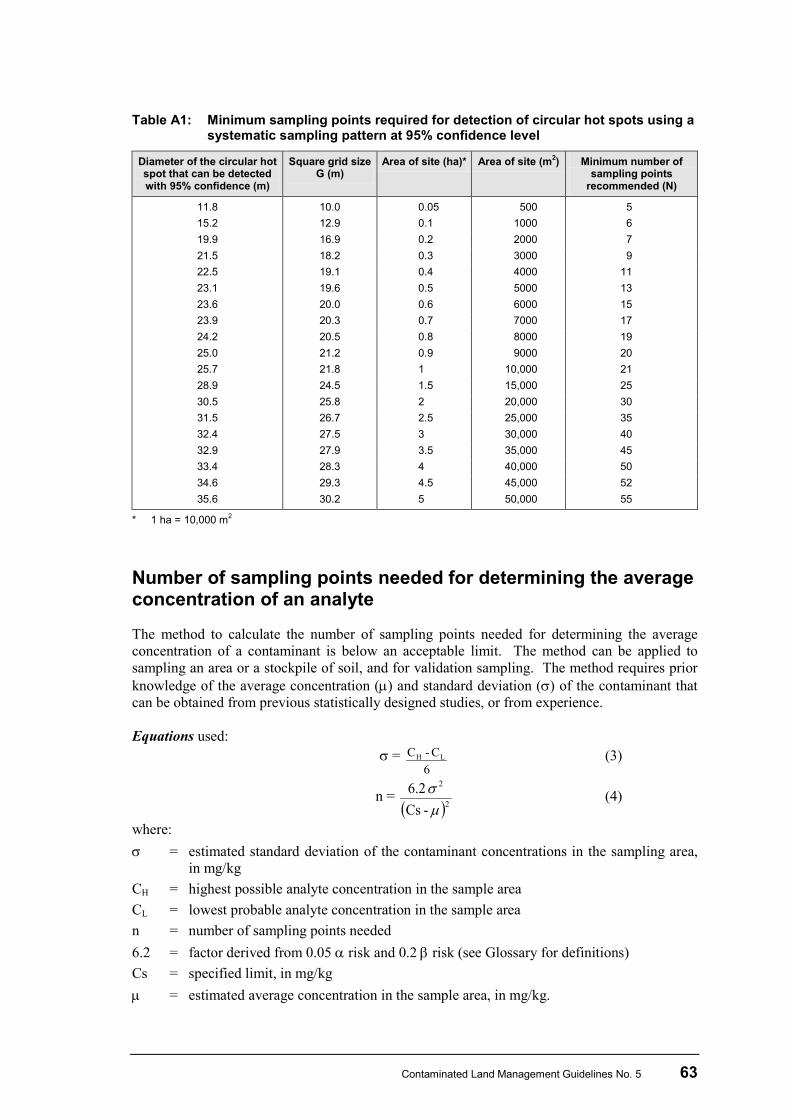
Contaminated Land Management Guidelines No. 5 63
Table A1: Minimum sampling points required for detection of circular hot spots using a systematic sampling pattern at 95% confidence level
Diameter of the circular hot spot that can be detected with 95% confidence (m)
Square grid size G (m)
Area of site (ha)* Area of site (m2) Minimum number of sampling points
recommended (N)
11.8 10.0 0.05 500 5 15.2 12.9 0.1 1000 6 19.9 16.9 0.2 2000 7 21.5 18.2 0.3 3000 9 22.5 19.1 0.4 4000 11 23.1 19.6 0.5 5000 13 23.6 20.0 0.6 6000 15 23.9 20.3 0.7 7000 17 24.2 20.5 0.8 8000 19 25.0 21.2 0.9 9000 20 25.7 21.8 1 10,000 21 28.9 24.5 1.5 15,000 25 30.5 25.8 2 20,000 30 31.5 26.7 2.5 25,000 35 32.4 27.5 3 30,000 40 32.9 27.9 3.5 35,000 45 33.4 28.3 4 40,000 50 34.6 29.3 4.5 45,000 52 35.6 30.2 5 50,000 55
* 1 ha = 10,000 m2
Number of sampling points needed for determining the average concentration of an analyte
The method to calculate the number of sampling points needed for determining the average concentration of a contaminant is below an acceptable limit. The method can be applied to sampling an area or a stockpile of soil, and for validation sampling. The method requires prior knowledge of the average concentration (µ) and standard deviation (σ) of the contaminant that can be obtained from previous statistically designed studies, or from experience. Equations used: σ =
6C-C LH (3)
n = ( )2
2
- Cs 6.2µ
σ (4)
where: σ = estimated standard deviation of the contaminant concentrations in the sampling area,
in mg/kg CH = highest possible analyte concentration in the sample area CL = lowest probable analyte concentration in the sample area n = number of sampling points needed 6.2 = factor derived from 0.05 α risk and 0.2 β risk (see Glossary for definitions) Cs = specified limit, in mg/kg µ = estimated average concentration in the sample area, in mg/kg.
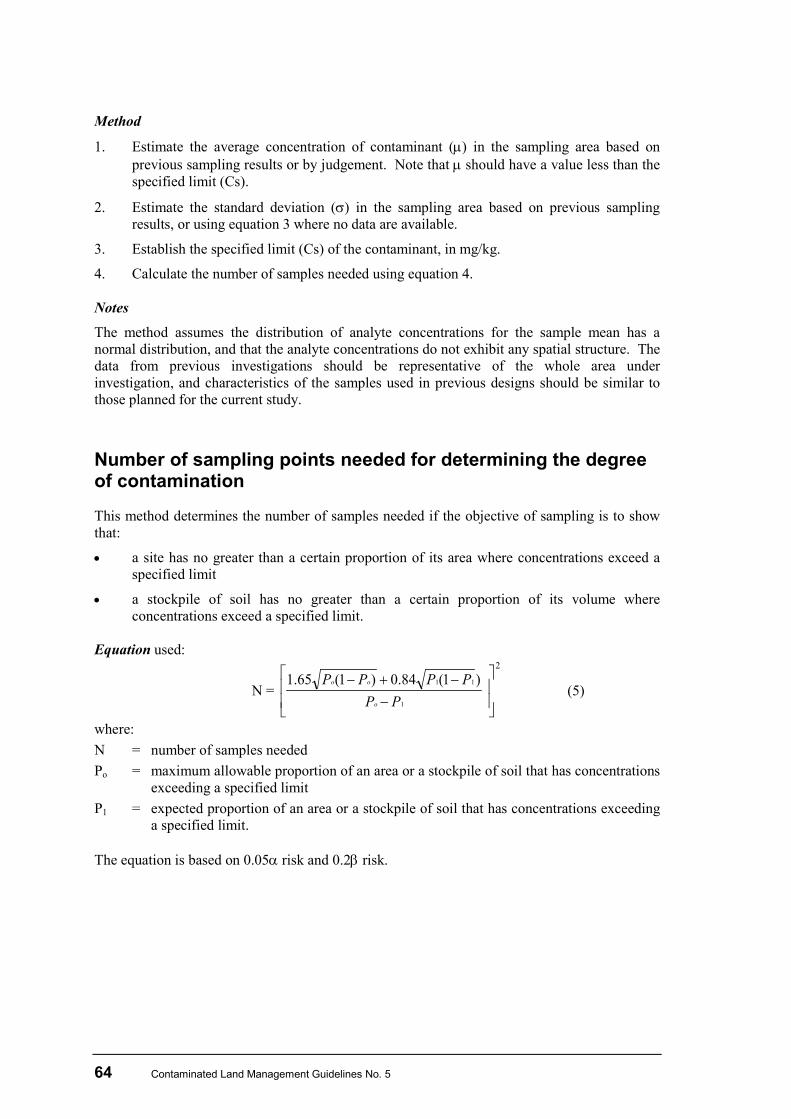
64 Contaminated Land Management Guidelines No. 5
Method
1. Estimate the average concentration of contaminant (µ) in the sampling area based on previous sampling results or by judgement. Note that µ should have a value less than the specified limit (Cs).
2. Estimate the standard deviation (σ) in the sampling area based on previous sampling results, or using equation 3 where no data are available.
3. Establish the specified limit (Cs) of the contaminant, in mg/kg.
4. Calculate the number of samples needed using equation 4. Notes
The method assumes the distribution of analyte concentrations for the sample mean has a normal distribution, and that the analyte concentrations do not exhibit any spatial structure. The data from previous investigations should be representative of the whole area under investigation, and characteristics of the samples used in previous designs should be similar to those planned for the current study.
Number of sampling points needed for determining the degree of contamination
This method determines the number of samples needed if the objective of sampling is to show that:
• a site has no greater than a certain proportion of its area where concentrations exceed a specified limit
• a stockpile of soil has no greater than a certain proportion of its volume where concentrations exceed a specified limit.
Equation used:
N =
2
1
11 )1(84.0)1(65.1
−−+−
PPPPPP
o
oo (5)
where: N = number of samples needed Po = maximum allowable proportion of an area or a stockpile of soil that has concentrations
exceeding a specified limit P1 = expected proportion of an area or a stockpile of soil that has concentrations exceeding
a specified limit. The equation is based on 0.05α risk and 0.2β risk.
Contaminated Land Management Guidelines No. 5 65
Method
1. Determine Po. The value of Po typically ranges from 0.05 (testing 95% of an area or a stockpile of soil is below an acceptable limit) to 0.25 (testing 75% of an area or a stockpile of soil is below an acceptable limit).
2. Determine P1. Note the value of P1 must be less than Po.
3. Calculate N from equation 5. References New South Wales Environment Protection Authority (1995) Contaminated Sites: Sampling design guidelines, New South Wales Environment Protection Authority, Sydney.
US EPA (1989) Methods for Evaluating the Attainment of Cleanup Standards. Volume 1: Soils and solid media. Chapter 6: Box 6.3 (EPA 230/02-89-042).Office of Policy, Planning and Evaluation, United States Environmental Protection Agency, Washington, DC.
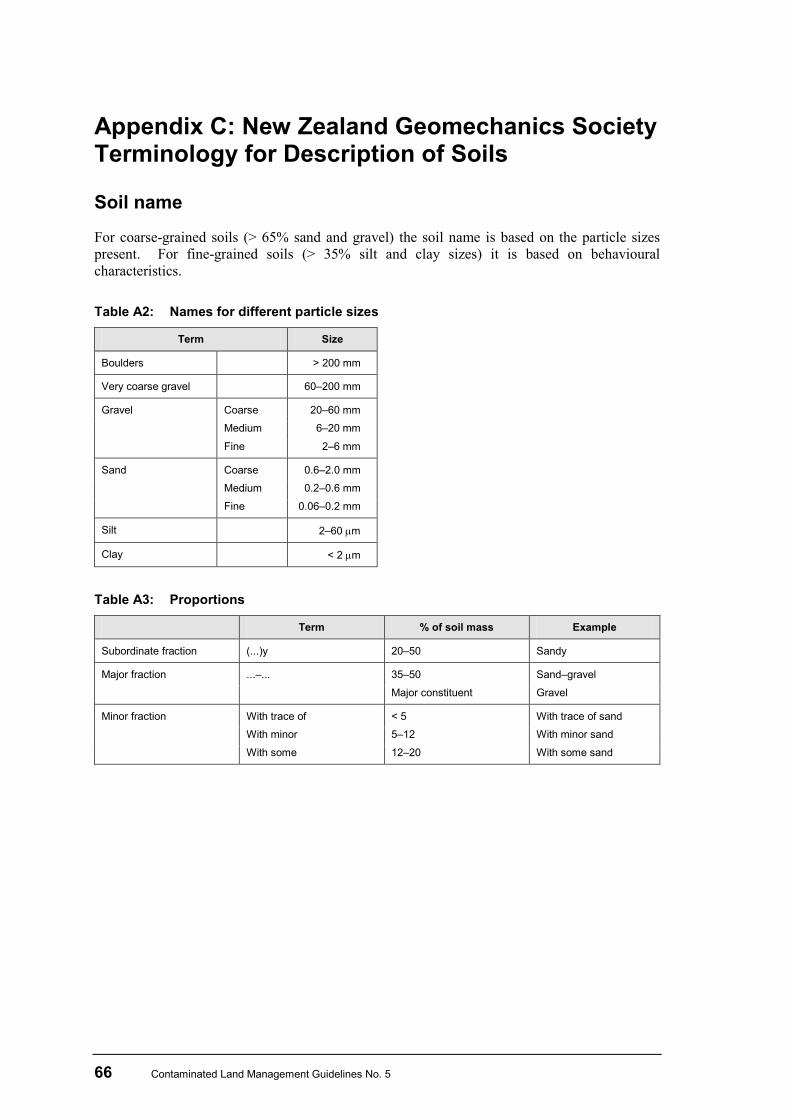
66 Contaminated Land Management Guidelines No. 5
Appendix C: New Zealand Geomechanics Society Terminology for Description of Soils
Soil name
For coarse-grained soils (> 65% sand and gravel) the soil name is based on the particle sizes present. For fine-grained soils (> 35% silt and clay sizes) it is based on behavioural characteristics. Table A2: Names for different particle sizes
Term Size
Boulders > 200 mm
Very coarse gravel 60–200 mm
Gravel Coarse 20–60 mm
Medium 6–20 mm
Fine 2–6 mm
Sand Coarse 0.6–2.0 mm
Medium 0.2–0.6 mm
Fine 0.06–0.2 mm
Silt 2–60 µm
Clay < 2 µm
Table A3: Proportions
Term % of soil mass Example
Subordinate fraction (...)y 20–50 Sandy
Major fraction ...–... 35–50 Sand–gravel
Major constituent Gravel
Minor fraction With trace of < 5 With trace of sand
With minor 5–12 With minor sand
With some 12–20 With some sand
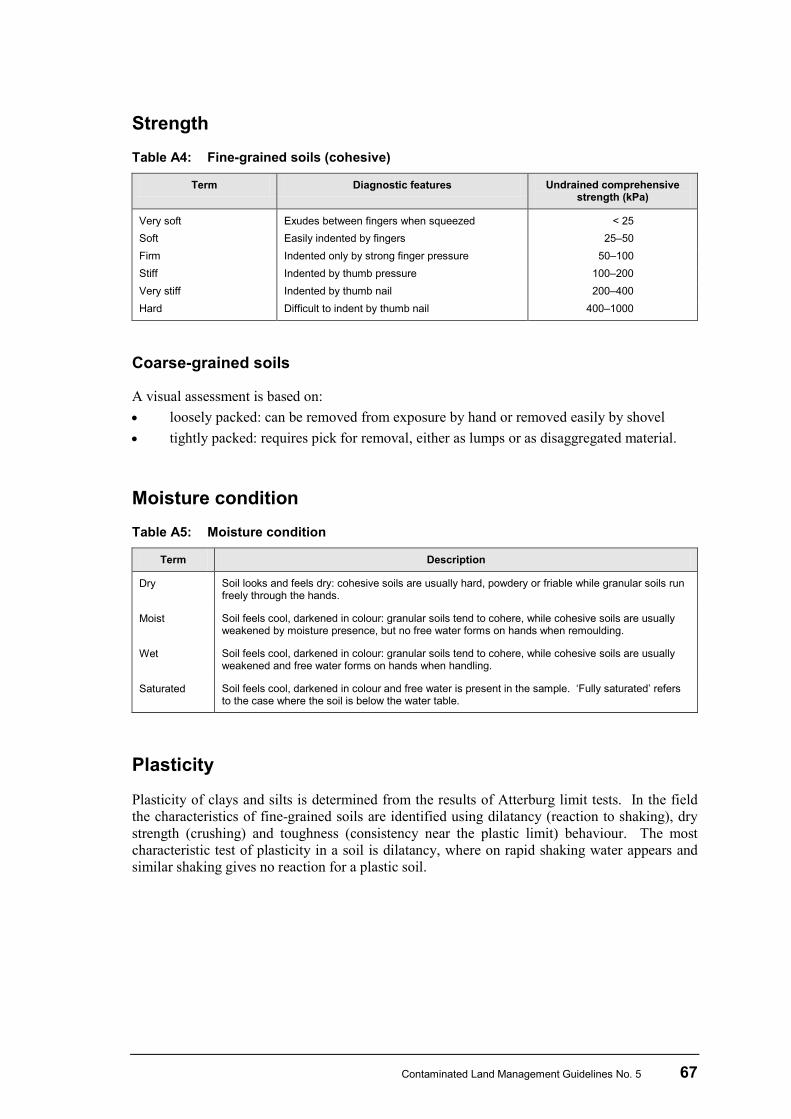
Contaminated Land Management Guidelines No. 5 67
Strength Table A4: Fine-grained soils (cohesive)
Term Diagnostic features Undrained comprehensive strength (kPa)
Very soft Exudes between fingers when squeezed < 25 Soft Easily indented by fingers 25–50 Firm Indented only by strong finger pressure 50–100 Stiff Indented by thumb pressure 100–200 Very stiff Indented by thumb nail 200–400 Hard Difficult to indent by thumb nail 400–1000
Coarse-grained soils
A visual assessment is based on: • loosely packed: can be removed from exposure by hand or removed easily by shovel • tightly packed: requires pick for removal, either as lumps or as disaggregated material.
Moisture condition Table A5: Moisture condition
Term Description
Dry Soil looks and feels dry: cohesive soils are usually hard, powdery or friable while granular soils run freely through the hands.
Moist Soil feels cool, darkened in colour: granular soils tend to cohere, while cohesive soils are usually weakened by moisture presence, but no free water forms on hands when remoulding.
Wet Soil feels cool, darkened in colour: granular soils tend to cohere, while cohesive soils are usually weakened and free water forms on hands when handling.
Saturated Soil feels cool, darkened in colour and free water is present in the sample. ‘Fully saturated’ refers to the case where the soil is below the water table.
Plasticity
Plasticity of clays and silts is determined from the results of Atterburg limit tests. In the field the characteristics of fine-grained soils are identified using dilatancy (reaction to shaking), dry strength (crushing) and toughness (consistency near the plastic limit) behaviour. The most characteristic test of plasticity in a soil is dilatancy, where on rapid shaking water appears and similar shaking gives no reaction for a plastic soil.
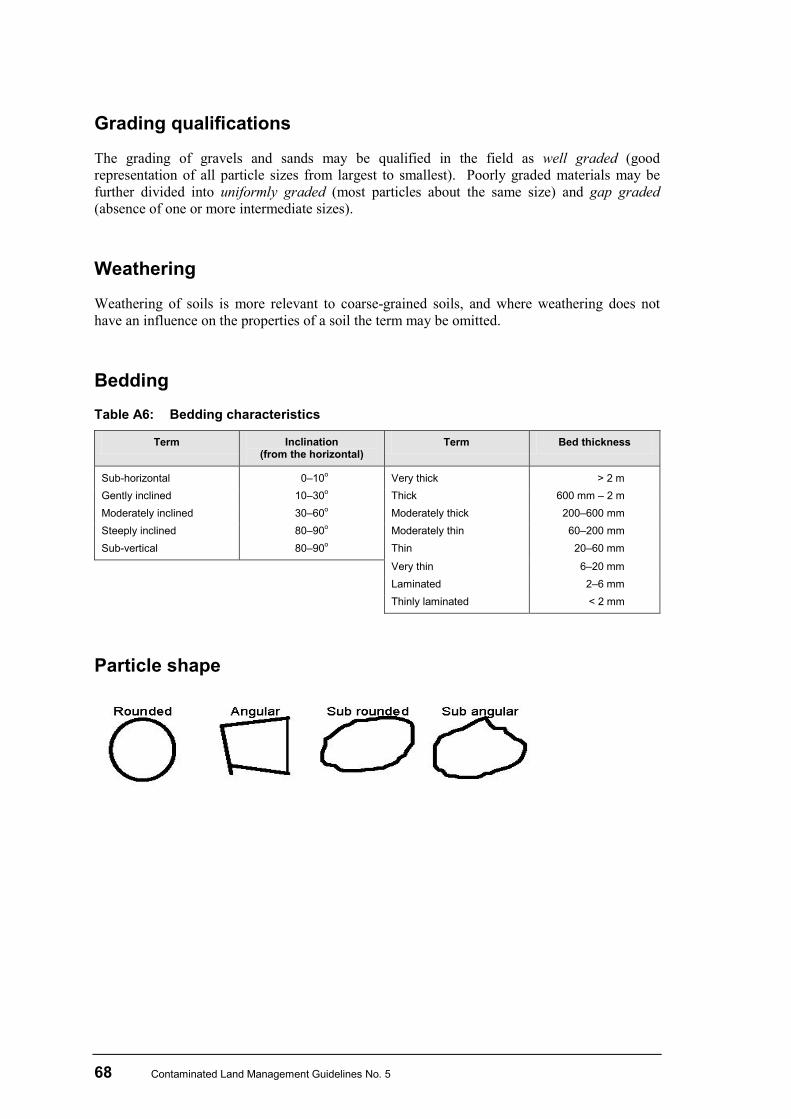
68 Contaminated Land Management Guidelines No. 5
Grading qualifications
The grading of gravels and sands may be qualified in the field as well graded (good representation of all particle sizes from largest to smallest). Poorly graded materials may be further divided into uniformly graded (most particles about the same size) and gap graded (absence of one or more intermediate sizes).
Weathering
Weathering of soils is more relevant to coarse-grained soils, and where weathering does not have an influence on the properties of a soil the term may be omitted.
Bedding Table A6: Bedding characteristics
Term Inclination (from the horizontal)
Term Bed thickness
Sub-horizontal 0–10o Very thick > 2 m Gently inclined 10–30o Thick 600 mm – 2 m Moderately inclined 30–60o Moderately thick 200–600 mm Steeply inclined 80–90o Moderately thin 60–200 mm Sub-vertical 80–90o Thin 20–60 mm
Very thin 6–20 mm Laminated 2–6 mm Thinly laminated < 2 mm
Particle shape
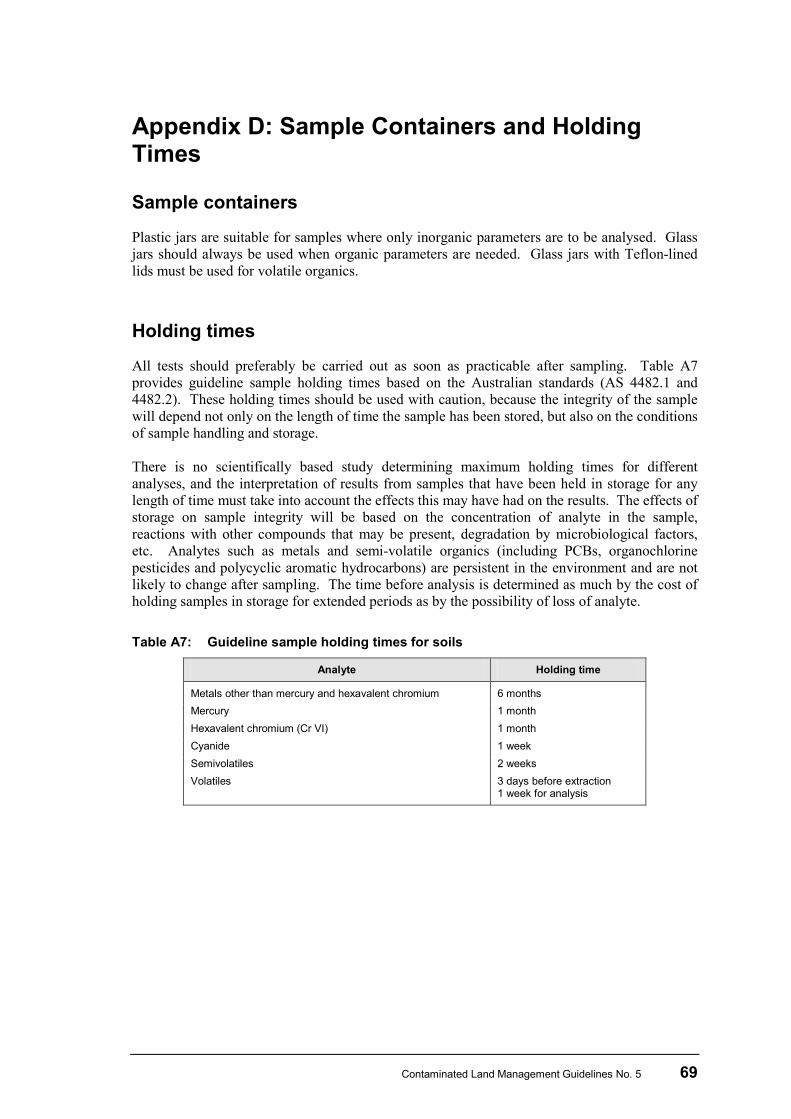
Contaminated Land Management Guidelines No. 5 69
Appendix D: Sample Containers and Holding Times
Sample containers
Plastic jars are suitable for samples where only inorganic parameters are to be analysed. Glass jars should always be used when organic parameters are needed. Glass jars with Teflon-lined lids must be used for volatile organics.
Holding times
All tests should preferably be carried out as soon as practicable after sampling. Table A7 provides guideline sample holding times based on the Australian standards (AS 4482.1 and 4482.2). These holding times should be used with caution, because the integrity of the sample will depend not only on the length of time the sample has been stored, but also on the conditions of sample handling and storage. There is no scientifically based study determining maximum holding times for different analyses, and the interpretation of results from samples that have been held in storage for any length of time must take into account the effects this may have had on the results. The effects of storage on sample integrity will be based on the concentration of analyte in the sample, reactions with other compounds that may be present, degradation by microbiological factors, etc. Analytes such as metals and semi-volatile organics (including PCBs, organochlorine pesticides and polycyclic aromatic hydrocarbons) are persistent in the environment and are not likely to change after sampling. The time before analysis is determined as much by the cost of holding samples in storage for extended periods as by the possibility of loss of analyte. Table A7: Guideline sample holding times for soils
Analyte Holding time
Metals other than mercury and hexavalent chromium 6 months Mercury 1 month Hexavalent chromium (Cr VI) 1 month Cyanide 1 week Semivolatiles 2 weeks Volatiles 3 days before extraction
1 week for analysis
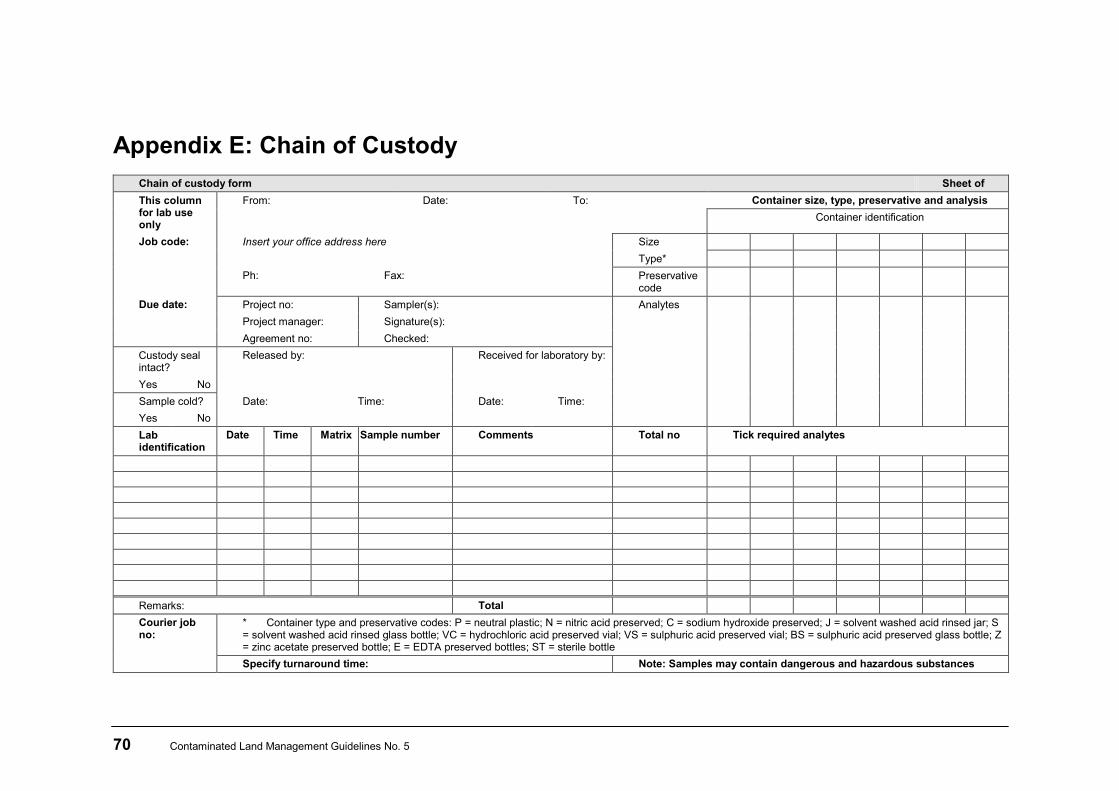
70 Contaminated Land Management Guidelines No. 5
Appendix E: Chain of Custody Chain of custody form Sheet of This column for lab use only
From: Date: To: Container size, type, preservative and analysis Container identification
Job code: Insert your office address here Size Type*
Ph: Fax: Preservative code
Due date: Project no: Sampler(s): Analytes Project manager: Signature(s): Agreement no: Checked:
Custody seal intact?
Released by: Received for laboratory by:
Yes No Sample cold? Date: Time: Date: Time: Yes No Lab identification
Date Time Matrix Sample number Comments Total no Tick required analytes
Remarks: Total Courier job no:
* Container type and preservative codes: P = neutral plastic; N = nitric acid preserved; C = sodium hydroxide preserved; J = solvent washed acid rinsed jar; S = solvent washed acid rinsed glass bottle; VC = hydrochloric acid preserved vial; VS = sulphuric acid preserved vial; BS = sulphuric acid preserved glass bottle; Z = zinc acetate preserved bottle; E = EDTA preserved bottles; ST = sterile bottle Specify turnaround time: Note: Samples may contain dangerous and hazardous substances
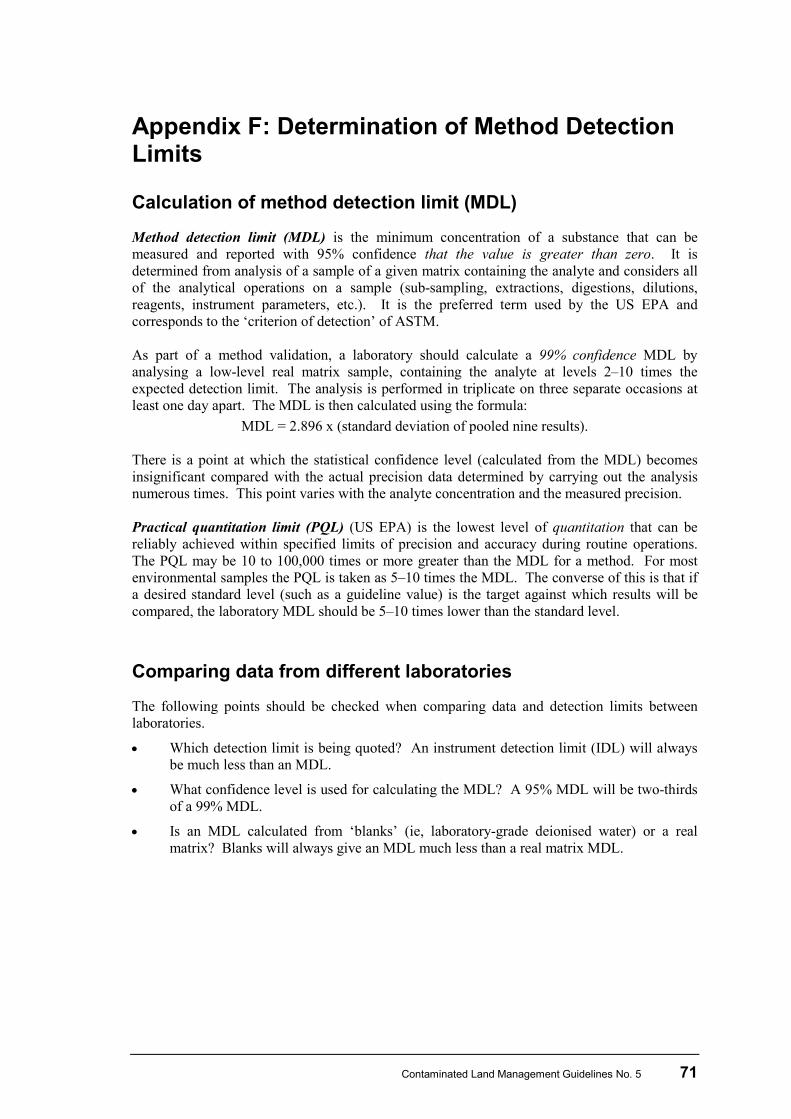
Contaminated Land Management Guidelines No. 5 71
Appendix F: Determination of Method Detection Limits
Calculation of method detection limit (MDL)
Method detection limit (MDL) is the minimum concentration of a substance that can be measured and reported with 95% confidence that the value is greater than zero. It is determined from analysis of a sample of a given matrix containing the analyte and considers all of the analytical operations on a sample (sub-sampling, extractions, digestions, dilutions, reagents, instrument parameters, etc.). It is the preferred term used by the US EPA and corresponds to the ‘criterion of detection’ of ASTM. As part of a method validation, a laboratory should calculate a 99% confidence MDL by analysing a low-level real matrix sample, containing the analyte at levels 2–10 times the expected detection limit. The analysis is performed in triplicate on three separate occasions at least one day apart. The MDL is then calculated using the formula:
MDL = 2.896 x (standard deviation of pooled nine results). There is a point at which the statistical confidence level (calculated from the MDL) becomes insignificant compared with the actual precision data determined by carrying out the analysis numerous times. This point varies with the analyte concentration and the measured precision. Practical quantitation limit (PQL) (US EPA) is the lowest level of quantitation that can be reliably achieved within specified limits of precision and accuracy during routine operations. The PQL may be 10 to 100,000 times or more greater than the MDL for a method. For most environmental samples the PQL is taken as 5–10 times the MDL. The converse of this is that if a desired standard level (such as a guideline value) is the target against which results will be compared, the laboratory MDL should be 5–10 times lower than the standard level.
Comparing data from different laboratories
The following points should be checked when comparing data and detection limits between laboratories.
• Which detection limit is being quoted? An instrument detection limit (IDL) will always be much less than an MDL.
• What confidence level is used for calculating the MDL? A 95% MDL will be two-thirds of a 99% MDL.
• Is an MDL calculated from ‘blanks’ (ie, laboratory-grade deionised water) or a real matrix? Blanks will always give an MDL much less than a real matrix MDL.
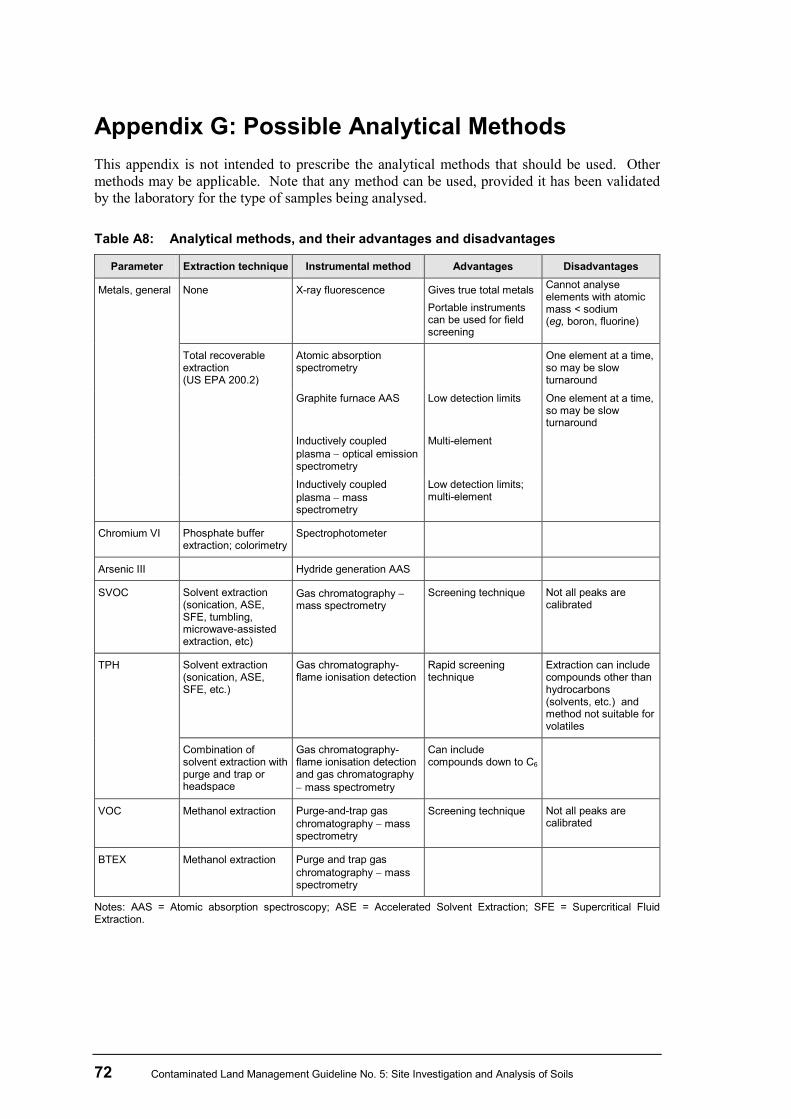
72 Contaminated Land Management Guideline No. 5: Site Investigation and Analysis of Soils
Appendix G: Possible Analytical Methods This appendix is not intended to prescribe the analytical methods that should be used. Other methods may be applicable. Note that any method can be used, provided it has been validated by the laboratory for the type of samples being analysed. Table A8: Analytical methods, and their advantages and disadvantages
Parameter Extraction technique Instrumental method Advantages Disadvantages
Metals, general None X-ray fluorescence Gives true total metals Portable instruments can be used for field screening
Cannot analyse elements with atomic mass < sodium (eg, boron, fluorine)
Total recoverable extraction (US EPA 200.2)
Atomic absorption spectrometry
One element at a time, so may be slow turnaround
Graphite furnace AAS Low detection limits One element at a time, so may be slow turnaround
Inductively coupled plasma − optical emission spectrometry
Multi-element
Inductively coupled plasma − mass spectrometry
Low detection limits; multi-element
Chromium VI Phosphate buffer extraction; colorimetry
Spectrophotometer
Arsenic III Hydride generation AAS
SVOC Solvent extraction (sonication, ASE, SFE, tumbling, microwave-assisted extraction, etc)
Gas chromatography − mass spectrometry
Screening technique Not all peaks are calibrated
TPH Solvent extraction (sonication, ASE, SFE, etc.)
Gas chromatography-flame ionisation detection
Rapid screening technique
Extraction can include compounds other than hydrocarbons (solvents, etc.) and method not suitable for volatiles
Combination of solvent extraction with purge and trap or headspace
Gas chromatography-flame ionisation detection and gas chromatography − mass spectrometry
Can include compounds down to C6
VOC Methanol extraction Purge-and-trap gas chromatography − mass spectrometry
Screening technique Not all peaks are calibrated
BTEX Methanol extraction Purge and trap gas chromatography − mass spectrometry
Notes: AAS = Atomic absorption spectroscopy; ASE = Accelerated Solvent Extraction; SFE = Supercritical Fluid Extraction.
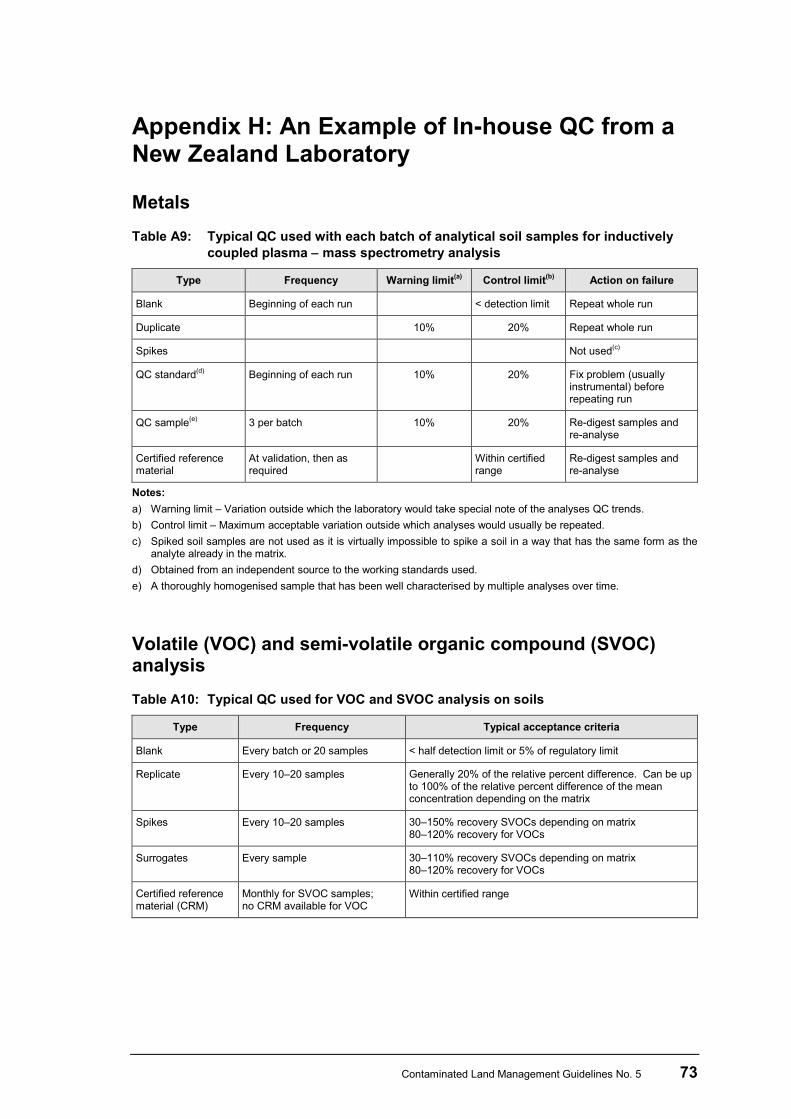
Contaminated Land Management Guidelines No. 5 73
Appendix H: An Example of In-house QC from a New Zealand Laboratory
Metals Table A9: Typical QC used with each batch of analytical soil samples for inductively
coupled plasma − mass spectrometry analysis
Type Frequency Warning limit(a) Control limit(b) Action on failure
Blank Beginning of each run < detection limit Repeat whole run
Duplicate 10% 20% Repeat whole run
Spikes Not used(c)
QC standard(d) Beginning of each run 10% 20% Fix problem (usually instrumental) before repeating run
QC sample(e) 3 per batch 10% 20% Re-digest samples and re-analyse
Certified reference material
At validation, then as required
Within certified range
Re-digest samples and re-analyse
Notes: a) Warning limit – Variation outside which the laboratory would take special note of the analyses QC trends. b) Control limit – Maximum acceptable variation outside which analyses would usually be repeated. c) Spiked soil samples are not used as it is virtually impossible to spike a soil in a way that has the same form as the
analyte already in the matrix. d) Obtained from an independent source to the working standards used. e) A thoroughly homogenised sample that has been well characterised by multiple analyses over time.
Volatile (VOC) and semi-volatile organic compound (SVOC) analysis Table A10: Typical QC used for VOC and SVOC analysis on soils
Type Frequency Typical acceptance criteria
Blank Every batch or 20 samples < half detection limit or 5% of regulatory limit
Replicate Every 10–20 samples Generally 20% of the relative percent difference. Can be up to 100% of the relative percent difference of the mean concentration depending on the matrix
Spikes Every 10–20 samples 30–150% recovery SVOCs depending on matrix 80–120% recovery for VOCs
Surrogates Every sample 30–110% recovery SVOCs depending on matrix 80–120% recovery for VOCs
Certified reference material (CRM)
Monthly for SVOC samples; no CRM available for VOC
Within certified range
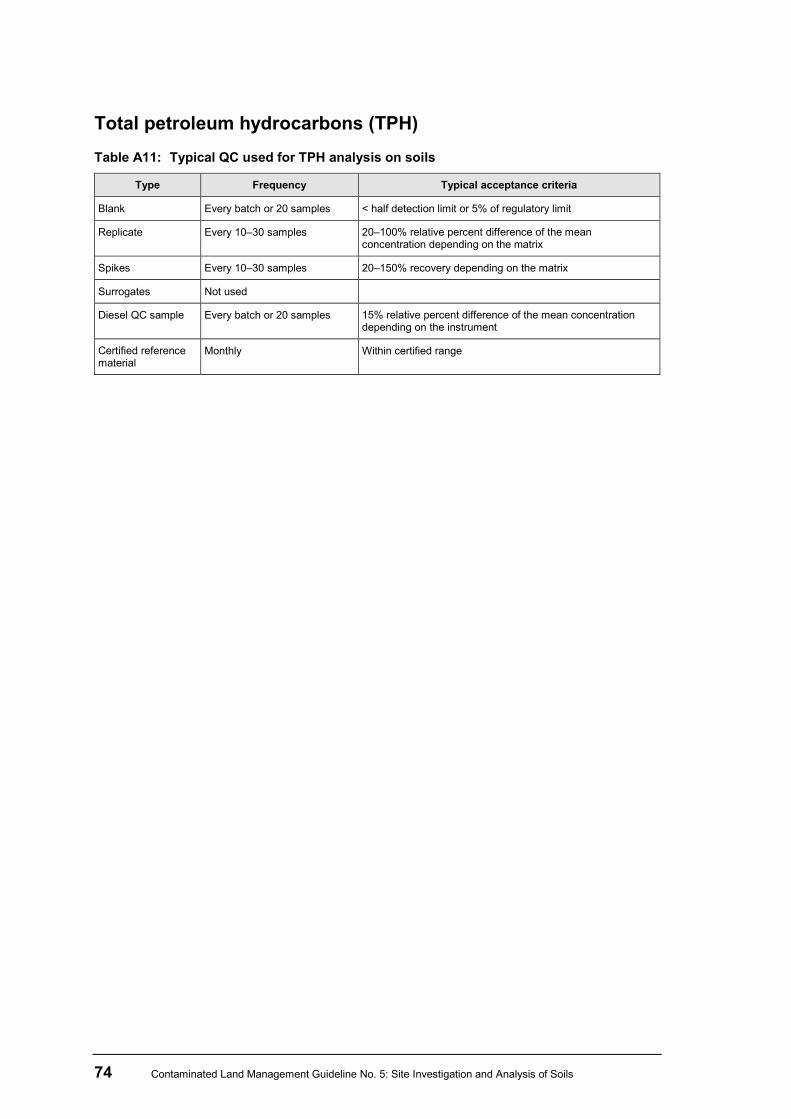
74 Contaminated Land Management Guideline No. 5: Site Investigation and Analysis of Soils
Total petroleum hydrocarbons (TPH) Table A11: Typical QC used for TPH analysis on soils
Type Frequency Typical acceptance criteria
Blank Every batch or 20 samples < half detection limit or 5% of regulatory limit
Replicate Every 10–30 samples 20–100% relative percent difference of the mean concentration depending on the matrix
Spikes Every 10–30 samples 20–150% recovery depending on the matrix
Surrogates Not used
Diesel QC sample Every batch or 20 samples 15% relative percent difference of the mean concentration depending on the instrument
Certified reference material
Monthly Within certified range
Contaminated Land Management Guidelines No. 5 75
Appendix I: Notes on the Upper Confidence Limit The upper confidence limit (UCL) is a statistical term that can be calculated for data collected from a statistically designed soil-sampling programme. The method for calculating the UCL will depend on the data distribution. Soil samples collected from a statistically designed programme are taken to be representative of the actual environmental conditions onsite (ie, samples collected are a subset of the actual site conditions, but represent the whole site). The 95% confidence interval (or error) is the region about the sample mean that is likely to contain the underlying population mean (representing the whole site itself) with a probability of 95%. Confidence intervals of 80%, 90%, 99%, 99.5%, etc. can be similarly defined. In other words, based on the samples collected, there is a probability of only 5% (1 in 20) that the population mean for the entire site will fall outside the boundaries defined by the 95% confidence interval. The confidence interval is dependent on the sample size, with the interval estimate providing an indication of how much uncertainty there is in the estimate of the true mean. The larger the population size (recommended n > 30), the narrower the confidence interval. The 95% confidence limit is simply the mean plus or minus the confidence error, giving an upper and lower confidence limit, respectively. For contaminated sites, the UCL is naturally of more interest than the overall confidence interval, and further discussion focuses on this. In order for an estimated UCL to be valid, the method selected has to be appropriate for the underlying distribution. Under some circumstances, such as broad-field horticultural soil sampling away from any spray shed or mixing area, the distribution of contaminants is likely to be normal. In these cases, the UCL can be calculated from either the Student’s t-distribution (n < 30) or the normal distribution (n > 30), depending on the number of samples. However, at most contaminated sites the distribution of contaminants is not normal. The more frequent pattern is a cluster of low to mid-range results containing most observations, along with a smaller group of results containing very high observations, representing the most contaminated areas. In these cases, a number of approaches are possible for estimating the UCL. A software package designed to assist in calculating the confidence interval and UCL, called ProUCL, is provided free of charge by the US EPA. This provides 10 possible methods for calculating the UCL, and can also be used to check data normality. At the time of writing, it is available from: http://www.epa.gov/esd/tsc/TSC_form.htm. However the UCL is estimated, it is worth noting that the value does not represent the ‘worst case scenario’ for a site but the limit above which the site average is unlikely to occur. As such, it can form a useful part of a statistical summary, but is not the final word on contamination. Valuable uses for a properly derived UCL are:
• conservative estimation of long-term (chronic) exposure risk, where the nature of contaminants and the concentrations are such that short-term (acute) exposure is not an issue − UCLs are appropriate for this because long-term risk relates to averaged and aggregated exposure
• comparing results to a (long-term) guideline value − as a rule of thumb, the site will be acceptable if the 95% UCL is at or below the guideline, provided no result is more than twice the guideline value.
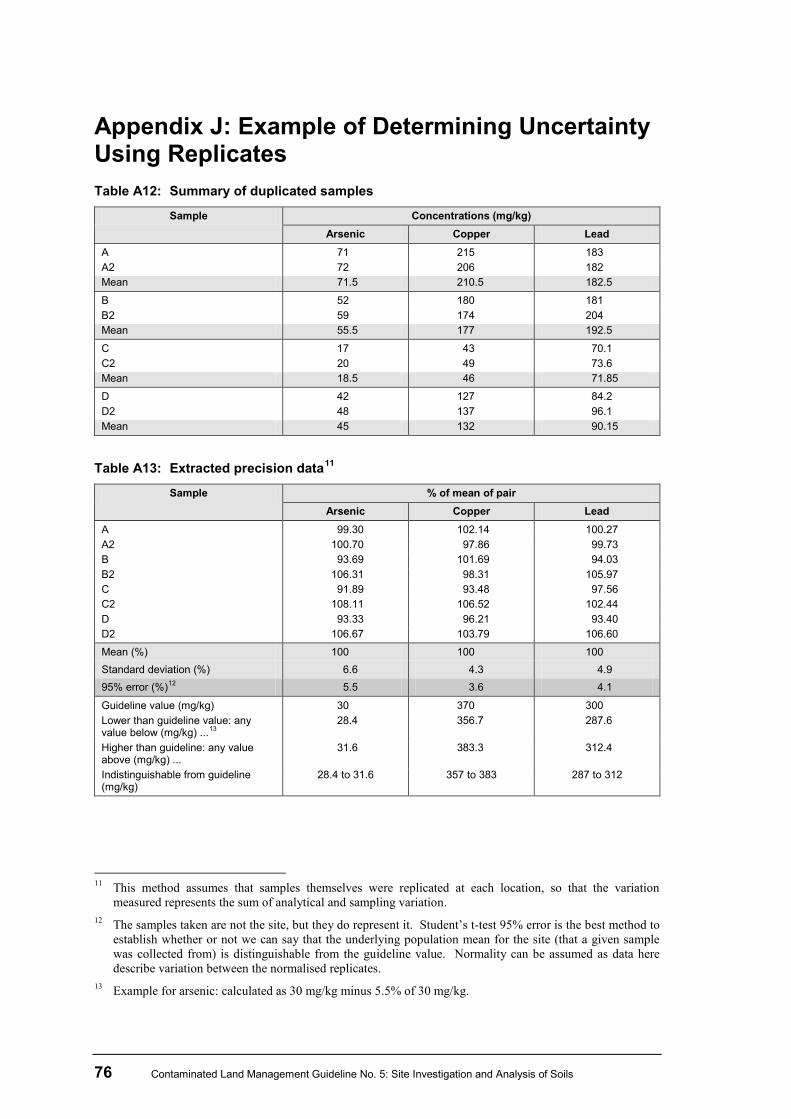
76 Contaminated Land Management Guideline No. 5: Site Investigation and Analysis of Soils
Appendix J: Example of Determining Uncertainty Using Replicates Table A12: Summary of duplicated samples
Sample Concentrations (mg/kg) Arsenic Copper Lead
A 71 215 183 A2 72 206 182 Mean 71.5 210.5 182.5
B 52 180 181 B2 59 174 204 Mean 55.5 177 192.5
C 17 43 70.1 C2 20 49 73.6 Mean 18.5 46 71.85
D 42 127 84.2 D2 48 137 96.1 Mean 45 132 90.15
Table A13: Extracted precision data11
Sample % of mean of pair Arsenic Copper Lead
A 99.30 102.14 100.27 A2 100.70 97.86 99.73 B 93.69 101.69 94.03 B2 106.31 98.31 105.97 C 91.89 93.48 97.56 C2 108.11 106.52 102.44 D 93.33 96.21 93.40 D2 106.67 103.79 106.60
Mean (%) 100 100 100 Standard deviation (%) 6.6 4.3 4.9 95% error (%)12 5.5 3.6 4.1
Guideline value (mg/kg) 30 370 300 Lower than guideline value: any value below (mg/kg) ...13
28.4
356.7 287.6
Higher than guideline: any value above (mg/kg) ...
31.6 383.3 312.4
Indistinguishable from guideline (mg/kg)
28.4 to 31.6 357 to 383 287 to 312
11 This method assumes that samples themselves were replicated at each location, so that the variation
measured represents the sum of analytical and sampling variation. 12 The samples taken are not the site, but they do represent it. Student’s t-test 95% error is the best method to
establish whether or not we can say that the underlying population mean for the site (that a given sample was collected from) is distinguishable from the guideline value. Normality can be assumed as data here describe variation between the normalised replicates.
13 Example for arsenic: calculated as 30 mg/kg minus 5.5% of 30 mg/kg.
Contaminated Land Management Guidelines No. 5 77
Glossary α risk The probability, expressed as a decimal, of making a false rejection decision
error (Type I error) (ie, rejecting a result when it is actually true).
Accuracy A term used to express the proximity to the true value.
Air rotary drilling A drilling technique using air to push the soil out of the borehole.
APHA American Public Health Association.
ASTM American Society for Testing and Materials.
Auger A soil-sampling device manually or mechanically driven into the soil.
AWWA American Water Works Association.
β risk The probability, expressed as a decimal, of making a false acceptance decision error (Type II error) (ie, accepting a result when it is actually false).
Background samples Soil samples collected in the area local to the site that represents naturally occurring ambient concentrations.
Bias A systematic deviation (error) in data that affects accuracy.
Blank A sample for quality control purposes – should not contain the analyte of interest.
Blind replicate sample
Also referred to as a field duplicate or replicate. Two separate samples (replicates) are collected from a single sample location, stored in separate containers and submitted for analysis to the laboratory as two separate samples for QC purposes.
Borehole An excavation undertaken using a drilling rig. This can be used for soil sampling and for installing soil, gas and groundwater monitoring devices.
BTEX Benzene, toluene, ethylbenzene and xylenes − a group of volatile aromatic hydrocarbons.
Certified reference materials
Sample material obtained from an independent source which has been analysed by different laboratories to determine consensus levels of the analyte concentration.
Chain of custody Documentation that is prepared by the field staff to document the handling and transport procedures of samples from the field to the laboratory.
Clean-up criteria Specific limits or concentrations that may be specified in remediation documents.
CLMG Contaminated Land Management Guidelines (CLMG) series.
Composite sampling A procedure that involves collecting individual soil samples from different locations, then bulking and mixing equal weights of the samples in the lab to make one (composite) sample.
Conceptual site model
A working hypothesis covering the potential nature and sources of contaminants, their likely spatial distribution in the soil (and other environmental media), and the potential effects of the contaminants on the site and on adjacent sites and other receptors.
Confidence interval (error)
Instead of a single estimate for the mean, a confidence interval generates a lower and upper limit for the mean. The confidence interval is dependent on the sample size, with the interval estimate providing an indication of how much uncertainty there is in the estimate of the true mean: the narrower the interval, the more precise the estimate.
78 Contaminated Land Management Guideline No. 5: Site Investigation and Analysis of Soils
Confidence limit The mean plus or minus the confidence interval. Confidence limits are usually shown as error bars on graphs or as six values. For contaminated sites, the upper confidence limit (UCL) is more commonly of interest, but it is worth noting that the UCL does not represent the worst case scenario for a site but the value above which the site average is unlikely to occur.
Contaminated land A generic term used to describe parcels of land where hazardous substances are, have been, or are likely to be present in the environment.
Contaminated site A site at which hazardous substances occur at concentrations above background concentrations and where assessment indicates it poses, or is likely to pose, an immediate or long-term risk to human health or the environment (after ANZECC, 1992).
Decontamination The process of washing and rinsing to remove contaminated material; applies to all equipment that can or has come into contact with contaminants.
Detailed site investigation
This involves intrusive techniques to collect field data and soil samples for analytical testing.
Detection limit (DL) See Method detection limit.
DQOs Data quality objectives – qualitative and quantitative statements that specify the quality of the data required.
Duplicate See Blind replicate sample.
Equipment rinsate blanks
QC samples used to identify cross-contamination from decontamination procedures. They are obtained by taking a sample of deionised water collected off/through the sampling equipment after decontamination has been undertaken on the equipment.
Extractable metals The fraction of metals that is likely to be extracted or leached from the sample under normal environmental conditions.
Field blanks QC samples, which are bottles filled with deionised water in the field and used to identify any volatile organic compounds that may have been introduced to the sample during sample collection.
Field screening techniques
Techniques used to define soil contamination cost-effectively, or used as a first stage to assist in targeting the intrusive investigation.
Fill material Material that has been imported onto a site; also referred to as made ground.
Flame ionisation detector
A detector used in gas chromatography.
Geometric mean A statistical term representing an ‘average’ defined as the nth root of the product of n numbers.
Geophysical surveys Non-intrusive investigation techniques based on physical measurements to help identify irregularities or hidden features in the subsurface.
HAIL Hazardous Activities and Industries List – a New Zealand list of activities and industries that are considered to have a high potential for land contamination.
Hot spot A localised area where the concentration of contaminants is relatively high compared to the surrounding area.
HSEP Health, safety and environment plan – documented assessment of the hazards and measures to eliminate, isolate or minimise these hazards for the tasks proposed.
IANZ International Accreditation New Zealand.
Contaminated Land Management Guidelines No. 5 79
Inter-laboratory comparison programmes
Analytical proficiency schemes for laboratory tests.
Job safety analysis A tool used to identify and document any hazards for each task, identify appropriate mitigation measures and assign responsibilities.
Judgemental sampling
Also called targeted, selective, strategic or model-based sampling. A method in which sample locations are selected based on prior knowledge.
Leaching tests Soil tests used to assess the likely mobility of parameters from the soil to the water phase (see Synthetic precipitation leaching procedure, and Toxicity characteristic leaching procedure).
Made ground See Fill material.
Mean A statistical term representing an ‘average’ defined as the sum of measurements divided by the number of measurements made.
Median A statistical term representing an ‘average’, defined as the middle number if the data set are ranked in numerical order. (If there are an even number of measurements, the median is the average of the middle two).
Method detection limit (MDL)
The minimum concentration of a substance that can be measured and reported with 95% confidence that the value is greater than zero.
Mode A statistical term representing an ‘average’, defined as the most frequently occurring value.
Monocyclic aromatic hydrocarbons
A group of organic chemicals comprising one fused aromatic ring (eg, benzene).
NATA National Association of Testing Authorities, Australia.
NES
NZS/ISO/IEC
National environmental standard.
New Zealand Standard/International Organisation for Standardisation/International Electrotechnical Commission.
OSH Occupational safety and health.
PCB Polychlorinated biphenyls.
Photo-ionisation detector
A field screening instrument used for detection of volatiles.
Polycyclic aromatic hydrocarbons (PAH)
A group of organic chemicals comprising two or more fused aromatic rings.
PQL Practical quantitation limits – the lowest level of quantitation that can be reliably achieved within specified limits of precision and accuracy.
Precision A measure of random variation in data, which affects the reproducibility of a method.
Preliminary site inspection
A site visit to augment or confirm the findings of the preliminary site study, and to identify any information to assist with the design of the detailed site investigation.
Preliminary site investigation report
A report documenting the information gathered in the preliminary site study and preliminary site inspection as set out in Contaminated Land Management Guideline No. 1: Reporting on Contaminated Sites in New Zealand (Revised 2011) (Ministry for the Environment, 2001).
Preliminary site study
The initial investigation phase.
80 Contaminated Land Management Guideline No. 5: Site Investigation and Analysis of Soils
QA Field quality assurance − a field programme to ensure uncertainty in sampling is minimised and managed.
QC Field quality control − field procedures and samples collected and used for the QA programme.
Relative percent difference
The difference between two sample results divided by their mean and expressed as a percentage.
Repeatability A statistical term to represent the within-run precision of a method.
Replicate See Blind replicate sample.
Reproducibility A statistical term to represent the between-run precision of a method.
Sample logging A soil profile logged on field record sheets using a consistent methodology and format for soil descriptions.
Sampling and analysis plan
A working document issued to field staff undertaking the sampling, which sets out the sampling objective, strategy and QA/QC requirements.
Sampling objectives Descriptions of why the samples are being collected.
Sampling patterns Descriptions of the lateral location of soil samples collected.
Sampling strategy A description of where and how to collect the samples.
Site validation A process of investigation to verify remediation at a site.
Site validation report A report that assesses the results of post-remediation testing against clean-up criteria for a contaminated site.
Spike A QC sample in which a known concentration of material is added to the sample.
Split samples QC samples used to check on the analytical proficiency of the laboratory. A primary laboratory sends a portion of a sample to a second independent laboratory for testing.
Standard deviation A statistical term which expresses the extent of divergence from the mean.
Stratified sampling A sampling pattern in which the site is divided into (usually) non-overlapping sub-areas. Different sampling densities and sampling patterns are used in the different sub-areas.
Surrogate A compound added to every sample prior to analysis to check the validity of the analytical method.
SVOCs Semi-volatile organic compounds.
Synthetic precipitation leaching procedure
An analytical method designed to determine the mobility of toxic organic and inorganic soil contaminants to groundwater tables below a contamination source.
Systematic sampling A sampling pattern, also referred to as non-targeted or grid sampling, which is a statistically based sampling strategy whereby soil sampling points are located at regular intervals throughout the site area on a grid pattern.
Test pit Also referred to as trial pit – an excavation undertaken by using a backhoe excavator and used for investigating subsurface materials to obtain soil samples.
Toxicity characteristic leaching procedure
An analytical method designed to simulate the leaching processes and other effects that occur when wastes are deposited into a landfill.
TPH Total petroleum hydrocarbons – an analytical test for compounds that are soluble in an organic solvent, and include hydrocarbons and other organics (eg, solvents).
Contaminated Land Management Guidelines No. 5 81
Trip blanks QC samples used to identify cross-contamination from sample transport or storage, and used when sampling soils for volatiles.
UCL Upper confidence limit.
US EPA United States Environmental Protection Agency.
Variance The standard deviation squared.
VOCs Volatile organic compounds.
WEF Water Environment Federation.
WES Workplace exposure standards.
X-ray fluorescence An analytical technique used for measuring total metals in soils.
Zero headspace sampler
Equipment used for collection of soil for volatile analyses.
82 Contaminated Land Management Guideline No. 5: Site Investigation and Analysis of Soils
References Centre for Research into the Built Environment (1994). UK Contaminated Land Research Report CLR 4: Sampling strategies for contaminated land. Centre for Research into the Built Environment, Nottingham Trent University, Nottingham.
Ferguson CC (1992). The statistical basis for spatial sampling of contaminated land. Ground Engineering, 25(1).
Gilbert RO (1987). Statistical Methods for Environmental Pollution Monitoring. Van Nostrand Reinhold, New York, NY.
Ministry for the Environment (1999). Guidelines for Assessing and Managing Petroleum Hydrocarbon Contaminated Sites in New Zealand (Revised 2011). Ministry for the Environment, Wellington, New Zealand.
Ministry for the Environment (2001). Contaminated Land Management Guideline No. 1: Reporting on Contaminated Sites in New Zealand (Revised 2011). Ministry for the Environment, Wellington, New Zealand.
Ministry for the Environment (2003). Contaminated Land Management Guideline No. 2: Hierarchy and Application in New Zealand of Environmental Guideline Values (Revised 2011). Ministry for the Environment, Wellington, New Zealand.
Ministry for the Environment (2006). Identifying, Investigating and Managing Risks Associated with Former Sheep-dip Sites: A guide for local authorities. Ministry for the Environment, Wellington, New Zealand.
Ministry for the Environment (2011a). Methodology for Deriving Standards for Contaminants in Soil to Protect Human Health. Ministry for the Environment, Wellington, New Zealand.
Ministry for the Environemnt (2011b). Hazardous Activities and Industries List (HAIL). Ministry for the Environment, Wellington, New Zealand.
New South Wales Environment Protection Authority. 1995. Contaminated Sites: Sampling design guidelines. New South Wales Environment Protection Authority, Sydney, NSW.
OSH (Occupational Safety and Health Service) (1994). Health and Safety Guidelines on the Clean-up of Contaminated Sites. Occupational Safety and Health Service, Wellington, New Zealand.
OSH (Occupational Safety and Health Service) (1995). Approved Code of Practice for Safety in Excavation and Shafts for Foundations. Occupational Safety and Health Service, Wellington, New Zealand.
US EPA (1989). Methods for Evaluating the Attainment of Clean-up Standards. Volume 1: Soils and solid media. EPA 230/02-89-042.
US EPA (1992). Supplemental Guidance to RAGS: Calculating the concentration term. EPA Publication 9285.7-08I.
US EPA (2000). Guidance for the Data Quality Objectives Process. EPAQA/G-4.
US EPA (2002). Guidance on Choosing a Sampling Design for Environmental Data Collection for Use in Developing a Quality Assurance Project Plan. EPA QA/G-5S.
Contaminated Land Management Guidelines No. 5 83
Additional Information ANZECC (1992). Australian and New Zealand Guidelines for the Assessment and Management of Contaminated Sites. Australian and New Zealand Environment and Conservation Council and the National Health and Medical Research Council, Canberra, ACT.
Australian Standard AS4482.1 (1997). Australian Standard Guide to the Sampling and Investigation of Potentially Contaminated Soil – Part 1: Non-volatile and semi-volatile compounds.
Australian Standard AS4482.2 (1999). Australian Standard Guide to the Sampling and Investigation of Potentially Contaminated Soil – Part 2: Volatile substances.
British Standard BS10175:2001 (2001). Investigation of Potentially Contaminated Sites: Code of practice.
Environmental Risk Management Authority (2001). User Guide to the HSNO Thresholds and Classification. Environmental Risk Management Authority, Wellington, New Zealand.
Ministry for the Environment (1997a). Guidelines for Assessing and Managing Contaminated Gasworks Sites in New Zealand. Ministry for the Environment, Wellington, New Zealand.
Ministry for the Environment (1997b). Health and Environmental Guidelines for Selected Timber Treatment Chemicals. Ministry for the Environment, Wellington, New Zealand.
Ministry for the Environment (2002). Guidelines for the Management of Hazardous Wastes: Module 1 –Identification and record-keeping. Ministry for the Environment, Wellington, New Zealand.
National Environment Protection Council (1999). Australian National Environment Protection (Assessment of Site Contamination) Measure, Schedule B(1): Guideline on the Investigation Levels for Soil and Groundwater. National Environment Protection Council Service Corporation, Adelaide, SA.
National Environmental Health Forum (1998). National Environmental Health Forum Monographs: Composite sampling. Soil Series No. 3, 1996. National Environmental Health Forum, Adelaide, SA.
OSH (Occupational Safety and Health Service) (2002). Guide for Safety with Underground Services. Occupational Safety and Health Service, Wellington, New Zealand.
US EPA (1990). A Rationale for the Assessment of Errors in the Sampling of Soils. EPA/600/4-90/013.
US EPA (1992). Preparation of Soil Sampling Protocols: Sampling techniques and strategies. EPA/600/R-92/128.