containers & packaging - sustainability accounting...
TRANSCRIPT
CONTAINERS & PACKAGINGResearch Brief
Sustainable Industry Classification System™ (SICS™) #RT0204
Research Briefing Prepared by the
Sustainability Accounting Standards Board®
MARCH 2015
www.sasb.org© 2015 SASB™
™
I N D U S T RY B R I E F | C O N TA I N E R S & PA C K A G I N G
SASB’s Industry Brief provides evidence for the material sustainability issues in the Containers &
Packaging industry. The brief opens with a summary of the industry, including relevant legislative
and regulatory trends and sustainability risks and opportunities. Following this, evidence for each
material sustainability issue (in the categories of Environment, Social Capital, Human Capital,
Business Model and Innovation, and Leadership and Governance) is presented. SASB’s Industry
Brief can be used to understand the data underlying SASB Sustainability Accounting Standards.
For accounting metrics and disclosure guidance, please see SASB’s Sustainability Accounting
Standards. For information about the legal basis for SASB and SASB’s standards development
process, please see the Conceptual Framework.
SASB identifies the minimum set of sustainability issues likely to be material for companies
within a given industry. However, the final determination of materiality is the onus of the
company.
Related Documents
• Containers & Packaging Sustainability Accounting Standard
• Industry Working Group Participants
• SASB Conceptual Framework
INDUSTRY LEAD
Darcie Renn
CONTRIBUTORS
Andrew Collins
Henrik Cotran
Stephanie Glazer
Anton Gorodniuk
Jerome Lavigne-Delville
Himani Phadke
CONTAINERS & PACKAGINGResearch Brief
SASB, Sustainability Accounting Standards Board, the SASB logo, SICS, Sustainable Industry Classification System, Accounting for a Sustainable Future, and Materiality Map are trademarks and service marks of the Sustainability Accounting Standards Board.
Darcie Renn
Arturo Rodriguez
Jean Rogers
Levi Stewart
Evan Tylenda
Table of Contents
Introduction . . . . . . . . . . . . . . . . . . . . . . . . . . . . . . . . . . . . . . . . . . . . . . . . . . . . . . . . . . . . . . . . . . . . . . . . . . . . . 1
Industry Summary . . . . . . . . . . . . . . . . . . . . . . . . . . . . . . . . . . . . . . . . . . . . . . . . . . . . . . . . . . . . . . . . . . . . . . . . . 2
Legislative and Regulatory Trends in the Containers & Packaging Industry . . . . . . . . . . . . . . . . . . . . . . . . . . . . . . . 6
Sustainability-Related Risks and Opportunities . . . . . . . . . . . . . . . . . . . . . . . . . . . . . . . . . . . . . . . . . . . . . . . . . . . 9
Environment . . . . . . . . . . . . . . . . . . . . . . . . . . . . . . . . . . . . . . . . . . . . . . . . . . . . . . . . . . . . . . . . . . . . . . . . . . . 10
Greenhouse Gas Emissions . . . . . . . . . . . . . . . . . . . . . . . . . . . . . . . . . . . . . . . . . . . . . . . . . . . . . . . . . . . . . . 10
Air Quality . . . . . . . . . . . . . . . . . . . . . . . . . . . . . . . . . . . . . . . . . . . . . . . . . . . . . . . . . . . . . . . . . . . . . . . . . . . 13
Energy Management . . . . . . . . . . . . . . . . . . . . . . . . . . . . . . . . . . . . . . . . . . . . . . . . . . . . . . . . . . . . . . . . . . . 15
Water Management . . . . . . . . . . . . . . . . . . . . . . . . . . . . . . . . . . . . . . . . . . . . . . . . . . . . . . . . . . . . . . . . . . . 18
Waste Management . . . . . . . . . . . . . . . . . . . . . . . . . . . . . . . . . . . . . . . . . . . . . . . . . . . . . . . . . . . . . . . . . . . 20
Social Capital . . . . . . . . . . . . . . . . . . . . . . . . . . . . . . . . . . . . . . . . . . . . . . . . . . . . . . . . . . . . . . . . . . . . . . . . . . . 22
Product Safety . . . . . . . . . . . . . . . . . . . . . . . . . . . . . . . . . . . . . . . . . . . . . . . . . . . . . . . . . . . . . . . . . . . . . . . . 23
Business Model and Innovation . . . . . . . . . . . . . . . . . . . . . . . . . . . . . . . . . . . . . . . . . . . . . . . . . . . . . . . . . . . . . . 26
Product Lifecycle Management . . . . . . . . . . . . . . . . . . . . . . . . . . . . . . . . . . . . . . . . . . . . . . . . . . . . . . . . . . . 27
Leadership and Governance . . . . . . . . . . . . . . . . . . . . . . . . . . . . . . . . . . . . . . . . . . . . . . . . . . . . . . . . . . . . . . . . 33
Materials Sourcing . . . . . . . . . . . . . . . . . . . . . . . . . . . . . . . . . . . . . . . . . . . . . . . . . . . . . . . . . . . . . . . . . . . . 34
Appendix
Representative Companies : Appendix I . . . . . . . . . . . . . . . . . . . . . . . . . . . . . . . . . . . . . . . . . . . . . . . . . . . . . . . i
Evidence for Sustainability Disclosure Topics : Appendix IIA . . . . . . . . . . . . . . . . . . . . . . . . . . . . . . . . . . . . . . . ii
Evidence of Financial Impact for Sustainability Disclosure : Appendix IIB . . . . . . . . . . . . . . . . . . . . . . . . . . . . . . iii
Sustainability Accounting Metrics : Appendix III . . . . . . . . . . . . . . . . . . . . . . . . . . . . . . . . . . . . . . . . . . . . . . . . iv
Analysis of SEC Disclosures : Appendix IV . . . . . . . . . . . . . . . . . . . . . . . . . . . . . . . . . . . . . . . . . . . . . . . . . . . . v
References
I N D U S T RY B R I E F | C O N TA I N E R S & PA C K A G I N G
INTRODUCTION
Containers and packaging products are
essential for the storage, transportation, and
protection of goods across industrial and
consumer applications. Containers and
packaging innovations have enabled the long-
term preservation of foods and perishable
goods and the safe and efficient transportation
of countless products throughout the economy.
Regulatory and social trends suggest a rising
concern for the human health and
environmental externalities of containers and
packaging products throughout their lifecycle.
During manufacturing, environmental impacts
can arise from greenhouse gas (GHG) and other
air emissions, water pollution, and waste
generation. In the use phase and at end-of-life,
containers and packaging come into contact
with people and consumables, raising the
prospect of adverse human health impacts. At
end-of-life, the persistence of some packaging
products in the environment, and increasing
resource scarcity, elevate the importance of
product reuse and reduced environmental
impact. These trends are driving innovation in
the industry, with a focus on alternative, safer
materials, enhanced recyclability, and
sustainably sourced raw materials.
Management (or mismanagement) of material
sustainability issues, therefore, has the
potential to affect company valuation through
impacts on profits, assets, liabilities, and cost of
capital.
Investors would obtain a more holistic and
comparable view of performance with
Containers & Packaging companies reporting
metrics on the material sustainability risks and
opportunities that could affect value in the
near- and long-term in their regulatory filings.
This would include both positive and negative
externalities, and the non-financial forms of
capital that the industry relies on for value
creation.
Specifically, performance on the following
sustainability issues will drive competitiveness
within the Containers & Packaging industry:
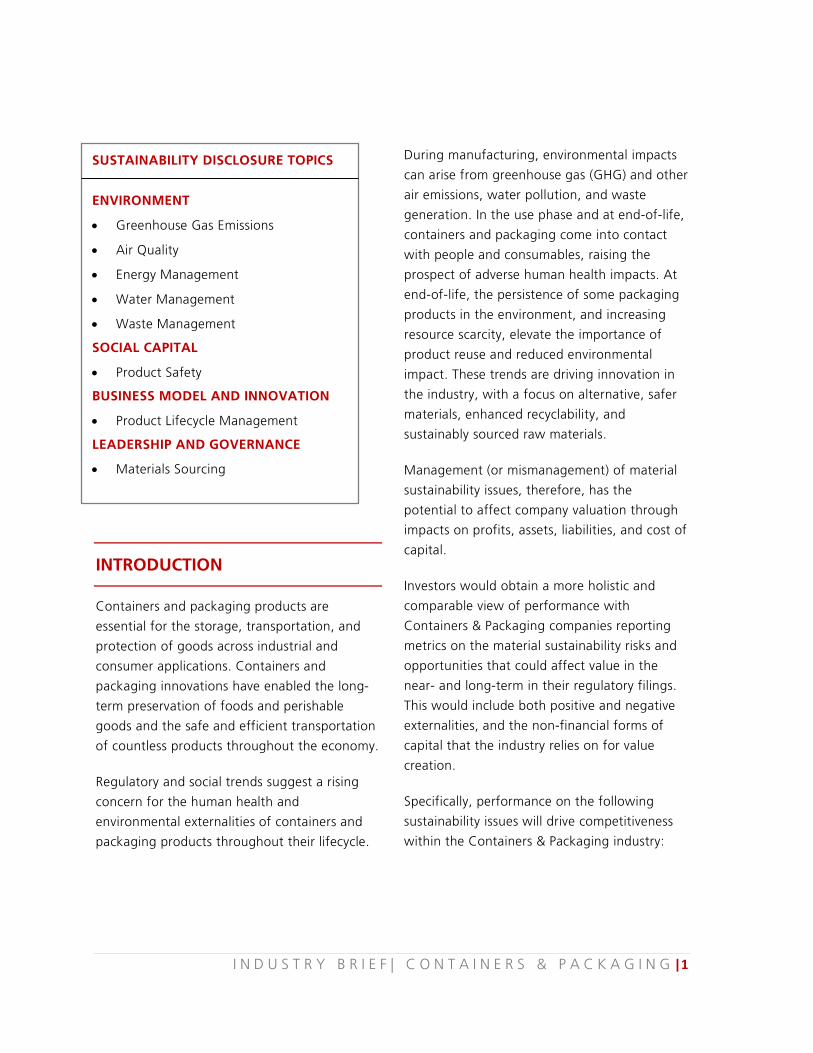
SUSTAINABILITY DISCLOSURE TOPICS
ENVIRONMENT
• Greenhouse Gas Emissions
• Air Quality
• Energy Management
• Water Management
• Waste Management
SOCIAL CAPITAL
• Product Safety
BUSINESS MODEL AND INNOVATION
• Product Lifecycle Management
LEADERSHIP AND GOVERNANCE
• Materials Sourcing
I N D U S T R Y B R I E F | C O N T A I N E R S & P A C K A G I N G |1
• Reducing greenhouse gas emissions,
particularly carbon dioxide emissions;
• Reducing non-GHG air pollution, which
can create hazards for public health
and the environment;
• Managing energy use to reduce the
cost of inputs and indirect GHG
emissions;
• Preventing water contamination and
securing water supplies without
exacerbating local water stress;
• Managing waste streams, which can be
harmful to the environment;
• Ensuring that products do not contain
harmful chemicals or present other
physical dangers;
• Improving the environmental
characteristics throughout the product
lifecycle through product innovation;
and
• Implementing sourcing initiatives to
mitigate risks from social and
environmental issues in the supply
chain.
INDUSTRY SUMMARY
The Containers & Packaging industry includes
companies that manufacture a wide range of
containers and packaging products made of
metal, plastic, paper, and glass materials. These
products include food and beverage containers,
household product bottles, aluminum cans,
I Industry composition is based on the mapping of the Sustainable Industry Classification System (SICSTM) to the
glass containers, metal containers and
packaging, corrugated paper containers and
packaging, paper and plastic bags, plastic
bottles and packaging, and wood containers
and pallets. Some companies also provide
packaging services, where a business can
outsource the packaging of its products to third
parties.I
Financial Drivers
The Containers & Packaging industry generates
annual sales of approximately $314 billion
globally. Paper containers and packaging make
up the largest segment of the industry, with
approximately 40 percent of revenues, followed
by plastic at 23 percent, metal at 17 percent,
and glass containers and packaging s at about
7 percent of total industry sales. The remainder
is represented by wood containers
manufacturing and packaging services.1 The
majority of the industry’s listed companies are
domiciled in the U.S. However, most companies
have some operations outside the U.S., and the
industry sells internationally as well.2
The glass, metal, plastic, and paper segments
of the Containers & Packaging industry share
similar characteristics that influence
sustainability issues across the industry.
Although the production processes between
different types of packaging vary, all are
relatively resource and energy intensive,
resulting in comparable environmental
Bloomberg Industry Classification System (BICS). A list of representative companies appears in Appendix I.
I N D U S T R Y B R I E F | C O N T A I N E R S & P A C K A G I N G |2
externalities. Additionally, raw materials costs
are typically the largest cost of manufacturing;
material prices are thus a key driver of
profitability in the industry. Companies operate
primarily as business-to-business
establishments, as packaging products are used
to ship and store a wide variety of finished
goods produced by other industries. Ultimately,
though, the industry’s products are also often
consumer facing, underscoring the importance
of product safety.
Due to the substantial equipment and energy
requirements necessary to transform raw
materials into finished products, the industry is
characterized by high barriers to entry and
capital intensity.3; 4; 5 Raw material inputs
represent a significant and volatile cost to
manufacturers, particularly because those costs
are tied to commodity prices, which can exhibit
price volatility. Raw material costs as a
percentage of revenue range from 44 percent
for glass bottle manufacturers to 63 percent for
metal container manufacturers.6; 7 As a result of
these high costs of inputs, profit margins are
typically low for containers and packaging
companies. Furthermore, industry margins are
generally correlated with commodity prices;
that correlation can lead to high levels of profit
volatility if producers cannot pass on higher
costs to customers.8; 9; 10 As of February 2015,
the median gross and net income margins of
the Containers & Packaging industry were 13.2
and 4.8 percent, respectively.11
Competition
The Containers & Packaging industry is
characterized by ongoing consolidation. Recent
acquisitions and mergers have created larger,
more competitive companies. For example,
RockTenn, a major paper container
manufacturer, acquired Smurfit-Stone, raising
RockTenn’s market share from 2.8 percent in
2008 to more than 8.5 percent in 2013.12 In
January 2015, RockTenn and MeadWestvaco
announced that they would merge to form the
second-largest U.S. packaging company.13
The competitive landscape between glass,
plastic, metal, and paper container and
packaging companies largely depends on
consumer preferences and raw material costs.14
Due to the nature of their products, domestic
container and packaging manufacturers face
little competition from imports, as it is not
typically economical to ship inexpensive or
empty containers. As a result, most operations
are located relatively close to end markets.15; 16
The specific business drivers and structure of
the industry’s primary segments are discussed
below.
Industry Segments
The Containers & Packaging industry’s largest
segment, paper container manufacturing,
transforms paper pulp from virgin and recycled
sources into various packaging forms including
paperboard, corrugated paper (cardboard),
linerboard, and beverage containers.17;18 The
paper segment’s revenue is driven in large part
by the food and beverage industry, demand
I N D U S T R Y B R I E F | C O N T A I N E R S & P A C K A G I N G |3
from retail and industrial customers, and
consumer spending. Paper packaging is one of
the most widely used forms of containers for
food and beverage products. The chief end-
markets for corrugated paper packaging, a
commonly used variant of paper packaging,
include plastic and rubber products
manufacturers, general retailers, shipping and
logistics firms, and textile companies.19
Companies typically purchase paper pulp or
unfinished paper from paper and pulp
producers, then convert it into paper containers
and packaging. U.S.-based International Paper,
Inc. is the largest company in this segment.20
The metal container-manufacturing segment
converts raw materials like aluminum, tin, and
steel into various forms of packaging, including
lightweight aluminum beverage cans, shipping
containers, steel drums, and other metal
boxes.21 Demand for metal containers is driven
mainly by beverage companies, makers of both
non-alcoholic and alcoholic beverages, which
represent 60 percent of the total market in the
U.S.22 The segment’s drivers include demand
from beverage and canned food companies.
Aluminum and steel prices are key
determinants of profitability, as materials costs
are the single greatest manufacturing expense
for the industry.23 Companies producing metal
containers compete directly with other
packaging segments, especially cheaper, more
versatile paper and plastic alternatives.24
In 2012, the global beverage can industry
shipped 290 billion units, and shipments are
expected to grow to 400 billion units by 2020,
with growth largely driven by emerging
markets.25 In 2014, the U.S.-based Can
In developing this briefing and
determining disclosure topics and
accounting metrics for Containers &
Packaging companies, SASB used a
“pure-play” definition of the industry,
which assumes that Containers &
Packaging companies do not conduct
forestry and paper pulp production
operations.
SASB treats separately the following
industries: Forestry & Paper and
Containers & Packaging. While this
approach is necessary to ensure a
coherent understanding of industry
drivers and challenges, it does not always
reflect the current structure of the
industry; some Containers & Packaging
companies are vertically integrated,
operating both forestry and paper pulp
facilities as well as paper product
manufacturing facilities.
Therefore, depending on the specific
activities and operations of Containers &
Packaging companies, disclosure topics
and accounting metrics associated with
the Forestry & Paper industry may also be
relevant for them.
NOTE ON INDUSTRY STRUCTURE
I N D U S T R Y B R I E F | C O N T A I N E R S & P A C K A G I N G |4
Manufacturers Institute, a trade association
whose members include many U.S. metal can
manufacturing companies, reported that the
segment shipped more than 126 billion metal
containers of all types within the U.S. in
2013.26 U.S.-based Crown Holdings, Inc. is the
largest company in this segment by revenue.27
The plastic container-manufacturing segment
includes companies that transform plastics and
resins into a wide variety of plastic bottles and
containers. These products are used in a broad
variety of applications across industries,
including beverage, food, and household
products.28 In the U.S. market, this segment’s
revenue comes primarily from the following
sources: 55 percent from beverage bottles, 18
percent from household products, 12 percent
from automotive and industrial products, 8
percent from food bottles, and 7 percent from
other products.29 The versatility of plastic and
its low manufacturing costs have made it
desirable for application in multiple industries
and the primary competitive alternative to glass
and metal containers.30 Consolidated Container
Company, a large private company, acquired
Roffe Container and Madras Packaging in
2012, adding to the company’s capacity for
milk, water and juice containers.31 U.S.-based
Sealed Air Corp. is the largest company in this
segment.32
The U.S. domestic glass container segment
represents a $5.5 billion market.33 Glass
container manufacturers convert raw materials,
sand and cullet (recycled glass), into glass
containers and bottles. The largest company in
this segment is Owens-Illinois, which had $6.9
billion in global sales in 2013.34 The glass
container market is facing headwinds, as
consumers increasingly demand substitute
products, such as paper and plastic.35
Trends and Valuation Factors
Innovation in the Containers & Packaging
industry is driven by traditional operational
efficiencies created by reduced material and
energy consumption. Additionally, consumer
and regulatory concern about the lifecycle
environmental and human health impacts of
products is of growing importance. Industry
associations have launched comprehensive
plans to increase industry competitiveness by
driving down costs in manufacturing. The
Agenda 2020 Technology Alliance partnered
with the U.S. Department of Energy to reduce
energy consumption in the paper and pulp
industry, including paper container
manufacturers, by 25 percent from a 2002
baseline by 2020.36 In the U.S., other corporate
and industry association initiatives have been
developed to increase the availability of
recycling programs for all forms of
containers.37; 38; 39 Some major beverage
companies are developing new bio-plastic
materials made from renewable resources, such
as plants.40; 41
Financial analysis of containers and packaging
companies focuses on prices of commodity
inputs, including wood fiber, aluminum, steel,
I N D U S T R Y B R I E F | C O N T A I N E R S & P A C K A G I N G |5
and plastics. The drivers of product shipment
volumes will help determine expected
profitability, depending on the margins typically
earned on each major product line. These
drivers include consumer spending, the activity
of major customers, and demand in major
markets, factors that may not correlate with
each other. Due to the industry’s global
exposure, foreign exchange fluctuations will
also impact profits.42
LEGISLATIVE AND REGULATORY TRENDS IN THE CONTAINERS & PACKAGING INDUSTRY
Regulations in the U.S. and abroad represent
the formal boundaries of companies’
operations, and are often designed to address
the social and environmental externalities that
businesses can create. Beyond formal
regulation, industry practices and self-
regulatory efforts act as quasi-regulation and
also form part of the social contract between
business and society. In this section, SASB
provides a brief summary of key regulations
and legislative efforts related to this industry,
focusing on social and environmental factors.
SASB also describes self-regulatory efforts on
the part of the industry.
The Containers & Packaging industry is subject
to regulation by various agencies at the federal,
state, and local levels. Generally, regulations
address the industry’s environmental
externalities and product safety issues.
Furthermore, voluntary efforts by companies
are driving shifts in production and product
design.
The U.S. Environmental Protection Agency
(EPA) regulates air and water pollution in the
industry. Air emissions are regulated under the
Clean Air Act (CAA) of 1970. The National
Emission Standards for Hazardous Air Pollutants
(NESHAP), issued under the CAA, established
specific hazardous air emissions thresholds for
industrial facilities, including specific thresholds
for furnaces and boilers used to produce
containers and packaging products. Key groups
of regulated air pollutants include Criteria Air
Pollutants (CAPS), Hazardous Air Pollutants
(HAPS), and Volatile Organic Compounds
(VOCS). Companies that emit pollutants above
threshold levels must apply for state permits,
and may be required to install Maximum
Achievable Control Technology (MACT).43
Additionally, under the EPA’s Greenhouse Gas
Reporting Program (GHGRP), facilities emitting
more than 25,000 metric tons of carbon
dioxide equivalent (CO2e) must report total
greenhouse gas (GHG) emissions. The GHGRP is
designed to collect data to inform future policy
decisions, including programs to reduce
emissions.44 Although there are currently no
federal carbon emissions reduction regulations
in the U.S., certain states and regions have
implemented carbon cap-and-trade programs
to reduce emissions. The most prominent
example is California’s GHG reduction law,
commonly known as AB 32, which took effect
I N D U S T R Y B R I E F | C O N T A I N E R S & P A C K A G I N G |6
in January 2012. The program introduced an
emissions cap for industrial and other major
emitters, which will be reduced by
approximately three percent annually. Facilities
must reduce emissions or offset them by
obtaining emissions credits.45 International
GHG regulation may also affect the industry. In
Canada, Quebec Province maintains a cap-and-
trade program for industrial entities that emit
25,000 metric tons or more of CO2e annually.46
The Clean Water Act (CWA) of 1972 set water
discharge quality requirements for industrial
sources, including paper, plastic, metal, and
glass container manufacturing facilities. The
Resource Conservation and Recovery Act
(RCRA) directs the EPA to track hazardous
wastes from “cradle to grave,” and included
solid waste in its definition of hazardous
wastes. The Comprehensive Environmental
Response, Compensation, and Liability Act
(CERCLA, or “Superfund”) established
regulations for funding the remediation of
current and past discharges of CERCLA-listed
hazardous wastes, as well as measures to
mitigate hazardous waste disposal. The EPA has
the authority to levy fines against entities that
do not comply with the above regulations, and
the agency may also require violators to make
necessary adjustments to processes or
equipment in order to achieve compliance.47
Regulations directed at product safety are
designed to protect human health. The U.S
Food and Drug Administration (FDA) regulates
and sets standards for food packaging and
labeling.48 The FDA monitors the health impact
of chemicals used in containers, and can set
limitations or ban chemicals with demonstrated
negative health impacts. Bisphenol-A (BPA) is
one substance that has been banned at high
levels in some, but not all, forms of beverage
containers.49; 50 In the European Union (E.U.),
legislation has established migration limits for
materials that come into contact with food; for
example, that the material cannot transfer its
components into the food in unacceptable
quantities. For plastic materials, rules set
specific migration limits for individual
substances, which are determined through a
toxicological evaluation.51
Post-consumer containers and packaging
contribute a significant portion of waste to
landfills every year. Companies that operate in
many E.U. countries are regulated by recycling
directives related to Extended Producer
Responsibility (EPR).52 These directives make
container and packaging companies financially
responsible for ensuring that their products are
properly recycled and disposed of at the end of
life. These directives are credited with
improving the recycling rates of various forms
of post-consumer packaging, although they
have been found to lead to higher costs for the
producing companies, as EPR shifts a portion of
the financial burden of recycling from
municipalities to packaging producers.53
While no direct EPR laws for containers and
packaging currently exist in the U.S., there has
been proposed legislation around the topic,
I N D U S T R Y B R I E F | C O N T A I N E R S & P A C K A G I N G |7
and container deposit laws in eight of the ten
states that have them are similar to EPR
programs.54 Furthermore, there have been
multiple voluntary industry-led initiatives to
improve the recycling rates of various materials.
The American Forest & Paper Association
launched its Better Practices, Better Planet 2020
initiative in part to increase the recycling rate of
paper products, which may lower raw materials
costs for producers.55
Companies in the industry may have to
navigate municipal packaging bans that could
have a substantial impact on operations. Bans
have arisen due to consumer concerns over
chemical leaching, environmental pollution by
plastic packaging, and use of fossil
hydrocarbon feedstocks. Cities including San
Francisco and Portland have entirely banned
the use and sale of plastic bags.56; 57 San
Francisco also banned the sale of plastic
disposable water bottles on city-owned
property.58 If more cities follow, these bans may
have detrimental effects for plastic packaging
and present opportunities for other materials.
Voluntary third-party raw materials sourcing
certification standards for materials used to
manufacture containers and packaging have
gained acceptance in recent years, as demand
for environmentally and socially sustainable
products has grown. The most common
certifications address wood and wood fiber
sourcing, while aluminum certification has also
gained acceptance at major companies.
Certification is undertaken throughout the
entire paper supply chain, from timber
harvesting to paper product manufacturing.
The Programme for the Endorsement of Forest
Certification (PEFC)59 is the world’s largest
timber certification organization by total
certified forest area. Other standards of note
include the Forest Stewardship Council (FSC) 60
and Sustainable Forestry Initiative (FSI).61
The Aluminum Stewardship Initiative (ASI) is a
voluntary standard that promotes responsible
and transparent practices throughout the
aluminum supply chain, including addressing
environmental externalities such as biodiversity
loss.62
Lastly, companies in this industry are subject to
the conflict minerals disclosure rule of the
Dodd-Frank Act of 2010 and subsequent rules
adopted by the U.S. Securities and Exchange
Commission (SEC). Companies are required to
publicly disclose their use of “conflict minerals”
if they are “necessary to the functionality or
production of a product” that the company
manufactures or contracts to be manufactured.
These minerals include tantalum, tin, gold, or
tungsten originating in the Democratic Republic
of the Congo (DRC) or adjoining countries.63
I N D U S T R Y B R I E F | C O N T A I N E R S & P A C K A G I N G |8

SUSTAINABILITY-RELATED RISKS AND OPPORTUNITIES
Industry trends and recent regulations suggest
that traditional value drivers will continue to
impact financial performance. However,
intangible assets such as social, human, and
environmental capitals, company leadership
and governance, and a company’s ability to
innovate to address these issues are likely to
increasingly contribute to financial and business
value.
Broad industry trends and characteristics are
driving the importance of sustainability
performance in the Containers & Packaging
industry:
• Use of common capitals: Containers
and packaging companies use natural
capital inputs including energy and raw
materials. Raw material extraction and
energy production generate
environmental and social externalities,
while environmental pressures such as
climate change and corresponding
increased regulatory pressure could
lead to higher costs or an unstable
supply of these resources.
• Negative environmental
externalities: Externalities of
containers and packaging
manufacturing include GHG emissions,
air and water pollution, and waste
generation. Increasingly stringent
environmental regulation could
increase operating costs.
• Social license to operate: Increasing
consumer awareness of potential
adverse long-term health effects from
chemicals in containers and packaging
can affect the industry’s social license
to operate.
As described above, the regulatory and
legislative environment surrounding the
Containers & Packaging industry emphasizes
the importance of sustainability management
and performance. Specifically, recent trends
suggest a regulatory emphasis on
environmental protection, product safety, and
product lifecycle management, which will serve
to align the interests of society with those of
investors.
The following section provides a brief
description of each sustainability issue that is
likely to have material implications for
companies in the Containers & Packaging
industry. This includes an explanation of how
the issue could impact valuation and evidence
of actual financial impact. Further information
on the nature of the value impact, based on
SASB’s research and analysis, is provided in
Appendix IIA and IIB.
Appendix IIA also provides a summary of the
evidence of investor interest in the issues. This
is based on a systematic analysis of companies’
10-K and 20-F filings, shareholder resolutions,
and other public documents, which highlights
I N D U S T R Y B R I E F | C O N T A I N E R S & P A C K A G I N G |9
the frequency with which each topic is
discussed in these documents. The evidence of
interest is also based on the results of
consultation with experts participating in an
industry working group (IWG) convened by
SASB. The IWG results represent the
perspective of a balanced group of
stakeholders, including corporations, investors
or market participants, and public interest
intermediaries.
The industry-specific sustainability disclosure
topics identified in this brief are the result of a
year-long standards development process,
which takes into account the aforementioned
evidence of interest, evidence of financial
impact discussed in detail in this brief, inputs
from a 90-day public comment period, and
additional inputs from conversations with
industry or issue experts.
A summary of the recommended disclosure
framework and accounting metrics appears in
Appendix III. The complete SASB standards for
the industry, including technical protocols, can
be downloaded from www.sasb.org. Finally,
Appendix IV provides an analysis of the quality
of current disclosure on these issues in SEC
filings by the leading companies in the industry.
ENVIRONMENT
The environmental dimension of sustainability
includes corporate impacts on the environment.
These impacts could stem from the use of
natural resources as inputs to the factors of
production (e.g., water, minerals, ecosystems,
and biodiversity) or environmental externalities
and harmful releases in the environment, such
as air and water pollution, waste disposal, and
GHG emissions.
Containers and packaging manufacturing
generates environmental externalities through
energy consumption and materials processing.
These processes generate GHG and other air
emissions, which contribute to global climate
change and can be harmful to human health
and the environment. Furthermore, the industry
faces water management issues related to the
quantity used and quality of effluents. Lastly,
companies in this industry produce wastes from
manufacturing that are potentially harmful to
the environment and can result in pollution
abatement costs or regulatory penalties.
Overall, these environmental externalities can
cause concern among local communities and
regulators, possibly leading to more stringent
regulations or reputational harm.
Greenhouse Gas Emissions
The Containers & Packaging industry generates
relatively high GHG emissions within its
manufacturing sector. Fossil fuels comprise a
significant share of energy use in the
Containers & Packaging industry.64 Common
fuel types include natural gas, coal, and fuel
oil.65 Emissions intensity will vary based on the
type of fuel used and the type of product
produced.
I N D U S T R Y B R I E F | C O N T A I N E R S & P A C K A G I N G |10

Containers and packaging companies generate
significant direct greenhouse gas emissions,
which contribute to climate change. These
emissions create regulatory compliance costs
and risks for the industry, as large industrial
emitters face greater likelihood of targeted
emissions regulation. Greenhouse gas emissions
stem from both materials transformation and
direct process energy consumption.II The
emissions profile of a company will vary based
upon product and fuel type. In general, the
manufacture of paper, plastic, glass, and metal
products from raw materials will be more
emissions-intensive than assembly of pre-
manufactured components. As GHG
regulations become more stringent worldwide,
the industry is likely to face increasing costs
and risks related to regulatory compliance.
On the contrary, GHG reduction through
improved energy efficiency, use of cleaner-
burning fuels or alternative energy, and other
process advances can lead to lower costs and
reduced operating risks. Company performance
in this area can be analyzed in a cost-beneficial
way internally and externally through the
following direct or indirect performance metrics
(see Appendix III for metrics with their full
detail):
• Gross global Scope 1 emissions,
percentage covered under a regulatory
program; and
II Indirect GHG emissions resulting from purchased electricity consumption are addressed through the following Energy
• Description of long-term and short-
term strategy or plan to manage Scope
1 emissions and emissions reduction
targets, and an analysis of performance
against those targets.
Evidence
According to the GHGRP’s emissions data by
North American Industry Classification System
(NAICS) code,66 the Containers & Packaging
industry emitted more than 4.5 million tons of
CO2e in 2013. However, the industry’s
emissions reported to the EPA GHGRP give an
incomplete picture of total emissions, as
facilities emitting less than 25,000 tons of
GHGs are not required to report, and many of
the paper container segment’s emissions are
reported together with the vastly higher pulp
and paper industry’s emissions, addressed in
SASB’s Forestry & Paper industry.67
The glass manufacturing segment is a
significant emitter of GHGs, especially CO2.68
Glass container manufacturing requires
volatilization of raw materials to produce glass,
requiring intense energy, primarily in the form
of natural gas. The volatilization of materials
also produces non-energy process emissions in
addition to energy-related emissions.69 By one
estimate, the emissions from the production of
one kilogram of glass in a natural gas-fired
furnace produces nearly 0.6 kg of CO2.
Approximately 0.45 kg of this figure comes
Management issue, due to the differing channels of impacts on company value.
I N D U S T R Y B R I E F | C O N T A I N E R S & P A C K A G I N G |11
from fuel combustion, while the remainder
comes from the dissociation of carbonate raw
material.70 Furthermore, the use of recycled
glass, or cullet, and the type of glass can affect
the quantity of GHGs emitted. For each
percentage increase in cullet as a share of raw
material, energy use may be lowered by
between 0.15 and 0.3 percent. However, some
products require high quality glass thus cullet
cannot not be used.71
In the U.S. and abroad, regulations directed at
curbing GHG emissions from point sources may
increase costs for container and packaging
manufacturers. These include cap-and-trade or
other carbon emissions reduction programs
implemented in the E.U., Australia, New
Zealand, Brazil, California, and Quebec, as well
as proposals to implement similar federal
programs in the U.S. Company financial
disclosure alludes to the potential for material
risks from these regulations: Owens-Illinois, a
major glass container producer, states in
reference to the E.U. ETS and proposed U.S.
federal cap-and-trade programs that,
“…should the regulators significantly restrict
the number of emissions allowances available,
it could have a material effect in the
future…The EPA regulations, if preserved as
proposed, could have a significant long-term
impact on the Company's U.S. operations.”72
Further, RockTenn warns in its FY 2014 Form
10-K that “Enactment of the Quebec cap-and-
trade program may require expenditures to
meet required GHG emission reduction
requirements in future years. Such
requirements also may increase energy costs
above the level of general inflation and result in
direct compliance and other costs.”73
Value Impact
Managing GHG emissions can directly affect
the cost structure of companies in the industry.
Specifically, mandated regulatory emissions
reductions can increase operational costs and
capital expenditures and may result in fines for
non-compliance. At the same time, reducing
emissions through improved energy efficiency,
the use of renewable energy, or other process
improvements can create operational efficiency,
reduce costs, and protect companies from
further regulations that limit or put a price on
emissions. These measures can also reduce
business uncertainty and, therefore, lower the
cost of capital.
As international and national climate change
mitigation efforts continue, the probability and
magnitude of these impacts are likely to
increase in the near to medium term.
The magnitude of regulatory impacts can be
estimated using companies’ Global Scope 1
GHG emissions and the ratio of those covered
by regulatory programs. GHG mitigation
strategies and targets constitute forward
looking indicators of a company risk exposure
to stringent emissions reduction schemes,
which could significant impact high emitters in
the form of taxes or cap-and-trade.
I N D U S T R Y B R I E F | C O N T A I N E R S & P A C K A G I N G |12
Air Quality
In addition to GHGs, container and packaging
manufacturing facilities may release regulated
air emissions, which are closely linked with
local human health impacts. These emissions
include SOx NOx, carbon monoxide, PM10 and
PM2.5, chlorine dioxide, and others. Exposure to
some of these substances has been linked to
decreased pulmonary function and fatal
diseases.74; 75 The sources of emissions from
containers and packaging manufacturing
facilities include, among others, cogeneration
fuel boilers, raw material volatilization, and
process engines.76 Glass container
manufacturers are large producers of
hazardous nitrogen oxides and sulfur dioxide
emissions, which are emitted from glass
furnaces.77 The manufacturing of paper
products also releases air emissions, particularly
if facilities are vertically integrated and include
paper pulp processing.
Such air emissions generate regulatory risk,
particularly for companies with intensive
manufacturing operations, though that risk
may vary depending on local air regulation,
Companies must ensure that facility emissions
at least comply with standards. Non-compliance
can result in fines and may require the
installation of emissions-reduction equipment.
Additionally, the industry may face future risks
from currently unregulated air emissions, or
emissions below regulatory thresholds, as
public and regulatory concern over air quality
drive more stringent legislation or regulatory
action.
Company performance in this area can be
analyzed in a cost-beneficial way internally and
externally through the following direct or
indirect performance metrics (see Appendix III
for metrics with their full detail):
• Air emissions for the following
pollutants: NOx (excluding N2O), SOx,
particulate matter (PM), and volatile
organic compounds (VOCs).
Evidence
According to the EPA 2014 National Emissions
Inventory, the Containers & Packaging industry
accounts for relatively substantial emissions of
certain compounds. According to EPA data, the
industry in 2013 accounted for approximately
four percent of all VOC emissions and two
percent of total chromium emissions from all
industrial processes.78 Emissions of other
hazardous substances, although at lower
quantities, present similar operational risks.
Air pollution mitigation measures require
operating costs as well as capital expenditures.
According to data from the EPA’s 2005
Pollution Abatement Costs and Expenditures
(PACE) survey, the Containers & Packaging
industry had air pollution abatement operating
costs of $320 million, accounting for nearly 3.7
percent of the total for all manufacturing
industries. The PACE data further shows that
air pollution abatement capital expenditures hit
I N D U S T R Y B R I E F | C O N T A I N E R S & P A C K A G I N G |13
$55 million, approximately 1.4 percent of the
manufacturing sector total.79; 80
Air emissions regulations are becoming more
stringent over time, increasing the industry’s air
pollution mitigation costs. The EPA recently
issued a new rule setting limits on emissions
from industrial and commercial power boilers,
traditionally used in industries that use
cogeneration techniques to generate their own
power. The new rule, labeled the Boiler MACT,
is aimed at reducing the amount of hazardous
air pollutants from industrial and commercial
boilers and process heaters. The rule impacts all
industrial manufacturers, including
manufacturers of containers and packaging.81
Pursuant to the new regulation, RockTenn
anticipates that it will spend $55 million in total
capital expenditures due to Boiler MACT
compliance over several years.82
Companies warn investors of potential financial
impacts from pending air emissions regulation
in financial disclosure. In its 2014 Form 10-K,
International Paper states, “Regulations
addressing specific implementation issues
related to the SO2 NAAQS are being developed
by the EPA and are expected to be finalized
during the next two years. Potentially material
capital investment might be required in
response to these emerging requirements.”83
Companies can face regulatory penalties and
required equipment upgrades as a result of
violation of air pollution regulation. In 2010,
the U.S. Department of Justice fined Saint-
Gobain, a large French multinational glassware
producer, $2.25 million and required the
company to install $112 million worth of new
air pollution control equipment that will reduce
the company’s NOx and SOx emissions by 38
and 201 tons per year, respectively.84
Furthermore, in December 2012, a U.S. glass
container manufacturer agreed to pay a $1.45
million fine and install $37.5 million of air
pollution control equipment for violations of
the CAA. The new equipment will target NOx,
SOx, and PM emissions, reducing emissions by
an estimated 2,500 tons per year.85
Manufacturing methods that lower air
emissions can mitigate regulatory risks. For
example, in glass manufacturing, increased use
of cullet, lower furnace temperatures, and use
of low sulfur fuels can lower PM emissions.
Similarly, sulfur dioxide emissions can be
reduced by using low sulfur fuels, such as
natural gas, and reducing sodium and calcium
sulfate levels in raw material batches.
Additionally, pollution control equipment
including emissions scrubbers can likewise
reduce emissions. Such equipment is commonly
required at industrial facilities in order to
comply with air emissions regulation.86
Value Impact
Management of air emissions can have an
ongoing impact on the operational efficiency
and cost structure of companies, as well as
one-time effects on cash flows from regulatory
fines and litigation.
I N D U S T R Y B R I E F | C O N T A I N E R S & P A C K A G I N G |14
Harmful air emissions from operations may
result in regulatory penalties, higher regulatory
compliance costs, or new capital expenditures
to install the best-in-class control technology.
Companies may also face legal challenges from
the local population or other businesses,
resulting in one-time costs and increased
contingent liabilities. Financial impacts of air
pollution will vary depending on the specific
location of companies’ operations and the
prevailing air emissions regulations, which may
be less developed in some regions and
countries than others.
As concerns about the health effects of air
emissions grow around the world, the
probability and magnitude of impacts from this
issue are likely to increase.
The quantity of key pollutants emitted is an
indicator of a company’s operational efficiency
and its success in mitigating regulatory risk and
one-time costs associated with harmful
emissions.
Energy Management
Containers and packaging companies are
reliant on energy as a primary input for value
creation, due to their energy intensive
operations. Energy is derived primarily from the
direct combustion of fossil fuels and the
electrical grid. Purchased electricity is used to
power manufacturing machinery in the
industry. The paper and metal container
segments are particularly reliant on electrical
energy, while glass container manufacturing
requires relatively more energy in the form of
heat, but also consumes electrical power.87 This
energy-intense production has regulatory
implications due to Scope 1 GHG emissions
from direct fossil fuel use. These financial risks
were discussed earlier under the topic of
“Greenhouse Gas Emissions.” However, Scope
2 emissions from purchased electricity can
result in indirect risks, as regulations limiting
the emissions of electrical utilities may result in
higher costs for electricity customers. The
Containers & Packaging industry’s high
electricity consumption thus creates possible
impacts on company value through increased
operating costs. The tradeoff between on-site
versus grid-sourced electricity and the use of
alternative energy can play an important role in
influencing both the costs and reliability of the
energy supply. The use of cogeneration to
produce electrical energy onsite presents the
industry with an additional tradeoff: Increased
cogeneration will typically raise direct GHG
emissions, but reduce indirect emissions
through lowered grid electricity purchases.
The long-term prospects of increased demand
from the developing world, as well as concerns
about energy security, climate change, and the
use of nuclear energy, suggest increasing
upward pressure on price and availability of
conventional sources of electricity. As a result,
the way in which a containers and packaging
company manages its overall energy efficiency,
its reliance on different types of energy and
associated sustainability risks, and its ability to
I N D U S T R Y B R I E F | C O N T A I N E R S & P A C K A G I N G |15
access alternative sources of energy, can have
long-term financial implications that affect
value creation.
Company performance in this area can be
analyzed in a cost-beneficial way internally and
externally through the following direct or
indirect performance metrics (see Appendix III
for metrics with their full detail):
• Total energy consumed, percentage
grid electricity, percentage renewable.
Evidence
Overall energy costs are a key component of
manufacturing costs for companies in the
Containers & Packaging industry. According to
data from the 2011 U.S. Census Bureau Annual
Survey of Manufacturers (ASM), the facilities
representing the Containers & Packaging
industry accounted for approximately four
percent of the manufacturing sector’s total
purchased electricity consumption. The cost of
purchased electricity accounted for three
percent of the total cost of materials and value
added for the industry.88 Purchased electricity
accounted for approximately 2.6 percent of the
total cost of materials and 3.6 percent of value
added. The industry’s purchased electricity
costs of nearly $2.3 billion are greater than its
purchased fuel costs.89 As net income margins
tend to be low in the industry, cost savings
from effective energy management, particularly
in terms of purchased electricity, can be a key
competitive factor.
For many packaging companies, energy costs
are addressed in financial disclosure as a key
risk and a possible material financial concern.
For example, Owens-Illinois, a major glassware
manufacturer, reports that energy accounts for
between 10 and 25 percent of its total
manufacturing costs.90 Sonoco Products, a
diversified manufacturer, states in its 2013
Form 10-K that “Some of our manufacturing
operations require the use of substantial
amounts of electricity and natural gas, which
may be subject to significant price increases as
the result of changes in overall supply and
demand and the impacts of legislation and
regulatory action,” and, “we could suffer
adverse effects to net income and cash flow
should we be unable to either offset or pass
higher energy costs through to our customers
in a timely manner or at all.”91 International
Paper similarly discusses the link between
regulatory action and energy prices, stating
that “Other sites that we operate in the EU
experience indirect impacts of the EU ETS
through purchased power pricing…”92 This
disclosure highlights the importance of
effective energy management and explains why
some companies are implementing strategies to
improve their energy efficiency.
Companies can implement energy-efficient
technologies in order to reduce electricity-
related energy expenses. Companies in the
containers and packaging industry are
implementing various techniques to improve
their overall energy efficiency, including
cogeneration. It is important to note that
I N D U S T R Y B R I E F | C O N T A I N E R S & P A C K A G I N G |16
cogeneration can increase emissions of GHGs
and other air pollutants; thus there are
tradeoffs between energy management and
other important environmental issues. In 2013,
RockTenn invested more than $68 million in a
new biomass boiler at an Alabama plant that
will use facility waste to generate electricity and
steam. The project will allow the plant to
produce as much as 87 percent of its own
energy and comply with the new EPA Boiler
MACT rule.93 Additionally, MeadWestvaco
invested $285 million in a biomass boiler
upgrade at its Virginia plant, allowing the plant
to become self-sufficient in electrical and steam
power, lowering operating and maintenance
costs.94 A capital investment of $44,000 to
modify a fan system at a Louisiana-Pacific
board mill resulted in annual savings of roughly
2.5 million kWh, or $85,000 in electricity
costs.95 Companies are also lowering energy
costs by using waste process materials as a
source of energy, a concept which is discussed
in further detail below.
Value Impact
Management of energy efficiency, energy
independence and energy-mix (including
renewable energy) is key to the profitability and
risk profile of containers and packaging
companies.
Cost savings can be achieved through energy
efficiency as well as energy source
optimization. At the same time, efforts to
improve energy efficiency or reduce
dependence on specific types of energy can
require additional capital expenditures. While
the cost of energy consumption is already
captured in financial results, overall energy
consumption levels provide a sense of firms’
exposure to possible future increases in energy
prices, resulting from energy providers
internalizing the growing environmental and
social impacts of energy generation and
consumption.
As a portion of operating costs for containers
and packaging companies come from
purchased electricity, decisions about on-site
versus sourced electricity and diversification of
energy sources can also influence the volatility
and price of energy costs. This can have an
impact on long-term profitability and ultimately
the risk profile and cost of capital.
Increasingly stringent environmental regulation
is likely to increase the probability and
magnitude of these impacts in the medium
term.
The more purchased fuels and electricity a
company uses from traditional sources of
energy, the more vulnerable it is to rising prices
of specific energy sources and the indirect
impact of costs from internalization of carbon
prices by utilities. The use of independent
energy sources (non-grid) also indicates a
degree of control and a company’s ability to
provide continuous energy for its facilities. The
percentage energy from renewables indicates a
firm’s ability to mitigate its environmental
I N D U S T R Y B R I E F | C O N T A I N E R S & P A C K A G I N G |17
footprint, its exposure to energy costs increase,
as well as its energy independence.
Water Management
Containers and packaging production is water-
intensive. Water is consumed during raw
materials preparation, cooling, and product
cleaning.96 As a result, companies both require
ample stable water supplies and produce
wastewater, which is reused, treated and
discharged into the environment, or lost
through evaporation. Process water may
accumulate contaminants. Contaminated water
effluent can result in oxygen depletion of
receiving waters, aquatic pH fluctuations,
accumulation of persistent organic chemicals in
the ecosystem, eutrophication from nutrient
loading, and contamination with suspended
solids, including heavy metals.97; 98 Water
contamination can generate regulatory risk,
including penalties for violations, higher
treatment and permitting costs, capital
requirement for alternative water supplies, and
tension with other local water users.
In addition to water contamination, the
industry faces possible issues surrounding water
availability. Water is becoming a scarce
resource around the world, due to increasing
consumption from population growth and
rapid urbanization, as well as climate change.
Furthermore, water pollution in developing
countries makes available water supplies
unusable or expensive to treat. Based on recent
trends, it is estimated that by 2025 important
river basins in the U.S., Mexico, Western
Europe, China, India, and Africa will face severe
water problems as demand overtakes
renewable supplies. Many important river
basins can already be considered “stressed.”
Water scarcity can result in higher supply costs,
supply disruptions, and social tensions, which
companies across different industries,
particularly water-intensive ones, will need to
contend with.99
Companies can adopt various strategies to
address water supply and treatment issues,
such as recycling process water, improving
production techniques to lower water intensity,
and managing water effluent.
Company performance in this area can be
analyzed in a cost-beneficial way internally and
externally through the following direct or
indirect performance metrics (see Appendix III
for metrics with their full detail):
• Total water withdrawn, percentage in
regions with High or Extremely High
Baseline Water Stress and percentage
recycled water usage; and
• Number of incidents of non-compliance
with water quality permits, standards,
and regulations.
Evidence
The Containers & Packaging industry is
relatively water intensive. A 2013 ranking of
130 Global Industry Classification System sub-
industries by water value-added, placed the
I N D U S T R Y B R I E F | C O N T A I N E R S & P A C K A G I N G |18
paper packaging industry in the top 15
industries, with nearly six cubic meters of water
per dollar of output. Water value-added was
measured by cubic meters of water
consumption per dollar of output. Together,
glass and metal container manufacturing are
among the top 50 sub-industries, using
approximately 4.5 cubic meters per dollar of
output.100
The contamination of process water can require
treatment-related operating costs and capital
expenditures, as well as potentially cause
tension with other local water users. According
to data from the EPA’s 2005 Pollution
Abatement and Capital Expenditures survey,
the water pollution abatement operating cost
of the Containers & Packaging industry was
approximately $161 million.101 This represents
approximately 2.4 percent of the U.S.
manufacturing sector’s total water pollution
abatement operating costs.102 Individual
companies have achieved cost savings by
implementing technologies to improve
wastewater treatment. At one facility,
RockTenn implemented a microorganism water
treatment system that allowed the company to
avoid municipal water treatment fees of
$500,000 a year; the system also creates
methane gas that is later resold, resulting in
total savings in excess of $1 million a year for
their Solvay, NY containerboard mill.103
Operations that rely heavily on water and are
located in water scarce regions are at particular
risk as concerns over water scarcity mount. For
example, operations located in California may
face hurdles associated with water
consumption due to drought concerns.104
California alone accounts for 10.2 percent of
paper and cardboard box production in the
U.S.105 Much of the state’s water supply is
considered to be at very high risk, and cities
like Los Angeles and San Francisco are
concerned about sustaining long-term water
demand.106; 107
Companies have implemented water efficiency
and reduction goals to reduce their total
exposure to water risks. Companies have also
started to disclose operations located in water
scarce regions to contextualize this issue in
their sustainability reports. Amcor Australia, a
producer of rigid plastic and paper products,
used the World Business Council for
Sustainable Development Global Water Tool to
determine that the company operated 34 sites
in water stressed and water scarce regions
around the world. Eleven of the sites were
covered under the company’s water
consumption targets, and the remaining 23
were under further evaluation to determine
appropriate consumption targets.108 Ball Corp.
recognizes that some facilities are located in
water scarce regions in China, South America,
the United States, and Europe. The company
has committed to improving water use
efficiency throughout its can operations by 7.2
percent a year.109 Similarly, RockTenn has set a
goal of reducing its water discharge by 12
percent from 2009 levels by 2020.110
I N D U S T R Y B R I E F | C O N T A I N E R S & P A C K A G I N G |19
Value Impact
Managing water consumption and wastewater
can influence companies’ operational risks,
with potentially acute impacts on value from
disruptions to production. Water use and
contamination can also affect ongoing
operating costs and impact cash flows through
one-time capital expenditures or regulatory
penalties.
More efficient use of water over time could
generate cost savings and lower operating
expenses. Large water withdrawals create
operational risks related to price and
availability. Water shortages could create
additional permitting requirements, thereby
increasing operating costs. In water stressed
regions, water-intensive production could have
an impact on the long-term revenue growth
and risk profile of a company, and therefore its
cost of capital.
Water treatment may require capital
expenditures on treatment equipment or
facilities, as well as increased operating costs to
run and maintain them. Third-party water
treatment costs could rise if it is outsourced.
Community tension arising from water
contamination or excessive use of local water
resources could adversely affect a company’s
reputation or license to operate, potentially
affecting revenues or operating costs.
As regulations become more stringent over
time, and water resources become increasingly
stressed due to climate change and other
pressures, the probability and magnitude of
future financial impacts due to water effluents
and withdrawals are likely to increase.
Total water withdrawn in water stressed
regions shows a company’s exposure to cost
and supply risks. Fines and instances of non-
compliance with water standards and
regulations indicate a company’s management
of water quality, which is suggestive of
regulatory risk over the medium term.
Waste Management
Containers and packaging companies face
regulatory and operational challenges in
managing processing waste. These substances
can be hazardous to human health and the
environment, leading to carcinogenic effects
and adverse environmental impacts like harm to
animal species through accumulation of
substances in tissues. Containers and
packaging production can generate a variety of
wastes, including those categorized as
hazardous. The majority of wastes are by-
products from raw material conversion and
processing. Hazardous wastes include
acetaldehyde, lead, glycol ethers,
formaldehyde, and chromium.111; 112 If not
properly managed, waste generation can
increase the risk of accidental release to the
environment, which may result in regulatory
penalties. In addition, wastes can cause long-
term liability in the form of environmental
cleanup and mitigation expenses, including
those required under the U.S. EPA’s RCRA and
I N D U S T R Y B R I E F | C O N T A I N E R S & P A C K A G I N G |20

CERCLA programs. Although many of these
current liabilities stem from a decades long
legacy of poor waste management practices,
continued waste production results in ongoing
costs and the possibility of future mitigation
requirements.
Companies in the industry can also benefit
from recycling best practices and using
byproduct materials in production. Companies
are implementing retreatment techniques to
reduce costs and reuse raw materials, as well as
using byproducts to generate their own power.
By addressing or exceeding regulatory
requirements and implementing waste
management best practices and recycling
throughout their operations, companies can
reduce regulatory and operational expenses
and mitigate potential risk of community
tension due to localized pollution.
Company performance in this area can be
analyzed in a cost-beneficial way internally and
externally through the following direct or
indirect performance metrics (see Appendix III
for metrics with their full detail):
• Amount of total waste from
manufacturing, percentage hazardous,
percentage recycled.
Evidence
The Containers & Packaging industry generates
processing waste, including waste classified as
hazardous under U.S. environmental
regulations. The 2011 Biennial RCRA Hazardous
Waste Report shows that together, the
converted paper manufacturing (NAICS 3222)
and plastic products (NAICS 3261) industries
generated more than 61,000 tons of hazardous
waste in 2011. These industries were both
ranked in the top 50 industries for hazardous
solid waste generated.113
Waste disposal, especially for hazardous
materials, can represent significant operating
costs. According to data from the 2005 PACE
survey, the paper, glass, and metal container
manufacturing segments of the industry had
combined solid waste pollution abatement
operating costs of $175 million; that figure
accounts for nearly 3.3 percent of the total for
all manufacturing industries. Solid waste
pollution abatement capital expenditures were
$16.4 million.114; 115
On the contrary, waste can be used as raw
materials or for energy production, improving
operational efficiency. For example, materials
including wood fiber and other byproducts
from the paper making process may be used as
a source of biomass energy.116 Other internally
generated byproducts or postindustrial
materials like glass cullet and plastic resins can
be reused in the manufacturing process to
reduce costs and energy needs of the
packaging company.117
Company financial disclosure discusses the risks
presented by waste generation. For example, Sealed Air Corp mentions, “We generate, use
and dispose of hazardous materials in our
I N D U S T R Y B R I E F | C O N T A I N E R S & P A C K A G I N G |21
manufacturing processes. In the event our
operations result in the release of hazardous
materials into the environment, we may
become responsible for the costs associated
with the investigation and remediation of sites
at which we have released pollutants, or sites
where we have disposed or arranged for the
disposal of hazardous wastes, even if we fully
complied with environmental laws at the time
of disposal.”118
Value Impact
The generation of waste impacts operational
efficiency and regulatory risks for containers
and packaging companies. Waste treatment or
disposal results in ongoing operating expenses
related to waste handling. Mishandling of
highly-regulated hazardous wastes can lead to
fines and contingent liabilities from legal
actions, while regulatory agencies may require
additional capital expenditures to reach
compliance.
Conversely, waste management can create
operational efficiencies for companies,
improving long-term cost structure and
profitability.
The quantity of waste generated, including
hazardous, and the percent recycled gives
insight into a company’s operational efficiency
and the potential for regulatory fines and
remedial action, and capital expenditures
related to solid waste pollution abatement.
Past performance on waste management can
be a proxy for future risk, looking at the
number and aggregate quantity of releases and
spills and percent recovered.
SOCIAL CAPITAL
Social capital relates to the perceived role of
business in society, or the expectation of
business contribution to society in return for its
license to operate. It addresses the
management of relationships with key outside
stakeholders, such as customers, local
communities, the public, and the government.
The Containers & Packaging industry is
dependent on a social license to operate, given
the frequent contact between its products and
consumers, either directly or through
consumables. Increasing government and
consumer concerns surrounding the potential
human health impacts of substances in
containers and packaging can have financial
implications for the industry. Harmful
substances in containers and packaging
products, as well as the quality of products, can
have acute and chronic impacts on human
health. These factors can result in product
recalls, litigation, and adverse reputational
impacts for containers and packaging
companies.
I N D U S T R Y B R I E F | C O N T A I N E R S & P A C K A G I N G |22
Product Safety
Product safety is likely a material financial
concern for the Containers & Packaging
industry due to potential impacts on revenue,
regulatory risks, and product recalls and related
litigation. Consumer and regulatory concerns
over human health impacts from substances in
containers and packaging can affect product
demand, as well as result in product recalls and
litigation. Many of the industry’s products
come into frequent contact with consumers,
primarily through food, beverage, and
pharmaceutical packaging. Some packaging
and containers have been found to leach trace
amounts of chemicals into their contents.119
Products made of or containing plastics have
garnered particular attention from consumers
and regulators due to concerns over chemical
leaching.120 These concerns have led to a shift
in consumer preferences and increased
regulatory scrutiny, resulting in shifting product
demand and regulatory bans on certain
chemical substances in regions like the U.S. and
the E.U.121; 122 Furthermore, product safety is
not limited to concerns over chemical
substances – functionality is also a factor; for
example, faulty packaging can allow contents
to spoil. Such instances can result in lost
revenues or litigation brought by the industry’s
customers.
As the Containers & Packaging industry is
primarily a business-to-business industry,
consumer and regulatory concerns over product
safety are manifested indirectly through
demand for the industry’s products and recalls
and litigation. Company performance in this
area can be analyzed in a cost-beneficial way
internally and externally through the following
direct or indirect performance metrics (see
Appendix III for metrics with their full detail):
• Number of recalls and total units
recalled; and
• Discussion of process to identify and
manage emerging materials and
chemicals of concern.
Evidence
Potentially hazardous chemicals can leach from
the packaging into consumables, although
scientific evidence about health impacts in
many cases has been conflicting. Low levels of
formaldehyde, bisphenol-A (BPA), tributyltin,
triclosan, and phthalates and have been found
in food containers and packaging.123 One study
found more than 24,000 chemicals in bottled
water that are considered harmful to human
health, including known carcinogens and
human endocrine disruptors.124 BPA, a
plasticizer used in a number of containers,
including plastic and metal containers, has
garnered much attention due its potential
effects on health. At high levels, BPA has been
shown to cause a number of human health
issues later on in life, including cancer.
However, U.S. regulators have deemed BPA
safe for adults at the current low levels found
in consumables.125
I N D U S T R Y B R I E F | C O N T A I N E R S & P A C K A G I N G |23
In many cases, the health impacts of substances
used in containers and packaging products are
unclear, however consumer safety concerns can
be sufficient to shift demand. For example, due
to consumer pressure, the infant formula
industry had already ceased using BPA in its
packaging in 2013, when the FDA officially
banned it. The FDA implemented the ban due
to the industry’s “abandonment” of BPA
packaging. The decision was not based on
safety.126 This case illustrates the power of
consumer preferences as a determinant of
product demand and regulatory action.
The regulatory environment is dynamic,
introducing uncertainty into the Container &
Packaging industry. In October 2014, the
National Resources Defense Council, the Breast
Cancer Fund, and a number of other consumer
and environmental health groups petitioned the
FDA for a ban on perfluorocarboxylates (PFCs)
used in paper and paperboard food containers,
including pizza boxes. According to the
petition, these chemicals can affect fetal
development, male reproductive systems, pre
and post-natal brain development, as well as
cause cancer.127
Product innovation is an important factor for
addressing uncertainty and staying abreast of
regulatory change. Regarding the use of epoxy
resins containing BPA, Ball Corp. states in its
FY2013 Form 10-K that, “A significant change
in these regulatory agency statements or other
adverse information concerning BPA could have
a material adverse effect on our business…Ball
recognizes that significant interest exists in non
epoxy-based coatings, and we have been
proactively working with coatings suppliers and
our customers to evaluate alternatives to
current coatings.”128
Internationally, regulations concerning BPA are
more stringent. For example, in 2013, France
banned BPA in all packaging and containers
that come into contact with food. The ban is
divided into two phases; the first, which
banned the chemical in all materials coming
into contact with food intended for use by
children ages three years or younger, took
effect on January 1, 2013; the second, for all
food contact materials, took effect on January
1, 2015. The bans may have adversely affected
U.S. exports of packaging products to
France.129 While consumers and companies may
demand new products that do not contain
known hazardous chemicals, there is a risk that
such new products introduced to the market
could contain new, untested, chemicals that do
not solve the underlying issue of potential harm
to human health.130 Therefore, containers and
packaging companies must consider the risks
from the use of known hazardous substances,
but also verify the safety of new chemicals and
materials used in their products. The health
impacts from long-term chronic exposure to
chemicals is largely unknown. Trace amounts of
substances known to be harmful are legal in
low doses – for example, carcinogenic
formaldehyde is widely used in plastic soda
bottles and plastic tableware in low
concentrations. More than 400 other chemicals
I N D U S T R Y B R I E F | C O N T A I N E R S & P A C K A G I N G |24
known to disrupt hormone function are present
in low concentrations in food and drink
packaging, including chemicals like triclosan,
tributyltin, and phthalates. These substances
may not even be included in routine toxicology
analysis.131
Product liabilities related to safety have been
recognized as a key risk to financial operations
in the SEC filings of many containers and
packaging companies. Greif Inc. states in its
2013 Form 10-K, “Our customers in the food
industry are subject to increasing laws, rules
and regulations relating to food safety. As a
result, customers may demand that changes be
made to our products or facilities, as well as
other aspects of our production processes,
which may require the investment of capital.
The failure to comply with these requests could
adversely affect our relationships with some
customers…”132
Regulators may also penalize manufacturers for
producing unsafe packaging. Berry Plastics,
which manufactures pharmaceutical and other
type of packaging, warned in its FY 2014 Form
10-K that U.S. regulators “can require the
manufacturer of defective products to
repurchase or recall such products and may
also impose fines or penalties on the
manufacturer…In addition, laws exist in certain
states restricting the sale of packaging with
certain levels of heavy metals, imposing fines
and penalties for noncompliance.”133
The use of chemical substances in packaging
can result in product recalls—regardless of
merit—due to concerns over impacts on human
health. The costs of recalls by consumer-facing
companies can be passed on to container and
packaging manufacturers through lawsuits and
lost revenue. Canadian packaging
manufacturer Flexible Packaging Corp. (FPC),
wax manufacturer The International Group, and
the Kellogg Company have been engaged in a
multi-year legal case stemming from a 2010
recall of thousands of cereal boxes. The recall,
executed by Kellogg after customer complaints
of offensive odors emanating from the
packaging, as well as cases of nausea and
diarrhea, allegedly cost the company millions.
Kellogg filed suit against FPC, alleging that the
plastic liners it provided contained high
amounts of hydrocarbons that caused the
health impacts. FPC in turn filed a suit against
The International Group, claiming that the
company’s wax used to manufacture cereal box
liners was the source of the hydrocarbons.
Kellogg is seeking more than $75 million in
damages from FPC for recovery of lost
inventory and sales, and reputational
impacts.134
Concern over chemical substances in packaging
is not the only possible factor affecting safety.
Functionally defective products that endanger
human health can likewise result in recalls and
financial impacts. For example, in 2008,
Owens-Illinois produced faulty glass bottles that
led to the recall of some Samuel Adams 12-
ounce beer bottles. The glass bottles had a
I N D U S T R Y B R I E F | C O N T A I N E R S & P A C K A G I N G |25
defect that allowed for small pieces of sand
and glass to break off and fall into the bottle,
which could present a potential hazard for
consumers.135 Boston Beer Co., the producer of
Samuel Adams, eventually agreed to a $20.5
million settlement with Owens-Illinois over the
recall and associated costs, which caused an
estimated $12 million reduction in Boston Beer
Co.’s profits.136
Ultimately, recalls can have an effect on
demand for products. As Sealed Air Corp.
stated in its FY2013 Form 10-K, “We could also
be required to recall possibly defective
products, or voluntarily do so, which could
result in adverse publicity and significant
expenses.”137
Value Impact
Product safety issues can affect containers and
packaging companies financially through
reduced demand for products, damage to
reputation, regulatory action that bans the use
of certain substances in products, and litigation
brought by customers in the event of a product
recall or safety incidents. Potentially harmful
substances in products or product defects can
impact human health and lead to lower
revenues and market share. Legal actions by
customers can result in one-time charges and
contingent liabilities.
Companies may incur research and
development in order to develop safer
products, lowering operating income in the
short term but reducing long term risks from
recalls and potential bans on the use of certain
substances in products. Additionally, companies
that fail to obtain CoC or other certification
could face a higher cost of capital due to the
increased risk of acute adverse impacts from
supply chain disruption or reputational issues.
As consumer safety regulations become more
stringent over time, and awareness of possible
health impacts from chemical substances
grows, the probability and likelihood of
financial impacts is likely to grow.
Past performance on product safety can be
indicative of future performance, looking at the
number of recalls and quantity products
recalled.
A description of existing and emerging
materials of concern contained within products
is a forward-looking indicator of a company’s
risk exposure to possible bans of certain
chemical substances.
BUSINESS MODEL AND INNOVATION
This dimension of sustainability is concerned
with the impact of environmental and social
factors on innovation and business models. It
addresses the integration of environmental and
social factors in the value-creation process of
companies, including resource efficiency and
other innovation in the production process. It
also includes product innovation and efficiency
and responsibility in the design, use-phase, and
I N D U S T R Y B R I E F | C O N T A I N E R S & P A C K A G I N G |26

disposal of products. It includes management
of environmental and social impacts on
tangible and financial assets—either a
company’s own or those it manages as the
fiduciary for others.
Rising public awareness of the environmental
externalities of packaging, including dangers to
wildlife and marine pollution, is driving demand
for more sustainable packaging materials. The
industry’s customers are increasingly
demanding products with improved lifecycle
performance through recyclability, reduced
material use, and the use of more durable or
lighter materials.
Product Lifecycle Management
Containers and packaging material comprises a
significant amount of post-consumer waste,
which is recycled, sent to landfills, or disposed
of into the environment.138 This waste, if sent
to landfills, consumes landfill space and can
generate GHG emissions, while some
packaging materials that end up in the
environment can persist for lengthy periods of
time and cause harm to wild life.139 These
factors have resulted in bans on certain types of
plastic packaging in the U.S. and abroad.140
Additionally, rising global demand for
packaging materials is placing increasing strain
on limited global natural resources, and
contributing to, biodiversity impacts and
environmental pollution. Product end-of-life
management is an important factor
contributing to resource security and the long-
term sustainability of the industry.141
In the U.S., packaging manufacturers do not
typically bear the financial costs of recycling or
the environmental externalities that their
products may create. However, regulatory and
consumer trends suggest that the use of
recycled materials and extended producer
responsibility (EPR) may become more
prevalent, as it is in other markets like the E.U.
Future EPR laws may hold manufacturers
financially liable for product take-back and
recycling. Additionally, customers can garner
financial and sustainability benefits from
innovations such as packaging lightweighting,
which can reduce transportation costs.142 These
benefits can translate into increased demand.
Furthermore, the design of a product can make
it easier or harder to recycle. The addition of
adhesives and metal foils to paperboard
packaging, for example, can make recycling
more difficult.143
Innovation is an important business opportunity
for containers and packaging manufacturers.
Product design for improved recyclability and
reduced environmental impact can have
financial benefits, as recycled materials may be
cheaper than virgin materials, and may also
require less energy and fewer resources to
convert to finished products. Additionally,
increasing demand for environmentally friendly
packaging may present growth opportunities
for the industry.
I N D U S T R Y B R I E F | C O N T A I N E R S & P A C K A G I N G |27
Contrarily, companies may face diminished
demand for products that do not meet
customer needs or regulatory requirements for
recyclability or reduced environmental impacts.
Although containers and packaging companies
may not bear direct financial responsibility for
product waste in some markets, potential bans
on products or shifting consumer preferences
could jeopardize market share and lead to
increased costs.
While the sustainability performance of
products depends largely on the type, use, and
ultimate disposal of materials, companies that
effectively manage the end-of-life
environmental impacts of their products
through some of the innovations discussed
above may be better positioned to capture
shifting customer demand and meet regulatory
trends.
Company performance in this area can be
analyzed in a cost-beneficial way internally and
externally through the following direct or
indirect performance metrics (see Appendix III
for metrics with their full detail):
• Percentage of raw materials from (1)
recycled content (2) renewable
resources;
• Revenue from products that are
reusable, recyclable, and/or
compostable; and
• Description of strategies to reduce the
environmental impact of packaging
throughout its lifecycle.
Evidence
Innovation in product design and access to
recycled materials can help address customer
demand for more environmentally sustainable
products and drive growth in the industry. As
concerns about generated waste and use of
landfill space rise, recycling and recyclability of
containers and packaging materials will play an
important role in the industry’s long-term
development.144 In 2012, containers and
packaging materials represented 30 percent of
total municipal solid waste, or more than 75
million tons of waste. In 2005, total municipal
solid waste generation peaked at more than
250 million tons, while recycling rates have
steadily risen since the 1960s.145 Recycling rates
vary widely for different types of material.
According to EPA figures, 91 percent of
corrugated boxes, 70.8 percent of steel cans,
70 percent of newspaper and mechanical
paper, 54.5 percent of aluminum cans, 34.1
percent of glass containers, 30.8 percent of
polyethylene terephthalate plastic (PET) bottles
and jars, and 28.2 percent of high density
polyethylene plastic bottles were recycled in
2012.146 In the U.S., the amount of recoverable
plastic, steel, glass, aluminum, and paper waste
sent to landfills annually is estimated to be
valued at more than $11 billion, representing a
significant loss of potential feedstock for new
containers and packaging.147
A 2014 report estimated the size of the 2013
global packaging market was $797 billion, a
figure that is expected to rise to $975 billion by
I N D U S T R Y B R I E F | C O N T A I N E R S & P A C K A G I N G |28
2018.148 Of this total, the 2013 sustainable
packaging market, comprised of recyclable,
degradable, and reusable packaging, and
packaging using recycled content and
lightweighting, hit $190 billion in 2013, or
nearly 24 percent of the total. The share of
sustainable packaging is expected to rise to 26
percent by 2018.149 However, the size of the
recycled, degradable, and reusable container
and packaging market was estimated at just
$27 billion in 2014, reflecting a narrower
scope. This smaller market is also expected to
grow four percent annually.150
As there are various hurdles for improving the
recyclability of containers and packaging
materials, including the use of various labels,
inks, and coatings, there may be a disconnect
between packaging designers and current
recycling systems, preventing materials from
being recovered and leading to their disposal in
landfills.151 For example, aseptic cartons, which
are recycled at a 6.5 percent rate, use layers of
paper, plastic and aluminum that require
specific processes to separate. Packaging
designers play a critical role in how a package
is ultimately recycled, which is essential for
developing a closed-loop system for the
packaging material, and can influence
consumers’ understanding of a material’s
sustainability.152,153 Motivated by potential
financial benefits and a desire to improve the
sustainability of their businesses, containers
and packaging companies are partaking in
voluntary efforts to improve the recycling rates
of their products through integrated recycling
efforts and stakeholder outreach. In several of
its markets worldwide, Ball Corp. helps
establish and financially supports recycling
initiatives, including programs to educate
consumers about the benefits of recycling and
collaborate with industry partners to create
collection systems.154 The American Forest and
Paper Association, an industry association with
several large paper container company
members, launched its “Better Practices, Better
Planet 2020” initiative to accelerate recycling
rates of paper packaging by more than 70
percent by the year 2020.155
Container and packaging materials recycling
can lead to financial and environmental
benefits by reducing energy use and resource
intensity.156 Using recycled materials to produce
aluminum cans reduces the embodied energy
of such cans by about 95 percent compared
with products made of virgin materials.157 In
theory, there is no limit to the number of times
materials such as glass and aluminum can be
recycled.158; 159 Similarly, recycling of other
materials such as plastic can reduce embodied
energy by 84 percent, and subsequently reduce
GHG emissions by about 72 percent, compared
to products made with virgin materials.160 The
use of recycled input materials can have
significant benefits for producers. Because
cullet melts at a lower temperature than virgin
materials, manufacturers can use cullet in glass
production to reduce the energy costs
necessary to produce new bottles. Lower
energy costs can translate into improved
profitability.161 As Crown Holdings states in its
I N D U S T R Y B R I E F | C O N T A I N E R S & P A C K A G I N G |29
FY2013 Form 10-K, “By reducing the per-unit
amount of raw materials used in manufacturing
its products, the Company can significantly
reduce the amount of energy, water and other
resources and associated emissions necessary to
manufacture metal containers.”162
In 1994, the European Union launched a
packaging waste directive aimed at improving
recycling rates. The directive called for an EPR
process that makes producers of packaging
materials financially responsible for the end-of-
life management of their products. This
legislation shifted some of the financial burden
off of the taxpayers and internalized the costs
with manufacturers. These EPR programs are
largely credited with helping E.U. countries
reduce the total packaging sent to landfills by
43 percent over an 11-year period.163 In the
U.S., EPR programs would likely increase costs
for manufacturers. A 2014 cost-benefit study
of EPR in Minnesota found that total estimated
costs to producers, including administrative,
educational, and infrastructural costs, would hit
nearly $75 million statewide.164 Companies may
face uncertainty regarding the financial
implications of EPR legislation. In its 2014 Form
10-K, Berry Plastics states that “there can be no
assurance that future legislation or regulation
would not have a material adverse effect on us.
Furthermore, a decline in consumer preference
for plastic products due to environmental
considerations could have a negative effect on
our business.”165
One of the key barriers to improving recycling
rates is a lack of recycling infrastructure for
many forms of packaging.166 Some container
and packaging companies have begun
improving the amount of recycled content in
their products, and have invested in new
infrastructure to secure a steady supply of
recycled materials. As some companies use up
to 90 percent recycled content in new
products, they have a vested interest in
ensuring that raw materials can be recovered
and are not sent to landfills.167
RockTenn, the largest paper recycler in North
America, currently uses 45 percent recycled
fiber in its new paperboard packaging
products. The company sources more than four
out of the nine million tons of recycled fiber it
uses in manufacturing paper products from its
own recycling operations.168 The company also
partners with municipalities to increase
recycling efforts in communities that do not
currently have curbside recycling.169 Owens-
Illinois, the largest glass bottle producer, hopes
to eventually increase its recycled content
average to 60 percent, up from current levels
of 37 percent.170 In 2013, the company
launched a new “Glass to Glass” recycling
joint-venture with eCullet to supply its
Portland, Oregon bottle plant with recycled
materials.171
Beyond legislation, business customers of C&P
companies are demanding that the products
they purchase contain recycled content and
packaging, due to their own customers
I N D U S T R Y B R I E F | C O N T A I N E R S & P A C K A G I N G |30

concerns and preferences. These factors put
more pressure on container and packaging
manufacturers to design recyclable products
and products with higher recycled content.
Colgate-Palmolive, a large consumer products
company and customer of the packaging
industry, recently announced that it would
commit to 100 percent recyclable packaging
and increase-recycled content from 40 percent
to 50 percent by 2020.172 This initiative may put
pressure on Colgate’s largest supplier of
packaging, Nampak, which generates more
than 8 percent of its revenue from Colgate
alone.173 Companies further down the value
stream are also demanding more recycled
content in the products they sell. Walmart,
Colgate’s largest customer, announced a goal
of boosting post-consumer recycled content in
plastic packaging by 3 billion pounds by 2020.
While Walmart does not produce plastic
packaging itself, it hopes to leverage its buying
power to increase demand for more post-
consumer recycled content in the products it
sells to consumers, as well as mitigate affects
from the cost and volatility of packaging
materials.174
Consumer perception of the recyclability and
recycling of containers and packaging products
can shape public perception of the
environmental friendliness of such products,
which can lead to shifts in consumer demand.
For example, the environmental impacts of
plastic water bottles have led to a negative
perception about disposable plastic bottles.175
Such concerns have been a key driver of
regulatory action. More than 100 U.S. cities
have banned polystyrene foam food packaging,
and 28 California municipalities have banned
plastic take-out bags.176 Cities including
Concord, Massachusetts and more than 24
national parks have enacted similar bans.177; 178
These bans may have significant impacts on
containers and packaging sales, especially if
more cities and establishments follow suit. As
Crown Holdings stated in its FY2013 Form 10-
K, “A number of governmental authorities both
in the U.S. and abroad also have enacted, or
are considering, legal requirements relating to
product stewardship, including mandating
recycling, the use of recycled materials and/or
limitations on certain kinds of packaging
materials such as plastics. In addition, some
companies with packaging needs have
responded to such developments, and/or to
perceived environmental concerns of
consumers, by using containers made in whole
or in part of recycled materials. Such
developments may reduce the demand for
some of the Company's products, and/or
increase its costs.”179
New initiatives such as the Bioplastic Feedstock
Alliance, backed by large corporations, are
looking to make progress on creating plastics
out of renewable sources like plants rather than
traditional fossil fuels, helping to lower the
potential negative environmental impact.180
Coca-Cola and PepsiCo have internally
developed PET plastic bottles made from plant-
based polymers as an alternative to plastics.181
Coca-Cola claims to have delivered more than
I N D U S T R Y B R I E F | C O N T A I N E R S & P A C K A G I N G |31
25 billion plant-based plastic bottles, saving
more than 525,000 barrels of oil.182 Innovations
such as these are expected to drive the
sustainable packaging market to $244 billion
by 2018.183 Innovative containers and
packaging manufacturers have the opportunity
to capture this growing market.
Innovations in packaging design and advances
in types of materials used are enabling
containers and packaging companies to address
risks and opportunities related to product
lifecycle environmental impacts. Processes such
as light-weighting or making products more
durable are helping customers save on
transportation and disposal costs, with
associated environmental benefits. Apple Inc.
found that reducing iPhone packaging by 28
percent helped the company ship 60 percent
more boxes in airline containers, reducing the
number of necessary flights.184 By reducing the
amount of material needed in its plastic, glass,
and aluminum cans and bottles, Coca-Cola
estimated cost savings of more than $180
million over a two year period,185 Such savings
and environmental benefits for customers can
make innovative containers and packaging
attractive, increasing demand. Top containers
and packaging companies have innovated in
response to regulation and shifting consumer
demand. In its FY2013 Form 10-K, Sealed Air
states, “Our new venture activities…include the
development of packaging products from
renewable resources. We maintain programs
designed to comply with these laws and
regulations, to monitor their evolution, and to
meet this customer demand.”186
The value of different innovations varies. With
limited resources, companies could benefit
from assessing the types of innovation that
would have the greatest positive environmental
impacts and highest cost savings for their
particular products. Product lifecycle
evaluations can help with such determinations.
For example, Greif Inc., a manufacturer of large
reusable industrial drums and containers,
conducted a lifecycle assessment and found
that instead of lightweighting its containers to
save on transportation and improve
environmental impacts, it saved more money
and improved the product’s environmental
impact by making the containers more durable,
prolonging their useful life.187
Value Impact
Innovations and advances in business models
that address the recyclability and environmental
impacts of containers and packaging can affect
demand for products, operating costs and
increase risk profile.
Demand for recyclable or reusable products is
likely to rise due to consumer preferences and
regulatory requirements. This represents an
opportunity for manufacturers to serve new
markets, expand their share of existing
markets, and charge a premium for their
products.
I N D U S T R Y B R I E F | C O N T A I N E R S & P A C K A G I N G |32
The development of products with sustainable
characteristics, such as lightweight materials or
improved recyclability, will require research and
development expenditures, with short-term
impact on operating income. However, new
products with reduced externalities can result in
increased market share and revenues over the
medium to long term.
At the same time, containers and packaging
companies can benefit from increasing the use
of recycled materials in production, which can
lower their purchase and operating costs. This
could also mitigate potential supply chain
disruption of virgin materials.
Regulations that require manufacturers to
finance the collection, recycling, or reuse of
packaging materials could increase operating
costs. Regulations could also include provisions
for penalties against companies that do not
adhere to EPR laws, resulting in reduced short
term profitability. Additionally, regulations
might require capital expenditures or other
investments to support EPR programs.
As EPR laws and conservation efforts around
recycling are likely to intensify, the probability
and magnitude of financial impacts are likely to
increase in the medium term.
The percentage of products that are recyclable
or reusable indicates a company’s positioning
to meet increased demand and potential future
regulatory requirements. A description of
products’ lifecycle environmental impacts can
give insight into a company’s positioning to
address increasing demand for more
sustainable products. The percentage of
recycled materials used in manufacturing is an
indication of potential future cost savings and
exposure to the risk of supply chain disruption.
LEADERSHIP AND GOVERNANCE
As applied to sustainability, governance
involves the management of issues that are
inherent to the business model or common
practice in the industry and are in potential
conflict with the interest of broader stakeholder
groups (government, community, customers,
and employees). They therefore create a
potential liability, or worse, a limitation or
removal of license to operate. This includes
regulatory compliance, lobbying, and political
contributions. It also includes risk management,
safety management, supply chain and resource
management, conflict of interest, anti-
competitive behavior, and corruption and
bribery.
Containers and packaging companies source
vast amounts of materials, both virgin and
recycled, from thousands of suppliers
worldwide. Environmental or social externalities
from raw material production can manifest
themselves financially in the Containers &
Packaging industry through reduced revenues,
potential supply disruptions, and materials price
increases. Conversely, the market for
I N D U S T R Y B R I E F | C O N T A I N E R S & P A C K A G I N G |33
sustainably-sourced packaging materials
presents a growth opportunity for the industry.
Materials Sourcing
The production of containers and packaging
requires large quantities of raw materials,
including wood fiber, metals, glass, and
plastics. Wood fiber is derived from forests,
metals and glass precursors are sourced from
mines, and plastics are created largely from
petroleum products. Natural resource extraction
activities can result in environmental
externalities such as habitat loss and water and
land pollution, as well as negative social
impacts including labor abuses and adverse
community impacts. The industry also faces
supply chain challenges in the use of conflict
minerals. Companies can face pressure from
legislation, actions by non-governmental
organizations (NGOs), input price risks, and
leadership from peers to track and eliminate
the use of minerals responsible for conflict in
the DRC. To the extent that a manufacturer
uses these minerals in its production processes,
the company is required to provide disclosures
around the origin of the minerals in accordance
with the Conflict Minerals provision of the
Dodd-Frank Act (see the Regulatory Trends
section above). This requires an active
monitoring of the supply chain. Additionally,
the use of tin that may originate from zones of
conflict also exposes companies to regulatory
risks associated with the Dodd-Frank Act.
Due to increasing consumer concern
surrounding these issues, containers and
packaging manufacturers’ customers may not
wish to purchase products from suppliers that
may be associated with negative supply chain
externalities. These associations could reduce
demand for a company’s packaging products.
Furthermore, supply disruptions due to
environmental or social issues in the supply
chain could increase materials purchasing costs
for containers and packaging companies.
In order to mitigate these risks, containers and
packaging companies are implementing
responsible sourcing practices internally and
through the use of third-party supplier
certification. Certification has been most
common for wood fiber—and to a lesser extent
aluminum—substrates that have garnered
particular attention for externalities
surrounding their extraction. Common
certification programs include the Programme
for the Endorsement of Forest Certification
(PEFC)188, the Sustainable Forestry Initiative
(SFI)189, the Forest Stewardship Council (FSC)190,
and the Aluminum Stewardship Initiative.191, All
of these programs aim to verify that materials,
both virgin and recycled, are from suppliers
that consider and manage social and
environmental issues and externalities during
raw material production. Such third-party
certifications are becoming increasingly
important, as customers seek greater chain-of-
custody (CoC) certification of a product. In
addition to supply chain risk management, the
certification of the raw material supply presents
I N D U S T R Y B R I E F | C O N T A I N E R S & P A C K A G I N G |34

revenue and market share opportunities, as
companies can meet growing demand for
sustainably-sourced packaging products.
Supplier engagement and verification of
materials sourcing and chain of custody thus
presents risks and opportunities to container
and packaging manufacturers. Company
performance in this area can be analyzed in a
cost-beneficial way internally and externally
through the following direct or indirect
performance metrics (see Appendix III for
metrics with their full detail):
• Total wood fiber purchased,
percentage from certified sources; and
• Total aluminum purchased, percentage
from certified sources.
Evidence
Raw materials extraction can result in adverse
environmental and social externalities, leading
to financial impacts for the Containers &
Packaging industry.
Nearly 30 percent of forests are used for the
production of forest products. The area of the
world covered by forests is shrinking by an
average of 15,000 hectares per day, due to
conversion to agricultural lands, logging, and
climate change.192 According to the United
Nations Food and Agriculture Organization
(FAO), approximately 57 percent of global
III Primary forests are forests of native tree species that have previously not been disturbed by human activity or have attained significant age without significant disturbance.
forests are naturally regenerated, 36 percent
are primary growth, and 7 percent are planted
forest. Primary forestsIII are especially important
for biodiversity; about 66 percent of terrestrial
species originate from primary forests. Thus,
logging of such forests threatens the existence
of thousands of species, many of which are
endangered.193
The Programme for Endorsement of Forest
Certification (PEFC), one of the largest forest
certification programs in the world, estimates
that forests contribute to the livelihoods of
about 1.6 billion people worldwide, and that
60 million indigenous peoples are fully
dependent upon forests, and a further 350
million people depend on forests for income
and food. Thus, wood harvesting can directly
affect the lives of millions of people,
underscoring the importance of community
inclusion and social issues in all aspects of
operations.194
Through chain of custody certification,
companies in the paper packaging segment can
mitigate the risk for reputational harm while
addressing customer concerns over the
environmental and social impacts of their
supply chains and products. This can lead to an
expansion of revenues for containers and
packaging companies. For wood fiber-based
paper products, CoC certification includes
third-party certifications like the FSC, the SFI,
I N D U S T R Y B R I E F | C O N T A I N E R S & P A C K A G I N G |35
and the Programme for the Endorsement of
Forest Certification (PEFC). In order to achieve
CoC certification, every organization in a
company’s supply chain must independently
obtain third party verification.195 Certification
programs typically set standards for the
protection of biodiversity and ecosystems,
worker’s rights, indigenous peoples’ rights,
local employment, and legal logging
practices.196
Rising consumer demand for sustainably-
sourced packaging is an important industry
driver. A 2012-2013 survey conducted by
TetraPak, a major European paper packaging
company, on a sample of more than 7,000
consumers across 13 countries, found that
consumer demand for sustainably sourced
packaging is on the rise. In the survey, more
than half of consumers trusted environmental
logos, up from 37 percent from the year
before, while 37 percent of consumers reported
searching for environmental certification logos
on packaging. One in five people recognized
the FSC logo.197
McDonald’s notes in its 2013 Responsibility &
Sustainability report that it has a target of
sourcing 100 percent of its consumer-facing
paper fiber-based packaging from third-party
certified or recycled sources by 2020. The
company grew this share from 9.3 percent in
2012 to 13.9 percent in 2013. The company
uses FSC, PEFC, or verified post-industrial or
post-consumer recycled fiber as the acceptable
standards for its internal target.198 International
Paper is a major supplier to McDonald’s; the
company accounted for 1.25 percent of
International Paper’s revenues in 2014.199
According to the American Forest and Paper
Association, in 2012 the association’s
members, which include top containers and
packaging companies, procured 29 percent of
their fiber from certified forestlands, while they
sourced 95 percent of their fiber through
certified fiber sourcing programs All AF&P
members that source wood and fiber must
comply with sustainable procurement
principles, which support reforestation, control
of invasive plants and animals, conservation of
critical habitats, control of illegal logging,
worker safety issues, fair labor practices, and
indigenous people’s rights, or obtain SFI
certification.200 Companies in the paper
containers and packaging segment have goals
and practices in place for responsible sourcing
of virgin and recycled fiber. By 2020, RockTenn,
a founding member of the FSI, is committed to
having all of its wholly owned facilities CoC
certified by third parties. The company holds
that maintaining healthy, productive, and
sustainable forests is beneficial to the
environment, communities, and the company’s
business. In addition to using certified
suppliers, the company also directly encourages
forest landowners to practice sustainable
forestry.201 TetraPak aims to achieve similar
goals of sourcing 100 percent of its fiber from
certified sources.202
Aluminum and tin mining can have particularly
significant adverse social and environmental
I N D U S T R Y B R I E F | C O N T A I N E R S & P A C K A G I N G |36
impacts, with possible effects on the Container
& Packaging industry’s reputation or supplies.
The majority of aluminum ore is mined in
tropical regions, which are areas with high
biodiversity and ecological sensitivity.203
Aluminum mining in such regions can result in
ecological harm due to land clearing,
hazardous waste generation, and air emissions.
Furthermore, many of the aluminum mining
regions are located in developing nations,
where socioeconomic development may be less
advanced, and legal protection of indigenous
and community rights can be weaker. Extractive
metals mining can adversely impact local
peoples’ culture, self-determination, and
health.204 Due to the potential for large
environmental and social impacts from
aluminum extraction, voluntary standards such
as the Aluminum Stewardship Initiative (ASI)
have arisen to promote responsible and
transparent practices throughout the aluminum
supply chain.205 The ASI, which is under
development, applies to all aluminum value
chain stages, from bauxite ore mining to
recycling. In 2013, Ball Corporation joined the
ASI in order to help drive adoption of the
standard and foster sustainability within its
supply chain.206
In certain regions of the world, such as the
DRC, the mining and sale of conflict minerals
like tin provide funding for armed conflicts and
thus may result in human rights abuses.
Companies are exposed not only to regulatory
risk associated with the Conflict Minerals rule
of the Dodd-Frank Act, but also to input price
volatility and reputational risks. Tin is of
particular concern for the Containers &
Packaging industry. It is used to manufacture
coated steel plating, called tinplate, and metal
alloys commonly used to manufacture
containers and can seals. Approximately 40
percent of the world’s tin is used to make
tinplate.207 The DRC accounts for 6 to 8 percent
of global tin production, and prices have shown
high volatility, sometimes related to conflicts
there. In 2008, a 31 percent increase in tin
prices coincided with a rebel offensive against
the DRC’s primary tin-trading center.208
Company SEC filings describe possible impacts
from materials sourcing. Ball Corp. states in its
FY2013 Form 10-K that “regulatory
developments regarding the reporting and use
of “conflict minerals” mined from the
Democratic Republic of the Congo and
adjoining countries could affect the sourcing
and availability of minerals used in the
manufacture of certain of our products…Also,
because our supply chain is complex, we may
face reputational challenges with our
customers and other stakeholders...”209 Supply
chain engagement can be a risk mitigation tool;
in Ball Corp.’s FY2014 Sustainability Report, it
states that, “…our supply chain sustainability
efforts help us to…Create shared value and
reduce risk for our business and relevant
stakeholders, including customers, suppliers
and shareholders…”210
I N D U S T R Y B R I E F | C O N T A I N E R S & P A C K A G I N G |37
Value Impact
The environmental and social performance of
suppliers can have a substantial impact on
containers and packaging companies,
impacting demand or products and sourcing
costs, and creating operational and
reputational risks.
Product certifications may be demanded by
downstream customers to prove the
responsible forestry or mining credentials of
suppliers. Increasing demand for certified
products could allow companies that obtain
such certifications for their products to improve
market share, charge a price premium, and
increase revenues over the long term.
As regulation and public awareness of negative
externalities from raw material production
grow, the probability and likelihood of financial
impacts are likely to rise in the medium term.
The percentage of wood fiber and aluminum
from certified sources is a proxy for the
environmental and social performance of
suppliers, and the risk of supply disruption and
reputational damage faced by containers and
packaging companies. The metrics are also
suggestive of competitive positioning to
capture the growing market opportunity for
certified products.
I N D U S T R Y B R I E F | C O N T A I N E R S & P A C K A G I N G |38
REFERENCES
1 Bloomberg Professional service, accessed January 15, 2015, using the BICS <GO> command. The data represents global revenues of companies listed on global exchanges and traded over-the-counter (OTC) from the Containers & Packaging industry, using Levels 3 and 4 of the Bloomberg Industry Classification System.
2 Bloomberg Professional service, accessed March 16, 2015, using the <EQS> command.
3 Stephen Hoopes, “IBISWorld Industry Report 32221: Cardboard Box & Container Manufacturing in the US,” IBISWorld, December 2013, p. 6.
4 Kerry Coughlin, “IBISWorld Industry Report 33243: Metal Can & Container Manufacturing in the US,” IBISWorld, December 2013, p. 7.
5 Neville, Antal, “IBISWorld Industry Report 32616: Plastic Bottle Manufacturing in the US” IBISWorld, November 2013, p.3.
6 Kerry Coughlin, “IBISWorld Industry Report 33243: Metal Can & Container Manufacturing in the US,” p. 21.
7 Stephen Morea, “IBISWorld Industry Report 32721: Glass Product Manufacturing in the US” IBISWorld, September 2013, p. 3.
8 Stephen Hoopes, “IBISWorld Industry Report 32221: Cardboard Box & Container Manufacturing in the US.”
9 Kerry Coughlin, “IBISWorld Industry Report 33243: Metal Can & Container Manufacturing in the US.”
10 Antal Neville, “IBISWorld Industry Report 32616: Plastic Bottle Manufacturing in the US.”
11 Author’s calculation based on data from Bloomberg Professional service, accessed on January 13, 2015, using Equity Screen (EQS) for U.S.-listed companies (including those traded primarily OTC) that generate at least 20 percent of revenue from their Containers & Packaging segment and for which Containers & Packaging is a primary SICS industry.
12 Stephen Hoopes, “IBISWorld Industry Report 32221: Cardboard Box & Container Manufacturing in the US.”
13 Sagarika Jaisinghani, “Rock-Tenn, MeadWestvaco to merge, create packaging giant,” Reuters, January 26, 2015, accessed February 3, 2015, http://www.reuters.com/article/2015/01/26/us-rocktenn-m-a-meadwestvaco-idUSKBN0KZ13P20150126.
14 Ibid., p. 11.
15 Kerry Coughlin, “IBISWorld Industry Report 33243: Metal Can & Container Manufacturing in the US.”
16 Stephen Hoopes, “IBISWorld Industry Report 32221: Cardboard Box & Container Manufacturing in the US.”
17 RockTenn, Inc., FY2014 Form 10-K for the period ending September 30, 2014 (filed November 24, 2014.), p.4
18 Stephen Hoopes, “IBISWorld Industry Report 32221: Cardboard Box & Container Manufacturing in the US.”
19 Ibid.
20 Bloomberg Professional service, accessed January 15, 2015, using the BICS <GO> command. The data represents global revenues of companies listed on global exchanges and traded over-the-counter (OTC) from the Containers & Packaging industry, using Levels 3 and 4 of the Bloomberg Industry Classification System.
21 Kerry Coughlin, “IBISWorld Industry Report 33243: Metal Can & Container Manufacturing in the US.”
22 Ibid.
23 Ibid., p. 5.
24 Tyler Langston, "Packaging," J.P. Morgan Analyst Report (2014), p.10.
25 Ibid.
26 Can Manufacturers Institute, 2013-2014 Annual Report, 2014, accessed February 24, 2015, http://www.cancentral.com/sites/cancentral.com/files/public-documents/CMI%202014%20Annual%20Report%202013_14%20WEB%20single%20page.pdf.
I N D U S T R Y B R I E F | C O N T A I N E R S & P A C K A G I N G
27 Bloomberg Professional service, accessed January 15, 2015, using the BICS <GO> command. The data represents global revenues of companies listed on global exchanges and traded over-the-counter (OTC) from the Containers & Packaging industry, using Levels 3 and 4 of the Bloomberg Industry Classification System.
28 Antal Neville, “IBISWorld Industry Report 32616: Plastic Bottle Manufacturing in the US.”
29 Ibid, p. 3.
30 Kerry Coughlin, “IBISWorld Industry Report 33243: Metal Can & Container Manufacturing in the US.”
31 "Consolidated Container buys Roffe Container assets," Plastics News, last modified August 14, 2012, accessed May 2, 2014, http://www.plasticsnews.com/article/20121113/NEWS/311139969/consolidated-container-buying-madras-packaging.
32 Bloomberg Professional service, accessed January 15, 2015, using the BICS <GO> command. The data represents global revenues of companies listed on global exchanges and traded over-the-counter (OTC) from the Containers & Packaging industry, using Levels 3 and 4 of the Bloomberg Industry Classification System.
33 "Glass Container Manufacturing Industry Overview," Glass Packaging Institute, 2014, accessed February 5, 2015, http://www.gpi.org/sites/default/files/Glass Container Industry Overview.pdf.
34 Owens-Illinois, Inc., FY13 Form 10-K for the period ending December 31, 2013, (filed February 14, 2014), p. 1.
35 Stephen Morea, “IBISWorld Industry Report 32721: Glass Product Manufacturing in the US.”
36 "Forest Products Industry Technology Roadmap," Agenda 2020 Technology Alliance, last modified April 2010, p. 21.
37 "Environment," Berry Plastics Corporation, 2014, accessed February 24, 2015, http://www.berryplastics.com/about-us/our-responsibilities/environment.
38 "Curbside Value Partnership," Can Manufacturing Institute, 2015, accessed February 24, 2015, http://cancentral.com/recycling-sustainability/programs-initiatives/curbside-value-partnership.
39 "Increase Paper Recovery for Recycling," American Forest & Paper Association, accessed May 2, 2014, http://afandpa.org/sustainability/increase-paper-recovery.
40 "Coke investing millions in firms to accelerate development of plant-based plastics," Plastics News, last modified December 15, 2011, accessed May 2, 2014, http://www.plasticsnews.com/article/20111215/NEWS/312159996/coke-investing-millions-in-firms-to-accelerate-development-of-plant-based-plastics.
41 "Battle of the bioplastic bottle," ICIS Green Chemicals, last modified March 21, 2011, accessed May 2, 2014, http://www.icis.com/blogs/green-chemicals/2011/03/battle-of-the-bioplastic-bottl/.
42 Brian Bogart, “Ball Corporation (BLL) – ½ KDP Ranking,” KDP Research, June 23, 2014, p. 1-3.
43 “Boiler Compliance at Area Sources,” United States Environmental Protection Agency, last updated December 22, 2014, accessed on February 24, 2015, http://www.epa.gov/boilercompliance/.
44 “Greenhouse Gas Reporting Program Basic Information,” United States Environmental Protection Agency, July 31, 2014, accessed December 10, 2014, http://www.epa.gov/ghgreporting/basic-info/index.html.
45 “Cap-and Trade Program,” California Environmental Protection Agency Air Resources Board, 2014, accessed December 28, 2014, http://www.arb.ca.gov/cc/capandtrade/capandtrade.htm.
46 “A Brief Look at the Quebec Cap and Trade System for Emissions Allowances," Province of Quebec Canada, 2015, accessed February 10, 2015, http://www.mddelcc.gouv.qc.ca/changements/carbone/documents-spede/in-brief.pdf
47 “RCRA Orientation Manual 2011: Resource Conservation and Recovery Act Section VI,” United States Environmental Protection Agency, last updated November 4, 2012, accessed on February 24, 2015, http://www.epa.gov/osw/inforesources/pubs/orientat/.
48 "Ingredients, Packaging & Labeling," U.S. Food and Drug Administration, last modified March 24, 2014, accessed April 14, 2014, http://www.fda.gov/food/ingredientspackaginglabeling/default.htm.
49 Sabrina Tavernise, "F.D.A. Makes It Official: BPA Can’t Be Used in Baby Bottles and Cups," The New York Times, last modified July 17, 2012, accessed May 4, 2014, http://www.nytimes.com/2012/07/18/science/fda-bans-bpa-from-baby-bottles-and-sippy-cups.html?_r=0.
50 Ball Corp., FY13 Form 10-K for the period ending December 31, 2013 (filed on March 3, 2014), p.11.
I N D U S T R Y B R I E F | C O N T A I N E R S & P A C K A G I N G
51 “Food Contact Materials – EU Legislation,” European Commission, last updated September 29, 2012, accessed February 24, 2015, http://ec.europa.eu/food/food/chemicalsafety/foodcontact/eu_legisl_en.htm.
52 "EPR (Extended Producer Responsibility)," American Forest & Paper Association, accessed May 4, 2014, http://afandpa.org/issues/epr.
53 Conrad MacKerron, "Unfinished Business: The Case for Extended Producer Responsibility for Post-Consumer Packaging," As You Sow, 2012, p. 3-4, http://www.asyousow.org/wp-content/uploads/2013/08/REPORT-2012-UnfinishedBusiness_TheCaseforEPR.pdf.
54 “Product Stewardship and Extended Producer Responsibility (EPR) Policy and Law,” CalRecycle, last updated March 20, 2014, accessed February 10, 2015, http://www.calrecycle.ca.gov/epr/PolicyLaw/default.htm#World.
55 "EPR (Extended Producer Responsibility)," American Forest & Paper Association,
56 Beth Slovic, "Portland expands plastic-bag ban to 5,000 businesses," Oregon Live, last modified November 16, 2012, http://www.oregonlive.com/portland/index.ssf/2012/11/portland_expands_plastic-bag_b.html.
57 Save The Bay, "Plastic Bags are History in San Francisco," 2014, accessed May 4, 2014, http://www.savesfbay.org/plastic-bags-are-history-san-francisco.
58 Jane Timm, "San Francisco bans sale of plastic water bottles on city property," MSNBC, last modified March 14, 2014, http://www.msnbc.com/msnbc/san-francisco-bans-sale-plastic-water-bottles-climate-change.
59 “Homepage,” Programme for the Endorsement of Forest Certification, 2014, http://www.pefc.org/.
60 Forest Stewardship Council, “Mission and Vision,” 2014, accessed on March 16, 2015, https://us.fsc.org/mission-and-vision.187.htm.
61 “Basics of SFI,” Sustainable Forestry Initiative, 2014, accessed on March 16, 2015, http://www.sfiprogram.org/about-us/basics-of-sfi/.
62 “ASI Overview,” Aluminum Stewardship Initiative, 2015, accessed February 13, 2015, http://aluminium-stewardship.org/about-asi/asi-overview/.
63 “SEC Adopts Rule for Disclosing Use of Conflict Minerals,” U.S. Securities and Exchange Commission, 2012,
accessed April 8, 2013, http://www.sec.gov/news/press/2012/2012-163.htm.
64 Author’s calculation based on data from “Annual Survey of Manufactures: General Statistics: Statistics for Industry Groups and Industries: 2011,” U.S. Census Bureau, released December 17, 2013. Accessed January 29, 2015. http://www.census.gov/manufacturing/asm/.
65 RockTenn, Inc., FY 14 Form 10-K for the period ending September 30, 2014, (filed November 24), 2014, p. 7, accessed February 5, 2015, http://files.shareholder.com/downloads/AMDA-1OZYBO/3934532386x0xS230498-14-117/230498/filing.pdf.
66 The NAICS codes, and the related industries activities, applicable to the Containers & Packaging industry are as follows:
32619 Other plastics product manufacturing
32622 Rubber and plastics hoses and belting manufacturing
32629 Other rubber product manufacturing
3321 Forging and stamping
3323 Architectural and structural metals manufacturing
3325 Hardware manufacturing
3326 Spring and wire product manufacturing
3327 Machine shops; turned product; and screw, nut, and bolt manufacturing
3328 Coating, engraving, heat treating, and allied activities
3329 Other fabricated metal product manufacturing
333 Machinery manufacturing
33612 Heavy duty truck manufacturing
I N D U S T R Y B R I E F | C O N T A I N E R S & P A C K A G I N G
336212 Truck trailer manufacturing
3365 Railroad rolling stock manufacturing
3366 Ship and boat building
3369 Other transportation equipment manufacturing
67 Author’s calculation using data from the United States Environmental Protection Agency GHGRP reporting program 2013 data titled, “GHG Reporting Program Data Sets 2013 Data Summary Spreadsheets (XLS),” last modified January 23, 2015. The following NAICS codes were used in the calculation: 322130, 322222, 326113, 326121, 326140, 327212, 327213. Accessed on February 24, 2015. http://www.epa.gov/ghgreporting/ghgdata/reportingdatasets.html.
68 Author’s calculation using data from the United States Environmental Protection Agency GHGRP reporting program 2013 data titled, “GHG Reporting Program Data Sets 2013 Data Summary Spreadsheets (XLS),” last modified January 23, 2015. Accessed on February 24, 2015. http://www.epa.gov/ghgreporting/ghgdata/reportingdatasets.html.
69 “Technical Support Document for the Glass Manufacturing Sector: Proposed Rule for Mandatory Reporting of Greenhouse Gases,” United States Environmental Protection Agency Office of Air and Radiation, January 22, 2009, p. 1-2, http://www.epa.gov/ghgreporting/documents/pdf/archived/tsd/TSD%20Glass__EPA%201-22-09.pdf.
70 “Environmental, Health, and Safety Guidelines for Glass Manufacturing,” International Finance Corporation, World Bank Group, April 30, 2007, p. 5-6, accessed February 3, 2015, http://www.ifc.org/wps/wcm/connect/384e20804885574ebc0cfe6a6515bb18/Final%2B-%2BGlass%2BManufacturing.pdf?MOD=AJPERES&id=1323152002618.
71 “Environmental, Health, and Safety Guidelines for Glass Manufacturing,” International Finance Corporation, World Bank Group, April 30, 2007, p. 5-6, accessed February 3, 2015, http://www.ifc.org/wps/wcm/connect/384e20804885574ebc0cfe6a6515bb18/Final%2B-%2BGlass%2BManufacturing.pdf?MOD=AJPERES&id=1323152002618.
72 Owens-Illinois, Inc., FY14 Form 10-K for the period ending December 31, 2014 (filed on February 11, 2015), p. 4-5.
73 RockTenn, Inc., FY14 Form 10-K for the period ending September 30, 2014, (filed November 24, 2014) p. 9,
http://files.shareholder.com/downloads/AMDA-1OZYBO/3934532386x0xS230498-14-117/230498/filing.pdf.
74 “2008 Sector Performance Report,” United States Environmental Protection Agency, Forest Products, p. 58.
75 “Glass Container Manufacturer Agrees to Install Pollution Controls and Pay $1.45 Million to Settle Clean Air Act Violations / Settlement to reduce emissions at facilities in Georgia, Oklahoma, Pennsylvania, and Texas,” United States Environmental Protection Agency, December 3, 2012, accessed February 3, 2015, http://yosemite.epa.gov/opa/admpress.nsf/d0cf6618525a9efb85257359003fb69d/b78d6e5db98c2bf185257ac6005a4368!OpenDocument.
76 “Environmental, Health, and Safety Guidelines for Glass Manufacturing,” International Finance Corporation.
77 Ibid.
78 “2014 National Emissions Inventory information Priority Facility Point Sources”, United States Environmental Protection Agency, last updated January 23, 2015, http://www.epa.gov/ttn/chief/net/2014inventory.html.
79 Author’s calculation based on data from the U.S. Department of Commerce Economics and Statistics Administration, “Pollution Abatement Costs and Expenditures: 2005, Current Industrial Reports,” Tables 5 and 7, 2005, accessed March 27, 2014, http://yosemite.epa.gov/ee/epa/eed.nsf/cbd494e04061784d85256a2b006c1945/b5d7ef9f701ad0d6852573f4005e5ad9/$FILE/2005%20PACE%20Report-REV-7-1-08.pdf.
80 Author’s calculation based on data from the U.S. Department of Commerce Economics and Statistics Administration, “Pollution Abatement Costs and Expenditures: 2005, Current Industrial Reports,” Tables 5 and 7, 2005, accessed March 27, 2014, based on the following NAICS codes:
321920 Wood Container and Pallet Manufacturing
3222 Converted paper product Manufacturing
327213 Glass Container Manufacturing
332431 Metal Can Manufacturing
332439 Other Metal Container Manufacturing
I N D U S T R Y B R I E F | C O N T A I N E R S & P A C K A G I N G
326111 Plastics Bag and Pouch Manufacturing
326112 Plastics Packaging Film and Sheet (including Laminated) Manufacturing
326160 Plastics Bottle Manufacturing
331315 Aluminum Sheet, Plate, and Foil Manufacturing
3324 Boiler, Tank, & Shipping Container Manufacturing
32615 & 32614 Polystyrene, urethane, other foam packaging
81 "Boiler MACT Regulations," National Association of Manufacturers, accessed April 26, 2014, http://www.nam.org/Special/Media-Campaign/EPA-Overregulation/Boiler-MACT-Regulations.aspx.
82 RockTenn Co., FY13 Form 10-K for the period ending December 31, 2014, (filed November 18, 2013) p. 8.
83 International Paper, Co., FY14 Form 10-K for the period ending December 31, 2014 (filed February 27, 2015), p. 4-5.
84 “United States Announces Two Major Clean Air Act New Source Review Settlements at 28 Industrial Plants Nationwide,” United States Department of Justice, January 21, 2010, accessed February 10, 2015, http://www.justice.gov/opa/pr/united-states-announces-two-major-clean-air-act-new-source-review-settlements-28-industrial.
85 “Glass Container Manufacturer Agrees to Install Pollution Controls and Pay $1.45 Million to Settle Clean Air Act Violations / Settlement to reduce emissions at facilities in Georgia, Oklahoma, Pennsylvania, and Texas,” United States Environmental Protection Agency.
86 “Environmental, Health, and Safety Guidelines for Glass Manufacturing,” International Finance Corporation.
87 “Glass manufacturing is an energy-intensive industry mainly fueled by natural gas,” Energy Information Administration, August 21, 2013, accessed February 25, 2015, http://www.eia.gov/todayinenergy/detail.cfm?id=12631.
88 Author’s calculation based on data from the United States Census Bureau, Annual Survey of Manufacturers, 2011. The following NAICS codes were used in the calculation: 32192, 3222, 326111, 326112, 32616, 327213, 33243, 3324.
89 Ibid.
90 Owens-Illinois, FY14 Form 10-K for the period ending December 31, 2014 (filed February 11, 2015), p. 3-5.
91 Sonoco Products, FY13 Form 10-K for the period ending December 31, 2013 (filed on March 1, 2014), p.9.
92 International Paper, Co., FY14 Form 10-K for the period ending December 31, 2014 (filed February 27, 2015), p. 3-4.
93 RockTenn Co., FY2013 Annual Report for the period ending December 31, 2013 (filed November 18, 2013), p. 12, http://files.shareholder.com/downloads/AMDA-1OZYBO/0x0x714727/F2CD5D44-DFE9-478F-B4D9-C7578E13EEFB/RKT2013_Complete.pdf.
94 "MeadWestvaco to Invest $285 Million to Construct Biomass Boiler at Covington Mill," PaperAge, last modified June 27, 2011, http://www.paperage.com/2011news/06_28_2011mwv_covington.html.
95Howard Andres, Sabine Brueske, Ridah Sabouni, and Chris Zach, “U.S. Manufacturing Energy Use and Greenhouse Gas Emissions Analysis,” Oak Ridge National Laboratory, November 2012, p. 74.
96 “Environmental, Health, and Safety Guidelines for Glass Manufacturing,” International Finance Corporation.
97 “Water Use and Treatment in the Pulp and Paper Industry,” Sappi Fine Paper North America, eQ Insights, Volume 5/August 2012, p. 3-4.
98 “Environmental, Health, and Safety Guidelines for Glass Manufacturing,” International Finance Corporation.
99 “Watching water. A guide to evaluating corporate risks in a thirsty world,” JPMorgan Global Equity Research, 31 March 2008, p. 4.
100 Cyrus Lotfipour and Véronique Menou, “Executive Summary: Water Upstream and Downstream Impacts from a Well Running Dry,” MSCI ESG Research, September 2013, p. 2.
I N D U S T R Y B R I E F | C O N T A I N E R S & P A C K A G I N G
101 Author’s calculation based on “Pollution Abatement Costs and Expenditures: 2005, Current Industrial Reports,” U.S. Department of Commerce Economics and Statistics Administration, 2005, accessed March 27, 2014, tables 5 & 7, using the following NAICS codes:
321920 Wood Container and Pallet Manufacturing
3222 Converted paper product Manufacturing
327213 Glass Container Manufacturing
332431 Metal Can Manufacturing
332439 Other Metal Container Manufacturing
326111 Plastics Bag and Pouch Manufacturing
326112 Plastics Packaging Film and Sheet (including Laminated) Manufacturing
326160 Plastics Bottle Manufacturing
331315 Aluminum Sheet, Plate, and Foil Manufacturing
3324 Boiler, Tank, & Shipping Container Manufacturing
32615 & 32614 Polystyrene, urethane, other foam packaging
102 “Pollution Abatement Costs and Expenditures: 2005, Current Industrial Reports,” U.S. Department of Commerce Economics and Statistics Administration, 2005, accessed March 27, 2014, tables 5 and 7, http://yosemite.epa.gov/ee/epa/eed.nsf/cbd494e04061784d85256a2b006c1945/b5d7ef9f701ad0d6852573f4005e5ad9/$FILE/2005%20PACE%20Report-REV-7-1-08.pdf.
103 RockTenn Co., FY13 Sustainability Report, p. 24.
104 "California Enacts Emergency Drought Legislation," Legal Planet, last modified March 04, 2014, accessed April 5, 2014, http://legal-planet.org/2014/03/04/california-enacts-emergency-drought-legislation/.
105 Stephen Hoopes, “IBISWorld Industry Report 32221: Cardboard Box & Container Manufacturing in the US.”
106 Matt Ferner, "These 11 Cities May Completely Run Out Of Water Sooner Than You Think," Huffington Post, December 4, 2014, accessed on March 16, 2015, http://www.huffingtonpost.com/2013/12/04/water-shortage_n_4378418.html.
107 "Will Your City Run Dry?" Growing Blue, May 2013, accessed April 22, 2014, http://growingblue.com/wp-content/uploads/2013/05/GRAPHIC_WaterRisk-Columbia VeoliaWater.pdf.
108 Amcor, Inc., FY12 Sustainability Report, p. 15.
109 Ball Corporation, FY10 and FY11 Sustainability Report, p. 12.
110 Rock Tenn Co., FY13 Sustainability Report, p. 24.
111 "International Paper Co. – Chemicals," PERI, last modified February 13, 2013, accessed May 5, 2014, http://grconnect.com/tox100/2013/index.php?search=yes&sortp=&company1=12388&chemfac=chem&advbasic=bas.
112 "Chemical Profile Regulatory Coverage - Lead Compounds," Good Guide, accessed April 24, 2014, http://scorecard.goodguide.com/chemical-profiles/regulation.tcl?edf_substance_id=LCT000.
113 Author’s calculation based on United States Environmental Protection Agency National Biennial RCRA Hazardous Waste Report, Exhibit 1.4, last updated 1/12/2015, accessed February 5, 2015, http://www.epa.gov/epawaste/inforesources/data/biennialreport/.
114 “Pollution Abatement Costs and Expenditures: 2005, Current Industrial Reports,” U.S. Department of Commerce Economics and Statistics Administration, tables 5 and 7. 2005, accessed March 27, 2014, http://yosemite.epa.gov/ee/epa/eed.nsf/cbd494e04061784d85256a2b006c1945/b5d7ef9f701ad0d6852573f4005e5ad9/$FILE/2005%20PACE%20Report-REV-7-1-08.pdf.
115 Author’s calculation based on the “Pollution Abatement Costs and Expenditures: 2005, Current Industrial Reports,” U.S. Department of Commerce Economics and Statistics Administration, 2005, accessed March 27, 2014, tables 5 and 7. The following NAICS codes were used to calculate waste pollution abatement costs per the PACE report:
321920 Wood Container and Pallet Manufacturing
I N D U S T R Y B R I E F | C O N T A I N E R S & P A C K A G I N G

3222 Converted paper product Manufacturing
327213 Glass Container Manufacturing
332431 Metal Can Manufacturing
332439 Other Metal Container Manufacturing
326111 Plastics Bag and Pouch Manufacturing
326112 Plastics Packaging Film and Sheet (including Laminated) Manufacturing
326160 Plastics Bottle Manufacturing
331315 Aluminum Sheet, Plate, and Foil Manufacturing
3324 Boiler, Tank, & Shipping Container Manufacturing
32615 & 32614 Polystyrene, urethane, other foam packaging
116 "Biomass," American Forest & Paper Association, 2014, accessed April 23, 2014, http://afandpa.org/issues/biomass.
117 "Glass Facts," Glass Packaging Institute.
118 Sealed Air Corp., FY13 Form 10-K for the period ending December 31, 2013 (filed on February 28, 2014), p. 25.
119 "Food packaging chemicals may be harmful to human health over long term," Science Daily, last modified February 19, 2014, accessed on March 16, 2015, http://www.sciencedaily.com/releases/2014/02/140219205215.htm.
120 “Bisphenol A (BPA): Use in Food Contact Application,” United States Food and Drug Administration, last updated November 2014, accessed February 26, 2015, http://www.fda.gov/NewsEvents/PublicHealthFocus/ucm064437.htm.
121 "Ingredients, Packaging & Labeling," United States Food and Drug Administration, last modified March 24, 2014, accessed May 5, 2014, http://www.fda.gov/food/ingredientspackaginglabeling/default.htm.
122 Wendy Koch, “European Union bans chemical BPA in baby bottles,” USA Today, November 27, 2010, accessed February 26, 2015, http://content.usatoday.com/communities/greenhouse/post/2010/11/europe-ban-bpa/1#.VO-oOPnF98E.
123 "Food packaging chemicals may be harmful to human health over long term," Science Daily, last modified February 19, 2014, accessed on March 16, 2015, http://www.sciencedaily.com/releases/2014/02/140219205215.htm.
124 "Identification of Putative Steroid Receptor Antagonists in Bottled Water: Combining Bioassays and High-Resolution Mass Spectrometry," PLOS One, last modified August 28, 2013, accessed April 4, 2014, http://www.plosone.org/article/info:doi/10.1371/journal.pone.0072472.
125 "Food packaging chemicals may be harmful to human health over long term," Science Daily, last modified February 19, 2014, accessed on March 16, 2015, http://www.sciencedaily.com/releases/2014/02/140219205215.htm.
126 "Baby Step Toward Full Ban on BPA in Food Packaging," Breast Cancer Fund, last modified July 11, 2013, http://www.breastcancerfund.org/media/press-releases/fda-bpa-ban-july-2013.html.
127 “Groups Petition FDA to Ban Toxic Chemicals Used in Pizza Boxes and Other Food Packaging,” National Resources Defense Council, October 16, 2014, accessed on February 28, 2015, http://www.nrdc.org/media/2014/141016a.asp.
128 Ball Corp., FY13 Form 10-K for the period ending December 31, 2013 (filed February 24, 2014), p, 10.
129 “France bans BPA,” Food Packaging Forum, January 6, 2015, accessed on February 10, 2015, http://www.foodpackagingforum.org/news/france-bans-bpa.
130 Stephen Ritter, "BPA Is Indispensable For Making Plastics," C&EN, last modified June 6, 2011, https://pubs.acs.org/cen/coverstory/89/8923cover4.html.
131 Sarah Boseley, “Chemicals leaching into food from packaging raise safety concerns,” The Guardian, February 18, 2014, accessed March 3, 2015, http://www.theguardian.com/world/2014/feb/19/chemicals-leaching-food-packaging-safety-bmj.
132 Greif, Inc., FY14 Form 10-K for the period ending October 31, 2014 (filed January 9, 2015), p. 9.
133 Berry Plastics, FY14 Form 10-K for the period ending September 27, 2014 (filed November 24, 2014), p. 7.
I N D U S T R Y B R I E F | C O N T A I N E R S & P A C K A G I N G
134 Jenny Eagle, “Canadian wax supplier denied early exit from Kellogg v. Flexible Packaging Corp. court case,” last updated October 7, 2014, accessed February 26, 2015, http://www.foodproductiondaily.com/Packaging/IGI-denied-exit-from-Kellogg-v.-Flexible-Packaging-Corp.-court-case.
135 "Samuel Adams Recall: Brewer Issues Recall Due To Defective Glass Bottles," The Huffington Post, last modified March 25, 2011, accessed on March 16, 2015, http://www.huffingtonpost.com/2008/04/09/sam-adams-recall-brewer-i_n_95891.html.
136 Bibeka Shrestha, “Boston Beer Gets $20.5M To Settle Recall Claims,” Law360, May 10, 2011, accessed February 10, 2015, http://www.law360.com/articles/244390/boston-beer-gets-20-5m-to-settle-recall-claims.
137 Sealed Air Corp., FY13 Form 10-K for the period ending December 31, 2013 (filed February 28, 2014), p. 23.
138 "Municipal Solid Waste Generation, Recycling, and Disposal in the United States: Facts and Figures for 2012," United States Environmental Protection Agency, last modified February 28, 2014, p. 2-11, accessed February 10, 2015, http://www.epa.gov/solidwaste/nonhaz/municipal/pubs/2012_msw_fs.pdf.
139 "Sustainable Packing ‘Essential Part of Business’,” Environmental Leader, last modified December 30, 2013, accessed on March 16, 2015, http://www.environmentalleader.com/2013/12/30/sustainable-packing-essential-part-of-business/.
140 Conrad MacKerron, "Unfinished Business: The Case for Extended Producer Responsibility for Post-Consumer Packaging," As You Sow, 2012, accessed March 16, 2015, p. 3-4, http://www.asyousow.org/wp-content/uploads/2013/08/REPORT-2012-UnfinishedBusiness_TheCaseforEPR.pdf.
141 “The State of Play on Extended Producer Responsibility (EPR): Opportunities and Challenges,” Organization of Economic Development and Cooperation Global Forum on Environment, June 17-19, 2014, p. 3, accessed February 27, 2015, http://www.oecd.org/environment/waste/Global%20Forum%20Tokyo%20Issues%20Paper%2030-5-2014.pdf.
142 "Packaging Innovations Weekly Wrap - Sonoco Looks to Lightweight Packaging," Packaging Gateway, last modified July 30, 2008, accessed on March 16, 2015, http://www.packaging-gateway.com/news/news6058.html.
143 "Design for Recovery Guidelines: Paper Packaging," Green Blue Institute, 2014, p. 5, accessed May 5, 2014, http://www.sustainablepackaging.org/Uploads/Resources/recycled-content-paper-packaging.pdf.
144 Brian Palmer, "Go West, Garbage Can!" Slate, last modified February 15, 2011, accessed March 16, 2015, http://www.slate.com/articles/health_and_science/the_green_lantern/2011/02/go_west_garbage_can.html.
145 "Municipal Solid Waste Generation, Recycling, and Disposal in the United States: Facts and Figures for 2012.”
146 Ibid.
147 Ibid.
148 “Global packaging market to reach $975 billion by 2018,” Smithers Pira, last updated February 24, 2015, accessed March 2, 2015, http://www.smitherspira.com/news/2013/december/global-packaging-industry-market-growth-to-2018.
149 “Sustainable packaging market to reach $244 billion by 2018,” Smithers Pira, last updated February 24, 2015, accessed March 2, 2015, http://www.smitherspira.com/news/2013/august/sustainable-packaging-trends-to-2018.
150 LEK Consulting, Executive Insights Volume XVI, Volume 27, p.1, accessed on March 2, 2015, http://www.lek.com/sites/default/files/LEK_1627_Sustainable%20Packaging_Web.pdf.
151 “Design for Recovery Guidelines: Paper Packaging,” p. 5.
152 Ibid pg. 6.
153 Ian Andrew, "We can increase recycling rates by changing perception of packaging," Greener Ideal, last modified August 27, 2013, http://www.greenerideal.com/lifestyle/0827-increase-recycling-rates-by-changing-our-perceptions-with-packaging/.
154 Ball Corp., FY13 Form 10-K for the period ending December 31, 2013 (filed February 24, 2014), p. 4-5.
155 “Better Practices, Better Planet 2020 Recovery Goal,” Paper Recycles, 2013, accessed February 22, 2015, http://www.paperrecycles.org/sustainability/better-practices-better-planet-2020-recovery-goal.
156 "RECYCLING FACTS & STATS," Keep America Beautiful, 2014, accessed April 24, 2014, http://www.kab.org/site/PageServer?pagename=recycling_facts_and_stats.
I N D U S T R Y B R I E F | C O N T A I N E R S & P A C K A G I N G
157 "Compelling Recycling Facts from Earth 911," Earth 911, 2013, accessed May 5, 2014, http://ssi.ucsd.edu/index.php?option=com_content&view=article&id=216:compelling-recycling-facts-from-earth-911&catid=8:newsflash&Itemid=20.
158 "Glass Facts," Glass Packaging Institute, 2014, accessed April 20, 2014, http://www.gpi.org/recycling/glass-recycling-facts.
159 "Recycling Facts," Can Manufacturers Institute, 2014, accessed April 26, 2014, http://cancentral.com/recycling-sustainability/facts.
160 "Recycling Facts & Stats,” Keep America Beautiful, 2014, accessed on March 16, 2015, http://www.kab.org/site/PageServer?pagename=recycling_facts_and_stats.
161 "Glass Facts," Glass Packaging Institute.
162 Crown Holdings, Inc., FY13 Form 10-K for the period ending December 31, 2013 (filed March 3, 2013), p. 15.
163 Conrad MacKerron, "Unfinished Business: The Case for Extended Producer Responsibility for Post-Consumer Packaging.”
164 “Extended Producer Responsibility Cost-Benefit Study,” Recycling Reinvented, March 2014, p. 6, accessed February 27, 2015, http://recycling-reinvented.org/wp-content/uploads/2012/03/Extended-Producer-Responsibility-Cost-Benefit-Study-Summary.pdf.
165 Berry Plastics, FY14 Form 10-K for the period ending September 27, 2014 (filed November 24, 2014), p. 7.
166 Jenni Spinner, "EPA: 51.5% of US packaging gets recycled," Food Production Daily, last updated March 13, 2014, accessed April 25, 2014, http://www.foodproductiondaily.com/Packaging/EPA-51.5-of-US-packaging-gets-recycled.
167 “Sustainability,” Owens-Illinois, Inc., 2015, accessed February 27, 2015, http://www.o-i.com/sustainability/sustainability-goals/.
168 Rock Tenn, Co., FY13 Sustainability Report, p. 34.
169 Ibid., p. 35.
170 “Sustainability,” Owens-Illinois, Inc., 2015, accessed February 27, 2015, http://www.o-i.com/sustainability/sustainability-goals/.
171 “New Recycled Glass Processing Center Opens in Portland,” Owens-Illinois, December 16, 2013, accessed March 2, 2015, http://investors.o-i.com/phoenix.zhtml?c=88324&p=irol-newsArticle&ID=1884952&highlight.
172 “Colgate Commits to Recyclable Packaging,” Environmental Leader, April 17, 2014, accessed on February 24, 2015. http://www.environmentalleader.com/2014/04/17/colgate-commits-to-recyclable-packaging/.
173 Bloomberg Professional services, Supply Chain Analysis Function <SPLC> for NAMPAK equity. Accessed on April 29, 2014.
174 Jim Johnson, “Wal-Mart wants to boost recycled packaging content by 3 billion pounds,” Plastics News, March 12, 2014, accessed February 27, 2015, http://www.plasticsnews.com/article/20140312/NEWS/140319946/wal-mart-wants-to-boost-recycled-packaging-content-by-3-billion-pounds.
175 Ibid.
176 Conrad MacKerron, "Unfinished Business: The Case for Extended Producer Responsibility for Post-Consumer Packaging.”
177 Hannah Ellsbury, “Two Dozen Bottled Water-free National Parks and More to Come,” Ban the Bottle, March 26, 2014, accessed on March 16, 2015, http://www.banthebottle.net/articles/two-dozen-bottled-water-free-national-parks-and-more-to-come/.
178 “Concord, Mass., the first US city to ban sale of plastic water bottles,” NBC News, September 7, 2012, accessed on March 16, 2015, http://usnews.nbcnews.com/_news/2012/09/07/13710037-concord-mass-the-first-us-city-to-ban-sale-of-plastic-water-bottles?lite.
179 Crown Holdings, Inc., FY2013 Form 10-K for the period ending December 31, 2013 (filed on March 3, 2013), p. 15.
180 “Who We Are,” Bioplastic Feedstock Alliance,” 2015, accessed on March 16, 2015, http://www.bioplasticfeedstockalliance.org/who-we-are/.
181 “PepsiCo Develops World's First 100 Percent Plant-Based, Renewably Sourced PET Bottle,”
I N D U S T R Y B R I E F | C O N T A I N E R S & P A C K A G I N G
PepsiCo, March 15, 2011, accessed on March 16, 2015, http://www.pepsico.com/PressRelease/PepsiCo-Develops-Worlds-First-100-Percent-Plant-Based-Renewably-Sourced-PET-Bott03152011.html.
182 “Infographic: Our 2020 Environmental Goals,” The Coca-Cola Company, 2015. Accessed on February 10, 2015, http://www.coca-colacompany.com/stories/our-2020-environment-goals-infographic.
183 “Sustainable Packaging Market to Hit $244 Billion by 2018,” Environmental Leader, February 17, 2014, accessed on March 16, 2015, http://www.environmentalleader.com/2014/02/17/sustainable-packaging-market-to-hit-244-billion-by-2018/.
184 “Environmental Responsibility,” Apple Inc., 2015, accessed on March 16, 2015, http://www.apple.com/environment/our-footprint/.
185 “Sustainable Packaging,” Coca-Cola Company, last updated November 7, 2012, accessed on March 16, 2015, http://www.coca-colacompany.com/sustainabilityreport/world/sustainable-packaging.html#section-managing-packaging-to-manage-risk.
186 Sealed Air Corp., FY2013 Form 10-K for the period ending December 31, 2013 (filed on February 28, 2014), p. 12.
187 “Surprising Insights from Environmental Screenings,” MI Sloan Management Review, October 16, 2013, accessed on March 16, 2015, http://sloanreview.mit.edu/article/surprising-insights-from-environmental-screenings/.
188 “Homepage,” Programme for the Endorsement of Forest Certification, 2015, accessed on March 16, 2015, http://www.pefc.org/.
189 “Basics of SFI,” Sustainable Forestry Initiative, 2014, http://www.sfiprogram.org/about-us/basics-of-sfi/.
190 “Mission and Vision,” Forest Stewardship Council, 2014, https://us.fsc.org/mission-and-vision.187.htm.
191 “Standard Overview,” Aluminum Stewardship Council, 2015. Accessed on February 10, 2015. http://aluminium-stewardship.org/asi-standard/standard-overview/.
192“Forestry & Timber,” Oekom Research Position Paper, November 2010. p. 1-5.
193 “Sustainable Forestry Management for Biodiversity Preservation and Soil and Water Conservation,” United Nations Food and Agriculture Organization, 2014, accessed January 22, 2015, http://www.fao.org/forestry/sfm/85292/en/.
194 “Indigenous People & Social Issues,” Programme for the Endorsement of Forest Certification.
195 RockTenn, Inc., FY2012 Sustainability Report, p. 29.
196 “Forest Certification.” PERFC. Accessed January 10th, 2015. http://www.pefc.org/certification-services/forest
197 “Tetra Pak research shows growing demand for renewable materials and environmental labelling,” Tetra Pak, September 16, 2013. Accessed on March 2, 2015. http://www.tetrapak.com/about-tetra-pak/press-room/news/growing-demand-renewable-materials.
198 McDonald’s, Inc., 2012-2013 Responsibility & Sustainability Report. P. 39-41. Accessed February 5, 2015. http://www.aboutmcdonalds.com/content/dam/AboutMcDonalds/2.0/pdfs/2012_2013_csr_report.pdf
199 Data obtained from Bloomberg Professional services using the <SPLC> function for McDonald’s Corporation. Accessed on March 2, 2015.
200 American Forest & Paper Association, 2014 Sustainability Report, appendix two, p 27, accessed March 16, 2015, http://www.afandpa.org/docs/default-source/one-pagers/2014_sustainabilityreport_final.pdf?sfvrsn=0.
201 RockTenn, Inc., FY2012 Sustainability Report, p. 29.
202 “Tetra Pak Closer to Sustainability Goals,” Environmental Leader, March 11, 2014, accessed on March 16, 2015, http://www.environmentalleader.com/2014/03/11/tetra-pak-closer-to-sustainability-goals/.
203 “ASI Overview,” Aluminum Stewardship Initiative, 2015. Accessed on February 13, 2015. http://aluminium-stewardship.org/about-asi/asi-overview/.
204 “Aluminium and Sustainability,” Aluminium Stewardship Initiative, 2015. Accessed on February 13, 2015. http://aluminium-stewardship.org/about-asi/aluminium-and-sustainability/#biodiversity.
205 “ASI Overview,” Aluminum Stewardship Initiative, 2015. Accessed on February 13, 2015. http://aluminium-stewardship.org/about-asi/asi-overview/.
206 Ball Corporation, FY2014 Sustainability Report, p. 10-12.
I N D U S T R Y B R I E F | C O N T A I N E R S & P A C K A G I N G
207 “Tin and Tin Alloys,” Key to Metals, 2010. Accessed on March 2, 2015. http://www.keytometals.com/Article26.htm.
208 “Conflict Minerals and the Democratic Republic of Congo: Responsible Action in Supply Chains, Government
Engagement and Capacity Building,” BSR, May 2010. Accessed September 11, 2014.
209 Ball Corporation, FY2013 Form 10-K for the period ending December 31, 2013. Filed on February 24, 2014, p.5-7.
210 Ball Corporation, FY2013 Sustainability Report, p. 10.
I N D U S T R Y B R I E F | C O N T A I N E R S & P A C K A G I N G
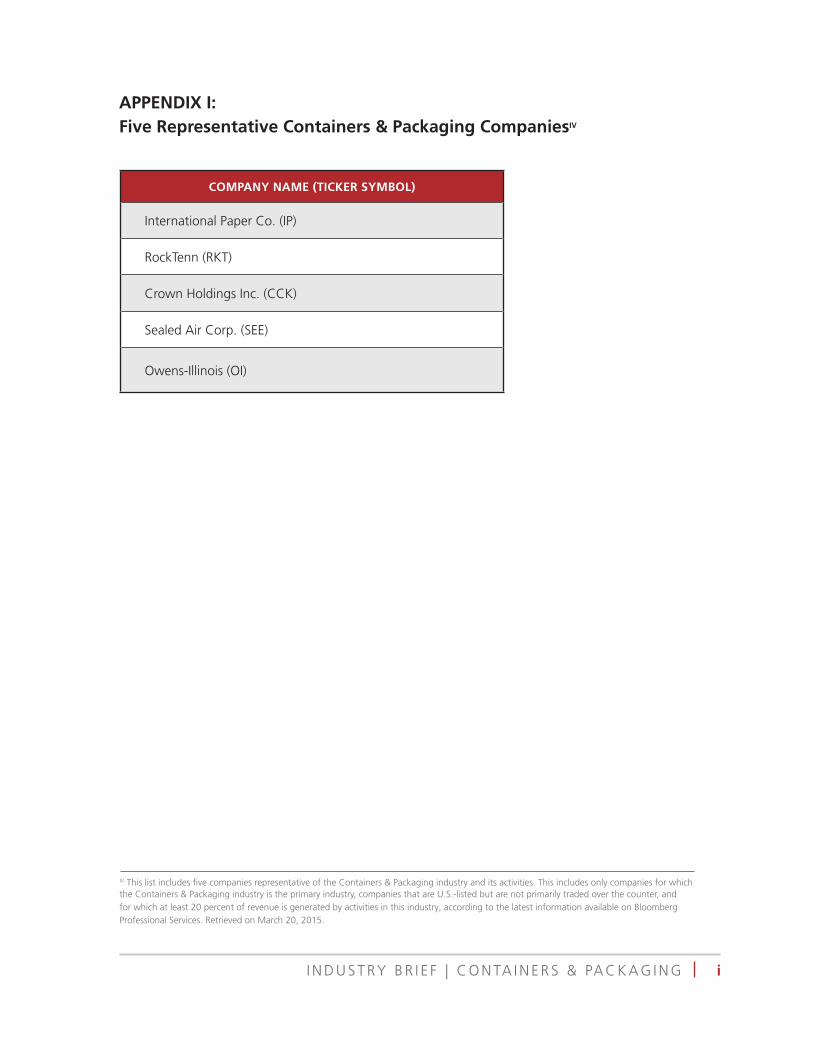
iI N D U S T RY B R I E F | C O N TA I N E R S & PA C K A G I N G
APPENDIX I: Five Representative Containers & Packaging CompaniesIV
COMPANY NAME (TICKER SYMBOL)
International Paper Co. (IP)
RockTenn (RKT)
Crown Holdings Inc. (CCK)
Sealed Air Corp. (SEE)
Owens-Illinois (OI)
IV This list includes five companies representative of the Containers & Packaging industry and its activities. This includes only companies for which the Containers & Packaging industry is the primary industry, companies that are U.S.-listed but are not primarily traded over the counter, and for which at least 20 percent of revenue is generated by activities in this industry, according to the latest information available on Bloomberg Professional Services. Retrieved on March 20, 2015.
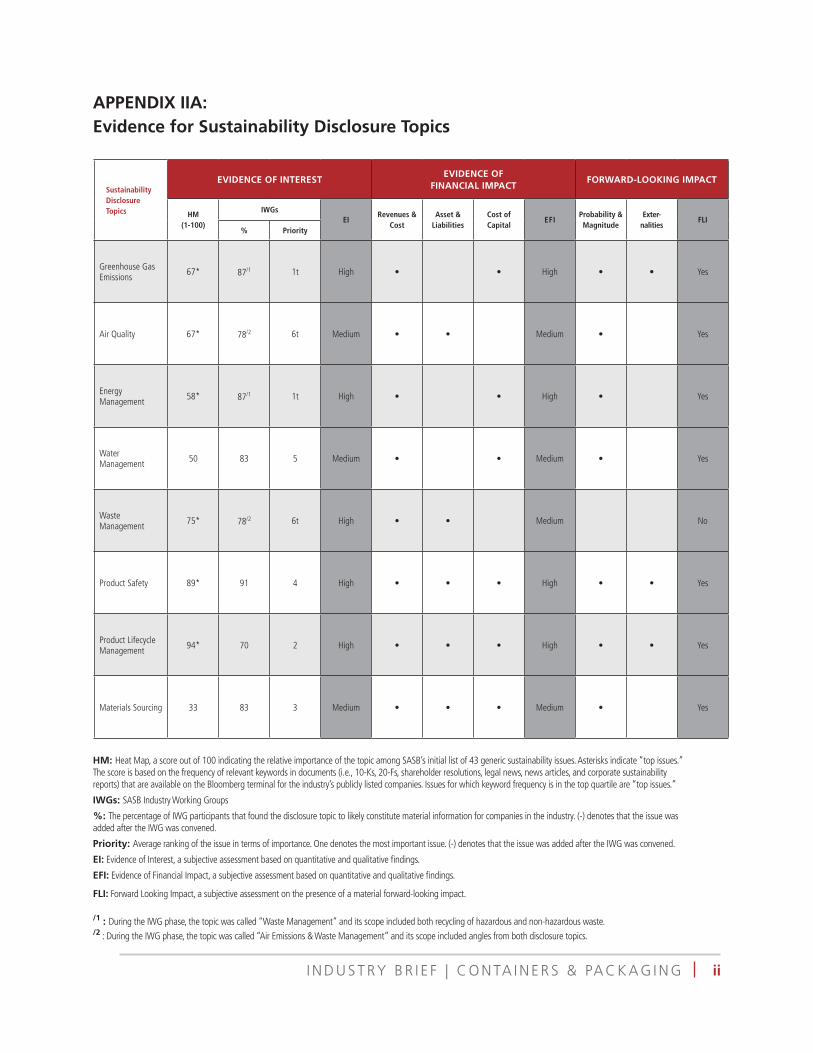
iiI N D U S T RY B R I E F | C O N TA I N E R S & PA C K A G I N G
APPENDIX IIA: Evidence for Sustainability Disclosure Topics
Sustainability Disclosure Topics
EVIDENCE OF INTERESTEVIDENCE OF
FINANCIAL IMPACTFORWARD-LOOKING IMPACT
HM (1-100)
IWGsEI
Revenues & Cost
Asset & Liabilities
Cost of Capital
EFIProbability & Magnitude
Exter- nalities
FLI% Priority
Greenhouse Gas Emissions 67* 87/1 1t High • • High • • Yes
Air Quality 67* 78/2 6t Medium • • Medium • Yes
Energy Management 58* 87/1 1t High • • High • Yes
Water Management 50 83 5 Medium • • Medium • Yes
Waste Management 75* 78/2 6t High • • Medium No
Product Safety 89* 91 4 High • • • High • • Yes
Product Lifecycle Management 94* 70 2 High • • • High • • Yes
Materials Sourcing 33 83 3 Medium • • • Medium • Yes
HM: Heat Map, a score out of 100 indicating the relative importance of the topic among SASB’s initial list of 43 generic sustainability issues. Asterisks indicate “top issues.” The score is based on the frequency of relevant keywords in documents (i.e., 10-Ks, 20-Fs, shareholder resolutions, legal news, news articles, and corporate sustainability reports) that are available on the Bloomberg terminal for the industry’s publicly listed companies. Issues for which keyword frequency is in the top quartile are “top issues.”
IWGs: SASB Industry Working Groups
%: The percentage of IWG participants that found the disclosure topic to likely constitute material information for companies in the industry. (-) denotes that the issue was added after the IWG was convened.
Priority: Average ranking of the issue in terms of importance. One denotes the most important issue. (-) denotes that the issue was added after the IWG was convened.
EI: Evidence of Interest, a subjective assessment based on quantitative and qualitative findings.
EFI: Evidence of Financial Impact, a subjective assessment based on quantitative and qualitative findings.
FLI: Forward Looking Impact, a subjective assessment on the presence of a material forward-looking impact.
/1 : During the IWG phase, the topic was called “Waste Management” and its scope included both recycling of hazardous and non-hazardous waste. /2 : During the IWG phase, the topic was called “Air Emissions & Waste Management” and its scope included angles from both disclosure topics.
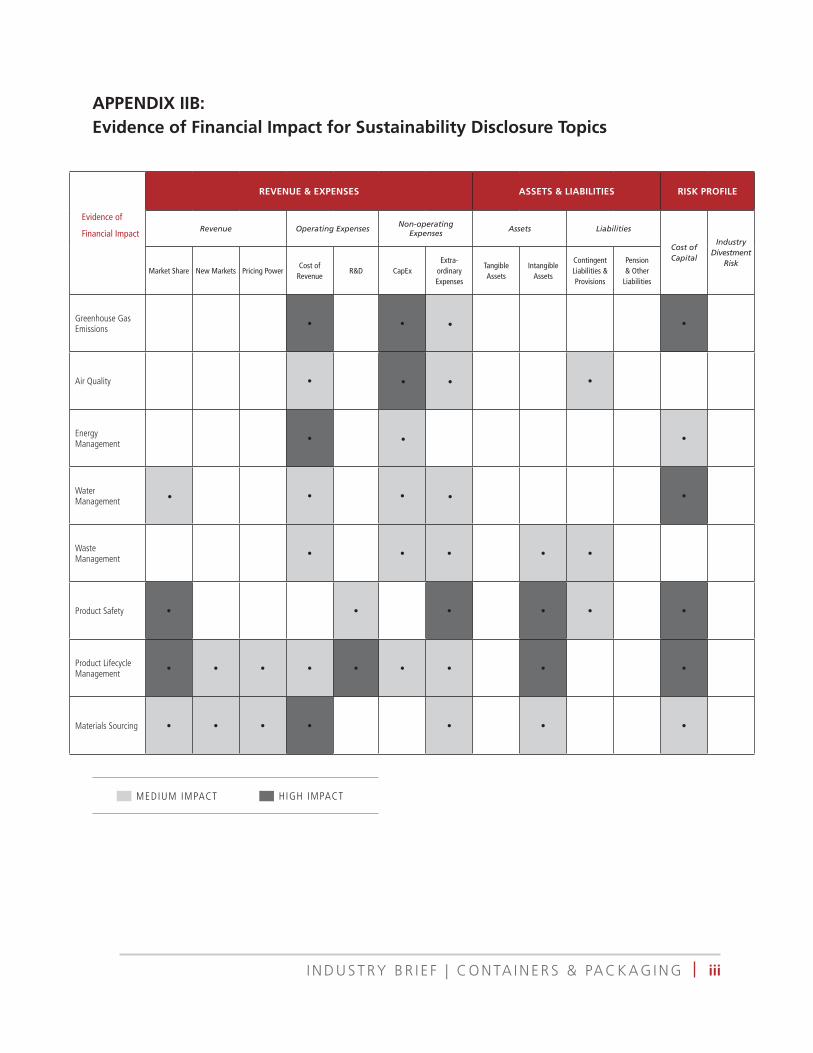
iiiI N D U S T RY B R I E F | C O N TA I N E R S & PA C K A G I N G
APPENDIX IIB: Evidence of Financial Impact for Sustainability Disclosure Topics
Evidence of
Financial Impact
REVENUE & EXPENSES ASSETS & LIABILITIES RISK PROFILE
Revenue Operating Expenses Non-operating Expenses Assets Liabilities
Cost of Capital
Industry Divestment
RiskMarket Share New Markets Pricing Power
Cost of Revenue
R&D CapExExtra-
ordinary Expenses
Tangible Assets
Intangible Assets
Contingent Liabilities & Provisions
Pension & Other
Liabilities
Greenhouse Gas Emissions • • •
•
Air Quality • • • •
Energy Management • • •
Water Management • • • • •
Waste Management • • • • •
Product Safety • • • • • •
Product Lifecycle Management • • • • • • • • •
Materials Sourcing • • • • • • •
HIGH IMPACTMEDIUM IMPACT
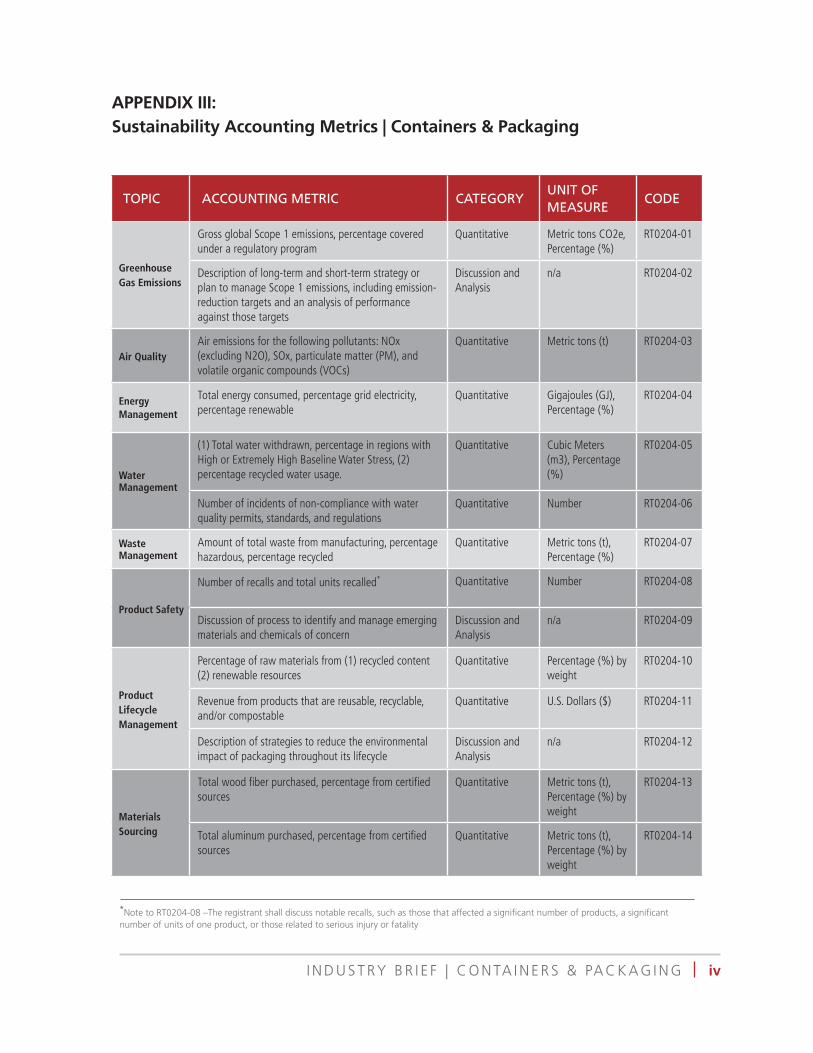
ivI N D U S T RY B R I E F | C O N TA I N E R S & PA C K A G I N G
APPENDIX III: Sustainability Accounting Metrics | Containers & Packaging
TOPIC ACCOUNTING METRIC CATEGORYUNIT OF MEASURE
CODE
Greenhouse Gas Emissions
Gross global Scope 1 emissions, percentage covered under a regulatory program
Quantitative Metric tons CO2e, Percentage (%)
RT0204-01
Description of long-term and short-term strategy or plan to manage Scope 1 emissions, including emission-reduction targets and an analysis of performance against those targets
Discussion and Analysis
n/a RT0204-02
Air QualityAir emissions for the following pollutants: NOx (excluding N2O), SOx, particulate matter (PM), and volatile organic compounds (VOCs)
Quantitative Metric tons (t) RT0204-03
Energy Management
Total energy consumed, percentage grid electricity, percentage renewable
Quantitative Gigajoules (GJ), Percentage (%)
RT0204-04
Water Management
(1) Total water withdrawn, percentage in regions with High or Extremely High Baseline Water Stress, (2) percentage recycled water usage.
Quantitative Cubic Meters (m3), Percentage (%)
RT0204-05
Number of incidents of non-compliance with water quality permits, standards, and regulations
Quantitative Number RT0204-06
Waste Management
Amount of total waste from manufacturing, percentage hazardous, percentage recycled
Quantitative Metric tons (t), Percentage (%)
RT0204-07
Product Safety
Number of recalls and total units recalled* Quantitative Number RT0204-08
Discussion of process to identify and manage emerging materials and chemicals of concern
Discussion and Analysis
n/a RT0204-09
Product Lifecycle Management
Percentage of raw materials from (1) recycled content (2) renewable resources
Quantitative Percentage (%) by weight
RT0204-10
Revenue from products that are reusable, recyclable, and/or compostable
Quantitative U.S. Dollars ($) RT0204-11
Description of strategies to reduce the environmental impact of packaging throughout its lifecycle
Discussion and Analysis
n/a RT0204-12
Materials Sourcing
Total wood fiber purchased, percentage from certified sources
Quantitative Metric tons (t), Percentage (%) by weight
RT0204-13
Total aluminum purchased, percentage from certified sources
Quantitative Metric tons (t), Percentage (%) by weight
RT0204-14
*Note to RT0204-08 –The registrant shall discuss notable recalls, such as those that affected a significant number of products, a significant number of units of one product, or those related to serious injury or fatality
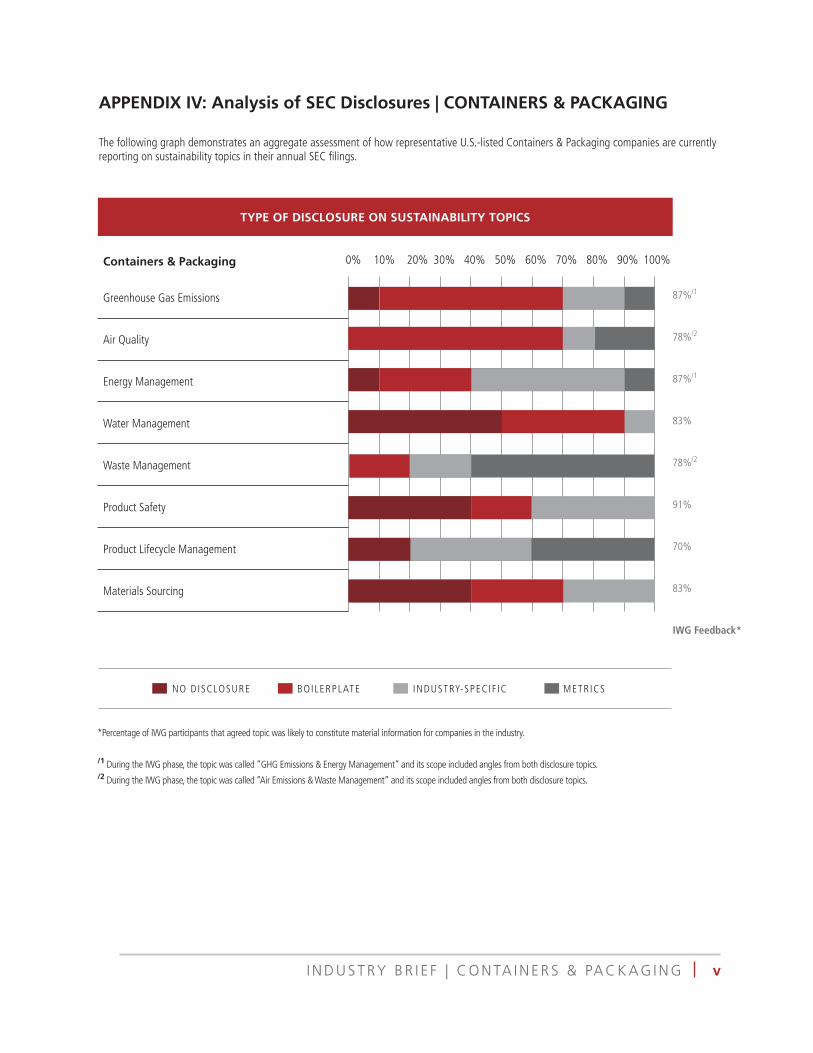
vI N D U S T RY B R I E F | C O N TA I N E R S & PA C K A G I N G
APPENDIX IV: Analysis of SEC Disclosures | CONTAINERS & PACKAGING
The following graph demonstrates an aggregate assessment of how representative U.S.-listed Containers & Packaging companies are currently reporting on sustainability topics in their annual SEC filings.
Containers & Packaging
Greenhouse Gas Emissions
Air Quality
Energy Management
Water Management
Waste Management
Product Safety
Product Lifecycle Management
Materials Sourcing
0% 10% 20% 30% 40% 50% 60% 70% 80% 90% 100%
TYPE OF DISCLOSURE ON SUSTAINABILITY TOPICS
NO DISCLOSURE BOILERPLATE INDUSTRY-SPECIF IC METRICS
87%/1
78%/2
87%/1
83%
78%/2
91%
70%
83%
IWG Feedback*
*Percentage of IWG participants that agreed topic was likely to constitute material information for companies in the industry.
/1 During the IWG phase, the topic was called “GHG Emissions & Energy Management” and its scope included angles from both disclosure topics./2 During the IWG phase, the topic was called “Air Emissions & Waste Management” and its scope included angles from both disclosure topics.
SUSTAINABILITY ACCOUNTING STANDARDS BOARD®
75 Broadway, Suite 202
San Francisco, CA 94111
415.830.9220
www.sasb.org
ISBN#: 978-1-940504-50-6
The content made available in this publication is copyrighted by the Sustainability Accounting Standards Board. All rights reserved. You agree to only use the content made available to you for non-commercial, informational or scholarly use within the organization you indicated you represent to keep intact all copyright and other proprietary notices related to the content. The content made available to you may not be further disseminated, distributed, republished or reproduced, in any form or in any way, outside your organization without the prior written permission of the Sustainability Accounting Standards Board. To request permission, please contact us a [email protected].