consumption patterns and why people fish
TRANSCRIPT
Environmental Research Section A 90, 125}135 (2002)doi:10.1006/enrs.2002.4391
Consumption Patterns and Why People Fish
Joanna Burger
Division of Life Sciences, Consortium for Risk Evaluation with Stakeholder Participation, Environmental and Occupational HealthSciences Institute, Rutgers University, 604 Allison Road, Piscataway, New Jersey 08854
Received November 16, 2001
Recreational and subsistence Ashing play majorroles in the lives of many people, although theirimportance in urban areas is often underestimated.There are Ash and shellAsh consumption advisoriesin the New York}New Jersey harbor estuary, parti-cularly in the waters of the Newark Bay Complex.This paper examines Ashing behavior, consumptionpatterns, and the reasons that people Ash in theNewark Bay Complex. I test the null hypothesesthat there are no differences among Asians, Blacks,Hispanics, and Whites in consumption patterns forAsh and crabs and in the reasons that they Ash orcrab. Most people either Ashed or crabbed, but notboth. People who Ash and crab ate more grams ofcrab than Ash in a given meal; people who crab onlyconsumed more grams of crab at a meal than thosewho Ash only consumed of Ash. Although 30% ormore of the people who Ashed and crabbed in theNewark Bay Complex did not eat their self-caughtAsh or crabs 8+25% of the people ate more than1500 g/month. Some people angling in the NewarkBay Complex are eating crabs at a rate well over1500 g/month, and about 70% are eating crabs eventhough there is a total ban on both harvestand consumption because of the health risks fromdioxin. Consumption patterns were negatively cor-related with mean income and positively correlatedwith mean age. Most people rated relaxation andbeing outdoors the highest reasons for angling,although on an open-ended question they usuallylisted recreation. There were no ethnic differencesin reasons for angling, although other studies haveshown ethnic differences in consumption. Obtain-ing Ash or crabs to eat, give away, trade, or sell wererated low, suggesting that consumption advisoriesfail partly because people are not primarily Ashingfor food. � 2002 Elsevier Science (USA)
Key Words: risk management; Ashing; consump-tion; ethnicity; perception; toxics.
125
INTRODUCTION
On a daily basis, people make choices about thefood that they eat, and some of these decisions in-volve eating self-caught 7sh or game. Yet, there isincreasing concern about the safety of self-caughtfoods, particularly 7sh and shell7sh. The U. S. En-vironmental Protection Agency (2002) reported that28% of the nation’s total lake acres and 14% of thenation’s total river miles are under consumptionadvisories, in addition to all of the Great Lakes andtheir connecting waters. These levels nearly doubledfrom 1997 to 2001 (EPA, 1998, 2002). Mercuryaccounts for most of the advisories, but poly-chlorobiphenyls (PCBs), chlordane, dioxins, anddichlorodiphenyltrichloroethane are also important(EPA, 1996, 2002).
Risk assessors generally assume that, if givenenough information, the public will act in a mannerthat is consistent with the relative risks ofdifferent activities. There are many cases wherepeople rank risks differently from the experts (Slovicet al., 1979; Slovic, 1987, 1993; Kasperson et al.,1988). Choices may be a result of subjective judge-ments, intuition, and objective knowledge (Kamrinand Fischer, 1999). People overestimate negligiblerisks and underestimate signi7cant ones (Slovicet al., 1979), underestimate risks they choose(Lowrance, 1976), and underestimate their own riskcompared to those of others (Weinstein, 1984, 1989).These principles apply to diets. The problem isampli7ed with respect to self-caught food because7shing is enjoyable (Toth and Brown, 1997) and isoften part of traditional cultures (Egeland et al.,1998; Harris and Harper, 1998; Berti et al., 1998).Further, anglers and 7shery professionals may alsodiffer in beliefs and attitudes (Connelly et al., 2000).
The public frequently views eating 7sh as posinga less serious hazard than does the scientist or envir-onmental manager. There is a gap in perception of
0013-9351/02 $35.00� 2002 Elsevier Science (USA)
All rights reserved.
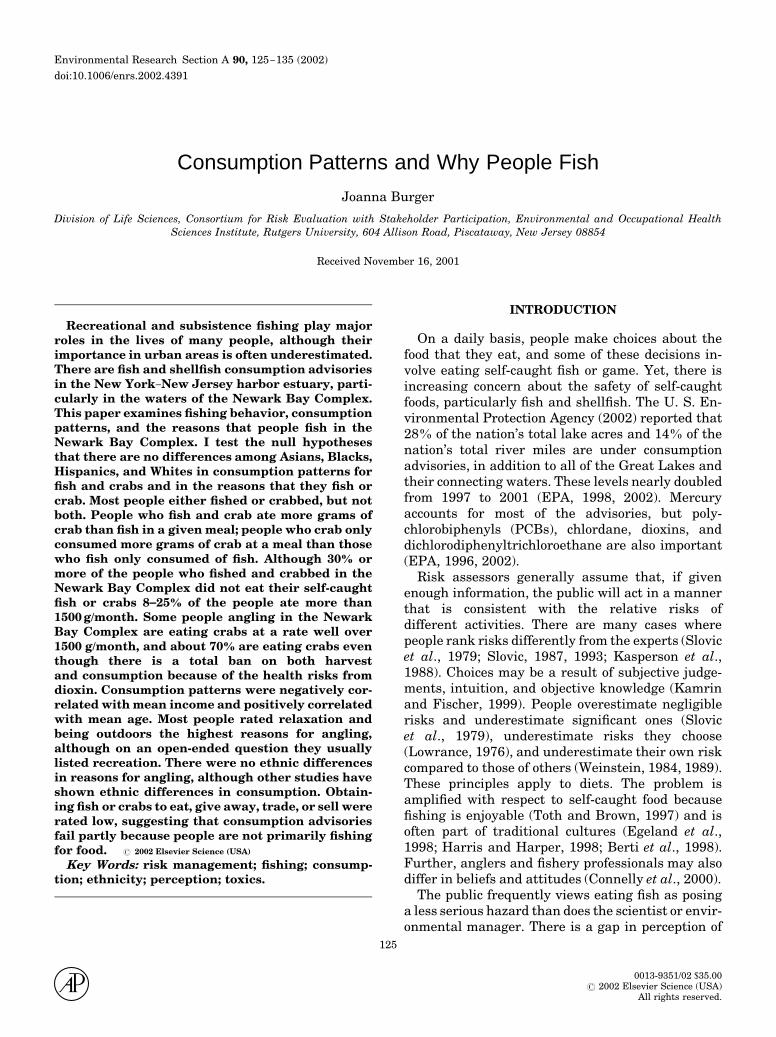
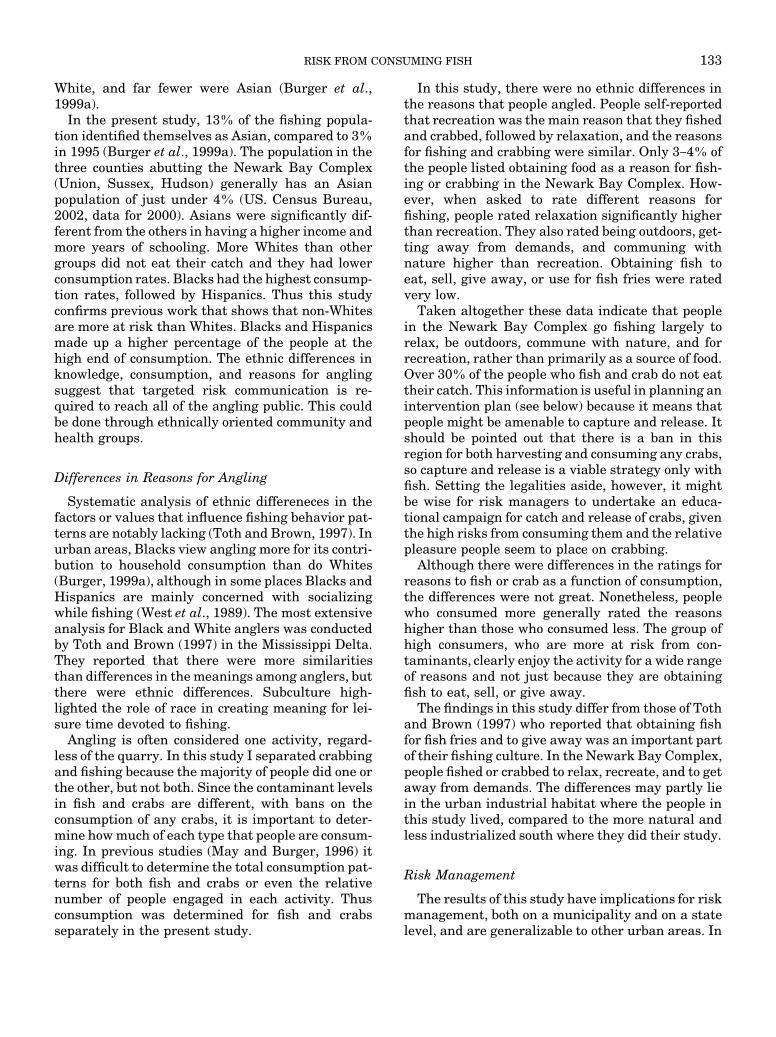
FIG. 1. Map of the Newark Bay Complex showingangling locations where people were interviewed in 1999.
126 JOANNA BURGER
risk by some of the 7sh-consuming public and theagencies issuing the advisories (Belton et al., 1986;Fiore et al., 1989; EPA, 1989; Reinert et al., 1991,1996; Ebert, 1996). People are aware of advisories,but some populations continue to consume the 7shnonetheless (Reinert et al., 1991; Burger andGochfeld, 1991; Burger et al., 1992, 1993, 1999a,1999b; May and Burger, 1996). In other regions,health advisories have changed 7sh consumptionpatterns (Connelly et al., 1996).
From a risk reduction viewpoint, it is important tounderstand the variables that are correlated withconsumption patterns, such as education, income,and ethnicity (Burger et al. 1999a; P8ugh et al.,1999), because they can be used in risk communica-tion. Yet few risk assessors understand or evaluatethe sociological reasons that people 7sh, which maybe equally important. While many people 7sh toobtain protein, either because they like 7sh or arecompelled by economic or health reasons to do so,others may 7sh for a variety of other reasons havinglittle to do with eating 7sh (Toth and Brown, 1997;Harris and Harper, 1998). Fish consumption may bea by-product of catching 7sh, a desirable family andrecreational activity in itself. Yet the reasons for7shing, and its role within a person’s culture andtradition, are seldom examined within a study aimedat understanding 7sh consumption patterns.
In this paper I examine the consumption patternsand the reasons for 7shing of people 7shing in theNewark Bay Complex of the New York-New Jerseyharbor. I was particularly interested in ethnicdifferences in the reasons for 7shing that might beuseful in understanding the dissonance betweenconsumption advisories and consumption patterns.
The Newark Bay Complex and the New York}NewJersey harbor estuary is ethnically, economically,and culturally diverse and is one of the most pollutedin the United States (Ayres and Rod, 1986; O’Connorand Ehler, 1991; Squibb, 1992). There are consump-tion advisories promulgated (NYSDOH, 1994;NJDEP, 1994). The contaminants of concern inthe Newark Bay Complex are PCBs and dioxins.Recently Finley et al. (1997) examined the levels ofPCBs in striped bass and other 7sh from the lowerPassaic River; concentrations exceeded the NationalOceanic and Atmospheric Administration bench-mark level. Both states issue advisories for bluecrabs (Callinectes sapidus), blue 7sh (Pomatomussaltatrix), striped bass (Morone saxatilis), andAmerican eel (Anguilla rostrata), and New Jerseyhas advisories for white perch (Morone americana)and white cat7sh (Ameiurus [Ictalurus] catus).Advisories in the Newark Bay Complex range from
‘‘do not eat’’ (crab) to eat no more than once a month(pregnant women and those of child-bearing age,children) or ‘‘once a week’’ (all others) for the listed7sh species. Pregnant and nursing women, and in-fants and children up to 15 years of age, are con-sidered high-risk individuals (Hauge, 1993). NewYork State recently issued an advisory which statedthat no women or children should eat striped bass(NYDOH, 2002).
Since some people do not follow consumption ad-visories, it is of public health policy interest tounderstand why people 7sh and what they eat.While our previous work has examined some of thesequestions (Burger et al., 1999a; P8ugh et al., 1999),these studies did not relate the reasons that people7sh to their consumption patterns.
METHODS
Subjects
We interviewed 267 people angling at several loca-tions in the Newark Bay Complex (Fig. 1). On a regu-lar basis from 15 May until 15 September, we visitedall sites and approached all people that were pres-ent. Sites were visited on weekdays and weekendsand at all times of day. We alternated weekends andweekdays and randomly selected the sites each dayso that times of day varied. Although we saw thesame people at these locations from time to time,each person was interviewed only once. One of theinterviewers was Hispanic and spoke Spanish8uently. Although the results of the study clearlyrepresent those interviewed, there is no reason to
RISK FROM CONSUMING FISH 127
assume that this does not represent the 7shingpublic using this area because we interviewednearly everyone present and sampled at all times ofday, on both weekends and weekdays.
Interview Procedures
Subjects were interviewed individually while they7shed or crabbed (hereafter called angling). The in-terviews were conducted by two interviewers whohad conducted similar interviews in the past andwere speci7cally trained for this project. All inter-views were conducted during the day; people did not7sh at night here. Once they reached an angling site,they interviewed everyone present. They 7rst identi-7ed themselves as researchers from Rutgers Univer-sity who were interested in 7shing behavior,consumption, and reasons for angling. Demographicquestions were deferred until the end of the inter-view when we explained more fully what we weredoing. Most people were interested in the survey andinquired about how they could 7nd out our results.Only eight people refused to be interviewed, sayingthey were leaving immediately; a 3% refusal rate isvery low and is not suf7cient to bias our results.
The questionnaire was divided into four partsdealing with demographics, consumption behavior(and information concerning serving size), know-ledge of advisories (discussed elsewhere; see Burger,2002), and reasons for angling. We did not ask themto report on household consumption, but only ontheir own consumption pattern. Consumption wasdetermined by multiplying the number of meals (of7sh and crabs) per month by portion size. Cues toportion size were given by providing subjects witha three-dimensional model of an 8-oz. 7sh 7llet forcomparison with their typical meals, and inter-viewers mentioned tuna cans as an additionalprompt. The estimate, in ounces consumed, was con-verted to grams for this paper.
We asked them why they 7shed or crabbed in anopen-ended question and then asked them to rateseveral reasons that they might angle on a scale of1 (not a reason) to 5 (one of the main and mostimportant reasons that they angled). The list thatwe provided them was derived partly from Toth andBrown (1997) and partly from local knowledge fromprevious surveys in the region (Burger et al., 1999a;P8ugh et al., 1999). Ratings were on a Likert scaleof 1 (lowest value) to 5 (highest value).
Demographic information included ethnicity, gen-der, age, location of residence, occupation, andincome. Ethnicity was by self identi7cation. Dueto small sample sizes, American Indians are not
considered further. Because of the potential delicatenature of the demographic information such as in-come, these questions were asked last. The entiresurvey took about 20 min to complete, althoughsome people lingered longer to ask questions aboutour research. The length of the survey is within theguidelines suggested for dietary surveys (Block et al.,1986) and followed Frey and Oishi (1985). In general,people were interested and volunteered informationabout 7shing, consumption, and why they 7shed.
I computed consumption by multiplying, for bothcrabs and 7sh, the average number of meals eaten bythe average serving size. The edible portion of a crabwas assumed to be 70 g, based on studies conductedby the New Jersey Department of EnvironmentalProtection. I computed a monthly consumption rateand multiplied this monthly rate by the number ofmonths that people ate self-caught 7sh or crabs.Thus yearly consumption was computed for eachperson individually. Unlike previous studies,I divided the data into those who crabbed only, thosewho 7shed only, and those who did both becauseotherwise it is dif7cult to compute risk from con-sumption. Most studies examine only 7sh consump-tion and do not consider shell7sh consumption. Yetif people are consuming both, this information isessential for risk assessments.
Statistical Analysis
For analysis, the data were divided by age classes:32 years and under, 33}45 years, and 46 years andover; income was divided as up to and including$20,000, over $20,000 to $30,000, and over $30,000,mainly for consistency with other, previous studies(Burger et al., 1999a; P8ugh et al., 1999). For someanalyses, the unit was municipality to allow a cor-relation with income or age and consumption pat-terns, partly because signage, information, andother risk management is handled by municipality.That is, the data from this paper will be useful tomunicipalities in planning their risk managementand risk communication programs.
Kruskal}Wallis X2 and Contingency tests wereused to determine whether there were differences asa function of race, age, and income (SAS, 1994).Kendall tau correlations were also used to examinerelationships. Means and standard errors are givenin the text.
RESULTS
Demographics
Of the 267 people interviewed, 13% were Asian,21% were Hispanic, 23% were Black, and the rest
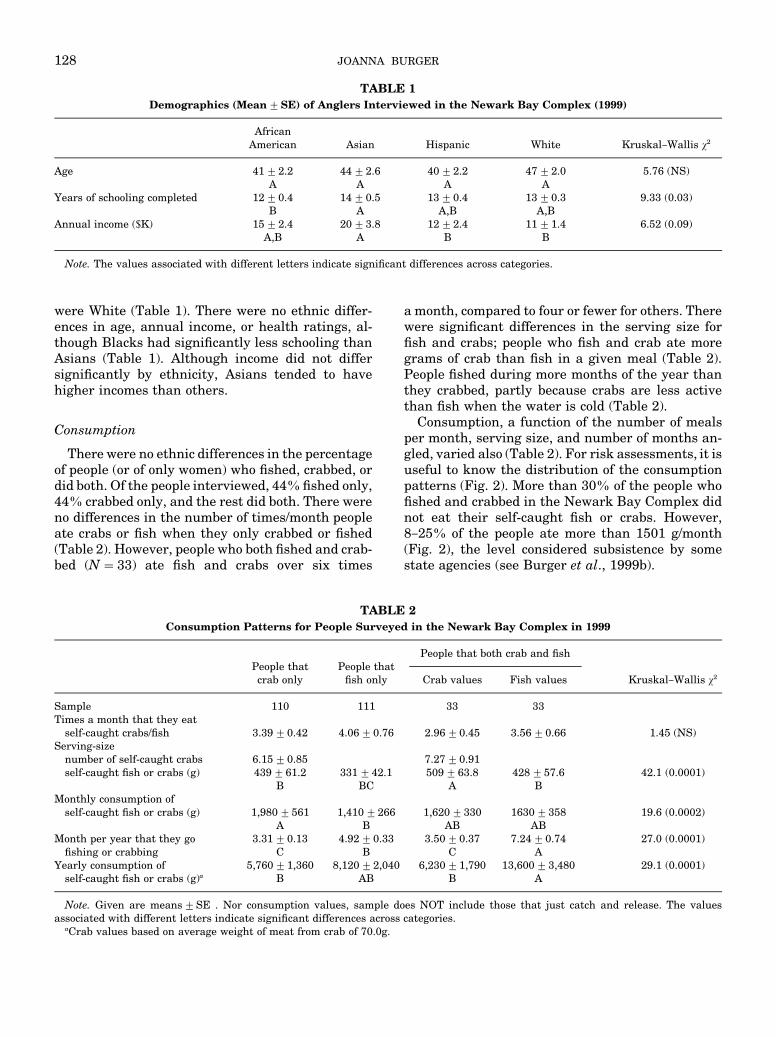
TABLE 1Demographics (Mean$SE) of Anglers Interviewed in the Newark Bay Complex (1999)
AfricanAmerican Asian Hispanic White Kruskal}Wallis �2
Age 41$2.2 44$2.6 40$2.2 47$2.0 5.76 (NS)A A A A
Years of schooling completed 12$0.4 14$0.5 13$0.4 13$0.3 9.33 (0.03)B A A,B A,B
Annual income ($K) 15$2.4 20$3.8 12$2.4 11$1.4 6.52 (0.09)A,B A B B
Note. The values associated with different letters indicate signi7cant differences across categories.
128 JOANNA BURGER
were White (Table 1). There were no ethnic differ-ences in age, annual income, or health ratings, al-though Blacks had signi7cantly less schooling thanAsians (Table 1). Although income did not differsigni7cantly by ethnicity, Asians tended to havehigher incomes than others.
Consumption
There were no ethnic differences in the percentageof people (or of only women) who 7shed, crabbed, ordid both. Of the people interviewed, 44% 7shed only,44% crabbed only, and the rest did both. There wereno differences in the number of times/month peopleate crabs or 7sh when they only crabbed or 7shed(Table 2). However, people who both 7shed and crab-bed (N"33) ate 7sh and crabs over six times
TABLConsumption Patterns for People Survey
People that People thatcrab only 7sh only
Sample 110 111Times a month that they eat
self-caught crabs/7sh 3.39$0.42 4.06$0.76Serving-size
number of self-caught crabs 6.15$0.85self-caught 7sh or crabs (g) 439$61.2 331$42.1
B BCMonthly consumption of
self-caught 7sh or crabs (g) 1,980$561 1,410$266A B
Month per year that they go 3.31$0.13 4.92$0.337shing or crabbing C B
Yearly consumption of 5,760$1,360 8,120$2,040self-caught 7sh or crabs (g)a B AB
Note. Given are means$SE . Nor consumption values, sample dassociated with different letters indicate signi7cant differences acros
aCrab values based on average weight of meat from crab of 70.0g.
a month, compared to four or fewer for others. Therewere signi7cant differences in the serving size for7sh and crabs; people who 7sh and crab ate moregrams of crab than 7sh in a given meal (Table 2).People 7shed during more months of the year thanthey crabbed, partly because crabs are less activethan 7sh when the water is cold (Table 2).
Consumption, a function of the number of mealsper month, serving size, and number of months an-gled, varied also (Table 2). For risk assessments, it isuseful to know the distribution of the consumptionpatterns (Fig. 2). More than 30% of the people who7shed and crabbed in the Newark Bay Complex didnot eat their self-caught 7sh or crabs. However,8}25% of the people ate more than 1501 g/month(Fig. 2), the level considered subsistence by somestate agencies (see Burger et al., 1999b).
E 2ed in the Newark Bay Complex in 1999
People that both crab and 7sh
Crab values Fish values Kruskal}Wallis �2
33 33
2.96$0.45 3.56$0.66 1.45 (NS)
7.27$0.91509$63.8 428$57.6 42.1 (0.0001)
A B
1,620$330 1630$358 19.6 (0.0002)AB AB
3.50$0.37 7.24$0.74 27.0 (0.0001)C A
6,230$1,790 13,600$3,480 29.1 (0.0001)B A
oes NOT include those that just catch and release. The valuess categories.
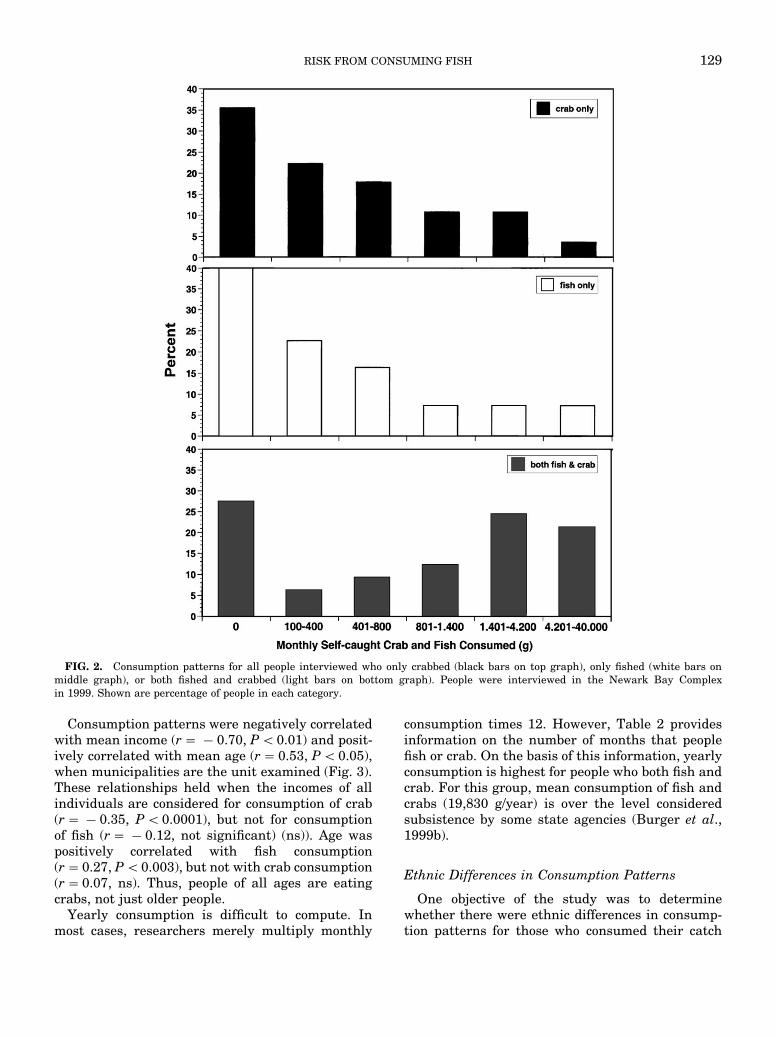
FIG. 2. Consumption patterns for all people interviewed who only crabbed (black bars on top graph), only 7shed (white bars onmiddle graph), or both 7shed and crabbed (light bars on bottom graph). People were interviewed in the Newark Bay Complexin 1999. Shown are percentage of people in each category.
RISK FROM CONSUMING FISH 129
Consumption patterns were negatively correlatedwith mean income (r"!0.70, P(0.01) and posit-ively correlated with mean age (r"0.53, P(0.05),when municipalities are the unit examined (Fig. 3).These relationships held when the incomes of allindividuals are considered for consumption of crab(r"!0.35, P(0.0001), but not for consumptionof 7sh (r"!0.12, not signi7cant) (ns)). Age waspositively correlated with 7sh consumption(r"0.27, P(0.003), but not with crab consumption(r"0.07, ns). Thus, people of all ages are eatingcrabs, not just older people.
Yearly consumption is dif7cult to compute. Inmost cases, researchers merely multiply monthly
consumption times 12. However, Table 2 providesinformation on the number of months that people7sh or crab. On the basis of this information, yearlyconsumption is highest for people who both 7sh andcrab. For this group, mean consumption of 7sh andcrabs (19,830 g/year) is over the level consideredsubsistence by some state agencies (Burger et al.,1999b).
Ethnic Differences in Consumption Patterns
One objective of the study was to determinewhether there were ethnic differences in consump-tion patterns for those who consumed their catch
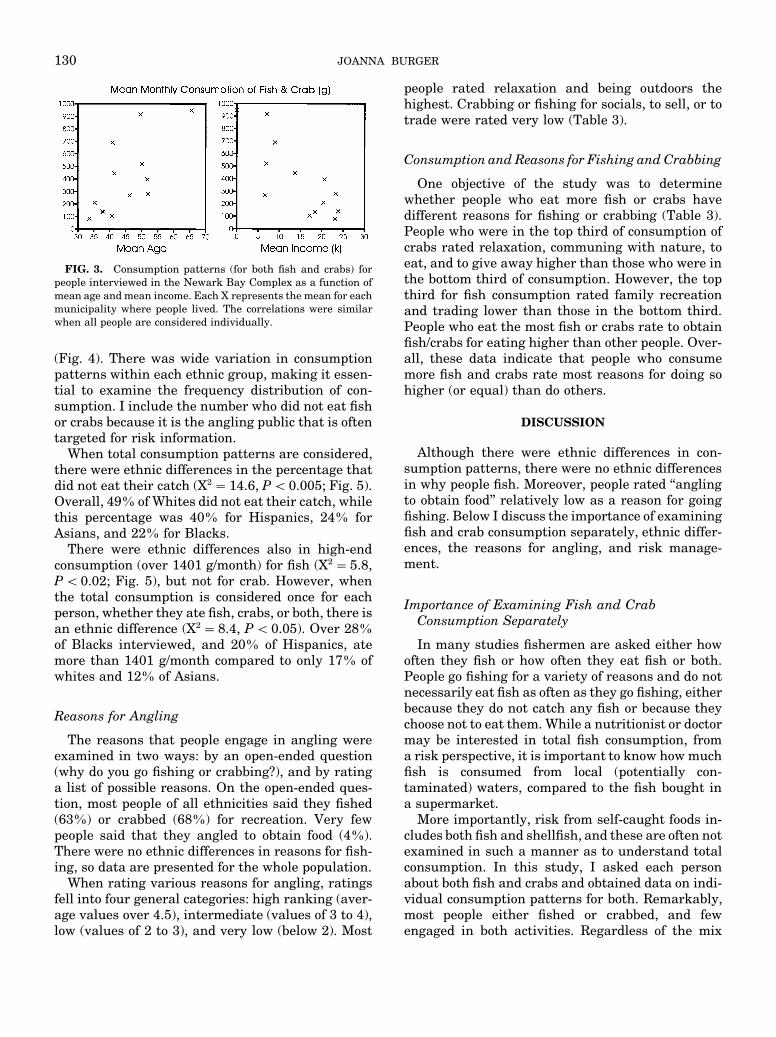
FIG. 3. Consumption patterns (for both 7sh and crabs) forpeople interviewed in the Newark Bay Complex as a function ofmean age and mean income. Each X represents the mean for eachmunicipality where people lived. The correlations were similarwhen all people are considered individually.
130 JOANNA BURGER
(Fig. 4). There was wide variation in consumptionpatterns within each ethnic group, making it essen-tial to examine the frequency distribution of con-sumption. I include the number who did not eat 7shor crabs because it is the angling public that is oftentargeted for risk information.
When total consumption patterns are considered,there were ethnic differences in the percentage thatdid not eat their catch (X2
"14.6, P(0.005; Fig. 5).Overall, 49% of Whites did not eat their catch, whilethis percentage was 40% for Hispanics, 24% forAsians, and 22% for Blacks.
There were ethnic differences also in high-endconsumption (over 1401 g/month) for 7sh (X2
"5.8,P(0.02; Fig. 5), but not for crab. However, whenthe total consumption is considered once for eachperson, whether they ate 7sh, crabs, or both, there isan ethnic difference (X2
"8.4, P(0.05). Over 28%of Blacks interviewed, and 20% of Hispanics, atemore than 1401 g/month compared to only 17% ofwhites and 12% of Asians.
Reasons for Angling
The reasons that people engage in angling wereexamined in two ways: by an open-ended question(why do you go 7shing or crabbing?), and by ratinga list of possible reasons. On the open-ended ques-tion, most people of all ethnicities said they 7shed(63%) or crabbed (68%) for recreation. Very fewpeople said that they angled to obtain food (4%).There were no ethnic differences in reasons for 7sh-ing, so data are presented for the whole population.
When rating various reasons for angling, ratingsfell into four general categories: high ranking (aver-age values over 4.5), intermediate (values of 3 to 4),low (values of 2 to 3), and very low (below 2). Most
people rated relaxation and being outdoors thehighest. Crabbing or 7shing for socials, to sell, or totrade were rated very low (Table 3).
Consumption and Reasons for Fishing and Crabbing
One objective of the study was to determinewhether people who eat more 7sh or crabs havedifferent reasons for 7shing or crabbing (Table 3).People who were in the top third of consumption ofcrabs rated relaxation, communing with nature, toeat, and to give away higher than those who were inthe bottom third of consumption. However, the topthird for 7sh consumption rated family recreationand trading lower than those in the bottom third.People who eat the most 7sh or crabs rate to obtain7sh/crabs for eating higher than other people. Over-all, these data indicate that people who consumemore 7sh and crabs rate most reasons for doing sohigher (or equal) than do others.
DISCUSSION
Although there were ethnic differences in con-sumption patterns, there were no ethnic differencesin why people 7sh. Moreover, people rated ‘‘anglingto obtain food’’ relatively low as a reason for going7shing. Below I discuss the importance of examining7sh and crab consumption separately, ethnic differ-ences, the reasons for angling, and risk manage-ment.
Importance of Examining Fish and CrabConsumption Separately
In many studies 7shermen are asked either howoften they 7sh or how often they eat 7sh or both.People go 7shing for a variety of reasons and do notnecessarily eat 7sh as often as they go 7shing, eitherbecause they do not catch any 7sh or because theychoose not to eat them. While a nutritionist or doctormay be interested in total 7sh consumption, froma risk perspective, it is important to know how much7sh is consumed from local (potentially con-taminated) waters, compared to the 7sh bought ina supermarket.
More importantly, risk from self-caught foods in-cludes both 7sh and shell7sh, and these are often notexamined in such a manner as to understand totalconsumption. In this study, I asked each personabout both 7sh and crabs and obtained data on indi-vidual consumption patterns for both. Remarkably,most people either 7shed or crabbed, and fewengaged in both activities. Regardless of the mix
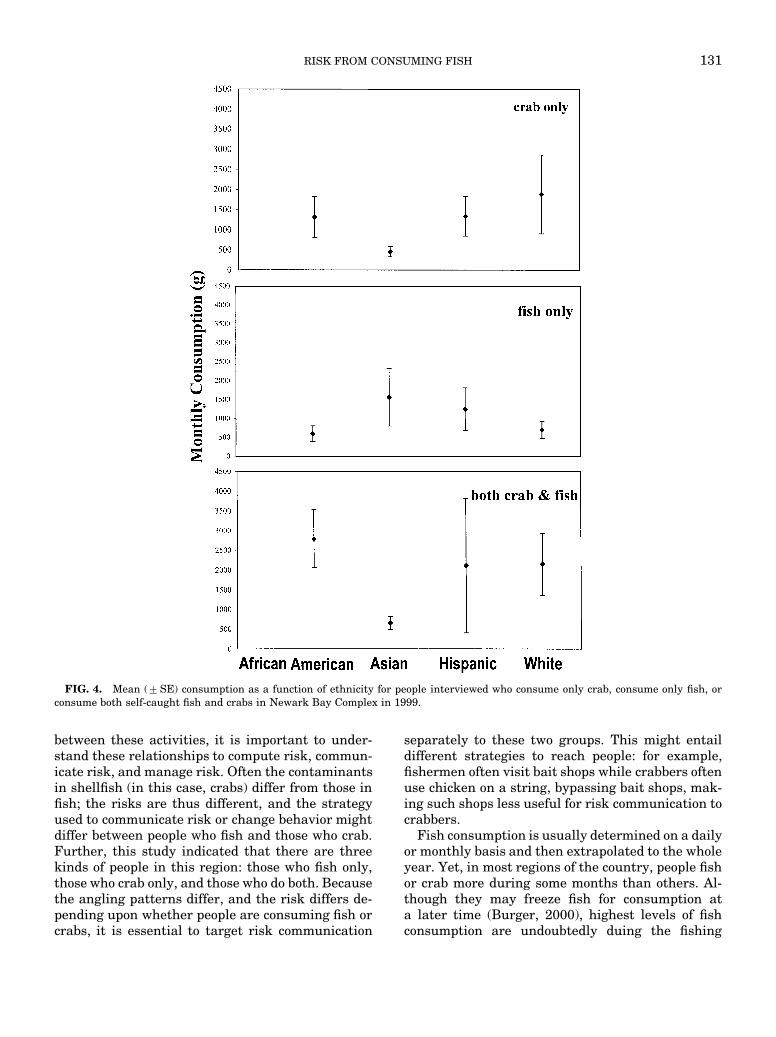
FIG. 4. Mean ($SE) consumption as a function of ethnicity for people interviewed who consume only crab, consume only 7sh, orconsume both self-caught 7sh and crabs in Newark Bay Complex in 1999.
RISK FROM CONSUMING FISH 131
between these activities, it is important to under-stand these relationships to compute risk, commun-icate risk, and manage risk. Often the contaminantsin shell7sh (in this case, crabs) differ from those in7sh; the risks are thus different, and the strategyused to communicate risk or change behavior mightdiffer between people who 7sh and those who crab.Further, this study indicated that there are threekinds of people in this region: those who 7sh only,those who crab only, and those who do both. Becausethe angling patterns differ, and the risk differs de-pending upon whether people are consuming 7sh orcrabs, it is essential to target risk communication
separately to these two groups. This might entaildifferent strategies to reach people: for example,7shermen often visit bait shops while crabbers oftenuse chicken on a string, bypassing bait shops, mak-ing such shops less useful for risk communication tocrabbers.
Fish consumption is usually determined on a dailyor monthly basis and then extrapolated to the wholeyear. Yet, in most regions of the country, people 7shor crab more during some months than others. Al-though they may freeze 7sh for consumption ata later time (Burger, 2000), highest levels of 7shconsumption are undoubtedly duing the 7shing
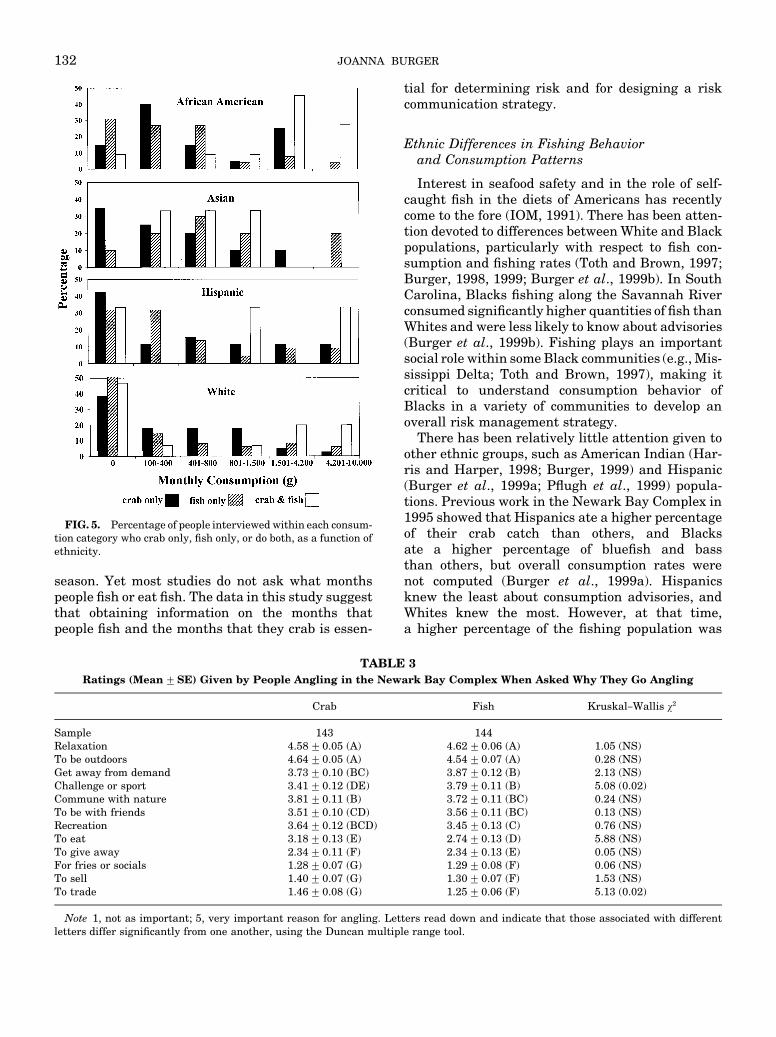
FIG. 5. Percentage of people interviewed within each consum-tion category who crab only, 7sh only, or do both, as a function ofethnicity.
TABLRatings (Mean$SE) Given by People Angling in the New
Crab
Sample 143Relaxation 4.58$0.05 (A)To be outdoors 4.64$0.05 (A)Get away from demand 3.73$0.10 (BC)Challenge or sport 3.41$0.12 (DE)Commune with nature 3.81$0.11 (B)To be with friends 3.51$0.10 (CD)Recreation 3.64$0.12 (BCD)To eat 3.18$0.13 (E)To give away 2.34$0.11 (F)For fries or socials 1.28$0.07 (G)To sell 1.40$0.07 (G)To trade 1.46$0.08 (G)
Note 1, not as important; 5, very important reason for angling. Leletters differ signi7cantly from one another, using the Duncan multip
season. Yet most studies do not ask what monthspeople 7sh or eat 7sh. The data in this study suggestthat obtaining information on the months thatpeople 7sh and the months that they crab is essen-
132 JOANNA BURGER
tial for determining risk and for designing a riskcommunication strategy.
Ethnic Differences in Fishing Behaviorand Consumption Patterns
Interest in seafood safety and in the role of self-caught 7sh in the diets of Americans has recentlycome to the fore (IOM, 1991). There has been atten-tion devoted to differences between White and Blackpopulations, particularly with respect to 7sh con-sumption and 7shing rates (Toth and Brown, 1997;Burger, 1998, 1999; Burger et al., 1999b). In SouthCarolina, Blacks 7shing along the Savannah Riverconsumed signi7cantly higher quantities of 7sh thanWhites and were less likely to know about advisories(Burger et al., 1999b). Fishing plays an importantsocial role within some Black communities (e.g., Mis-sissippi Delta; Toth and Brown, 1997), making itcritical to understand consumption behavior ofBlacks in a variety of communities to develop anoverall risk management strategy.
There has been relatively little attention given toother ethnic groups, such as American Indian (Har-ris and Harper, 1998; Burger, 1999) and Hispanic(Burger et al., 1999a; P8ugh et al., 1999) popula-tions. Previous work in the Newark Bay Complex in1995 showed that Hispanics ate a higher percentageof their crab catch than others, and Blacksate a higher percentage of blue7sh and bassthan others, but overall consumption rates werenot computed (Burger et al., 1999a). Hispanicsknew the least about consumption advisories, andWhites knew the most. However, at that time,a higher percentage of the 7shing population was
E 3ark Bay Complex When Asked Why They Go Angling
Fish Kruskal}Wallis �2
1444.62$0.06 (A) 1.05 (NS)4.54$0.07 (A) 0.28 (NS)3.87$0.12 (B) 2.13 (NS)3.79$0.11 (B) 5.08 (0.02)3.72$0.11 (BC) 0.24 (NS)3.56$0.11 (BC) 0.13 (NS)3.45$0.13 (C) 0.76 (NS)2.74$0.13 (D) 5.88 (NS)2.34$0.13 (E) 0.05 (NS)1.29$0.08 (F) 0.06 (NS)1.30$0.07 (F) 1.53 (NS)1.25$0.06 (F) 5.13 (0.02)
tters read down and indicate that those associated with differentle range tool.
RISK FROM CONSUMING FISH 133
White, and far fewer were Asian (Burger et al.,1999a).
In the present study, 13% of the 7shing popula-tion identi7ed themselves as Asian, compared to 3%in 1995 (Burger et al., 1999a). The population in thethree counties abutting the Newark Bay Complex(Union, Sussex, Hudson) generally has an Asianpopulation of just under 4% (US. Census Bureau,2002, data for 2000). Asians were signi7cantly dif-ferent from the others in having a higher income andmore years of schooling. More Whites than othergroups did not eat their catch and they had lowerconsumption rates. Blacks had the highest consump-tion rates, followed by Hispanics. Thus this studycon7rms previous work that shows that non-Whitesare more at risk than Whites. Blacks and Hispanicsmade up a higher percentage of the people at thehigh end of consumption. The ethnic differences inknowledge, consumption, and reasons for anglingsuggest that targeted risk communication is re-quired to reach all of the angling public. This couldbe done through ethnically oriented community andhealth groups.
Differences in Reasons for Angling
Systematic analysis of ethnic differeneces in thefactors or values that in8uence 7shing behavior pat-terns are notably lacking (Toth and Brown, 1997). Inurban areas, Blacks view angling more for its contri-bution to household consumption than do Whites(Burger, 1999a), although in some places Blacks andHispanics are mainly concerned with socializingwhile 7shing (West et al., 1989). The most extensiveanalysis for Black and White anglers was conductedby Toth and Brown (1997) in the Mississippi Delta.They reported that there were more similaritiesthan differences in the meanings among anglers, butthere were ethnic differences. Subculture high-lighted the role of race in creating meaning for lei-sure time devoted to 7shing.
Angling is often considered one activity, regard-less of the quarry. In this study I separated crabbingand 7shing because the majority of people did one orthe other, but not both. Since the contaminant levelsin 7sh and crabs are different, with bans on theconsumption of any crabs, it is important to deter-mine how much of each type that people are consum-ing. In previous studies (May and Burger, 1996) itwas dif7cult to determine the total consumption pat-terns for both 7sh and crabs or even the relativenumber of people engaged in each activity. Thusconsumption was determined for 7sh and crabsseparately in the present study.
In this study, there were no ethnic differences inthe reasons that people angled. People self-reportedthat recreation was the main reason that they 7shedand crabbed, followed by relaxation, and the reasonsfor 7shing and crabbing were similar. Only 3}4% ofthe people listed obtaining food as a reason for 7sh-ing or crabbing in the Newark Bay Complex. How-ever, when asked to rate different reasons for7shing, people rated relaxation signi7cantly higherthan recreation. They also rated being outdoors, get-ting away from demands, and communing withnature higher than recreation. Obtaining 7sh toeat, sell, give away, or use for 7sh fries were ratedvery low.
Taken altogether these data indicate that peoplein the Newark Bay Complex go 7shing largely torelax, be outdoors, commune with nature, and forrecreation, rather than primarily as a source of food.Over 30% of the people who 7sh and crab do not eattheir catch. This information is useful in planning anintervention plan (see below) because it means thatpeople might be amenable to capture and release. Itshould be pointed out that there is a ban in thisregion for both harvesting and consuming any crabs,so capture and release is a viable strategy only with7sh. Setting the legalities aside, however, it mightbe wise for risk managers to undertake an educa-tional campaign for catch and release of crabs, giventhe high risks from consuming them and the relativepleasure people seem to place on crabbing.
Although there were differences in the ratings forreasons to 7sh or crab as a function of consumption,the differences were not great. Nonetheless, peoplewho consumed more generally rated the reasonshigher than those who consumed less. The group ofhigh consumers, who are more at risk from con-taminants, clearly enjoy the activity for a wide rangeof reasons and not just because they are obtaining7sh to eat, sell, or give away.
The 7ndings in this study differ from those of Tothand Brown (1997) who reported that obtaining 7shfor 7sh fries and to give away was an important partof their 7shing culture. In the Newark Bay Complex,people 7shed or crabbed to relax, recreate, and to getaway from demands. The differences may partly liein the urban industrial habitat where the people inthis study lived, compared to the more natural andless industrialized south where they did their study.
Risk Management
The results of this study have implications for riskmanagement, both on a municipality and on a statelevel, and are generalizable to other urban areas. In
134 JOANNA BURGER
New Jersey, and in many other regions, both stateand local of7cials and agencies deal with informa-tion and signage relative to 7shing and consump-tion. That is, it may be more useful for individualmunicipalities to provide much of the risk commun-ication information to the public through local com-munity and health organizations. Each municipalitycould then target the appropriate audience.
The majority of people interviewed mainly 7shedor mainly crabbed, suggesting that some informa-tion that is targeted to each activity should bedeveloped. Understanding the community that is7shing is an important aspect of risk management.Since consumption increased with age of the angler,and decreased with income, thus suggests that in-formation should be directed toward people in thiscategory. Further, Asians ate few crabs and mainly7sh, while the other ethnic groups ate mainly crabs(which have a No Consumption advisory in the re-gion). This suggests that information about crabs isnot penetrating to the public.
Finally, this research indicates that there aremany reasons that people angle in this urban region.They do not angle just to obtain food. Since they areangling to relax, be outdoors, and get away fromdemands, these reasons should be recognized andencouraged, while discouraging the consumption ofcrabs and some 7sh, especially for populations atrisk. The fact that it is forbidden to crab or consumecrabs from this region, yet people do so withouteither legal constraints or getting obviously sick,suggests that this issue requires more public in-formation and education. More attention should bepaid to the importance of angling in the lives of thispopulation, while explaning the risks to at-riskpopulations.
ACKNOWLEDGMENTS
I thank C. Dixon, J. Leonard, M. McMahon, D. Pinto, andS. Shukla for interview and computer assistance and R. Ramos forgraphics. This research was partially funded by the Consortiumfor Risk Evaluation with Stakeholder Participation (CRESP)through the Department of Energy (AI DEFC01-95EW55084;DE-FG 26-00NT 40938) and NIESH (ESO 5022). The results,conclusions, and interpretations reported herein are the sole re-sponsibility of the author and should not in any way be inter-preted as representing the views of the funding agencies.
REFERENCES
Ayres, R. U., and Rod, S. R. (1986). Patterns of pollution inthe Hudson-Raritan basin. Environment 28, 14}43.
Belton, T., Roundy, R., and Weinstein, N. (1986). Urban 7sher-man: Managing the risks of toxic exposure. Environment 28,19}37.
Berti, P. R., Receveur, O., Chan, H. M., and Kuhnlein, H. V.(1998). Dietary exposure to chemical contaminants from tradi-tional food among adult Dene/Metis in the Western NorthwestTerritories, Canada. Environ. Res. 76, 131}141.
Blahna, D. J. (1992). Comparing the preferences of Black, Asian,Hispanic, and White 7shermen at Moraine Hills State Park,Illinois. In ‘‘Proceedings of the Symposium on Social Aspectsand Recreational Research’’ (D. J. Chavez, Tech. Coord.),pp. 42}44. U.S. Dept. of Agriculture, Forest Service, Albany, CA.
Block, G., Hartman, A. M., Dresser, C. M., Carroll, M. D.,Gannon, J., and Gardner, L. (1986). A data-based approachto diet questionnaire designs and testing. Am. J. Epidemiol.124, 453}468.
Burger, J. (1998). Fishing and risk along the Savannah River:Possible intervention. J. Toxicol. Environ. Health 55, 405}419.
Burger, J. (1999). American Indians, hunting and 7shing rates,risk, and the Idaho National Engineering and EnvironmentalLaboratory. Environ. Res. 80, 317}329.
Burger, J. (2000). Gender differences in meal patterns: Roleof self-caught 7sh and wild game in meat and 7sh diets.Environ. Res. 83, 140}149.
Burger, J. (2002). Consumption advisories: Knowledge, compli-ance and why people 7sh in an urban estuary.
Burger, J., and Gochfeld, M. (1991). Fishing a superfund site:Dissonance and risk perception of environmental hazards by7shermen in Puerto Rico. Risk Anal. 11, 269}277.
Burger, J., Cooper, K., and Gochfeld, M. (1992). Exposureassessment for heavy metal ingestion from a sport 7sh inPuerto Rico: Estimating risk for local 7shermen. J. Toxicol.Environ. Health 36, 355}365.
Burger, J. Staine, K., and Gochfeld, M. (1993). Fishing in con-taminated waters: Knowledge and risk perception of hazardsby 7shermen in New York City. J. Toxicol. Environ. Health9, 95}105.
Burger, J., P8ugh, K. K., Lurig, L., vonHagen, L., and vonHagen,S. (1999a) Fishing in urban New Jersey: Ethnicity affectsinformation sources, perception, and compliance. Risk Anal.19, 217}229.
Burger, J. Stephens, W. C., Boring, S., Kuklinski, K., Gibbons,J. W., and Gochfeld, M. (1999b). Factors in exposure assess-ment: Ethnic and socioeconomic differences in 7shing andconsumption of 7sh caught along the Savannah River. RiskAnal. 19, 421}431.
Connelly, N. A., Knuth, B. A., and Brown, T. L. (1996). Sport7shconsumption patterns of Lake Ontario anglers and the relation-ship to health advisories. N. A. J. Fish. Manage. 16, 90}101.
Connelly, N. A., Brown, T. L., and Knuth, B. A. (2000). Do anglersand 7shery professionals think alike? Fisheries 25, 21}25.
Ebert, E. S. (1996). Fish consumption and human health: Devel-oping partnerships beween risk assessors and resourcemanagers. Am. Fish. Soc. Symp. 16, 261}170.
Egeland, G. M., Feyk, L. A., and Middaugh, J. P. (1998). Theuse of traditional foods in a healthy diet in Alaska. AlaskaEpidemiol. Bull. 2, 1}140.
Environmental Protection Agency (EPA). (1989). ‘‘AssessingHuman Risks from Chemically Contaminated Fish and Shel-l7sh: A Guidance Manual.’’ EPA-503/8-89-002, Appendix F.U.S. Environmental Protection Agency, Cincinnati, OH.
Environmental Protection Agency (EPA). (1996).‘‘Update: Nation-al Listing of Fish and Wildlife Consumption Advisories.’’U.S. Environmental Protection Agency, Cincinnati, OH.
RISK FROM CONSUMING FISH 135
Environmental Protection Agency (EPA). (1998). ‘‘Update:National Listing of Fish and Wildlife Consumption Advisories.’’U.S. Environmental Protection Agency, Cincinnati, OH. [Alsoavailable on internet (http://www.epa.gov/ost.7sh)]
Environmental Protection Agency (EPA). (2002). ‘‘Update:National Listing of Fish and Wildlife Consumption Advisories.’’U.S. Environmental Protection Agency, Cincinnati, OH. [Alsoavailable on internet (http://www.epa.gov/ost.7sh)]
Finley, B. L., Trowbridge, K. R., Burton, S., Proctor, D. M., Panko,J. M., and Paustenbach, D. J. (1997). Preliminary assessment ofPCB risks to human and ecological health in the Lower PassaicRiver. J. Toxicol. Environ. Health 52, 95}118.
Fiore, B. J., Anderson, H. A., Hanrahan, L. P., Olson, L. J. andSonzogni, W. G. (1989). Sport 7sh consumption and body bur-den levels of chlorinated hydrocarbons: A study of Wisconsinanglers. Arch. Environ. Health 44, 82}88.
Fleming, L. E., Watkins, S., Kaderman, R., Levin, B., Ayyar,D. R., Bizzio, M. Stephens, D., and Bean, J. A. (1995). Mercuryexposure in humans through food consumption from the Ever-glades of Florida. Water Air Soil Pollut. 80, 41}48.
Frey, J. H., and Oishi, S. M. (1985). ‘‘How to Conduct Interviewsby Telephone and in Person, Vol. 4 of The Survey Kit.’’ SagePublications, Thousand Oaks, CA.
Ginsberg, G. I., and Toal, B. F. (2000). Development of a single-meal 7sh consumption advisory for methyl mercury. Risk Anal.20, 41}47.
Harris, S. G., and Harper, B. L. (1998). Native Americanexposure scenarios and a tribal risk model. Risk Anal. 17,789}795.
Hauge, P. (1993). ‘‘Polychlorinated Biphenyls (PCBs), Chlordane,and DDTs in Selected Fish and Shell7sh from New JerseyWaters, 1988}1991: Results from New Jersey’s Toxics in BiotaMonitoring Program.’’ New Jersey Department of Environ-mental Protection, Division of Science and Research, Trenton,NJ.
Institute of Medicine (IOM). 19910. ‘‘Seafood Safety.’’ NationalAcademy Press, Washington, DC.
Kamrin, M. A., and Fischer, L. J. (1999). Current status of sport7sh consumption advisories for PCBs in the Great Lakes.Reg. Toxicol. Pharmacol. 29, 175}181.
Kasperson, R. E., Renn, O., Slovic, P., Brown, H. S., Emel, J.Goble, R., Kasperson, J. S., and Ratick, S. (1988). The socialampli7cation of risk: A conceptual framework. Risk Anal. 8,177}187.
Lowrance, W. W. (1976). ‘‘Of Acceptable Risk.’’ Kaufman, LosAltos, CA.
May, H., and Burger, J. (1996). Fishing in a polluted estuary:Fishing behavior, 7sh consumption, and potential risk. RiskAnal. 16, 459}471.
New Jersey Department of Environmental Protection, Division ofScience and Research (NJDEP). (1994). ‘‘A Guide to HealthAdvisories for Eating Fish and Crabs in New Jersey.’’ NewJersey Department of Environmental Protection, Division ofScience and Research, Trenton, NJ.
New York State Department of Health (NYSDOH). (1994).‘‘1994}1995 Health Advisories: Chemicals in Sport7sh orGame.’’ New York State Department of Health, Bureau ofToxic Substance Assessment, Albany, NY.
New York State Department of Health (NYDOH). (2002).‘‘2000}2001 Health Advisories: Chemicals in Sport7sh andGame.’’ New York State Department of Health, Bureau ofToxic Substance Assessment, Albany, NY.
O’Connor, T. P., and Ehler, C. N. (1991). Results from the NOAANational Status and Trends Program on distribution andeffects of chemical contamination in the coastal and estuarineUnited States. Environ. Monitor. Assess. 17, 33}49.
P8ugh, K. K., Lurig, L., vonHagen, L. A., vonHagen, S., andBurger, J. (1999). Urban anglers’ perception of risk fromcontaminated 7sh. Sci. Total Environ. 228, 203}218.
Reinert, R. E., Knuth, B. A., Kamrin, M. A., and Stober, Q. J.(1991). Risk assessment, risk management, and 7sh consump-tion advisories in the United States. Fisheries 16, 5}12.
Reinert, R. E., Knuth, B. A., Kamrin,, M. A., and Stober, Q. J.(1996). A review of the basic principles and assumptions usedto issue 7sh consumption advisories. Am. Fish. Soc. Symp.16, 98}106.
SAS Institute, Inc. (1994). ‘‘SAS Users’s Guide.’’ SAS Institute,Cary NC.
Slovic, P. (1987). Perception of risk. Science 236, 280}285.Slovic, P. (1993). Perceived risk, trust, and democracy. Risk
Anal. 13, 675}682.Slovic, P. Fischoff, B., and Lichtenstein, S. (1979). Rating the
risks. Environment 21, 14}20.Squibb, K. S. (1992). Overview of toxics in the harbor estuary.
Tidal Exchange 3, 1}2.Toth, J. F., Jr., and Brown, R. B. (1997). Racial and gender
meanings of why people participate in recreational 7shing.Leis. Sci. 19, 129}136.
Velicer, C. M., and Knuth, B. A. (1994). Communicatingcontaminant risks from sport-caught 7sh: The importance oftarget audience assessment. Risk Anal. 14, 833}841.
Weinstein, N. D. (1984). Why it won’t happen to me: Perceptionsof risk factors and susceptibility. Health Psychol. 3, 431}457.
Weinstein, N. D. (1989). Optimistic biases about personal risks.Science 246, 1232}1233.
West, P. C., John, K. H., McKean, J. R., and Hof, J. G. (1989).Comparing long-run forecasts of demand for 7sh and wildliferecreation. Leis. Sci. 11, 337}351.