consumption of sugar sweetened beverages, artificially ... bmj | bmj 2015; 101h;1576 doi| 1...
TRANSCRIPT
thethinspbmj | BMJ 2015101h1576 | doi1 020076bmjh1576
RESEARCH
1
open access
1Medical Research Council Epidemiology Unit University of Cambridge School of Clinical Medicine Institute of Metabolic Science Cambridge CB2 0QQ UK2Institute of Public Health and Clinical Nutrition University of Eastern Finland Kuopio Finland3Department of Endocrinology Tenri Hospital Tenri City Nara Japan4Department of Healthcare Epidemiology Graduate School of Medicine and Public Health Kyoto University Sakyo-ku Kyoto Japan5Department of Nutrition Harvard T H Chan School of Public Health Boston MA USACorrespondence to F Imamura fumiakiimamuramrc-epidcamacukAdditional material is published online only To view please visit the journal online (httpdxdoiorg101136bmjh3576)Cite this as BMJ 2015351h3576doi 101136bmjh3576
Accepted 19 June 2015
Consumption of sugar sweetened beverages artificially sweetened beverages and fruit juice and incidence of type 2 diabetes systematic review meta-analysis and estimation of population attributable fractionFumiaki Imamura1 Laura OrsquoConnor1 Zheng Ye1 Jaakko Mursu2 Yasuaki Hayashino3 4 Shilpa N Bhupathiraju5 Nita G Forouhi1
ABSTRACTObjeCtivesTo examine the prospective associations between consumption of sugar sweetened beverages artificially sweetened beverages and fruit juice with type 2 diabetes before and after adjustment for adiposity and to estimate the population attributable fraction for type 2 diabetes from consumption of sugar sweetened beverages in the United States and United KingdomDesignSystematic review and meta-analysisData sOurCes anD eligibilityPubMed Embase Ovid and Web of Knowledge for prospective studies of adults without diabetes published until February 2014 The population attributable fraction was estimated in national surveys in the USA 2009-10 (n=4729 representing 1891 million adults without diabetes) and the UK 2008-12 (n=1932 representing 447 million)synthesis methODsRandom effects meta-analysis and survey analysis for population attributable fraction associated with consumption of sugar sweetened beveragesresultsPrespecified information was extracted from 17 cohorts (38 253 cases10 126 754 person years) Higher consumption of sugar sweetened beverages was associated with a greater incidence of type 2
diabetes by 18 per one servingday (95 confidence interval 9 to 28 I2 for heterogeneity=89) and 13 (6 to 21 I2=79) before and after adjustment for adiposity for artificially sweetened beverages 25 (18 to 33 I2=70) and 8 (2 to 15 I2=64) and for fruit juice 5 (minus1 to 11 I2=58) and 7 (1 to 14 I2=51) Potential sources of heterogeneity or bias were not evident for sugar sweetened beverages For artificially sweetened beverages publication bias and residual confounding were indicated For fruit juice the finding was non-significant in studies ascertaining type 2 diabetes objectively (P for heterogeneity=0008) Under specified assumptions for population attributable fraction of 209 million events of type 2 diabetes predicted to occur over 10 years in the USA (absolute event rate 110) 18 million would be attributable to consumption of sugar sweetened beverages (population attributable fraction 87 95 confidence interval 39 to 129) and of 26 million events in the UK (absolute event rate 58) 79 000 would be attributable to consumption of sugar sweetened beverages (population attributable fraction 36 17 to 56)COnClusiOnsHabitual consumption of sugar sweetened beverages was associated with a greater incidence of type 2 diabetes independently of adiposity Although artificially sweetened beverages and fruit juice also showd positive associations with incidence of type 2 diabetes the findings were likely to involve bias None the less both artificially sweetened beverages and fruit juice were unlikely to be healthy alternatives to sugar sweetened beverages for the prevention of type 2 diabetes Under assumption of causality consumption of sugar sweetened beverages over years may be related to a substantial number of cases of new onset diabetes
IntroductionThe health effects of sugar sweetened beverages artifi-cially sweetened beverages and fruit juice have received considerable attention from scientific and public communities The consumption of sugar sweet-ened beverages is likely to contribute to an increase in obesity and the development of type 2 diabetes1-5 Arti-ficially sweetened beverages and fruit juice are candi-date alternatives to sugar sweetened beverages but their prospective associations with type 2 diabetes have
WhAT IS AlReAdy knoWn on ThIS TopICCurrent evidence is limited to answer whether or not consumption of sugar sweetened beverages artificially sweetened beverages and fruit juice is associated with risk of diabetes after adjustment for obesity statusDespite in the debate of a policy intervention to reduce consumption of sugar sweetened beverages no study has estimated how many incident cases of diabetes may be caused by consuming sugar sweetened beverages
WhAT ThIS STudy AddSHabitual consumption of sugar sweetened beverages was positively associated with incidence of type 2 diabetes independently of obesity statusUnder an assumption of causality consumption of sugar sweetened beverages may be linked to 4-13 of type 2 diabetes incidence in the United States and 2-6 in the United Kingdom over 10 years 2010-20Artificially sweetened beverages and fruit juice were both positively associated with incident type 2 diabetes but likely to involve bias and seemed not to be healthy options for the prevention of type 2 diabetes
doi1 020076bmjh1576 | BMJ 2015101h1576 | thethinspbmj
RESEARCH
2
not yet been well established because only a few studies have examined the associations of which potential bias has been debated5-9
Each of these beverage types has been investigated and reviewed for prospective associations with inci-dent type 2 diabetes4-9 A few quantitative reviews were available but one aggregated studies that did and did not adjust for obesity status4 9 and the other separated such studies ad hoc only for those of sugar sweetened beverages and not for those of artificially sweetened beveraor fruit juice5 It is crucial to better characterise the influence of adiposity because obesity can directly cause type 2 diabetes and thus mediate an association between consumption of sugar sweetened beverages and type 2 diabetes4 5 and because obesity can be a confounder by altering dietary habits and confounding an association between beverage consumption and incident type 2 diabetes8 10 Previous studies indeed reported that obese individuals tend to consume more sugar sweetened and artificially sweetened beverages and less fruit juice than leaner individuals6 10 11 More-over despite the growing interest in a policy interven-tion to reduce the consumption of sugar sweetened beverages at a population level12 13 14 no study has translated a prospective association between con-sumption of sugar sweetened beverages and type 2 dia-betes into a measure of its population level impact including population attributable fraction in a con-temporary population
We therefore conducted a systematic review and meta-analysis of prospective studies to test whether or not habitual consumption of sugar sweetened bever-ages artificially sweetened beverages or fruit juice would be associated with the incidence of type 2 diabe-tes We specifically aimed to meta-analyse the associa-tions with and without adjustment for adiposity because the association may be both mediated and con-founded by this factor To provide policy relevant mea-sures we then used the result of the meta-analysis for sugar sweetened beverages to estimate the population attributable fraction for the 10 year risk of developing type 2 diabetes due to consumption of sugar sweetened beverages in contemporary populations of the United States and United Kingdom where approximately half of each population in recent years consumed sugar sweetened beverages1 10
MethodsPatient involvementThere was no patient involvement in this study
study searches and selectionFollowing the PRISMA guidelines15 and the protocol (not registered available on request) we identified relevant studies through hand searches and system-atic searches of four databases on 31 May 2013 (updated on 10 February 2014) PubMed Embase Ovid and Web of Knowledge Search terms included those related to types of beverages diabetes and pro-spective study design (see supplementary information for details) Time and language of publications were
not restricted After the removal of duplicates one author (FI) screened the articles on the basis of the titles and abstracts and three authors (FI LOrsquoC and ZY) independently reviewed them in duplicate We considered studies to be eligible for inclusion if they were of a prospective design assessed the consump-tion of beverages and incident type 2 diabetes and recruited adults free of diabetes and aged 18 years or older We also considered a follow-up of at least two years on average because incidence of diabetes could alter approximately two years after modification of lifestyle16 17
Data extraction and quality assessmentWe extracted information in a standardised manner in duplicate including baseline personal information such as body mass index and duration of follow-up exclusion criteria sample size loss to follow-up assessments of beverage consumption and incident type 2 diabetes types of beverage consumed measures of prospective associations with 95 confidence inter-vals covariates evaluated and sources of funding We extracted measures of associations that were the most adjusted for sociodemographic and lifestyle factors with and without further adjustment for adiposity mea-sures Although adjustment for total energy intake is important to assess4 6 in this meta-analysis we used estimates adjusted for total energy whenever possible for parsimony and potentials for energy adjustment to reduce confounding and measurement errors18 We extracted estimates stratified by age sex and adiposity measures if reported to use in meta-regression to assess heterogeneity Additional information on study design and quality was also obtained from identified articles as well as from relevant articles of identified cohorts
We contacted authors of identified articles to request additional information if the article did not report two types of estimates before and after adjustment for adi-posity based on either categorical or continuous analy-sis for sugar sweetened beverages artificially sweetened beverages and fruit juice separately When we con-tacted authors we requested estimates before and after adjustment for adiposity based on both continuous and categorical variables of each beverage consumed and we requested estimates based on longer follow-up if available In addition we contacted authors of cohorts that did not meet eligibility criteria but could be eligible on the provision of additional information (see supple-mentary table S1)
We examined risks of bias in concordance with the Cochrane tools including a Cochrane risk of bias assessment tool for non-randomised studies of inter-ventions19-21 Seven domains were assessed con-founding selection exposure measurement misclassification over time missing data outcome measurement and selective reporting Bias specific to this meta-analysis included the likelihood of misclas-sifying sugar sweetened fruit drink as fruit juice (for example fruit punch) Sources of bias were evaluated by using meta-regression for each as a potential
thethinspbmj | BMJ 2015101h1576 | doi1 020076bmjh1576
RESEARCH
3
source of heterogeneity meta-analysis excluding studies with a certain type of bias or meta-analysis incorporating quantitative measures of bias (see sup-plementary information) Overall quality of evidence was assessed based on study quality results from sen-sitivity analysis and principles of the grades of rec-ommendation assessment development and evaluation (GRADE)22 One author (FI) first sum-marised the results of bias assessment and quality of overall evidence and these results were discussed among the other authors (FI LOC YZ and NGF) for consensus
meta-analysisWe used Stata 131 for analyses (α two sided P=005 unless indicated) Statistical details are described in the supplementary information Each of sugar sweetened beverages artificially sweetened beverages and fruit juice was considered as the main exposure We defined sugar sweetened beverages as any sweetened bever-ages including sugar sweetened fruit juice not pre-sented as diet or non-caloric beverages Artificially sweetened beverages included low caloric soft drinks as reported in each study Fruit juice was defined as 100 fruit juice or fruit juice assessed separately from fruit drinks We standardised measures of associations to relative risk per one servingday of beverage consump-tion after we confirmed that this unit was the most fre-quently used in studies Because volume per serving was specific to a population ranging from 237 mL (one cup) to 355 mL (12 oz) (median across publications=250 mLday) we repeated meta-analysis to estimate the rel-ative risk for each 250 mLday We converted odds ratios if reported to relative risks23 If a study reported categorical estimates only they were combined to obtain a single dose-response estimate24 If only strati-fied estimates were reported we merged them by fixed effects meta-analysis to derive a cohort specific esti-mate assuming consistency of associations within a cohort
We performed random effects meta-analysis as pre-specified assuming that biological effects of bever-ages in different populations would vary randomly at least by processing and composition of beverages The heterogeneity of associations was expressed by I225 For each of the beverages of interest we esti-mated relative risks before and after adjustment for adiposity measures To assess a magnitude of overall confounding we additionally estimated crude rela-tive risks without any adjustment Non-linear associ-ations were additionally evaluated by cubic spline meta-analysis for which we used available categorical estimates24
In observational studies within person variability of exposure can cause bias26-30 As performed previ-ously26-32 we compiled within person variation of bev-erage consumption in each study and adjusted for them to estimates of each study Uncertainty in self reported diagnosis of type 2 diabetes was also cali-brated for estimates from studies without objective information on incidence of type 2 diabetes33 To compute
relative risks adjusted for within person dietary vari-ation and uncertainty of type 2 diabetes ascertain-ment we pooled the estimates after study specific calibration
Meta-regression was used to assess if heterogeneity of associations across studies depended on population demographics study characteristics and indicators of errors or bias Publication status (peer reviewed or not) selective reporting (yes or no) and mutual adjustment for three beverage types were evaluated after we identi-fied studies with those characteristics Stratified meta-analysis was performed by each variable that pre-dicted heterogeneity (Plt001) and by prespecified vari-ables age sex body mass index and study location In exploratory analysis using multiple variables of study specific factors we reassessed I2 as a magnitude of unexplained heterogeneity
Publication bias was assessed by Eggerrsquos test with a contour enhanced funnel plot and lsquotrim and fillrsquo analy-sis34 If publication bias was indicated we adjusted summary estimates for the bias34 Robustness of sum-mary findings was examined by sensitivity analyses influence analysis32 fixed effects meta-analysis analy-sis using millilitres per day as a unit analysis without studies with a high overall risk of bias and analysis incorporating measures of uncertainty in adjustment for within person dietary variations and diagnosis of type 2 diabetes35
Adiposity is likely to confound an association of beverage consumption with type 2 diabetes particu-larly in research on artificially sweetened bever-ages6 8 10 11 Because of imperfect measurement of adiposity in an epidemiological study36 adjustment for adiposity was likely to be insufficient as discussed previously3 6 32 37-41 Thus to assess if such residual con-founding would be substantial we performed simula-tion analysis to examine the influence of the bias42
type 2 diabetes risk attributable to sugar sweetened beverages in usa and uKWe estimated the risks of type 2 diabetes attributable to consumption of sugar sweetened beverages over 10 years in the USA and UK43 44 These countries contrib-uted to the meta-analysis to the largest extent and pro-vided publically available data on diets and risk factors for type 2 diabetes the US national health and nutri-tion examination survey 2009-1045 and the UK national diet and nutrition survey 2008-1246 The recent cycle was selected for greater generalisability to recent pop-ulations Selecting adults aged 20 years or more and without prevalent diabetes we analysed 4729 US adults and 1932 UK adults Accounting for sampling weight 1891 million US adults and 447 million UK adults were represented
We estimated the population attributable fraction by applying a Cochrane Collaboration algorithm to survey data43 44 We first estimated habitual consumption of sugar sweetened beverages based on 24 hour recalls in the USA and four day food records in the UK Then we estimated the 10 year risk of type 2 diabetes based on a risk prediction algorithm developed and validated in
doi1 020076bmjh1576 | BMJ 2015101h1576 | thethinspbmj
RESEARCH
4
each country47 48 The predicted risk for each individ-ual was considered as an ldquoassumed control riskrdquo44 if the current consumption of sugar sweetened bever-ages would remain constant Then we calculated an alternative risk if the consumption of sugar sweetened beverages would become zero calculating assumed control risktimes(1relative risk per servingday)timesobserved sugar sweetened beverages servingsday The differ-ence between the two risk estimates represented a risk attributable to consumption of sugar sweetened bever-ages Using the risk estimates sampling weights and a population size we estimated the absolute numbers of events over 10 years events attributable to con-sumption of sugar sweetened beverages (absolute risk reduction44) and population attributable fraction (the proportion of events attributable to consumption of sugar sweetened beverages) The estimation assumed causality and no change in individualsrsquo characteris-tics over time Validation of 10 year risk prediction was performed in the US survey in which we pre-dicted diabetes prevalence in 2009-10 by using data collected in 1999-2000 Sensitivity analysis was per-formed to estimate the population attributable frac-tion by varying relative risks and accounting for uncertainty Further details are presented in the sup-plementary information
ResultsAfter the removal of duplicates we identified 1937 arti-cles reviewed 33 in full text and identified 21 articles of 16 cohorts as being eligible for this meta-analysis (see supplementary figure S1) We obtained unpublished information on one cohort from a publication that did not meet eligibility criteria (see supplementary table S1)22 Finally we evaluated data from 17 cohorts (table 1 )11 39-41 49-65 comprising 38 253 cases of type 2 dia-betes over 10 126 756 person years in total No study or publication was funded by industry
The quality of the studies has been examined (see supplementary table S2) Methods of assessing diets and ascertaining type 2 diabetes and validity of these measurements varied across studies (table 1 and sup-plementary table S3) We identified potential bias in the quantitative results for six cohorts based on at least one of the following publication of a conference abstract only62 exclusion of participants lost during follow-up57 63 likelihood of substantial residual con-founding40 and no separation between fruit juice and sugar sweetened beverages (fruit drinks) or between sugar sweetened beverages and artificially sweetened beverages57 64 Selective reporting might exist in some studies39 52 55 58 62 64 but it was unlikely to cause biasmdashfor example reporting only non-quan-titative results for sugar sweetened beverages in a study mainly on artificially sweetened beverages39 Other potential sources of bias were detected but we did not consider them to be substantially influential on overall bias in each study partly based on results of sensitivity analyses No study assessed subtypes of sugar sweetened beverages artificially sweetened
beverages or fruit juice except one that separated beverages by caffeine content49
Confounding was likely to exist in all of the studies As would be expected consumers of artificially sweet-ened beverages tended to be overweight or obese or hypertensive11 39 50 59 66 In longitudinal analysis all studies statistically adjusted for potential confounders such as sociodemographic variables clinical factors (family history of diabetes or prevalent diseases) and lifestyle factors including diet (see supplementary table S4) None of these factors was identified as a single cause of confounding according to studies assessing influence of potential confounding in differ-ent regression models11 41 49-51 54 59 61 63-65 However a com-bination of multiple factors was likely to cause confounding (table 2 and supplementary table S4) After adjustment for multiple potential confounders the relative risk for sugar sweetened beverages was attenuated from 125 to 118 (32 change) and for artifi-cially sweetened beverages from 148 to 125 (43) By contrast the point estimate for fruit juice was shifted upwards from 097 to 105
beverage consumption and type 2 diabetesTable 2 summarises the findings from meta-analysis Higher consumption of sugar sweetened beverages by one serving per day was associated with an 18 greater incidence of type 2 diabetes (95 confidence interval 88 to 28 I2=89) before adjustment for adiposity (fig 1 and table 2) When adjusted for potential media-tion and confounding by adiposity the association was attenuated with the incidence increased by 13 per servingday (58 to 21 I2=79) In the analysis of artificially sweetened beverages in which adiposity was unlikely to be a mediator higher consumption of artificially sweetened beverages by one serving per day was associated with a 25 greater incidence of type 2 diabetes (95 confidence interval 18 to 33 I2=70) before adjustment for adiposity After adjustment the estimate of 25 greater incidence was attenuated to 8 (21 to 15)
In the analysis of fruit juice the influence of adjust-ment for adiposity was in the direction opposite to that of the analysis for sugar sweetened beverages and arti-ficially sweetened beverages The association of fruit juice consumption with incident type 2 diabetes was strengthened after adjustment for adiposity measures Higher consumption of fruit juice by one servingday was associated with a 7 greater incidence of type 2 diabetes (95 confidence interval 08 to 14)
Each of the beverages showed significant non-linear associations (Pgt005) (supplementary figure S2) Cali-bration for within person variation strengthened the association between each type of beverage and incident type 2 diabetes (fig 1 and table 2) For example the rela-tive risk per one servingday of sugar sweetened bever-ages was strengthened from 113 (95 confidence interval 106 to 121) to 128 (112 to 146) Estimates for artificially sweetened beverages were strengthened similarly The influence was small for fruit juice where
thethinspbmj | BMJ 2015101h1576 | doi1 020076bmjh1576
RESEARCH
5
tabl
e 1 |
Cha
ract
eris
tics o
f pro
spec
tive
coho
rt st
udie
s inc
lude
d in
met
a-an
alys
is o
n as
soci
atio
ns b
etw
een
cons
umpt
ion
of su
gar s
wee
tene
d be
vera
ges
art
ifici
ally
swee
tene
d be
vera
ges
and
frui
t ju
ice
and
inci
denc
e of
type
2 d
iabe
tes
Coho
rt c
ount
ry
base
line
year
s
med
ian
follo
w-u
p (y
ears
)no
age
rang
e or
mea
n ag
e (y
ears
)m
en
()
mea
n bm
i
beve
rage
con
sum
ptio
ndaggerin
cide
nt ty
pe 2
dia
bete
sDaggerm
etho
d of
as
sess
men
tty
pes
met
hod
of a
scer
tain
men
tno
of c
ases
(r
ate
1000
)DaggerFM
CHES
Fin
land
5319
66-7
213
743
0440
-69
531
265
Diet
his
tory
SSB
Reco
rds
175
(30
)NH
S I
USA41
51
1984
211
74 5
1340
-69
023
6FF
Qdagger
SSB
ASB
FJ
Self
repo
rt73
00 (4
6)Dagger
KIHD
Fin
land
5419
84-8
918
924
8142
-60
100
268
4 da
y die
t rec
ord
SSBsect
Reco
rds
bio
mar
kers
506
(10
8)CA
RDIA
USA
55 5
6 para19
85-8
618
821
6018
-30
465
245
Diet
his
tory
daggerSS
B A
SB F
JSe
lf re
port
rec
ords
bio
mar
kers
174
(43
)DaggerHP
FS U
SA41
49
5019
8619
340
290
40-7
510
025
5FF
Qdagger
SSB
ASB
FJ
Self
repo
rt32
29 (4
2)Dagger
Iow
a W
HS U
SA62
para19
8610
731
489
55-6
90
270
FFQ
SSB
FJ
Self
repo
rt99
9 (3
0)Dagger
ARIC
men
USA
64
1987
-89
7554
1445
-64
100
272
FFQ
SSBDagger
Self
repo
rt b
iom
arke
rs71
8 (1
77)
ARIC
wom
en U
SA64
19
87-8
977
6790
45-6
40
272
FFQ
SSBDagger
Self
repo
rt b
iom
arke
rs71
9 (1
38)
JPHC
men
Jap
an52
para19
909
812
137
40-5
910
023
5FF
Qdagger
SSB
FJ
Self
repo
rt39
7 (3
3)Dagger
JPHC
wom
en J
apan
52para
1990
99
15 4
4840
-59
023
5FF
Qdagger
SSB
FJ
Self
repo
rt27
9 (1
8)Dagger
FOS
USA
6519
9112
127
3654
245
526
7FF
Qdagger
SSB
ASB
FJ
Reco
rds
sel
f rep
ort
biom
arke
rs30
3 (9
1)NH
S II
USA
41 6
0 61
1991
184
90 4
2324
-44
024
4FF
Qdagger
SSB
ASB
FJ
Self
repo
rt51
21 (3
1)Dagger
EPIC
-Inte
rAct
eig
ht E
urop
ean
coun
tries
1119
91-9
811
727
058
524
378
260
FFQ
SSB
ASB
FJ
Reco
rds
bio
mar
kers
Dagger11
684
(29
)E3
N Fr
ance
40para
1993
124
48 9
8552
80
228
Diet
his
tory
SSB
ASB
FJ
Reco
rds
1054
(17
)SC
HS S
inga
pore
57para
1993
-98
57
43 5
8045
-74
429
230
FFQ
SSB
FJ
Self
repo
rt r
ecor
ds b
iom
arke
rs22
50 (9
0)Dagger
Blac
k W
HS U
SA58
1995
7743
960
21-6
90
276
FFQ
SSB
ASB
FJ
Self
repo
rt25
50 (7
5)Dagger
HIPO
P-OH
P Ja
pan63
para19
993
461
2119
-69
789
226
FFQ
SSB
FJ
Self
repo
rt r
ecor
ds b
iom
arke
rs21
2 (1
02)
MES
A U
SA39
2000
-02
58
5011
45-8
447
427
9FF
QSS
B A
SBSe
lf re
port
rec
ords
bio
mar
kers
413
(14
3)Oc
cupa
tiona
l coh
ort
Japa
n5920
035
520
3735
-55
100
233
FFQ
SSB
ASB
FJ
Reco
rds
bio
mar
kers
170
(151
)AS
B=ar
tifici
ally
sw
eete
ned
beve
rage
s A
RIC=
Athe
rosc
lero
sis R
isk
in C
omm
uniti
es S
tudy
CAR
DIA=
Coro
nary
Arte
ry R
isk
Deve
lopm
ent i
n Yo
ung
Adul
ts S
tudy
EPI
C=Eu
rope
an P
rosp
ectiv
e In
vest
igat
ion
into
Can
cer a
nd N
utrit
ion
Stud
y F
FQ=f
ood
frequ
ency
que
stio
nnai
res
FJ=
fruit
juic
e F
MCH
ES=F
inni
sh M
obile
Clin
ic H
ealth
Exa
min
atio
n Su
rvey
FOS
=Fra
min
gham
Offs
prin
g St
udy
HIP
OP-
OHP
=Hig
h-ris
k an
d Po
pula
tion
Stra
tegy
for O
ccup
atio
nal H
ealth
Pro
mot
ion
Stud
y H
PFS=
Heal
th
Prof
essi
onal
Fol
low
-up
Stud
y JP
HC=J
apan
Pub
lic H
ealth
Cen
ter-b
ased
Pro
spec
tive
Stud
y K
IHD=
Kuop
io Is
chae
mic
Hea
rt Di
seas
e Ri
sk Fa
ctor
Stu
dy M
ESA=
Mul
ti-Et
hnic
Stu
dy o
f Ath
eros
cler
osis
NHS
=Nur
sesrsquo
Heal
th S
tudy
SCH
S=Si
ngap
ore
Chin
ese
Heal
th S
tudy
SSB
=sug
ar s
wee
tene
d be
vera
ges
WHS
=Wom
enrsquos
Heal
th S
tudy
O
rder
ed in
yea
rs o
f bas
elin
e as
sess
men
ts N
umbe
rs re
pres
ent c
itatio
ns A
RIC
and
JPHS
repo
rted
resu
lts s
tratifi
ed b
y sex
In
met
a-an
alys
is s
ex s
tratifi
ed e
stim
ates
wer
e ag
greg
ated
in a
dvan
ce
daggerDie
ts w
ere
asse
ssed
repe
ated
ly d
urin
g fo
llow
-up
and
inco
rpor
ated
in lo
ngitu
dina
l ana
lysi
s JP
HC m
easu
red
repe
ated
ly b
ut u
sed
base
line
FFQ
only
DaggerB
iom
arke
rs in
clud
ed a
ny o
f fas
ting
gluc
ose
two
hour
glu
cose
by o
ral g
luco
se to
lera
nce
test
and
gly
cate
d ha
emog
lobi
n R
ecor
ds in
clud
ed m
edic
al re
cord
s or o
ther
reco
rds f
rom
regi
stry
not
incl
udin
g se
lf re
porte
d in
form
atio
n S
tudi
es a
scer
tain
ing
case
s of t
ype
2 di
abet
es b
y sel
f rep
ort i
nvol
ved
unce
rtai
nty i
n as
cert
ainm
ent
and
thus
num
bers
of c
ases
wer
e re
vise
d by
a p
ositi
ve p
redi
ctiv
e va
lue
(pro
port
ion
of v
erifi
ed c
ases
am
ong
self
repo
rted
case
s) (s
ee su
pple
men
tary
info
rmat
ion
and
tabl
e S3
) Th
e EP
IC-In
terA
ct s
tudy
ado
pted
diff
eren
t met
hods
acr
oss p
artic
ipat
ing
coho
rts
in w
hich
no
coho
rt us
ed s
elf r
epor
ted
diag
nosi
s onl
ysectI
n AR
IC a
nd F
OS a
naly
ses
sug
ar s
wee
tene
d an
d ar
tifici
ally
sw
eete
ned
beve
rage
s wer
e co
mbi
ned
In K
IHD
the
artic
le d
escr
ibed
frui
t jui
ces
but
trea
ted
them
as s
ugar
sw
eete
ned
beve
rage
s b
ecau
se m
ore
than
90
of f
ruit
juic
e co
nsum
ed in
Fin
land
in
1980
s and
1990
s was
sw
eete
ned
with
sug
ars (
confi
rmed
by t
he a
utho
rs)
paraCon
side
red
as h
avin
g po
tent
ial b
ias (
see
supp
lem
enta
ry in
form
atio
n an
d ta
ble
S2)
In e
ach
of C
ARDI
A an
d JP
HC d
istin
ct a
naly
tic a
ppro
ache
s wer
e un
dert
aken
in d
iffer
ent p
ublic
atio
ns b
y the
sam
e au
thor
s Io
wa
WHS
repo
rted
resu
lts o
nly i
n a
conf
eren
ce a
bstra
ct E
3N p
rese
nted
pro
spec
tive
asso
ciat
ions
adj
uste
d fo
r cru
de c
ateg
oric
al v
aria
bles
for b
ody m
ass i
ndex
whi
ch c
ould
cau
se s
ubst
antia
l res
idua
l con
foun
ding
SCH
S pr
esen
ted
resu
lts w
ithou
t cla
ssifi
catio
n be
twee
n 10
0 fr
uit j
uice
an
d su
gar s
wee
tene
d fru
it ju
ice
and
had
a lik
elih
ood
of a
ttriti
on b
ias b
y los
s of f
ollo
w-u
p by
dea
ths (
15
) HI
POP-
OHP
lost
31
of p
artic
ipan
ts d
urin
g fo
llow
-up
whi
ch c
ould
cau
se b
ias d
ue to
diff
eren
tial m
iscl
assi
ficat
ion
doi1 020076bmjh1576 | BMJ 2015101h1576 | thethinspbmj
RESEARCH
6
the relative risk was shifted only slightly from 107 (101 to 114) to 110 (101 to 120)
sensitivity analysis and quality of evidenceNone of the study specific factors evaluated could explain heterogeneity of results for sugar sweetened beverages and artificially sweetened beverages (Pgt01) (see supplementary table S5) Exploratory meta- regression produced an I2 of 234 for sugar sweet-ened beverages and of 678 for artificially sweetened beverages adjusted for population demographics (age sex country incidence) body mass index fol-low-up duration and measures of study quality The results for fruit juice varied by study design While studies assessing self reported type 2 diabetes only showed a positive association the significant associa-tion disappeared in studies ascertaining the incidence of type 2 diabetes by medical records or by blood glu-cose or glycated haemoglobin level (relative risk 108 097 to 120 P for heterogeneity=0008) Additionally studies with repeated measures of diets supported a null finding (098 086 to 111 P for heterogene-ity=0068) These factors of study design explained heterogeneity of the association reducing I2 from 29 to 0 Demographic variables and body mass index did not explain heterogeneity (Pgt014 each) whereas sugar sweetened beverages artificially sweetened beverages and fruit juice were not significantly asso-ciated with type 2 diabetes in studies recruiting more men than women or conducted in Asia with a fewer number of studies than in the main analysis (supple-mentary table S5)
Publication bias was not evident by Eggerrsquos test (Pgt005) except for fruit juice (P=003) where esti-mates with the greater precision showed stronger asso-ciations (fig 2) Trim and fill indicated publication bias for both sugar sweetened and artificially sweetened
beverages (table 2) In particular publication bias could influence inference for artificially sweetened beverages With adjustment for adiposity the relative risk per one servingday of artificially sweetened bev-erages was 129 (108 to 154) before calibration for publication bias and 122 (098 to 152) after calibration (table 2)
Contour enhanced funnel plots indicated that the findings for artificially sweetened beverages and fruit juice were not stable (fig 2) For example if a study with a relative risk of 05 contributed to the meta-analysis associations of artificially sweetened beverages and fruit juice with type 2 diabetes incidence would not be significant In influence analysis positive associations persisted for sugar sweetened beverages and artificially sweetened beverages (see supplementary figure S3) whereas a significant result of fruit juice was not seen after excluding any single studies supporting the posi-tive association
The results varied little by methodological assump-tion (see supplementary table S6) using estimates per 250 mLday (median of 17 studies) rather than per servingday excluding studies with a high risk of potential bias or with relatively large within person dietary variability and incorporating uncertainty of within person variability and precision of type 2 diabe-tes diagnosis When we examined the potential influ-ence of residual confounding by measured adiposity bias towards the null appeared substantial for artifi-cially sweetened beverages (see supplementary figure S4) Under a realistic assumption of a correlation of 080 between measured and true adiposity36 the asso-ciation for sugar sweetened beverages was attenuated by 26 (relative risk 120 104 to 138) for artificially sweetened beverages was attenuated by 96 (101 081 to 125) and for fruit juice was strengthened by 19 (112 103 to 122)
table 2 | associations between consumption of sugar sweetened beverages artificially sweetened beverages and fruit juice and incident type 2 diabetes meta-analysis of prospective cohort studies
beverages (no of cohorts) and models of meta-analysis
not adjusted for adipositydagger adjusted for adipositydaggerrelative risk (95 Ci) i2 () relative risk (95 Ci) i2 ()
sugar sweetened beverages (n=17)Meta-analysis crude 125 (114 to 137) 89 mdash mdash +multivariable adjusted 118 (109 to 128) 89 113 (106 to 121) 79 +calibration for information bias 143 (120 to 170) 86 128 (112 to 146) 73 +calibration for publication bias 142 (119 to 169) 85 127 (110 to 146) 73artificially sweetened beverages (n=10)Meta-analysis crude 148 (135 to 162) 85 mdash mdash +multivariable adjusted 125 (118 to 133) 70 108 (102 to 115) 64 +calibration for information bias 213 (157 to 288) 72 129 (108 to 154) 50 +calibration for publication bias 181 (133 to 247) 76 122 (098 to 152) 64Fruit juices (n=13)Meta-analysis crude 097 (090 to 106) 79 mdash +multivariable adjusted 105 (099 to 111) 58 107 (101 to 114) 51 +calibration for information bias 106 (098 to 114) 49 110 (101 to 120) 29 +calibration for publication bias Not detected mdash Not detected mdashNumber of cohorts varied slightly by models (see fig 1) Crude meta-analysis pooled estimates without any adjustment Multivariable adjusted estimates were based on meta-analysis of estimates adjusted for demographic and lifestyle covariates (see supplementary table S4 for details) Calibration for information bias accounted for within person variation for dietary consumption and imprecise ascertainment of self reported diabetes Calibration for publication bias was carried out if indicated in trim and fill analysis daggerRelative risk and 95 confidence intervals per servingday before and after adjustment for adiposity All relative risks were significant (Plt005) except for artificially sweetened beverages after adjustment for publication bias (P=007)
thethinspbmj | BMJ 2015101h1576 | doi1 020076bmjh1576
RESEARCH
7
We rated the quality of evidence for sugar sweetened beverages artificially sweetened beverages and fruit juice The evidence for sugar sweetened beverages was rated as being of moderate quality The main finding rejected the null hypothesis and was likely to have a small degree of heterogeneity unexplained a dose-re-sponse relation and robustness against potential bias
or limitations including publication bias We rated the evidence for artificially sweetened beverages and fruit juice to be of low quality Findings for artificially sweet-ened beverages were likely to have publication bias and residual confounding and for fruit juice the posi-tive association was not stable and varied by study design
Sugar sweetened beverages
EPIC-InterAct11
ARIC64
Black WHS58
NHS II41 60 61
KIHD54
NHS I41 51
CARDIA55 56
HPFS41 49 50
FOS65
Iowa WHS62
MESA39
Occupation cohort Japan59
SCHS57
HIPOP-OHP63
E3N40
JPHC52
FMCHES53
Overall
Arti13cially sweetened beverages
EPIC-InterAct11
NHS II41 60 61
NHS I41 51
MESA39
HPFS41 49 50
Black WHS58
CARDIA55 56
FOS65
Occupation cohort Japan59
E3N40
Overall
Fruit juice
NHS I41 51
EPIC-InterAct11
NHS II41 60 61
HPFS41 49 50
FOS65
Black WHS58
Iowa WHS62
CARDIA55 56
E3N40
SCHS57
HIPOP-OHP63
JPHC52
Occupation cohort Japan59
Overall
05 1 2 4
Cohort Relative risk(95 CI)
121 (112 to 131)
101 (096 to 106)
110 (105 to 116)
117 (111 to 124)
106 (095 to 118)
139 (130 to 148)
Unavailable
131 (120 to 144)
112 (090 to 140)
Unavailable
Unavailable
108 (088 to 133)
222 (164 to 300)
089 (075 to 106)
282 (087 to 917)
125 (099 to 158)
Unavailable
118 (109 to 128)
I2=890
136 (118 to 156)
120 (116 to 125)
124 (119 to 130)
148 (121 to 180)
123 (115 to 132)
105 (086 to 127)
Unavailable
124 (113 to 137)
134 (090 to 199)
117
125 (118 to 133)
I2=703
114 (108 to 121)
102 (095 to 108)
107 (100 to 114)
105 (097 to 114)
081 (066 to 099)
105 (099 to 111)
Unavailable
Unavailable
083 (061 to 115)
172 (109 to 272)
089 (050 to 158)
111 (082 to 151)
056 (021 to 148)
105 (099 to 111)
I2=579
99
105
105
104
91
102
95
60
63
44
73
05
56
1000
104
209
203
67
176
70
146
22
03
1000
183
172
172
153
56
183
26
13
09
29
03
1000
Relative risk(95 CI)
Weight()
05 1 2 4 05 1 2 4
Relative risk(95 CI)dagger
113 (105 to 122)
101 (096 to 106)
106 (097 to 116)
111 (104 to 119)
105 (095 to 117)
123 (114 to 132)
103 (093 to 114)
122 (110 to 135)
112 (090 to 139)
149 (127 to 175)
086 (063 to 118)
107 (087 to 132)
195 (144 to 265)
089 (075 to 106)
270 (082 to 882)
115 (088 to 150)
150
113 (106 to 121)
I2=798
109 (097 to 123)
104 (100 to 109)
104 (099 to 109)
129 (105 to 158)
106 (099 to 114)
Unavailable
094 (076 to 115)
117 (105 to 131)
125 (084 to 187)
672
108 (102 to 115)
I2=636
111 (105 to 118)
104 (096 to 113)
115 (101 to 131)
107 (098 to 116)
084 (069 to 102)
Unavailable
128 (112 to 146)
100 (085 to 118)
090 (065 to 124)
154 (097 to 245)
083 (047 to 147)
109 (079 to 151)
054 (021 to 141)
107 (101 to 114)
I2=508
88
94
83
90
78
88
79
80
47
62
30
49
32
58
03
38
01
1000
121
214
209
63
180
62
130
20
03
1000
187
163
115
160
72
114
91
33
17
12
32
04
1000
Relative risk(95 CI)dagger
Weight()
Relative risk(95 CI)Dagger
124 (109 to 141)
103 (090 to 118)
110 (095 to 126)
125 (107 to 146)
108 (092 to 127)
156 (131 to 185)
107 (083 to 138)
168 (126 to 223)
127 (080 to 202)
238 (146 to 388)
079 (048 to 129)
120 (068 to 213)
516 (237 to 112)
048 (015 to 158)
902
159
19520
128 (112 to 146)
I2=727
116 (094 to 144)
120 (096 to 149)
120 (094 to 153)
148 (106 to 206)
137 (091 to 208)
Unavailable
085 (052 to 139)
200 (114 to 350)
183 (059 to 568)
6850
129 (108 to 154)
I2=501
113 (104 to 122)
108 (094 to 125)
117 (100 to 137)
114 (096 to 136)
082 (066 to 103)
Unavailable
134 (103 to 175)
100 (066 to 152)
079 (038 to 161)
260 (092 to 741)
031
326
lt01
110 (101 to 120)
I2=298
107
106
105
103
102
99
83
77
49
46
46
37
24
11
02
02
01
1000
192
191
179
139
109
89
74
23
04
1000
279
174
164
141
106
78
36
13
06
01
lt01
lt01
1000
Relative risk(95 CI)Dagger
Weight()
11 684
1437
2550
5121
506
7300
174
3229
303
999
413
170
2250
212
1054
676
175
38 253
11 684
5121
7300
413
3229
2550
174
303
170
1054
31 998
7300
11 684
5121
3229
303
2550
999
174
1054
2250
212
676
170
35 722
No ofcases
Fig 1 | Prospective associations of beverage consumption with incident type 2 diabetes random effects meta-analysis unadjusted for adiposity daggeradjusted for adiposity Daggeradjusted for adiposity and within person variation Cohorts were ordered by weights in the most adjusted model estimates with 95 confidence intervals greater than 10 are not presented supplementary table s4 summarises the covariates adjusted for in each study
doi1 020076bmjh1576 | BMJ 2015101h1576 | thethinspbmj
RESEARCH
8
type 2 diabetes risk attributable to sugar sweetened beveragesOverall sugar sweetened beverages were consumed by 544 of people in the USA and 494 in the UK Of a total population the mean consumption of sugar sweetened beverages was 284 (SD 412) gday in the USA and 114 (SD 157) gday in the UK (fig 3 and supplemen-tary table S7) Absolute event rates over 10 years from 2010 were estimated to be 110 in the USA (209 mil-lion events) and 58 in the UK (26 million events) Assuming a causal effect of consumption of sugar sweetened beverages partly mediated by obesity status
(adiposity unadjusted) consumption in the USA would result in 26 million excess events of type 2 diabetes over 10 years (population attributable fraction 119 95 confidence interval 74 to 165) and 126 000 excess events in the UK (population attributable fraction 49 30 to 72) Assuming a causal effect of consumption of sugar sweetened beverages independent of obesity status (adiposity adjusted) consumption would result in 18 million excess events in the USA (population attributable fraction 87 39 to 129) and 79 000 excess events in the UK (population attributable frac-tion 36 17 to 56) Younger adults and men would have greater numbers of type 2 diabetes events related to consumption of sugar sweetened beverages than older adults and women respectively (fig 3 and supple-mentary table S7) The greater the uncertainty accounted for the lesser the precision was computed (see supplementary figure S5) For example if I2=50 the population attributable fraction of 119 in the USA would have a 95 confidence interval of 52 to 183 but remained significant from 0 for the relative risks we estimated
discussionIn this systematic review and meta-analysis we have produced summary evidence that habitual consump-tion of sugar sweetened beverages artificially sweet-ened beverages and fruit juice was prospectively associated with incident type 2 diabetes independently of adiposity Sensitivity analyses consistently sup-ported the positive association of sugar sweetened bev-erages with incident type 2 diabetes In contrast the association between artificially sweetened beverages or fruit juice and incident type 2 diabetes was less evident For artificially sweetened beverages potential publica-tion bias and residual confounding were likely to exist For fruit juice the finding seemed to be unstable and was sensitive to study design Under assumption of cau-sality for the association of consumption of sugar sweetened beverages with incidence of type 2 diabetes we provided efficacy estimates that over 10 years two million type 2 diabetes events in the USA and 80 000 in the UK would be related to consumption of sugar sweet-ened beverages
strengths and limitations of this reviewThis study has limitations typical of observational stud-ies and meta-analysis Residual confounding could exist37 Confounding by socioeconomic and dietary factors was not detected to be strong in published stud-ies However measures of these variables were likely to involve errors such that residual confounding persisted in individual studies and our meta-analysis Addition-ally lifestyle factors and adiposity could change over time The time varying characteristics might not be ran-dom and could result in bias in an unknown direction Reverse causality could also exist because of unmea-sured comorbid conditions and health consciousness that might alter consumption of beverages particularly artificially sweetened ones and risk of type 2 diabetes Weakness of meta-analysis includes the exclusion of
Precision (1standard error)
Rela
tive
risk
Sugar sweetened beverages
0 4 8 12 1601
05
025
1
2
4
10
Precision (1standard error)
Rela
tive
risk
Fruit juice
0 10 20 30025
05
1
2
4
Precision (1standard error)
Rela
tive
risk
Articially sweetened beverages
0 2 4 6 8 1001
05
025
1
2
4
10
Eggerrsquos test P=040
Eggerrsquos test P=003
Eggerrsquos test P=069
Fig 2 | Funnel plot for associations of sugar sweetened beverages artificially sweetened beverages and fruit juice with incident type 2 diabetes Dots represent point estimates plotted over precision measures (1standard error) estimates outside each panel are not presented horizontal lines represent summary estimates and 95 confidence intervals across precision shaded areas represent any of a single estimate that if included would make the summary estimate insignificant (Pgt005) P values by eggerrsquos test are presented for fruit juice estimates with greater precision indicated stronger positive association
thethinspbmj | BMJ 2015101h1576 | doi1 020076bmjh1576
RESEARCH
9
eligible cohorts for lack of information Our meta- analysis included statistical approximation that might involve errors For example we derived dose-response esti-mates partly from categorical estimates and odds ratios Without such approximations analysis standardised across different cohorts is of future interest to character-ise associations between various beverages and risks of type 2 diabetes Finally assessments of bias and quality of evidence involved subjectivity although we objec-tively examined the influence of potential bias in tests for heterogeneity and sensitivity analyses
One strength of this study was in estimating popula-tion attributable fraction for risks of type 2 diabetes related to consumption of sugar sweetened beverages in the USA and UK using data on beverage consumption for each individual While a few studies estimated how much taxation on sugar sweetened beverages influ-enced risk of obesity and type 2 diabetes12-14 no study examined the population impact by combining esti-mates for consumption of sugar sweetened beverages in multiple populations predicted the risk of type 2 diabe-tes by using a validated algorithm or provided quanti-tative evidence on the association of consumption of sugar sweetened beverages with incidence of type 2 diabetes However the population attributable fraction was limited in precision owing to underlying relative risks and uncertainty in generalisability The other lim-itations are that we estimated the population attribut-able fraction under the assumption of causality although it has not been established and the assump-tion that there would be no change over time in lifestyle associated with consumption of sugar sweetened bever-ages Future work should seek to improve precision of evidence and to characterise efficacy and effectiveness of policy interventions for different populations Gener-alisability should be exploredmdashfor example for popu-lations in Central and South America with the highest recorded per capita sales of sugar sweetened beverages in the world and China and India where the highest
prevalence of type 2 diabetes is expected1 67 To mini-mise limitations typical of observational research and understand effectiveness of a policy intervention in dif-ferent populations future research should also include randomised trials examining peoplersquos health and behaviours and informing effectiveness
interpretation in relation to other studiesOther quantitative reviews have been published recently4 5 9 None of them quantified the population attributable fraction One meta-analysis evaluated the influence of adiposity on the association of sugar sweet-ened beverages and type 2 diabetes based on three stud-ies but not artificially sweetened beverages or fruit juice5 For sugar sweetened beverages we evaluated a greater number of type 2 diabetes cases (38 285 v 19 054) and studies (17 v 3) including bias assessments and sensitivity analyses For fruit juice and artificially sweetened beverages we evaluated a greater number of studies than previous work (9 v 4 and 12 v 4 respec-tively) and drew conclusions based on assessment of the influences of adiposity and potential bias that were found to be important
The plausibility of our findings deserves discussion Detrimental effects of sugar sweetened beverages inde-pendent of obesity may exist Sugars in sugar sweet-ened beverages acutely increased blood glucose levels and have a high glycaemic index (80 to 110100 of white bread) a risk factor for type 2 diabetes68 69 Fructose in sugar sweetened beverages promotes hepatic lipogene-sis and further insulin resistance2 Effects of caramels for colouring beverages70 caffeine49 71 phosphoric acid72 and other constituents may also exist These non-glycaemic effects may be present in artificially sweetened beverages if such beverages truly increase the risk of type 2 diabetes Artificially sweetened bever-ages might have effects on hormones microbiota and taste preference but evidence for these remains weak6 73 74 Adverse effects of fruit juice would be
United States
Suga
r sw
eete
ned
beve
rage
(gd
ay)
0
200
300
500
400
100
110
189
10 year risk for type 2 diabetes ()
No at risk (millions)
75
98
141
65
111
90
110
45
165
27
United Kingdom
Age (years)
PAF
for t
ype
2 di
abet
es
All0
10
15
25
20
5
20-44 45-64 Men Womenge65
Age (years)
All 20-44 45-64 Men Womenge65
58
45
21
21
80
15
55
21
61
23
107
9
PAF unadjusted for adiposityMean sugar sweetened beverage consumptionPAF adjusted for adiposity
Fig 3 | Consumption of sugar sweetened beverages and population attributable fraction (PaF) for type 2 diabetes in the united states and the united Kingdom Circles represent mean of consumption of sugar sweetened beverages (left axis) and each bar represents PaF () for type 2 diabetes due to consumption of sugar sweetened beverages (right axis) absolute event rates over 10 years were 110 in the usa (209 million events) and 58 in the uK (26 million events) (see supplementary table 7)
doi1 020076bmjh1576 | BMJ 2015101h1576 | thethinspbmj
RESEARCH
10
present because of its moderately high glycaemic index (50-80)68 Healthful constituents may exist but decrease during processing7 75 This explains why our finding was discordant with the inverse association of consum-ing fruits as food with type 2 diabetes76
Our analysis indicated possible publication bias for the associations between artificially sweetened bever-ages and type 2 diabetes The bias toward a false posi-tive finding would be plausible according to existing public interest over the health effects6 77 The finding at least underscores potential low quality of evidence and the need for cautious interpretation Residual confounding in the finding for artificially sweetened beverages is also plausible because adults at high risk of type 2 diabetes preferentially consumed more artifi-cially sweetened beverages5 6 8 10 11 36 Confounding in the opposite direction in the finding for fruit juice is also plausible because leaner adults at lower risk of type 2 diabetes consumed more fruit juice10 11 These observations provide research and clinical implications for better understanding of health seeking behaviours related to beverage consumption6 78
Clinical and public health implicationsAlthough causality has not been established our find-ings and available evidence indicate a benefit of reduc-ing the consumption of sugar sweetened beverages for the primary prevention of type 2 diabetes In the same context our findings also imply that consumption of artificially sweetened beverages or fruit juice is not likely to reduce the risk of type 2 diabetes and thus not suitable as a healthy option None the less the lower caloric intake of artificially sweetened beverages may be of clinical benefit in obese or overweight adults by helping to reduce body weight6 78 This effect on body weight should be considered separately from our study which could not rule out the effect of body weight on beverage consumption8 Additionally clinical applica-tions of our finding deserve further appraisal about the effects of altering beverage consumption on changes in lifestyle behaviours and on risks of other clinical outcomes3 6 8
Our findings have strong public health implications Despite the limitations of this review the current con-sumption of sugar sweetened beverages was estimated to cause approximately two million excess events of type 2 diabetes in the USA and 80 000 in the UK over 10 years This could cost nearly pound120bn in the USA and pound206m in the UK ($9800 in the USA and $3994 in the UK per patient67 $1 (pound065 euro091 as of 7 July 2015) In future our work on efficacy should be extended to that on effectiveness to identify needs for interventions In addition to observational evidence trial evidence should be available accounting for the effects on car-diometabolic health and lifestyle change associated with a possible intervention8 78 Despite a population attributable fraction of no more than 20 effectiveness should be evaluated for different populations as an estimated 592 million adults globally will have type 2 diabetes in 20351 67 Additionally the average popula-tion attributable fraction of no more than 20 confirms
the importance of modifying multiple lifestyle risk fac-tors rather than a single dietary component for the pri-mary prevention of type 2 diabetes For artificially sweetened beverages and fruit juice our findings inform little benefit of using them as an alternative to sugar sweetened beverages In addition fruit juice con-sumption should not be a part of dietary recommenda-tions for greater consumption of fruits and vegetables as suggested to limit fruit juice consumption among children7 79
ConclusionsObservational cohort studies support that consumption of sugar sweetened beverages is associated with inci-dent type 2 diabetes and independently of adiposity This finding was stable in sensitivity analyses assessing influence of population characteristics potential resid-ual confounding and publication bias By contrast although artificially sweetened beverages and fruit juice showed a positive association with incident type 2 diabetes the quality of evidence is limited by potential bias and heterogeneity by study design Although cau-sality has not been established and precision needs to be improved this study informs the potential efficacy of reducing the consumption of sugar sweetened bever-ages in a contemporary population Moreover findings support that neither artificially sweetened beverages nor fruit juice are suitable alternatives to sugar sweet-ened beverages for the prevention of type 2 diabetes The following contributors provided additional information Emilie Rossignol Guy Fagherazzi Franccediloise Clavel-Chapelon and Beverley Balkau Center for Research in Epidemiology and Population Health Villejuif Cedex France Tomonori Okamura Department of Preventive Medicine and Public Health Keio University School of Medicine Tokyo Japan and Hirotsugu Ueshima Department of Health Science and Center for Epidemiologic Research in Asia Sari Voutilainen Institute of Public Health and Clinical Nutrition Kuopio Finland Frank B Hu Harvard T H Chan School of Public Health Boston Massachusetts USA Manabu Sakurai Department of Epidemiology and Public Health Kanazawa Medical University Uchinada Ishikawa Japan Paul F Jacques Nicola M McKeown and Ma Jiantao Human Nutrition Research Center on Aging Tufts University Boston Massachusetts USAContributors FI and NGF conceived the study FI LOrsquoC YZ and NGF designed the study FI LOrsquoC and YZ undertook the literature search and extracted data FI JM YH and SNB did data analysis FI LOrsquoC YZ and NGF interpreted data FI developed the first draft FI as guarantor accepts full responsibility for the work and the conduct of the study had access to the data and controlled the decision to publish All authors provided critical comments and approved the final version The sponsor of the study had no role in design and conduct of the study collection management analysis and interpretation of the data preparation review or approval of the manuscript and decision to submit the manuscript for publication The corresponding author had full access to all the data in the study and had final responsibility for the decision to submit for publication Funding This study was funded by the Medical Research Council Epidemiology Unit Core Support (MC_UU_120155) SNB was supported by an American Heart Association postdoctoral fellowship grant (13POST14370012) Competing interests All authors have completed the ICMJE uniform disclosure form at wwwicmjeorgcoi_disclosurepdf and declare no support from any organisation for the submitted work no financial relationships with any organisations that might have an interest in the submitted work in the previous three years no other relationships or activities that could appear to have influenced the submitted workEthical approval Not requiredData sharing A protocol and data for tables and figures are available on request
thethinspbmj | BMJ 2015101h1576 | doi1 020076bmjh1576
RESEARCH
11
Transparency The guarantor (FI) affirms that the manuscript is an honest accurate and transparent account of the study being reported that no important aspects of the study have been omitted and that any discrepancies from the study as planned have been explained as post hoc analysis Data sharing is available from the corresponding author
This is an Open Access article distributed in accordance with the terms of the Creative Commons Attribution (CC BY 40) license which permits others to distribute remix adapt and build upon this work for commercial use provided the original work is properly cited See httpcreativecommonsorglicensesby40
1 Basu S McKee M Galea G Stuckler D Relationship of soft drink consumption to global overweight obesity and diabetes a cross-national analysis of 75 countries Am J Public Health 20131032071-7
2 Stanhope KL Role of fructose-containing sugars in the epidemics of obesity and metabolic syndrome Annu Rev Med 201263329-43
3 Weed DL Althuis MD Mink PJ Quality of reviews on sugar-sweetened beverages and health outcomes a systematic review Am J Clin Nutr 2011941340-7
4 Malik VS Popkin BM Bray GA et al Sugar-sweetened beverages and risk of metabolic syndrome and type 2 diabetes a meta-analysis Diabetes Care 2010332477-83
5 Greenwood DC Threapleton DE Evans CEL et al Association between sugar-sweetened and artificially sweetened soft drinks and type 2 diabetes systematic review and dose-response meta-analysis of prospective studies Br J Nutr 2014112725-34
6 Gardner C Wylie-Rosett J Gidding SS et al Nonnutritive sweeteners current use and health perspectives a scientific statement from the American Heart Association and the American Diabetes Association Circulation 2012126509-19
7 Slavin JL Lloyd B Health benefits of fruits and vegetables Adv Nutr 20123506-16
8 Malik VS Popkin BM Bray GA Despreacutes J-P Hu FB Sugar-sweetened beverages obesity type 2 diabetes mellitus and cardiovascular disease risk Circulation 20101211356-64
9 Xi B Li S Liu Z et al Intake of fruit juice and incidence of type 2 diabetes a systematic review and meta-analysis PloS One 20149e93471
10 Bleich SN Wolfson JA Vine S Wang YC Diet-beverage consumption and caloric intake among US adults overall and by body weight Am J Public Health 2014104e72-8
11 The InterAct Consortium Consumption of sweet beverages and type 2 diabetes incidence in European adults results from EPIC-InterAct Diabetologia 2013561520-30
12 Basu S Vellakkal S Agrawal S Stuckler D Popkin B Ebrahim S Averting obesity and type 2 diabetes in India through sugar-sweetened beverage taxation an economic-epidemiologic modeling study PLoS Med 201411e1001582
13 Brownell KD Farley T Willett WC et al The public health and economic benefits of taxing sugar-sweetened beverages N Engl J Med 20093611599-605
14 Briggs ADM Mytton OT Kehlbacher A Tiffin R Rayner M Scarborough P Overall and income specific effect on prevalence of overweight and obesity of 20 sugar sweetened drink tax in UK econometric and comparative risk assessment modelling study BMJ 2013347f6189
15 Liberati A Altman DG Tetzlaff J et al The PRISMA statement for reporting systematic reviews and meta-analyses of studies that evaluate healthcare interventions explanation and elaboration BMJ 2009339b2700
16 The Diabetes Prevention Program Research Group Diabetes Prevention Program Research Group Knowler WC et al Reduction in the incidence of type 2 diabetes with lifestyle intervention or metformin N Engl J Med 2002346393-403
17 Franco M Bilal U Orduntildeez P et al Population-wide weight loss and regain in relation to diabetes burden and cardiovascular mortality in Cuba 1980-2010 repeated cross sectional surveys and ecological comparison of secular trends BMJ 2013346f1515
18 Willett WC Howe GR Kushi LH Adjustment for total energy intake in epidemiologic studies Am J Clin Nutr 1997651220S-8S discussion 1229S-31S
19 Higgins JP Altman DG Gotzsche PC et al The Cochrane Collaborationrsquos tool for assessing risk of bias in randomised trials BMJ 2011343d5928
20 Sterne JA Higgins JP Reeves BC on behalf of the development group for ACROBAT-NRSI A A Cochrane risk of bias assessment tool for non-randomized studies of interventions version 100 September 2014 2014 wwwriskofbiasinfo
21 Higgins J Assessing risk of bias in included studies In Higgins J Green S eds Cochrane handbook for systematic reviews of interventions Cochrane Collaboration 20081-50
22 Schuumlnemann H Brożek J Oxman GGA Handbook for grading the quality of evidence and the strength of recommendations using the GRADE approach 2013 wwwguidelinedevelopmentorghandbook
23 Zhang J Yu KF Whatrsquos the relative risk A method of correcting the odds ratio in cohort studies of common outcomes JAMA 19982801690
24 Greenland S Longnecker MP Methods for trend estimation from summarized dose-response data with applications to meta-analysis Am J Epidemiol 19921351301-9
25 Higgins JP Thompson SG Quantifying heterogeneity in a meta-analysis Stat Med 2002211539-58
26 Walter WC Correction for the effects of measurement error In Willett WC ed Nutritional epidemiology 3rd ed Oxford University Press 2012
27 MacMahon S Peto R Cutler J et al Blood pressure stroke and coronary heart disease Part 1 prolonged differences in blood pressure prospective observational studies corrected for the regression dilution bias Lancet 1990335765-74
28 Carroll RJ Stefanski LA Measurement error instrumental variables and corrections for attenuation with applications to meta-analyses Stat Med 1994131265-82
29 Prospective Studies Collaboration Blood cholesterol and vascular mortality by age sex and blood pressure a meta-analysis of individual data from 61 prospective studies with 55 000 vascular deaths Lancet 20073701829-39
30 Di Angelantonio E Sarwar N Perry P et al Major lipids apolipoproteins and risk of vascular disease JAMA 20093021993-2000
31 Hunter DJ Spiegelman D Adami HO et al Cohort studies of fat intake and the risk of breast cancer--a pooled analysis N Engl J Med 1996334356-61
32 Greenland S Quantitative methods in the review of epidemiologic literature Epidemiol Rev 198791-30
33 Brenner H Gefeller O Use of the positive predictive value to correct for disease misclassification in epidemiologic studies Am J Epidemiol 19931381007-15
34 Jonathan E Sterne AC Egger M Moher D Bias C Addressing reporting biases In Higgins J Green S eds Cochrane handbook for systematic reviews of interventions Cochrane Collaboration 20081-33
35 Lash TL Fink AK Semi-automated sensitivity analysis to assess systematic errors in observational data Epidemiology 200314 451-8
36 Sun Q van Dam RM Spiegelman D Heymsfield SB Willett WC Hu FB Comparison of dual-energy x-ray absorptiometric and anthropometric measures of adiposity in relation to adiposity-related biologic factors Am J Epidemiol 20101721442-54
37 Smith GD Phillips AN Inflation in epidemiology ldquothe proof and measurement of association between two thingsrdquo revisited BMJ 19963121659-61
38 Bray GA Energy and fructose from beverages sweetened with sugar or high-fructose corn syrup pose a health risk for some people Adv Nutr 20134220-5
39 Nettleton JA Lutsey PL Wang Y et al Diet soda intake and risk of incident metabolic syndrome and type 2 diabetes in the Multi-Ethnic Study of Atherosclerosis (MESA) Diabetes Care 200932688-9440
40 Fagherazzi G Vilier A Saes Sartorelli D Lajous M Balkau B Clavel-Chapelon F Consumption of artificially and sugar-sweetened beverages and incident type 2 diabetes in the Etude Epidemiologique aupres des femmes de la Mutuelle Generale de lrsquoEducation Nationale-European Prospective Investigation into Cancer and Nutrition cohort Am J Clin Nutr 201397517-23
41 Muraki I Imamura F Manson JE et al Fruit consumption and risk of type 2 diabetes results from three prospective longitudinal cohort studies BMJ 2013347f5001
42 Cook JR Stefanski LA Simulation-extrapolation estimation in parametric measurement error models J Am Stat Assoc 1994891314-28
43 Greenland S Estimation of population attributable fractions from fitted incidence ratios and exposure survey data with an application to electromagnetic fields and childhood leukemia Biometrics 200157182-8
44 Schuumlnemann AHJ Oxman AD Vist GE Higgins JPT Jonathan J Interpreting results and drawing conclusions In Higgins J Green S eds Cochrane Handbook for Systematic Reviews of Interventions Cochrane Collaboration 20081-24
45 National Center for Health Statistics National Health and Nutrition Examination Survey NHANES (2009-2010) 2005 wwwcdcgovnchsnhaneshtm
46 Public Health England and Food Standards Agency National Diet and Nutrition Survey results from years 1 to 4 (combined) of the rolling programme for 2008 and 2009 to 2011 and 2012 2014 wwwgovukgovernmentpublicationsnational-diet-and-nutrition-survey- results-from-years-1-to-4-combined-of-the-rolling-programme-for-2008-and-2009-to-2011-and-2012
47 Hippisley-Cox J Coupland C Robson J Sheikh A Brindle P Predicting risk of type 2 diabetes in England and Wales prospective derivation and validation of QDScore BMJ 2009338b880
48 Schmidt MI Duncan BB Bang H et al Identifying individuals at high risk for diabetes the Atherosclerosis Risk in Communities study Diabetes Care 2005282013-8
RESEARCH
No commercial reuse See rights and reprints httpwwwbmjcompermissions Subscribe httpwwwbmjcomsubscribe
49 Bhupathiraju SN Pan A Malik VS et al Caffeinated and caffeine- free beverages and risk of type 2 diabetes Am J Clin Nutr 2013 97155-66
50 De Koning L Malik VS Rimm EB Willett WC Hu FB Sugar-sweetened and artificially sweetened beverage consumption and risk of type 2 diabetes in men Am J Clin Nutr 2011931321-7
51 Bazzano LA Li TY Joshipura KJ Hu FB Intake of fruit vegetables and fruit juices and risk of diabetes in women Diabetes Care 2008311311-7
52 Eshak ES Iso H Mizoue T Inoue M Noda M Tsugane S Soft drink 100 fruit juice and vegetable juice intakes and risk of diabetes mellitus Clin Nutr 201332300-8
53 Montonen J Jarvinen R Knekt P Heliovaara M Reunanen A Consumption of sweetened beverages and intakes of fructose and glucose predict type 2 diabetes occurrence J Nutr 20071371447-54
54 Mursu J Virtanen JK Tuomainen T-P Nurmi T Voutilainen S Intake of fruit berries and vegetables and risk of type 2 diabetes in Finnish men the Kuopio Ischaemic Heart Disease Risk Factor Study Am J Clin Nutr 201499328-33
55 Duffey KJ Gordon-Larsen P Steffen LM et al Drinking caloric beverages increases the risk of adverse cardiometabolic outcomes in the Coronary Artery Risk Development in Young Adults (CARDIA) Study Am J Clin Nutr 201092954-9
56 Duffey KJ Steffen LM Van Horn L Jacobs DR Popkin BM Dietary patterns matter diet beverages and cardiometabolic risks in the longitudinal Coronary Artery Risk Development in Young Adults (CARDIA) Study Am J Clin Nutr 201295909-15
57 Odegaard AO Koh W-PP Arakawa K Yu MC Pereira MA Soft drink and juice consumption and risk of physician-diagnosed incident type 2 diabetes the Singapore Chinese Health Study Am J Epidemiol 2010171701-8
58 Palmer JR Boggs DA Krishnan S Hu FB Singer M Rosenberg L Sugar-sweetened beverages and incidence of type 2 diabetes mellitus in African American women Arch Intern Med 2008168 1487-92
59 Sakurai M Nakamura K Miura K et al Sugar-sweetened beverage and diet soda consumption and the 7-year risk for type 2 diabetes mellitus in middle-aged Japanese men Eur J Nutr 201453251-8
60 Schulze MB Manson JE Ludwig DS et al Sugar-sweetened beverages weight gain and incidence of type 2 diabetes in young and middle-aged women JAMA 2004292927-34
61 Pan A Malik VS Schulze MB Manson JE Willett WC Hu FB Plain-water intake and risk of type 2 diabetes in young and middle-aged women Am J Clin Nutr 2012951454-60
62 Pereira MA Parker ED Folsom AR Intake of sugar sweetened beverages fruit juice and incidence of type 2 diabetes A prospective study of postmenopausal women Diabetes 200554A258
63 Hayashino Y Fukuhara S Okamura T et al A prospective study of passive smoking and risk of diabetes in a cohort of workers the High-Risk and Population Strategy for Occupational Health Promotion (HIPOP-OHP) study Diabetes Care 200831732-4
64 Paynter NP Yeh H-CC Voutilainen S et al Coffee and sweetened beverage consumption and the risk of type 2 diabetes mellitus the atherosclerosis risk in communities study Am J Epidemiol 20061641075-84
65 Dhingra R Sullivan L Jacques PF et al Soft drink consumption and risk of developing cardiometabolic risk factors and the metabolic syndrome in middle-aged adults in the community Circulation 2007116480-8
66 Duffey KJ Steffen LM Van Horn L Jacobs DR Jr Popkin BM Dietary patterns matter diet beverages and cardiometabolic risks in the longitudinal Coronary Artery Risk Development in Young Adults (CARDIA) Study Am J Clin Nutr 201295909-15
67 International Diabetes Federatoin The Global Burden In IDF diabetes atlas 6th ed IDF 201329-49
68 Atkinson FS Foster-Powell K Brand-Miller JC International tables of glycemic index and glycemic load values 2008 Diabetes Care 2008312281-3
69 Livesey G Taylor R Livesey H Liu S Is there a dose-response relation of dietary glycemic load to risk of type 2 diabetes Meta-analysis of prospective cohort studies Am J Clin Nutr 201397584-96
70 Kellow NJ Savige GS Dietary advanced glycation end-product restriction for the attenuation of insulin resistance oxidative stress and endothelial dysfunction a systematic review Eur J Clin Nutr 201367239-48
71 Jiang X Zhang D Jiang W Coffee and caffeine intake and incidence of type 2 diabetes mellitus a meta-analysis of prospective studies Eur J Nutr 20145325-38
72 Fitzpatrick L Heaney RP Got soda J Bone Miner Metab 2003181570-2
73 Pepino MY Bourne C Non-nutritive sweeteners energy balance and glucose homeostasis Curr Opin Clin Nutr Metab Care 201114 391-5
74 Suez J Korem T Zeevi D et al Artificial sweeteners induce glucose intolerance by altering the gut microbiota Nature 2014514181-6
75 Crowe KM Murray E Deconstructing a fruit serving comparing the antioxidant density of select whole fruit and 100 fruit juices J Acad Nutr Diet 20131131354-8
76 Cooper AJ Forouhi NG Ye Z et al Fruit and vegetable intake and type 2 diabetes EPIC-InterAct prospective study and meta-analysis Eur J Clin Nutr 2012661082-92
77 De la Pentildea C Artificial sweetener as a historical window to culturally situated health Ann N Y Acad Sci 20101190159-65
78 Piernas C Tate DF Wang X Popkin BM Does diet-beverage intake affect dietary consumption patterns Results from the Choose Healthy Options Consciously Everyday (CHOICE) randomized clinical trial Am J Clin Nutr 201397604-11
79 Wojcicki JM Heyman MB Reducing childhood obesity by eliminating 100 fruit juice Am J Public Health 20121021630-3
copy BMJ Publishing Group Ltd 2015
Appendix supplementary material
doi1 020076bmjh1576 | BMJ 2015101h1576 | thethinspbmj
RESEARCH
2
not yet been well established because only a few studies have examined the associations of which potential bias has been debated5-9
Each of these beverage types has been investigated and reviewed for prospective associations with inci-dent type 2 diabetes4-9 A few quantitative reviews were available but one aggregated studies that did and did not adjust for obesity status4 9 and the other separated such studies ad hoc only for those of sugar sweetened beverages and not for those of artificially sweetened beveraor fruit juice5 It is crucial to better characterise the influence of adiposity because obesity can directly cause type 2 diabetes and thus mediate an association between consumption of sugar sweetened beverages and type 2 diabetes4 5 and because obesity can be a confounder by altering dietary habits and confounding an association between beverage consumption and incident type 2 diabetes8 10 Previous studies indeed reported that obese individuals tend to consume more sugar sweetened and artificially sweetened beverages and less fruit juice than leaner individuals6 10 11 More-over despite the growing interest in a policy interven-tion to reduce the consumption of sugar sweetened beverages at a population level12 13 14 no study has translated a prospective association between con-sumption of sugar sweetened beverages and type 2 dia-betes into a measure of its population level impact including population attributable fraction in a con-temporary population
We therefore conducted a systematic review and meta-analysis of prospective studies to test whether or not habitual consumption of sugar sweetened bever-ages artificially sweetened beverages or fruit juice would be associated with the incidence of type 2 diabe-tes We specifically aimed to meta-analyse the associa-tions with and without adjustment for adiposity because the association may be both mediated and con-founded by this factor To provide policy relevant mea-sures we then used the result of the meta-analysis for sugar sweetened beverages to estimate the population attributable fraction for the 10 year risk of developing type 2 diabetes due to consumption of sugar sweetened beverages in contemporary populations of the United States and United Kingdom where approximately half of each population in recent years consumed sugar sweetened beverages1 10
MethodsPatient involvementThere was no patient involvement in this study
study searches and selectionFollowing the PRISMA guidelines15 and the protocol (not registered available on request) we identified relevant studies through hand searches and system-atic searches of four databases on 31 May 2013 (updated on 10 February 2014) PubMed Embase Ovid and Web of Knowledge Search terms included those related to types of beverages diabetes and pro-spective study design (see supplementary information for details) Time and language of publications were
not restricted After the removal of duplicates one author (FI) screened the articles on the basis of the titles and abstracts and three authors (FI LOrsquoC and ZY) independently reviewed them in duplicate We considered studies to be eligible for inclusion if they were of a prospective design assessed the consump-tion of beverages and incident type 2 diabetes and recruited adults free of diabetes and aged 18 years or older We also considered a follow-up of at least two years on average because incidence of diabetes could alter approximately two years after modification of lifestyle16 17
Data extraction and quality assessmentWe extracted information in a standardised manner in duplicate including baseline personal information such as body mass index and duration of follow-up exclusion criteria sample size loss to follow-up assessments of beverage consumption and incident type 2 diabetes types of beverage consumed measures of prospective associations with 95 confidence inter-vals covariates evaluated and sources of funding We extracted measures of associations that were the most adjusted for sociodemographic and lifestyle factors with and without further adjustment for adiposity mea-sures Although adjustment for total energy intake is important to assess4 6 in this meta-analysis we used estimates adjusted for total energy whenever possible for parsimony and potentials for energy adjustment to reduce confounding and measurement errors18 We extracted estimates stratified by age sex and adiposity measures if reported to use in meta-regression to assess heterogeneity Additional information on study design and quality was also obtained from identified articles as well as from relevant articles of identified cohorts
We contacted authors of identified articles to request additional information if the article did not report two types of estimates before and after adjustment for adi-posity based on either categorical or continuous analy-sis for sugar sweetened beverages artificially sweetened beverages and fruit juice separately When we con-tacted authors we requested estimates before and after adjustment for adiposity based on both continuous and categorical variables of each beverage consumed and we requested estimates based on longer follow-up if available In addition we contacted authors of cohorts that did not meet eligibility criteria but could be eligible on the provision of additional information (see supple-mentary table S1)
We examined risks of bias in concordance with the Cochrane tools including a Cochrane risk of bias assessment tool for non-randomised studies of inter-ventions19-21 Seven domains were assessed con-founding selection exposure measurement misclassification over time missing data outcome measurement and selective reporting Bias specific to this meta-analysis included the likelihood of misclas-sifying sugar sweetened fruit drink as fruit juice (for example fruit punch) Sources of bias were evaluated by using meta-regression for each as a potential
thethinspbmj | BMJ 2015101h1576 | doi1 020076bmjh1576
RESEARCH
3
source of heterogeneity meta-analysis excluding studies with a certain type of bias or meta-analysis incorporating quantitative measures of bias (see sup-plementary information) Overall quality of evidence was assessed based on study quality results from sen-sitivity analysis and principles of the grades of rec-ommendation assessment development and evaluation (GRADE)22 One author (FI) first sum-marised the results of bias assessment and quality of overall evidence and these results were discussed among the other authors (FI LOC YZ and NGF) for consensus
meta-analysisWe used Stata 131 for analyses (α two sided P=005 unless indicated) Statistical details are described in the supplementary information Each of sugar sweetened beverages artificially sweetened beverages and fruit juice was considered as the main exposure We defined sugar sweetened beverages as any sweetened bever-ages including sugar sweetened fruit juice not pre-sented as diet or non-caloric beverages Artificially sweetened beverages included low caloric soft drinks as reported in each study Fruit juice was defined as 100 fruit juice or fruit juice assessed separately from fruit drinks We standardised measures of associations to relative risk per one servingday of beverage consump-tion after we confirmed that this unit was the most fre-quently used in studies Because volume per serving was specific to a population ranging from 237 mL (one cup) to 355 mL (12 oz) (median across publications=250 mLday) we repeated meta-analysis to estimate the rel-ative risk for each 250 mLday We converted odds ratios if reported to relative risks23 If a study reported categorical estimates only they were combined to obtain a single dose-response estimate24 If only strati-fied estimates were reported we merged them by fixed effects meta-analysis to derive a cohort specific esti-mate assuming consistency of associations within a cohort
We performed random effects meta-analysis as pre-specified assuming that biological effects of bever-ages in different populations would vary randomly at least by processing and composition of beverages The heterogeneity of associations was expressed by I225 For each of the beverages of interest we esti-mated relative risks before and after adjustment for adiposity measures To assess a magnitude of overall confounding we additionally estimated crude rela-tive risks without any adjustment Non-linear associ-ations were additionally evaluated by cubic spline meta-analysis for which we used available categorical estimates24
In observational studies within person variability of exposure can cause bias26-30 As performed previ-ously26-32 we compiled within person variation of bev-erage consumption in each study and adjusted for them to estimates of each study Uncertainty in self reported diagnosis of type 2 diabetes was also cali-brated for estimates from studies without objective information on incidence of type 2 diabetes33 To compute
relative risks adjusted for within person dietary vari-ation and uncertainty of type 2 diabetes ascertain-ment we pooled the estimates after study specific calibration
Meta-regression was used to assess if heterogeneity of associations across studies depended on population demographics study characteristics and indicators of errors or bias Publication status (peer reviewed or not) selective reporting (yes or no) and mutual adjustment for three beverage types were evaluated after we identi-fied studies with those characteristics Stratified meta-analysis was performed by each variable that pre-dicted heterogeneity (Plt001) and by prespecified vari-ables age sex body mass index and study location In exploratory analysis using multiple variables of study specific factors we reassessed I2 as a magnitude of unexplained heterogeneity
Publication bias was assessed by Eggerrsquos test with a contour enhanced funnel plot and lsquotrim and fillrsquo analy-sis34 If publication bias was indicated we adjusted summary estimates for the bias34 Robustness of sum-mary findings was examined by sensitivity analyses influence analysis32 fixed effects meta-analysis analy-sis using millilitres per day as a unit analysis without studies with a high overall risk of bias and analysis incorporating measures of uncertainty in adjustment for within person dietary variations and diagnosis of type 2 diabetes35
Adiposity is likely to confound an association of beverage consumption with type 2 diabetes particu-larly in research on artificially sweetened bever-ages6 8 10 11 Because of imperfect measurement of adiposity in an epidemiological study36 adjustment for adiposity was likely to be insufficient as discussed previously3 6 32 37-41 Thus to assess if such residual con-founding would be substantial we performed simula-tion analysis to examine the influence of the bias42
type 2 diabetes risk attributable to sugar sweetened beverages in usa and uKWe estimated the risks of type 2 diabetes attributable to consumption of sugar sweetened beverages over 10 years in the USA and UK43 44 These countries contrib-uted to the meta-analysis to the largest extent and pro-vided publically available data on diets and risk factors for type 2 diabetes the US national health and nutri-tion examination survey 2009-1045 and the UK national diet and nutrition survey 2008-1246 The recent cycle was selected for greater generalisability to recent pop-ulations Selecting adults aged 20 years or more and without prevalent diabetes we analysed 4729 US adults and 1932 UK adults Accounting for sampling weight 1891 million US adults and 447 million UK adults were represented
We estimated the population attributable fraction by applying a Cochrane Collaboration algorithm to survey data43 44 We first estimated habitual consumption of sugar sweetened beverages based on 24 hour recalls in the USA and four day food records in the UK Then we estimated the 10 year risk of type 2 diabetes based on a risk prediction algorithm developed and validated in
doi1 020076bmjh1576 | BMJ 2015101h1576 | thethinspbmj
RESEARCH
4
each country47 48 The predicted risk for each individ-ual was considered as an ldquoassumed control riskrdquo44 if the current consumption of sugar sweetened bever-ages would remain constant Then we calculated an alternative risk if the consumption of sugar sweetened beverages would become zero calculating assumed control risktimes(1relative risk per servingday)timesobserved sugar sweetened beverages servingsday The differ-ence between the two risk estimates represented a risk attributable to consumption of sugar sweetened bever-ages Using the risk estimates sampling weights and a population size we estimated the absolute numbers of events over 10 years events attributable to con-sumption of sugar sweetened beverages (absolute risk reduction44) and population attributable fraction (the proportion of events attributable to consumption of sugar sweetened beverages) The estimation assumed causality and no change in individualsrsquo characteris-tics over time Validation of 10 year risk prediction was performed in the US survey in which we pre-dicted diabetes prevalence in 2009-10 by using data collected in 1999-2000 Sensitivity analysis was per-formed to estimate the population attributable frac-tion by varying relative risks and accounting for uncertainty Further details are presented in the sup-plementary information
ResultsAfter the removal of duplicates we identified 1937 arti-cles reviewed 33 in full text and identified 21 articles of 16 cohorts as being eligible for this meta-analysis (see supplementary figure S1) We obtained unpublished information on one cohort from a publication that did not meet eligibility criteria (see supplementary table S1)22 Finally we evaluated data from 17 cohorts (table 1 )11 39-41 49-65 comprising 38 253 cases of type 2 dia-betes over 10 126 756 person years in total No study or publication was funded by industry
The quality of the studies has been examined (see supplementary table S2) Methods of assessing diets and ascertaining type 2 diabetes and validity of these measurements varied across studies (table 1 and sup-plementary table S3) We identified potential bias in the quantitative results for six cohorts based on at least one of the following publication of a conference abstract only62 exclusion of participants lost during follow-up57 63 likelihood of substantial residual con-founding40 and no separation between fruit juice and sugar sweetened beverages (fruit drinks) or between sugar sweetened beverages and artificially sweetened beverages57 64 Selective reporting might exist in some studies39 52 55 58 62 64 but it was unlikely to cause biasmdashfor example reporting only non-quan-titative results for sugar sweetened beverages in a study mainly on artificially sweetened beverages39 Other potential sources of bias were detected but we did not consider them to be substantially influential on overall bias in each study partly based on results of sensitivity analyses No study assessed subtypes of sugar sweetened beverages artificially sweetened
beverages or fruit juice except one that separated beverages by caffeine content49
Confounding was likely to exist in all of the studies As would be expected consumers of artificially sweet-ened beverages tended to be overweight or obese or hypertensive11 39 50 59 66 In longitudinal analysis all studies statistically adjusted for potential confounders such as sociodemographic variables clinical factors (family history of diabetes or prevalent diseases) and lifestyle factors including diet (see supplementary table S4) None of these factors was identified as a single cause of confounding according to studies assessing influence of potential confounding in differ-ent regression models11 41 49-51 54 59 61 63-65 However a com-bination of multiple factors was likely to cause confounding (table 2 and supplementary table S4) After adjustment for multiple potential confounders the relative risk for sugar sweetened beverages was attenuated from 125 to 118 (32 change) and for artifi-cially sweetened beverages from 148 to 125 (43) By contrast the point estimate for fruit juice was shifted upwards from 097 to 105
beverage consumption and type 2 diabetesTable 2 summarises the findings from meta-analysis Higher consumption of sugar sweetened beverages by one serving per day was associated with an 18 greater incidence of type 2 diabetes (95 confidence interval 88 to 28 I2=89) before adjustment for adiposity (fig 1 and table 2) When adjusted for potential media-tion and confounding by adiposity the association was attenuated with the incidence increased by 13 per servingday (58 to 21 I2=79) In the analysis of artificially sweetened beverages in which adiposity was unlikely to be a mediator higher consumption of artificially sweetened beverages by one serving per day was associated with a 25 greater incidence of type 2 diabetes (95 confidence interval 18 to 33 I2=70) before adjustment for adiposity After adjustment the estimate of 25 greater incidence was attenuated to 8 (21 to 15)
In the analysis of fruit juice the influence of adjust-ment for adiposity was in the direction opposite to that of the analysis for sugar sweetened beverages and arti-ficially sweetened beverages The association of fruit juice consumption with incident type 2 diabetes was strengthened after adjustment for adiposity measures Higher consumption of fruit juice by one servingday was associated with a 7 greater incidence of type 2 diabetes (95 confidence interval 08 to 14)
Each of the beverages showed significant non-linear associations (Pgt005) (supplementary figure S2) Cali-bration for within person variation strengthened the association between each type of beverage and incident type 2 diabetes (fig 1 and table 2) For example the rela-tive risk per one servingday of sugar sweetened bever-ages was strengthened from 113 (95 confidence interval 106 to 121) to 128 (112 to 146) Estimates for artificially sweetened beverages were strengthened similarly The influence was small for fruit juice where
thethinspbmj | BMJ 2015101h1576 | doi1 020076bmjh1576
RESEARCH
5
tabl
e 1 |
Cha
ract
eris
tics o
f pro
spec
tive
coho
rt st
udie
s inc
lude
d in
met
a-an
alys
is o
n as
soci
atio
ns b
etw
een
cons
umpt
ion
of su
gar s
wee
tene
d be
vera
ges
art
ifici
ally
swee
tene
d be
vera
ges
and
frui
t ju
ice
and
inci
denc
e of
type
2 d
iabe
tes
Coho
rt c
ount
ry
base
line
year
s
med
ian
follo
w-u
p (y
ears
)no
age
rang
e or
mea
n ag
e (y
ears
)m
en
()
mea
n bm
i
beve
rage
con
sum
ptio
ndaggerin
cide
nt ty
pe 2
dia
bete
sDaggerm
etho
d of
as
sess
men
tty
pes
met
hod
of a
scer
tain
men
tno
of c
ases
(r
ate
1000
)DaggerFM
CHES
Fin
land
5319
66-7
213
743
0440
-69
531
265
Diet
his
tory
SSB
Reco
rds
175
(30
)NH
S I
USA41
51
1984
211
74 5
1340
-69
023
6FF
Qdagger
SSB
ASB
FJ
Self
repo
rt73
00 (4
6)Dagger
KIHD
Fin
land
5419
84-8
918
924
8142
-60
100
268
4 da
y die
t rec
ord
SSBsect
Reco
rds
bio
mar
kers
506
(10
8)CA
RDIA
USA
55 5
6 para19
85-8
618
821
6018
-30
465
245
Diet
his
tory
daggerSS
B A
SB F
JSe
lf re
port
rec
ords
bio
mar
kers
174
(43
)DaggerHP
FS U
SA41
49
5019
8619
340
290
40-7
510
025
5FF
Qdagger
SSB
ASB
FJ
Self
repo
rt32
29 (4
2)Dagger
Iow
a W
HS U
SA62
para19
8610
731
489
55-6
90
270
FFQ
SSB
FJ
Self
repo
rt99
9 (3
0)Dagger
ARIC
men
USA
64
1987
-89
7554
1445
-64
100
272
FFQ
SSBDagger
Self
repo
rt b
iom
arke
rs71
8 (1
77)
ARIC
wom
en U
SA64
19
87-8
977
6790
45-6
40
272
FFQ
SSBDagger
Self
repo
rt b
iom
arke
rs71
9 (1
38)
JPHC
men
Jap
an52
para19
909
812
137
40-5
910
023
5FF
Qdagger
SSB
FJ
Self
repo
rt39
7 (3
3)Dagger
JPHC
wom
en J
apan
52para
1990
99
15 4
4840
-59
023
5FF
Qdagger
SSB
FJ
Self
repo
rt27
9 (1
8)Dagger
FOS
USA
6519
9112
127
3654
245
526
7FF
Qdagger
SSB
ASB
FJ
Reco
rds
sel
f rep
ort
biom
arke
rs30
3 (9
1)NH
S II
USA
41 6
0 61
1991
184
90 4
2324
-44
024
4FF
Qdagger
SSB
ASB
FJ
Self
repo
rt51
21 (3
1)Dagger
EPIC
-Inte
rAct
eig
ht E
urop
ean
coun
tries
1119
91-9
811
727
058
524
378
260
FFQ
SSB
ASB
FJ
Reco
rds
bio
mar
kers
Dagger11
684
(29
)E3
N Fr
ance
40para
1993
124
48 9
8552
80
228
Diet
his
tory
SSB
ASB
FJ
Reco
rds
1054
(17
)SC
HS S
inga
pore
57para
1993
-98
57
43 5
8045
-74
429
230
FFQ
SSB
FJ
Self
repo
rt r
ecor
ds b
iom
arke
rs22
50 (9
0)Dagger
Blac
k W
HS U
SA58
1995
7743
960
21-6
90
276
FFQ
SSB
ASB
FJ
Self
repo
rt25
50 (7
5)Dagger
HIPO
P-OH
P Ja
pan63
para19
993
461
2119
-69
789
226
FFQ
SSB
FJ
Self
repo
rt r
ecor
ds b
iom
arke
rs21
2 (1
02)
MES
A U
SA39
2000
-02
58
5011
45-8
447
427
9FF
QSS
B A
SBSe
lf re
port
rec
ords
bio
mar
kers
413
(14
3)Oc
cupa
tiona
l coh
ort
Japa
n5920
035
520
3735
-55
100
233
FFQ
SSB
ASB
FJ
Reco
rds
bio
mar
kers
170
(151
)AS
B=ar
tifici
ally
sw
eete
ned
beve
rage
s A
RIC=
Athe
rosc
lero
sis R
isk
in C
omm
uniti
es S
tudy
CAR
DIA=
Coro
nary
Arte
ry R
isk
Deve
lopm
ent i
n Yo
ung
Adul
ts S
tudy
EPI
C=Eu
rope
an P
rosp
ectiv
e In
vest
igat
ion
into
Can
cer a
nd N
utrit
ion
Stud
y F
FQ=f
ood
frequ
ency
que
stio
nnai
res
FJ=
fruit
juic
e F
MCH
ES=F
inni
sh M
obile
Clin
ic H
ealth
Exa
min
atio
n Su
rvey
FOS
=Fra
min
gham
Offs
prin
g St
udy
HIP
OP-
OHP
=Hig
h-ris
k an
d Po
pula
tion
Stra
tegy
for O
ccup
atio
nal H
ealth
Pro
mot
ion
Stud
y H
PFS=
Heal
th
Prof
essi
onal
Fol
low
-up
Stud
y JP
HC=J
apan
Pub
lic H
ealth
Cen
ter-b
ased
Pro
spec
tive
Stud
y K
IHD=
Kuop
io Is
chae
mic
Hea
rt Di
seas
e Ri
sk Fa
ctor
Stu
dy M
ESA=
Mul
ti-Et
hnic
Stu
dy o
f Ath
eros
cler
osis
NHS
=Nur
sesrsquo
Heal
th S
tudy
SCH
S=Si
ngap
ore
Chin
ese
Heal
th S
tudy
SSB
=sug
ar s
wee
tene
d be
vera
ges
WHS
=Wom
enrsquos
Heal
th S
tudy
O
rder
ed in
yea
rs o
f bas
elin
e as
sess
men
ts N
umbe
rs re
pres
ent c
itatio
ns A
RIC
and
JPHS
repo
rted
resu
lts s
tratifi
ed b
y sex
In
met
a-an
alys
is s
ex s
tratifi
ed e
stim
ates
wer
e ag
greg
ated
in a
dvan
ce
daggerDie
ts w
ere
asse
ssed
repe
ated
ly d
urin
g fo
llow
-up
and
inco
rpor
ated
in lo
ngitu
dina
l ana
lysi
s JP
HC m
easu
red
repe
ated
ly b
ut u
sed
base
line
FFQ
only
DaggerB
iom
arke
rs in
clud
ed a
ny o
f fas
ting
gluc
ose
two
hour
glu
cose
by o
ral g
luco
se to
lera
nce
test
and
gly
cate
d ha
emog
lobi
n R
ecor
ds in
clud
ed m
edic
al re
cord
s or o
ther
reco
rds f
rom
regi
stry
not
incl
udin
g se
lf re
porte
d in
form
atio
n S
tudi
es a
scer
tain
ing
case
s of t
ype
2 di
abet
es b
y sel
f rep
ort i
nvol
ved
unce
rtai
nty i
n as
cert
ainm
ent
and
thus
num
bers
of c
ases
wer
e re
vise
d by
a p
ositi
ve p
redi
ctiv
e va
lue
(pro
port
ion
of v
erifi
ed c
ases
am
ong
self
repo
rted
case
s) (s
ee su
pple
men
tary
info
rmat
ion
and
tabl
e S3
) Th
e EP
IC-In
terA
ct s
tudy
ado
pted
diff
eren
t met
hods
acr
oss p
artic
ipat
ing
coho
rts
in w
hich
no
coho
rt us
ed s
elf r
epor
ted
diag
nosi
s onl
ysectI
n AR
IC a
nd F
OS a
naly
ses
sug
ar s
wee
tene
d an
d ar
tifici
ally
sw
eete
ned
beve
rage
s wer
e co
mbi
ned
In K
IHD
the
artic
le d
escr
ibed
frui
t jui
ces
but
trea
ted
them
as s
ugar
sw
eete
ned
beve
rage
s b
ecau
se m
ore
than
90
of f
ruit
juic
e co
nsum
ed in
Fin
land
in
1980
s and
1990
s was
sw
eete
ned
with
sug
ars (
confi
rmed
by t
he a
utho
rs)
paraCon
side
red
as h
avin
g po
tent
ial b
ias (
see
supp
lem
enta
ry in
form
atio
n an
d ta
ble
S2)
In e
ach
of C
ARDI
A an
d JP
HC d
istin
ct a
naly
tic a
ppro
ache
s wer
e un
dert
aken
in d
iffer
ent p
ublic
atio
ns b
y the
sam
e au
thor
s Io
wa
WHS
repo
rted
resu
lts o
nly i
n a
conf
eren
ce a
bstra
ct E
3N p
rese
nted
pro
spec
tive
asso
ciat
ions
adj
uste
d fo
r cru
de c
ateg
oric
al v
aria
bles
for b
ody m
ass i
ndex
whi
ch c
ould
cau
se s
ubst
antia
l res
idua
l con
foun
ding
SCH
S pr
esen
ted
resu
lts w
ithou
t cla
ssifi
catio
n be
twee
n 10
0 fr
uit j
uice
an
d su
gar s
wee
tene
d fru
it ju
ice
and
had
a lik
elih
ood
of a
ttriti
on b
ias b
y los
s of f
ollo
w-u
p by
dea
ths (
15
) HI
POP-
OHP
lost
31
of p
artic
ipan
ts d
urin
g fo
llow
-up
whi
ch c
ould
cau
se b
ias d
ue to
diff
eren
tial m
iscl
assi
ficat
ion
doi1 020076bmjh1576 | BMJ 2015101h1576 | thethinspbmj
RESEARCH
6
the relative risk was shifted only slightly from 107 (101 to 114) to 110 (101 to 120)
sensitivity analysis and quality of evidenceNone of the study specific factors evaluated could explain heterogeneity of results for sugar sweetened beverages and artificially sweetened beverages (Pgt01) (see supplementary table S5) Exploratory meta- regression produced an I2 of 234 for sugar sweet-ened beverages and of 678 for artificially sweetened beverages adjusted for population demographics (age sex country incidence) body mass index fol-low-up duration and measures of study quality The results for fruit juice varied by study design While studies assessing self reported type 2 diabetes only showed a positive association the significant associa-tion disappeared in studies ascertaining the incidence of type 2 diabetes by medical records or by blood glu-cose or glycated haemoglobin level (relative risk 108 097 to 120 P for heterogeneity=0008) Additionally studies with repeated measures of diets supported a null finding (098 086 to 111 P for heterogene-ity=0068) These factors of study design explained heterogeneity of the association reducing I2 from 29 to 0 Demographic variables and body mass index did not explain heterogeneity (Pgt014 each) whereas sugar sweetened beverages artificially sweetened beverages and fruit juice were not significantly asso-ciated with type 2 diabetes in studies recruiting more men than women or conducted in Asia with a fewer number of studies than in the main analysis (supple-mentary table S5)
Publication bias was not evident by Eggerrsquos test (Pgt005) except for fruit juice (P=003) where esti-mates with the greater precision showed stronger asso-ciations (fig 2) Trim and fill indicated publication bias for both sugar sweetened and artificially sweetened
beverages (table 2) In particular publication bias could influence inference for artificially sweetened beverages With adjustment for adiposity the relative risk per one servingday of artificially sweetened bev-erages was 129 (108 to 154) before calibration for publication bias and 122 (098 to 152) after calibration (table 2)
Contour enhanced funnel plots indicated that the findings for artificially sweetened beverages and fruit juice were not stable (fig 2) For example if a study with a relative risk of 05 contributed to the meta-analysis associations of artificially sweetened beverages and fruit juice with type 2 diabetes incidence would not be significant In influence analysis positive associations persisted for sugar sweetened beverages and artificially sweetened beverages (see supplementary figure S3) whereas a significant result of fruit juice was not seen after excluding any single studies supporting the posi-tive association
The results varied little by methodological assump-tion (see supplementary table S6) using estimates per 250 mLday (median of 17 studies) rather than per servingday excluding studies with a high risk of potential bias or with relatively large within person dietary variability and incorporating uncertainty of within person variability and precision of type 2 diabe-tes diagnosis When we examined the potential influ-ence of residual confounding by measured adiposity bias towards the null appeared substantial for artifi-cially sweetened beverages (see supplementary figure S4) Under a realistic assumption of a correlation of 080 between measured and true adiposity36 the asso-ciation for sugar sweetened beverages was attenuated by 26 (relative risk 120 104 to 138) for artificially sweetened beverages was attenuated by 96 (101 081 to 125) and for fruit juice was strengthened by 19 (112 103 to 122)
table 2 | associations between consumption of sugar sweetened beverages artificially sweetened beverages and fruit juice and incident type 2 diabetes meta-analysis of prospective cohort studies
beverages (no of cohorts) and models of meta-analysis
not adjusted for adipositydagger adjusted for adipositydaggerrelative risk (95 Ci) i2 () relative risk (95 Ci) i2 ()
sugar sweetened beverages (n=17)Meta-analysis crude 125 (114 to 137) 89 mdash mdash +multivariable adjusted 118 (109 to 128) 89 113 (106 to 121) 79 +calibration for information bias 143 (120 to 170) 86 128 (112 to 146) 73 +calibration for publication bias 142 (119 to 169) 85 127 (110 to 146) 73artificially sweetened beverages (n=10)Meta-analysis crude 148 (135 to 162) 85 mdash mdash +multivariable adjusted 125 (118 to 133) 70 108 (102 to 115) 64 +calibration for information bias 213 (157 to 288) 72 129 (108 to 154) 50 +calibration for publication bias 181 (133 to 247) 76 122 (098 to 152) 64Fruit juices (n=13)Meta-analysis crude 097 (090 to 106) 79 mdash +multivariable adjusted 105 (099 to 111) 58 107 (101 to 114) 51 +calibration for information bias 106 (098 to 114) 49 110 (101 to 120) 29 +calibration for publication bias Not detected mdash Not detected mdashNumber of cohorts varied slightly by models (see fig 1) Crude meta-analysis pooled estimates without any adjustment Multivariable adjusted estimates were based on meta-analysis of estimates adjusted for demographic and lifestyle covariates (see supplementary table S4 for details) Calibration for information bias accounted for within person variation for dietary consumption and imprecise ascertainment of self reported diabetes Calibration for publication bias was carried out if indicated in trim and fill analysis daggerRelative risk and 95 confidence intervals per servingday before and after adjustment for adiposity All relative risks were significant (Plt005) except for artificially sweetened beverages after adjustment for publication bias (P=007)
thethinspbmj | BMJ 2015101h1576 | doi1 020076bmjh1576
RESEARCH
7
We rated the quality of evidence for sugar sweetened beverages artificially sweetened beverages and fruit juice The evidence for sugar sweetened beverages was rated as being of moderate quality The main finding rejected the null hypothesis and was likely to have a small degree of heterogeneity unexplained a dose-re-sponse relation and robustness against potential bias
or limitations including publication bias We rated the evidence for artificially sweetened beverages and fruit juice to be of low quality Findings for artificially sweet-ened beverages were likely to have publication bias and residual confounding and for fruit juice the posi-tive association was not stable and varied by study design
Sugar sweetened beverages
EPIC-InterAct11
ARIC64
Black WHS58
NHS II41 60 61
KIHD54
NHS I41 51
CARDIA55 56
HPFS41 49 50
FOS65
Iowa WHS62
MESA39
Occupation cohort Japan59
SCHS57
HIPOP-OHP63
E3N40
JPHC52
FMCHES53
Overall
Arti13cially sweetened beverages
EPIC-InterAct11
NHS II41 60 61
NHS I41 51
MESA39
HPFS41 49 50
Black WHS58
CARDIA55 56
FOS65
Occupation cohort Japan59
E3N40
Overall
Fruit juice
NHS I41 51
EPIC-InterAct11
NHS II41 60 61
HPFS41 49 50
FOS65
Black WHS58
Iowa WHS62
CARDIA55 56
E3N40
SCHS57
HIPOP-OHP63
JPHC52
Occupation cohort Japan59
Overall
05 1 2 4
Cohort Relative risk(95 CI)
121 (112 to 131)
101 (096 to 106)
110 (105 to 116)
117 (111 to 124)
106 (095 to 118)
139 (130 to 148)
Unavailable
131 (120 to 144)
112 (090 to 140)
Unavailable
Unavailable
108 (088 to 133)
222 (164 to 300)
089 (075 to 106)
282 (087 to 917)
125 (099 to 158)
Unavailable
118 (109 to 128)
I2=890
136 (118 to 156)
120 (116 to 125)
124 (119 to 130)
148 (121 to 180)
123 (115 to 132)
105 (086 to 127)
Unavailable
124 (113 to 137)
134 (090 to 199)
117
125 (118 to 133)
I2=703
114 (108 to 121)
102 (095 to 108)
107 (100 to 114)
105 (097 to 114)
081 (066 to 099)
105 (099 to 111)
Unavailable
Unavailable
083 (061 to 115)
172 (109 to 272)
089 (050 to 158)
111 (082 to 151)
056 (021 to 148)
105 (099 to 111)
I2=579
99
105
105
104
91
102
95
60
63
44
73
05
56
1000
104
209
203
67
176
70
146
22
03
1000
183
172
172
153
56
183
26
13
09
29
03
1000
Relative risk(95 CI)
Weight()
05 1 2 4 05 1 2 4
Relative risk(95 CI)dagger
113 (105 to 122)
101 (096 to 106)
106 (097 to 116)
111 (104 to 119)
105 (095 to 117)
123 (114 to 132)
103 (093 to 114)
122 (110 to 135)
112 (090 to 139)
149 (127 to 175)
086 (063 to 118)
107 (087 to 132)
195 (144 to 265)
089 (075 to 106)
270 (082 to 882)
115 (088 to 150)
150
113 (106 to 121)
I2=798
109 (097 to 123)
104 (100 to 109)
104 (099 to 109)
129 (105 to 158)
106 (099 to 114)
Unavailable
094 (076 to 115)
117 (105 to 131)
125 (084 to 187)
672
108 (102 to 115)
I2=636
111 (105 to 118)
104 (096 to 113)
115 (101 to 131)
107 (098 to 116)
084 (069 to 102)
Unavailable
128 (112 to 146)
100 (085 to 118)
090 (065 to 124)
154 (097 to 245)
083 (047 to 147)
109 (079 to 151)
054 (021 to 141)
107 (101 to 114)
I2=508
88
94
83
90
78
88
79
80
47
62
30
49
32
58
03
38
01
1000
121
214
209
63
180
62
130
20
03
1000
187
163
115
160
72
114
91
33
17
12
32
04
1000
Relative risk(95 CI)dagger
Weight()
Relative risk(95 CI)Dagger
124 (109 to 141)
103 (090 to 118)
110 (095 to 126)
125 (107 to 146)
108 (092 to 127)
156 (131 to 185)
107 (083 to 138)
168 (126 to 223)
127 (080 to 202)
238 (146 to 388)
079 (048 to 129)
120 (068 to 213)
516 (237 to 112)
048 (015 to 158)
902
159
19520
128 (112 to 146)
I2=727
116 (094 to 144)
120 (096 to 149)
120 (094 to 153)
148 (106 to 206)
137 (091 to 208)
Unavailable
085 (052 to 139)
200 (114 to 350)
183 (059 to 568)
6850
129 (108 to 154)
I2=501
113 (104 to 122)
108 (094 to 125)
117 (100 to 137)
114 (096 to 136)
082 (066 to 103)
Unavailable
134 (103 to 175)
100 (066 to 152)
079 (038 to 161)
260 (092 to 741)
031
326
lt01
110 (101 to 120)
I2=298
107
106
105
103
102
99
83
77
49
46
46
37
24
11
02
02
01
1000
192
191
179
139
109
89
74
23
04
1000
279
174
164
141
106
78
36
13
06
01
lt01
lt01
1000
Relative risk(95 CI)Dagger
Weight()
11 684
1437
2550
5121
506
7300
174
3229
303
999
413
170
2250
212
1054
676
175
38 253
11 684
5121
7300
413
3229
2550
174
303
170
1054
31 998
7300
11 684
5121
3229
303
2550
999
174
1054
2250
212
676
170
35 722
No ofcases
Fig 1 | Prospective associations of beverage consumption with incident type 2 diabetes random effects meta-analysis unadjusted for adiposity daggeradjusted for adiposity Daggeradjusted for adiposity and within person variation Cohorts were ordered by weights in the most adjusted model estimates with 95 confidence intervals greater than 10 are not presented supplementary table s4 summarises the covariates adjusted for in each study
doi1 020076bmjh1576 | BMJ 2015101h1576 | thethinspbmj
RESEARCH
8
type 2 diabetes risk attributable to sugar sweetened beveragesOverall sugar sweetened beverages were consumed by 544 of people in the USA and 494 in the UK Of a total population the mean consumption of sugar sweetened beverages was 284 (SD 412) gday in the USA and 114 (SD 157) gday in the UK (fig 3 and supplemen-tary table S7) Absolute event rates over 10 years from 2010 were estimated to be 110 in the USA (209 mil-lion events) and 58 in the UK (26 million events) Assuming a causal effect of consumption of sugar sweetened beverages partly mediated by obesity status
(adiposity unadjusted) consumption in the USA would result in 26 million excess events of type 2 diabetes over 10 years (population attributable fraction 119 95 confidence interval 74 to 165) and 126 000 excess events in the UK (population attributable fraction 49 30 to 72) Assuming a causal effect of consumption of sugar sweetened beverages independent of obesity status (adiposity adjusted) consumption would result in 18 million excess events in the USA (population attributable fraction 87 39 to 129) and 79 000 excess events in the UK (population attributable frac-tion 36 17 to 56) Younger adults and men would have greater numbers of type 2 diabetes events related to consumption of sugar sweetened beverages than older adults and women respectively (fig 3 and supple-mentary table S7) The greater the uncertainty accounted for the lesser the precision was computed (see supplementary figure S5) For example if I2=50 the population attributable fraction of 119 in the USA would have a 95 confidence interval of 52 to 183 but remained significant from 0 for the relative risks we estimated
discussionIn this systematic review and meta-analysis we have produced summary evidence that habitual consump-tion of sugar sweetened beverages artificially sweet-ened beverages and fruit juice was prospectively associated with incident type 2 diabetes independently of adiposity Sensitivity analyses consistently sup-ported the positive association of sugar sweetened bev-erages with incident type 2 diabetes In contrast the association between artificially sweetened beverages or fruit juice and incident type 2 diabetes was less evident For artificially sweetened beverages potential publica-tion bias and residual confounding were likely to exist For fruit juice the finding seemed to be unstable and was sensitive to study design Under assumption of cau-sality for the association of consumption of sugar sweetened beverages with incidence of type 2 diabetes we provided efficacy estimates that over 10 years two million type 2 diabetes events in the USA and 80 000 in the UK would be related to consumption of sugar sweet-ened beverages
strengths and limitations of this reviewThis study has limitations typical of observational stud-ies and meta-analysis Residual confounding could exist37 Confounding by socioeconomic and dietary factors was not detected to be strong in published stud-ies However measures of these variables were likely to involve errors such that residual confounding persisted in individual studies and our meta-analysis Addition-ally lifestyle factors and adiposity could change over time The time varying characteristics might not be ran-dom and could result in bias in an unknown direction Reverse causality could also exist because of unmea-sured comorbid conditions and health consciousness that might alter consumption of beverages particularly artificially sweetened ones and risk of type 2 diabetes Weakness of meta-analysis includes the exclusion of
Precision (1standard error)
Rela
tive
risk
Sugar sweetened beverages
0 4 8 12 1601
05
025
1
2
4
10
Precision (1standard error)
Rela
tive
risk
Fruit juice
0 10 20 30025
05
1
2
4
Precision (1standard error)
Rela
tive
risk
Articially sweetened beverages
0 2 4 6 8 1001
05
025
1
2
4
10
Eggerrsquos test P=040
Eggerrsquos test P=003
Eggerrsquos test P=069
Fig 2 | Funnel plot for associations of sugar sweetened beverages artificially sweetened beverages and fruit juice with incident type 2 diabetes Dots represent point estimates plotted over precision measures (1standard error) estimates outside each panel are not presented horizontal lines represent summary estimates and 95 confidence intervals across precision shaded areas represent any of a single estimate that if included would make the summary estimate insignificant (Pgt005) P values by eggerrsquos test are presented for fruit juice estimates with greater precision indicated stronger positive association
thethinspbmj | BMJ 2015101h1576 | doi1 020076bmjh1576
RESEARCH
9
eligible cohorts for lack of information Our meta- analysis included statistical approximation that might involve errors For example we derived dose-response esti-mates partly from categorical estimates and odds ratios Without such approximations analysis standardised across different cohorts is of future interest to character-ise associations between various beverages and risks of type 2 diabetes Finally assessments of bias and quality of evidence involved subjectivity although we objec-tively examined the influence of potential bias in tests for heterogeneity and sensitivity analyses
One strength of this study was in estimating popula-tion attributable fraction for risks of type 2 diabetes related to consumption of sugar sweetened beverages in the USA and UK using data on beverage consumption for each individual While a few studies estimated how much taxation on sugar sweetened beverages influ-enced risk of obesity and type 2 diabetes12-14 no study examined the population impact by combining esti-mates for consumption of sugar sweetened beverages in multiple populations predicted the risk of type 2 diabe-tes by using a validated algorithm or provided quanti-tative evidence on the association of consumption of sugar sweetened beverages with incidence of type 2 diabetes However the population attributable fraction was limited in precision owing to underlying relative risks and uncertainty in generalisability The other lim-itations are that we estimated the population attribut-able fraction under the assumption of causality although it has not been established and the assump-tion that there would be no change over time in lifestyle associated with consumption of sugar sweetened bever-ages Future work should seek to improve precision of evidence and to characterise efficacy and effectiveness of policy interventions for different populations Gener-alisability should be exploredmdashfor example for popu-lations in Central and South America with the highest recorded per capita sales of sugar sweetened beverages in the world and China and India where the highest
prevalence of type 2 diabetes is expected1 67 To mini-mise limitations typical of observational research and understand effectiveness of a policy intervention in dif-ferent populations future research should also include randomised trials examining peoplersquos health and behaviours and informing effectiveness
interpretation in relation to other studiesOther quantitative reviews have been published recently4 5 9 None of them quantified the population attributable fraction One meta-analysis evaluated the influence of adiposity on the association of sugar sweet-ened beverages and type 2 diabetes based on three stud-ies but not artificially sweetened beverages or fruit juice5 For sugar sweetened beverages we evaluated a greater number of type 2 diabetes cases (38 285 v 19 054) and studies (17 v 3) including bias assessments and sensitivity analyses For fruit juice and artificially sweetened beverages we evaluated a greater number of studies than previous work (9 v 4 and 12 v 4 respec-tively) and drew conclusions based on assessment of the influences of adiposity and potential bias that were found to be important
The plausibility of our findings deserves discussion Detrimental effects of sugar sweetened beverages inde-pendent of obesity may exist Sugars in sugar sweet-ened beverages acutely increased blood glucose levels and have a high glycaemic index (80 to 110100 of white bread) a risk factor for type 2 diabetes68 69 Fructose in sugar sweetened beverages promotes hepatic lipogene-sis and further insulin resistance2 Effects of caramels for colouring beverages70 caffeine49 71 phosphoric acid72 and other constituents may also exist These non-glycaemic effects may be present in artificially sweetened beverages if such beverages truly increase the risk of type 2 diabetes Artificially sweetened bever-ages might have effects on hormones microbiota and taste preference but evidence for these remains weak6 73 74 Adverse effects of fruit juice would be
United States
Suga
r sw
eete
ned
beve
rage
(gd
ay)
0
200
300
500
400
100
110
189
10 year risk for type 2 diabetes ()
No at risk (millions)
75
98
141
65
111
90
110
45
165
27
United Kingdom
Age (years)
PAF
for t
ype
2 di
abet
es
All0
10
15
25
20
5
20-44 45-64 Men Womenge65
Age (years)
All 20-44 45-64 Men Womenge65
58
45
21
21
80
15
55
21
61
23
107
9
PAF unadjusted for adiposityMean sugar sweetened beverage consumptionPAF adjusted for adiposity
Fig 3 | Consumption of sugar sweetened beverages and population attributable fraction (PaF) for type 2 diabetes in the united states and the united Kingdom Circles represent mean of consumption of sugar sweetened beverages (left axis) and each bar represents PaF () for type 2 diabetes due to consumption of sugar sweetened beverages (right axis) absolute event rates over 10 years were 110 in the usa (209 million events) and 58 in the uK (26 million events) (see supplementary table 7)
doi1 020076bmjh1576 | BMJ 2015101h1576 | thethinspbmj
RESEARCH
10
present because of its moderately high glycaemic index (50-80)68 Healthful constituents may exist but decrease during processing7 75 This explains why our finding was discordant with the inverse association of consum-ing fruits as food with type 2 diabetes76
Our analysis indicated possible publication bias for the associations between artificially sweetened bever-ages and type 2 diabetes The bias toward a false posi-tive finding would be plausible according to existing public interest over the health effects6 77 The finding at least underscores potential low quality of evidence and the need for cautious interpretation Residual confounding in the finding for artificially sweetened beverages is also plausible because adults at high risk of type 2 diabetes preferentially consumed more artifi-cially sweetened beverages5 6 8 10 11 36 Confounding in the opposite direction in the finding for fruit juice is also plausible because leaner adults at lower risk of type 2 diabetes consumed more fruit juice10 11 These observations provide research and clinical implications for better understanding of health seeking behaviours related to beverage consumption6 78
Clinical and public health implicationsAlthough causality has not been established our find-ings and available evidence indicate a benefit of reduc-ing the consumption of sugar sweetened beverages for the primary prevention of type 2 diabetes In the same context our findings also imply that consumption of artificially sweetened beverages or fruit juice is not likely to reduce the risk of type 2 diabetes and thus not suitable as a healthy option None the less the lower caloric intake of artificially sweetened beverages may be of clinical benefit in obese or overweight adults by helping to reduce body weight6 78 This effect on body weight should be considered separately from our study which could not rule out the effect of body weight on beverage consumption8 Additionally clinical applica-tions of our finding deserve further appraisal about the effects of altering beverage consumption on changes in lifestyle behaviours and on risks of other clinical outcomes3 6 8
Our findings have strong public health implications Despite the limitations of this review the current con-sumption of sugar sweetened beverages was estimated to cause approximately two million excess events of type 2 diabetes in the USA and 80 000 in the UK over 10 years This could cost nearly pound120bn in the USA and pound206m in the UK ($9800 in the USA and $3994 in the UK per patient67 $1 (pound065 euro091 as of 7 July 2015) In future our work on efficacy should be extended to that on effectiveness to identify needs for interventions In addition to observational evidence trial evidence should be available accounting for the effects on car-diometabolic health and lifestyle change associated with a possible intervention8 78 Despite a population attributable fraction of no more than 20 effectiveness should be evaluated for different populations as an estimated 592 million adults globally will have type 2 diabetes in 20351 67 Additionally the average popula-tion attributable fraction of no more than 20 confirms
the importance of modifying multiple lifestyle risk fac-tors rather than a single dietary component for the pri-mary prevention of type 2 diabetes For artificially sweetened beverages and fruit juice our findings inform little benefit of using them as an alternative to sugar sweetened beverages In addition fruit juice con-sumption should not be a part of dietary recommenda-tions for greater consumption of fruits and vegetables as suggested to limit fruit juice consumption among children7 79
ConclusionsObservational cohort studies support that consumption of sugar sweetened beverages is associated with inci-dent type 2 diabetes and independently of adiposity This finding was stable in sensitivity analyses assessing influence of population characteristics potential resid-ual confounding and publication bias By contrast although artificially sweetened beverages and fruit juice showed a positive association with incident type 2 diabetes the quality of evidence is limited by potential bias and heterogeneity by study design Although cau-sality has not been established and precision needs to be improved this study informs the potential efficacy of reducing the consumption of sugar sweetened bever-ages in a contemporary population Moreover findings support that neither artificially sweetened beverages nor fruit juice are suitable alternatives to sugar sweet-ened beverages for the prevention of type 2 diabetes The following contributors provided additional information Emilie Rossignol Guy Fagherazzi Franccediloise Clavel-Chapelon and Beverley Balkau Center for Research in Epidemiology and Population Health Villejuif Cedex France Tomonori Okamura Department of Preventive Medicine and Public Health Keio University School of Medicine Tokyo Japan and Hirotsugu Ueshima Department of Health Science and Center for Epidemiologic Research in Asia Sari Voutilainen Institute of Public Health and Clinical Nutrition Kuopio Finland Frank B Hu Harvard T H Chan School of Public Health Boston Massachusetts USA Manabu Sakurai Department of Epidemiology and Public Health Kanazawa Medical University Uchinada Ishikawa Japan Paul F Jacques Nicola M McKeown and Ma Jiantao Human Nutrition Research Center on Aging Tufts University Boston Massachusetts USAContributors FI and NGF conceived the study FI LOrsquoC YZ and NGF designed the study FI LOrsquoC and YZ undertook the literature search and extracted data FI JM YH and SNB did data analysis FI LOrsquoC YZ and NGF interpreted data FI developed the first draft FI as guarantor accepts full responsibility for the work and the conduct of the study had access to the data and controlled the decision to publish All authors provided critical comments and approved the final version The sponsor of the study had no role in design and conduct of the study collection management analysis and interpretation of the data preparation review or approval of the manuscript and decision to submit the manuscript for publication The corresponding author had full access to all the data in the study and had final responsibility for the decision to submit for publication Funding This study was funded by the Medical Research Council Epidemiology Unit Core Support (MC_UU_120155) SNB was supported by an American Heart Association postdoctoral fellowship grant (13POST14370012) Competing interests All authors have completed the ICMJE uniform disclosure form at wwwicmjeorgcoi_disclosurepdf and declare no support from any organisation for the submitted work no financial relationships with any organisations that might have an interest in the submitted work in the previous three years no other relationships or activities that could appear to have influenced the submitted workEthical approval Not requiredData sharing A protocol and data for tables and figures are available on request
thethinspbmj | BMJ 2015101h1576 | doi1 020076bmjh1576
RESEARCH
11
Transparency The guarantor (FI) affirms that the manuscript is an honest accurate and transparent account of the study being reported that no important aspects of the study have been omitted and that any discrepancies from the study as planned have been explained as post hoc analysis Data sharing is available from the corresponding author
This is an Open Access article distributed in accordance with the terms of the Creative Commons Attribution (CC BY 40) license which permits others to distribute remix adapt and build upon this work for commercial use provided the original work is properly cited See httpcreativecommonsorglicensesby40
1 Basu S McKee M Galea G Stuckler D Relationship of soft drink consumption to global overweight obesity and diabetes a cross-national analysis of 75 countries Am J Public Health 20131032071-7
2 Stanhope KL Role of fructose-containing sugars in the epidemics of obesity and metabolic syndrome Annu Rev Med 201263329-43
3 Weed DL Althuis MD Mink PJ Quality of reviews on sugar-sweetened beverages and health outcomes a systematic review Am J Clin Nutr 2011941340-7
4 Malik VS Popkin BM Bray GA et al Sugar-sweetened beverages and risk of metabolic syndrome and type 2 diabetes a meta-analysis Diabetes Care 2010332477-83
5 Greenwood DC Threapleton DE Evans CEL et al Association between sugar-sweetened and artificially sweetened soft drinks and type 2 diabetes systematic review and dose-response meta-analysis of prospective studies Br J Nutr 2014112725-34
6 Gardner C Wylie-Rosett J Gidding SS et al Nonnutritive sweeteners current use and health perspectives a scientific statement from the American Heart Association and the American Diabetes Association Circulation 2012126509-19
7 Slavin JL Lloyd B Health benefits of fruits and vegetables Adv Nutr 20123506-16
8 Malik VS Popkin BM Bray GA Despreacutes J-P Hu FB Sugar-sweetened beverages obesity type 2 diabetes mellitus and cardiovascular disease risk Circulation 20101211356-64
9 Xi B Li S Liu Z et al Intake of fruit juice and incidence of type 2 diabetes a systematic review and meta-analysis PloS One 20149e93471
10 Bleich SN Wolfson JA Vine S Wang YC Diet-beverage consumption and caloric intake among US adults overall and by body weight Am J Public Health 2014104e72-8
11 The InterAct Consortium Consumption of sweet beverages and type 2 diabetes incidence in European adults results from EPIC-InterAct Diabetologia 2013561520-30
12 Basu S Vellakkal S Agrawal S Stuckler D Popkin B Ebrahim S Averting obesity and type 2 diabetes in India through sugar-sweetened beverage taxation an economic-epidemiologic modeling study PLoS Med 201411e1001582
13 Brownell KD Farley T Willett WC et al The public health and economic benefits of taxing sugar-sweetened beverages N Engl J Med 20093611599-605
14 Briggs ADM Mytton OT Kehlbacher A Tiffin R Rayner M Scarborough P Overall and income specific effect on prevalence of overweight and obesity of 20 sugar sweetened drink tax in UK econometric and comparative risk assessment modelling study BMJ 2013347f6189
15 Liberati A Altman DG Tetzlaff J et al The PRISMA statement for reporting systematic reviews and meta-analyses of studies that evaluate healthcare interventions explanation and elaboration BMJ 2009339b2700
16 The Diabetes Prevention Program Research Group Diabetes Prevention Program Research Group Knowler WC et al Reduction in the incidence of type 2 diabetes with lifestyle intervention or metformin N Engl J Med 2002346393-403
17 Franco M Bilal U Orduntildeez P et al Population-wide weight loss and regain in relation to diabetes burden and cardiovascular mortality in Cuba 1980-2010 repeated cross sectional surveys and ecological comparison of secular trends BMJ 2013346f1515
18 Willett WC Howe GR Kushi LH Adjustment for total energy intake in epidemiologic studies Am J Clin Nutr 1997651220S-8S discussion 1229S-31S
19 Higgins JP Altman DG Gotzsche PC et al The Cochrane Collaborationrsquos tool for assessing risk of bias in randomised trials BMJ 2011343d5928
20 Sterne JA Higgins JP Reeves BC on behalf of the development group for ACROBAT-NRSI A A Cochrane risk of bias assessment tool for non-randomized studies of interventions version 100 September 2014 2014 wwwriskofbiasinfo
21 Higgins J Assessing risk of bias in included studies In Higgins J Green S eds Cochrane handbook for systematic reviews of interventions Cochrane Collaboration 20081-50
22 Schuumlnemann H Brożek J Oxman GGA Handbook for grading the quality of evidence and the strength of recommendations using the GRADE approach 2013 wwwguidelinedevelopmentorghandbook
23 Zhang J Yu KF Whatrsquos the relative risk A method of correcting the odds ratio in cohort studies of common outcomes JAMA 19982801690
24 Greenland S Longnecker MP Methods for trend estimation from summarized dose-response data with applications to meta-analysis Am J Epidemiol 19921351301-9
25 Higgins JP Thompson SG Quantifying heterogeneity in a meta-analysis Stat Med 2002211539-58
26 Walter WC Correction for the effects of measurement error In Willett WC ed Nutritional epidemiology 3rd ed Oxford University Press 2012
27 MacMahon S Peto R Cutler J et al Blood pressure stroke and coronary heart disease Part 1 prolonged differences in blood pressure prospective observational studies corrected for the regression dilution bias Lancet 1990335765-74
28 Carroll RJ Stefanski LA Measurement error instrumental variables and corrections for attenuation with applications to meta-analyses Stat Med 1994131265-82
29 Prospective Studies Collaboration Blood cholesterol and vascular mortality by age sex and blood pressure a meta-analysis of individual data from 61 prospective studies with 55 000 vascular deaths Lancet 20073701829-39
30 Di Angelantonio E Sarwar N Perry P et al Major lipids apolipoproteins and risk of vascular disease JAMA 20093021993-2000
31 Hunter DJ Spiegelman D Adami HO et al Cohort studies of fat intake and the risk of breast cancer--a pooled analysis N Engl J Med 1996334356-61
32 Greenland S Quantitative methods in the review of epidemiologic literature Epidemiol Rev 198791-30
33 Brenner H Gefeller O Use of the positive predictive value to correct for disease misclassification in epidemiologic studies Am J Epidemiol 19931381007-15
34 Jonathan E Sterne AC Egger M Moher D Bias C Addressing reporting biases In Higgins J Green S eds Cochrane handbook for systematic reviews of interventions Cochrane Collaboration 20081-33
35 Lash TL Fink AK Semi-automated sensitivity analysis to assess systematic errors in observational data Epidemiology 200314 451-8
36 Sun Q van Dam RM Spiegelman D Heymsfield SB Willett WC Hu FB Comparison of dual-energy x-ray absorptiometric and anthropometric measures of adiposity in relation to adiposity-related biologic factors Am J Epidemiol 20101721442-54
37 Smith GD Phillips AN Inflation in epidemiology ldquothe proof and measurement of association between two thingsrdquo revisited BMJ 19963121659-61
38 Bray GA Energy and fructose from beverages sweetened with sugar or high-fructose corn syrup pose a health risk for some people Adv Nutr 20134220-5
39 Nettleton JA Lutsey PL Wang Y et al Diet soda intake and risk of incident metabolic syndrome and type 2 diabetes in the Multi-Ethnic Study of Atherosclerosis (MESA) Diabetes Care 200932688-9440
40 Fagherazzi G Vilier A Saes Sartorelli D Lajous M Balkau B Clavel-Chapelon F Consumption of artificially and sugar-sweetened beverages and incident type 2 diabetes in the Etude Epidemiologique aupres des femmes de la Mutuelle Generale de lrsquoEducation Nationale-European Prospective Investigation into Cancer and Nutrition cohort Am J Clin Nutr 201397517-23
41 Muraki I Imamura F Manson JE et al Fruit consumption and risk of type 2 diabetes results from three prospective longitudinal cohort studies BMJ 2013347f5001
42 Cook JR Stefanski LA Simulation-extrapolation estimation in parametric measurement error models J Am Stat Assoc 1994891314-28
43 Greenland S Estimation of population attributable fractions from fitted incidence ratios and exposure survey data with an application to electromagnetic fields and childhood leukemia Biometrics 200157182-8
44 Schuumlnemann AHJ Oxman AD Vist GE Higgins JPT Jonathan J Interpreting results and drawing conclusions In Higgins J Green S eds Cochrane Handbook for Systematic Reviews of Interventions Cochrane Collaboration 20081-24
45 National Center for Health Statistics National Health and Nutrition Examination Survey NHANES (2009-2010) 2005 wwwcdcgovnchsnhaneshtm
46 Public Health England and Food Standards Agency National Diet and Nutrition Survey results from years 1 to 4 (combined) of the rolling programme for 2008 and 2009 to 2011 and 2012 2014 wwwgovukgovernmentpublicationsnational-diet-and-nutrition-survey- results-from-years-1-to-4-combined-of-the-rolling-programme-for-2008-and-2009-to-2011-and-2012
47 Hippisley-Cox J Coupland C Robson J Sheikh A Brindle P Predicting risk of type 2 diabetes in England and Wales prospective derivation and validation of QDScore BMJ 2009338b880
48 Schmidt MI Duncan BB Bang H et al Identifying individuals at high risk for diabetes the Atherosclerosis Risk in Communities study Diabetes Care 2005282013-8
RESEARCH
No commercial reuse See rights and reprints httpwwwbmjcompermissions Subscribe httpwwwbmjcomsubscribe
49 Bhupathiraju SN Pan A Malik VS et al Caffeinated and caffeine- free beverages and risk of type 2 diabetes Am J Clin Nutr 2013 97155-66
50 De Koning L Malik VS Rimm EB Willett WC Hu FB Sugar-sweetened and artificially sweetened beverage consumption and risk of type 2 diabetes in men Am J Clin Nutr 2011931321-7
51 Bazzano LA Li TY Joshipura KJ Hu FB Intake of fruit vegetables and fruit juices and risk of diabetes in women Diabetes Care 2008311311-7
52 Eshak ES Iso H Mizoue T Inoue M Noda M Tsugane S Soft drink 100 fruit juice and vegetable juice intakes and risk of diabetes mellitus Clin Nutr 201332300-8
53 Montonen J Jarvinen R Knekt P Heliovaara M Reunanen A Consumption of sweetened beverages and intakes of fructose and glucose predict type 2 diabetes occurrence J Nutr 20071371447-54
54 Mursu J Virtanen JK Tuomainen T-P Nurmi T Voutilainen S Intake of fruit berries and vegetables and risk of type 2 diabetes in Finnish men the Kuopio Ischaemic Heart Disease Risk Factor Study Am J Clin Nutr 201499328-33
55 Duffey KJ Gordon-Larsen P Steffen LM et al Drinking caloric beverages increases the risk of adverse cardiometabolic outcomes in the Coronary Artery Risk Development in Young Adults (CARDIA) Study Am J Clin Nutr 201092954-9
56 Duffey KJ Steffen LM Van Horn L Jacobs DR Popkin BM Dietary patterns matter diet beverages and cardiometabolic risks in the longitudinal Coronary Artery Risk Development in Young Adults (CARDIA) Study Am J Clin Nutr 201295909-15
57 Odegaard AO Koh W-PP Arakawa K Yu MC Pereira MA Soft drink and juice consumption and risk of physician-diagnosed incident type 2 diabetes the Singapore Chinese Health Study Am J Epidemiol 2010171701-8
58 Palmer JR Boggs DA Krishnan S Hu FB Singer M Rosenberg L Sugar-sweetened beverages and incidence of type 2 diabetes mellitus in African American women Arch Intern Med 2008168 1487-92
59 Sakurai M Nakamura K Miura K et al Sugar-sweetened beverage and diet soda consumption and the 7-year risk for type 2 diabetes mellitus in middle-aged Japanese men Eur J Nutr 201453251-8
60 Schulze MB Manson JE Ludwig DS et al Sugar-sweetened beverages weight gain and incidence of type 2 diabetes in young and middle-aged women JAMA 2004292927-34
61 Pan A Malik VS Schulze MB Manson JE Willett WC Hu FB Plain-water intake and risk of type 2 diabetes in young and middle-aged women Am J Clin Nutr 2012951454-60
62 Pereira MA Parker ED Folsom AR Intake of sugar sweetened beverages fruit juice and incidence of type 2 diabetes A prospective study of postmenopausal women Diabetes 200554A258
63 Hayashino Y Fukuhara S Okamura T et al A prospective study of passive smoking and risk of diabetes in a cohort of workers the High-Risk and Population Strategy for Occupational Health Promotion (HIPOP-OHP) study Diabetes Care 200831732-4
64 Paynter NP Yeh H-CC Voutilainen S et al Coffee and sweetened beverage consumption and the risk of type 2 diabetes mellitus the atherosclerosis risk in communities study Am J Epidemiol 20061641075-84
65 Dhingra R Sullivan L Jacques PF et al Soft drink consumption and risk of developing cardiometabolic risk factors and the metabolic syndrome in middle-aged adults in the community Circulation 2007116480-8
66 Duffey KJ Steffen LM Van Horn L Jacobs DR Jr Popkin BM Dietary patterns matter diet beverages and cardiometabolic risks in the longitudinal Coronary Artery Risk Development in Young Adults (CARDIA) Study Am J Clin Nutr 201295909-15
67 International Diabetes Federatoin The Global Burden In IDF diabetes atlas 6th ed IDF 201329-49
68 Atkinson FS Foster-Powell K Brand-Miller JC International tables of glycemic index and glycemic load values 2008 Diabetes Care 2008312281-3
69 Livesey G Taylor R Livesey H Liu S Is there a dose-response relation of dietary glycemic load to risk of type 2 diabetes Meta-analysis of prospective cohort studies Am J Clin Nutr 201397584-96
70 Kellow NJ Savige GS Dietary advanced glycation end-product restriction for the attenuation of insulin resistance oxidative stress and endothelial dysfunction a systematic review Eur J Clin Nutr 201367239-48
71 Jiang X Zhang D Jiang W Coffee and caffeine intake and incidence of type 2 diabetes mellitus a meta-analysis of prospective studies Eur J Nutr 20145325-38
72 Fitzpatrick L Heaney RP Got soda J Bone Miner Metab 2003181570-2
73 Pepino MY Bourne C Non-nutritive sweeteners energy balance and glucose homeostasis Curr Opin Clin Nutr Metab Care 201114 391-5
74 Suez J Korem T Zeevi D et al Artificial sweeteners induce glucose intolerance by altering the gut microbiota Nature 2014514181-6
75 Crowe KM Murray E Deconstructing a fruit serving comparing the antioxidant density of select whole fruit and 100 fruit juices J Acad Nutr Diet 20131131354-8
76 Cooper AJ Forouhi NG Ye Z et al Fruit and vegetable intake and type 2 diabetes EPIC-InterAct prospective study and meta-analysis Eur J Clin Nutr 2012661082-92
77 De la Pentildea C Artificial sweetener as a historical window to culturally situated health Ann N Y Acad Sci 20101190159-65
78 Piernas C Tate DF Wang X Popkin BM Does diet-beverage intake affect dietary consumption patterns Results from the Choose Healthy Options Consciously Everyday (CHOICE) randomized clinical trial Am J Clin Nutr 201397604-11
79 Wojcicki JM Heyman MB Reducing childhood obesity by eliminating 100 fruit juice Am J Public Health 20121021630-3
copy BMJ Publishing Group Ltd 2015
Appendix supplementary material
thethinspbmj | BMJ 2015101h1576 | doi1 020076bmjh1576
RESEARCH
3
source of heterogeneity meta-analysis excluding studies with a certain type of bias or meta-analysis incorporating quantitative measures of bias (see sup-plementary information) Overall quality of evidence was assessed based on study quality results from sen-sitivity analysis and principles of the grades of rec-ommendation assessment development and evaluation (GRADE)22 One author (FI) first sum-marised the results of bias assessment and quality of overall evidence and these results were discussed among the other authors (FI LOC YZ and NGF) for consensus
meta-analysisWe used Stata 131 for analyses (α two sided P=005 unless indicated) Statistical details are described in the supplementary information Each of sugar sweetened beverages artificially sweetened beverages and fruit juice was considered as the main exposure We defined sugar sweetened beverages as any sweetened bever-ages including sugar sweetened fruit juice not pre-sented as diet or non-caloric beverages Artificially sweetened beverages included low caloric soft drinks as reported in each study Fruit juice was defined as 100 fruit juice or fruit juice assessed separately from fruit drinks We standardised measures of associations to relative risk per one servingday of beverage consump-tion after we confirmed that this unit was the most fre-quently used in studies Because volume per serving was specific to a population ranging from 237 mL (one cup) to 355 mL (12 oz) (median across publications=250 mLday) we repeated meta-analysis to estimate the rel-ative risk for each 250 mLday We converted odds ratios if reported to relative risks23 If a study reported categorical estimates only they were combined to obtain a single dose-response estimate24 If only strati-fied estimates were reported we merged them by fixed effects meta-analysis to derive a cohort specific esti-mate assuming consistency of associations within a cohort
We performed random effects meta-analysis as pre-specified assuming that biological effects of bever-ages in different populations would vary randomly at least by processing and composition of beverages The heterogeneity of associations was expressed by I225 For each of the beverages of interest we esti-mated relative risks before and after adjustment for adiposity measures To assess a magnitude of overall confounding we additionally estimated crude rela-tive risks without any adjustment Non-linear associ-ations were additionally evaluated by cubic spline meta-analysis for which we used available categorical estimates24
In observational studies within person variability of exposure can cause bias26-30 As performed previ-ously26-32 we compiled within person variation of bev-erage consumption in each study and adjusted for them to estimates of each study Uncertainty in self reported diagnosis of type 2 diabetes was also cali-brated for estimates from studies without objective information on incidence of type 2 diabetes33 To compute
relative risks adjusted for within person dietary vari-ation and uncertainty of type 2 diabetes ascertain-ment we pooled the estimates after study specific calibration
Meta-regression was used to assess if heterogeneity of associations across studies depended on population demographics study characteristics and indicators of errors or bias Publication status (peer reviewed or not) selective reporting (yes or no) and mutual adjustment for three beverage types were evaluated after we identi-fied studies with those characteristics Stratified meta-analysis was performed by each variable that pre-dicted heterogeneity (Plt001) and by prespecified vari-ables age sex body mass index and study location In exploratory analysis using multiple variables of study specific factors we reassessed I2 as a magnitude of unexplained heterogeneity
Publication bias was assessed by Eggerrsquos test with a contour enhanced funnel plot and lsquotrim and fillrsquo analy-sis34 If publication bias was indicated we adjusted summary estimates for the bias34 Robustness of sum-mary findings was examined by sensitivity analyses influence analysis32 fixed effects meta-analysis analy-sis using millilitres per day as a unit analysis without studies with a high overall risk of bias and analysis incorporating measures of uncertainty in adjustment for within person dietary variations and diagnosis of type 2 diabetes35
Adiposity is likely to confound an association of beverage consumption with type 2 diabetes particu-larly in research on artificially sweetened bever-ages6 8 10 11 Because of imperfect measurement of adiposity in an epidemiological study36 adjustment for adiposity was likely to be insufficient as discussed previously3 6 32 37-41 Thus to assess if such residual con-founding would be substantial we performed simula-tion analysis to examine the influence of the bias42
type 2 diabetes risk attributable to sugar sweetened beverages in usa and uKWe estimated the risks of type 2 diabetes attributable to consumption of sugar sweetened beverages over 10 years in the USA and UK43 44 These countries contrib-uted to the meta-analysis to the largest extent and pro-vided publically available data on diets and risk factors for type 2 diabetes the US national health and nutri-tion examination survey 2009-1045 and the UK national diet and nutrition survey 2008-1246 The recent cycle was selected for greater generalisability to recent pop-ulations Selecting adults aged 20 years or more and without prevalent diabetes we analysed 4729 US adults and 1932 UK adults Accounting for sampling weight 1891 million US adults and 447 million UK adults were represented
We estimated the population attributable fraction by applying a Cochrane Collaboration algorithm to survey data43 44 We first estimated habitual consumption of sugar sweetened beverages based on 24 hour recalls in the USA and four day food records in the UK Then we estimated the 10 year risk of type 2 diabetes based on a risk prediction algorithm developed and validated in
doi1 020076bmjh1576 | BMJ 2015101h1576 | thethinspbmj
RESEARCH
4
each country47 48 The predicted risk for each individ-ual was considered as an ldquoassumed control riskrdquo44 if the current consumption of sugar sweetened bever-ages would remain constant Then we calculated an alternative risk if the consumption of sugar sweetened beverages would become zero calculating assumed control risktimes(1relative risk per servingday)timesobserved sugar sweetened beverages servingsday The differ-ence between the two risk estimates represented a risk attributable to consumption of sugar sweetened bever-ages Using the risk estimates sampling weights and a population size we estimated the absolute numbers of events over 10 years events attributable to con-sumption of sugar sweetened beverages (absolute risk reduction44) and population attributable fraction (the proportion of events attributable to consumption of sugar sweetened beverages) The estimation assumed causality and no change in individualsrsquo characteris-tics over time Validation of 10 year risk prediction was performed in the US survey in which we pre-dicted diabetes prevalence in 2009-10 by using data collected in 1999-2000 Sensitivity analysis was per-formed to estimate the population attributable frac-tion by varying relative risks and accounting for uncertainty Further details are presented in the sup-plementary information
ResultsAfter the removal of duplicates we identified 1937 arti-cles reviewed 33 in full text and identified 21 articles of 16 cohorts as being eligible for this meta-analysis (see supplementary figure S1) We obtained unpublished information on one cohort from a publication that did not meet eligibility criteria (see supplementary table S1)22 Finally we evaluated data from 17 cohorts (table 1 )11 39-41 49-65 comprising 38 253 cases of type 2 dia-betes over 10 126 756 person years in total No study or publication was funded by industry
The quality of the studies has been examined (see supplementary table S2) Methods of assessing diets and ascertaining type 2 diabetes and validity of these measurements varied across studies (table 1 and sup-plementary table S3) We identified potential bias in the quantitative results for six cohorts based on at least one of the following publication of a conference abstract only62 exclusion of participants lost during follow-up57 63 likelihood of substantial residual con-founding40 and no separation between fruit juice and sugar sweetened beverages (fruit drinks) or between sugar sweetened beverages and artificially sweetened beverages57 64 Selective reporting might exist in some studies39 52 55 58 62 64 but it was unlikely to cause biasmdashfor example reporting only non-quan-titative results for sugar sweetened beverages in a study mainly on artificially sweetened beverages39 Other potential sources of bias were detected but we did not consider them to be substantially influential on overall bias in each study partly based on results of sensitivity analyses No study assessed subtypes of sugar sweetened beverages artificially sweetened
beverages or fruit juice except one that separated beverages by caffeine content49
Confounding was likely to exist in all of the studies As would be expected consumers of artificially sweet-ened beverages tended to be overweight or obese or hypertensive11 39 50 59 66 In longitudinal analysis all studies statistically adjusted for potential confounders such as sociodemographic variables clinical factors (family history of diabetes or prevalent diseases) and lifestyle factors including diet (see supplementary table S4) None of these factors was identified as a single cause of confounding according to studies assessing influence of potential confounding in differ-ent regression models11 41 49-51 54 59 61 63-65 However a com-bination of multiple factors was likely to cause confounding (table 2 and supplementary table S4) After adjustment for multiple potential confounders the relative risk for sugar sweetened beverages was attenuated from 125 to 118 (32 change) and for artifi-cially sweetened beverages from 148 to 125 (43) By contrast the point estimate for fruit juice was shifted upwards from 097 to 105
beverage consumption and type 2 diabetesTable 2 summarises the findings from meta-analysis Higher consumption of sugar sweetened beverages by one serving per day was associated with an 18 greater incidence of type 2 diabetes (95 confidence interval 88 to 28 I2=89) before adjustment for adiposity (fig 1 and table 2) When adjusted for potential media-tion and confounding by adiposity the association was attenuated with the incidence increased by 13 per servingday (58 to 21 I2=79) In the analysis of artificially sweetened beverages in which adiposity was unlikely to be a mediator higher consumption of artificially sweetened beverages by one serving per day was associated with a 25 greater incidence of type 2 diabetes (95 confidence interval 18 to 33 I2=70) before adjustment for adiposity After adjustment the estimate of 25 greater incidence was attenuated to 8 (21 to 15)
In the analysis of fruit juice the influence of adjust-ment for adiposity was in the direction opposite to that of the analysis for sugar sweetened beverages and arti-ficially sweetened beverages The association of fruit juice consumption with incident type 2 diabetes was strengthened after adjustment for adiposity measures Higher consumption of fruit juice by one servingday was associated with a 7 greater incidence of type 2 diabetes (95 confidence interval 08 to 14)
Each of the beverages showed significant non-linear associations (Pgt005) (supplementary figure S2) Cali-bration for within person variation strengthened the association between each type of beverage and incident type 2 diabetes (fig 1 and table 2) For example the rela-tive risk per one servingday of sugar sweetened bever-ages was strengthened from 113 (95 confidence interval 106 to 121) to 128 (112 to 146) Estimates for artificially sweetened beverages were strengthened similarly The influence was small for fruit juice where
thethinspbmj | BMJ 2015101h1576 | doi1 020076bmjh1576
RESEARCH
5
tabl
e 1 |
Cha
ract
eris
tics o
f pro
spec
tive
coho
rt st
udie
s inc
lude
d in
met
a-an
alys
is o
n as
soci
atio
ns b
etw
een
cons
umpt
ion
of su
gar s
wee
tene
d be
vera
ges
art
ifici
ally
swee
tene
d be
vera
ges
and
frui
t ju
ice
and
inci
denc
e of
type
2 d
iabe
tes
Coho
rt c
ount
ry
base
line
year
s
med
ian
follo
w-u
p (y
ears
)no
age
rang
e or
mea
n ag
e (y
ears
)m
en
()
mea
n bm
i
beve
rage
con
sum
ptio
ndaggerin
cide
nt ty
pe 2
dia
bete
sDaggerm
etho
d of
as
sess
men
tty
pes
met
hod
of a
scer
tain
men
tno
of c
ases
(r
ate
1000
)DaggerFM
CHES
Fin
land
5319
66-7
213
743
0440
-69
531
265
Diet
his
tory
SSB
Reco
rds
175
(30
)NH
S I
USA41
51
1984
211
74 5
1340
-69
023
6FF
Qdagger
SSB
ASB
FJ
Self
repo
rt73
00 (4
6)Dagger
KIHD
Fin
land
5419
84-8
918
924
8142
-60
100
268
4 da
y die
t rec
ord
SSBsect
Reco
rds
bio
mar
kers
506
(10
8)CA
RDIA
USA
55 5
6 para19
85-8
618
821
6018
-30
465
245
Diet
his
tory
daggerSS
B A
SB F
JSe
lf re
port
rec
ords
bio
mar
kers
174
(43
)DaggerHP
FS U
SA41
49
5019
8619
340
290
40-7
510
025
5FF
Qdagger
SSB
ASB
FJ
Self
repo
rt32
29 (4
2)Dagger
Iow
a W
HS U
SA62
para19
8610
731
489
55-6
90
270
FFQ
SSB
FJ
Self
repo
rt99
9 (3
0)Dagger
ARIC
men
USA
64
1987
-89
7554
1445
-64
100
272
FFQ
SSBDagger
Self
repo
rt b
iom
arke
rs71
8 (1
77)
ARIC
wom
en U
SA64
19
87-8
977
6790
45-6
40
272
FFQ
SSBDagger
Self
repo
rt b
iom
arke
rs71
9 (1
38)
JPHC
men
Jap
an52
para19
909
812
137
40-5
910
023
5FF
Qdagger
SSB
FJ
Self
repo
rt39
7 (3
3)Dagger
JPHC
wom
en J
apan
52para
1990
99
15 4
4840
-59
023
5FF
Qdagger
SSB
FJ
Self
repo
rt27
9 (1
8)Dagger
FOS
USA
6519
9112
127
3654
245
526
7FF
Qdagger
SSB
ASB
FJ
Reco
rds
sel
f rep
ort
biom
arke
rs30
3 (9
1)NH
S II
USA
41 6
0 61
1991
184
90 4
2324
-44
024
4FF
Qdagger
SSB
ASB
FJ
Self
repo
rt51
21 (3
1)Dagger
EPIC
-Inte
rAct
eig
ht E
urop
ean
coun
tries
1119
91-9
811
727
058
524
378
260
FFQ
SSB
ASB
FJ
Reco
rds
bio
mar
kers
Dagger11
684
(29
)E3
N Fr
ance
40para
1993
124
48 9
8552
80
228
Diet
his
tory
SSB
ASB
FJ
Reco
rds
1054
(17
)SC
HS S
inga
pore
57para
1993
-98
57
43 5
8045
-74
429
230
FFQ
SSB
FJ
Self
repo
rt r
ecor
ds b
iom
arke
rs22
50 (9
0)Dagger
Blac
k W
HS U
SA58
1995
7743
960
21-6
90
276
FFQ
SSB
ASB
FJ
Self
repo
rt25
50 (7
5)Dagger
HIPO
P-OH
P Ja
pan63
para19
993
461
2119
-69
789
226
FFQ
SSB
FJ
Self
repo
rt r
ecor
ds b
iom
arke
rs21
2 (1
02)
MES
A U
SA39
2000
-02
58
5011
45-8
447
427
9FF
QSS
B A
SBSe
lf re
port
rec
ords
bio
mar
kers
413
(14
3)Oc
cupa
tiona
l coh
ort
Japa
n5920
035
520
3735
-55
100
233
FFQ
SSB
ASB
FJ
Reco
rds
bio
mar
kers
170
(151
)AS
B=ar
tifici
ally
sw
eete
ned
beve
rage
s A
RIC=
Athe
rosc
lero
sis R
isk
in C
omm
uniti
es S
tudy
CAR
DIA=
Coro
nary
Arte
ry R
isk
Deve
lopm
ent i
n Yo
ung
Adul
ts S
tudy
EPI
C=Eu
rope
an P
rosp
ectiv
e In
vest
igat
ion
into
Can
cer a
nd N
utrit
ion
Stud
y F
FQ=f
ood
frequ
ency
que
stio
nnai
res
FJ=
fruit
juic
e F
MCH
ES=F
inni
sh M
obile
Clin
ic H
ealth
Exa
min
atio
n Su
rvey
FOS
=Fra
min
gham
Offs
prin
g St
udy
HIP
OP-
OHP
=Hig
h-ris
k an
d Po
pula
tion
Stra
tegy
for O
ccup
atio
nal H
ealth
Pro
mot
ion
Stud
y H
PFS=
Heal
th
Prof
essi
onal
Fol
low
-up
Stud
y JP
HC=J
apan
Pub
lic H
ealth
Cen
ter-b
ased
Pro
spec
tive
Stud
y K
IHD=
Kuop
io Is
chae
mic
Hea
rt Di
seas
e Ri
sk Fa
ctor
Stu
dy M
ESA=
Mul
ti-Et
hnic
Stu
dy o
f Ath
eros
cler
osis
NHS
=Nur
sesrsquo
Heal
th S
tudy
SCH
S=Si
ngap
ore
Chin
ese
Heal
th S
tudy
SSB
=sug
ar s
wee
tene
d be
vera
ges
WHS
=Wom
enrsquos
Heal
th S
tudy
O
rder
ed in
yea
rs o
f bas
elin
e as
sess
men
ts N
umbe
rs re
pres
ent c
itatio
ns A
RIC
and
JPHS
repo
rted
resu
lts s
tratifi
ed b
y sex
In
met
a-an
alys
is s
ex s
tratifi
ed e
stim
ates
wer
e ag
greg
ated
in a
dvan
ce
daggerDie
ts w
ere
asse
ssed
repe
ated
ly d
urin
g fo
llow
-up
and
inco
rpor
ated
in lo
ngitu
dina
l ana
lysi
s JP
HC m
easu
red
repe
ated
ly b
ut u
sed
base
line
FFQ
only
DaggerB
iom
arke
rs in
clud
ed a
ny o
f fas
ting
gluc
ose
two
hour
glu
cose
by o
ral g
luco
se to
lera
nce
test
and
gly
cate
d ha
emog
lobi
n R
ecor
ds in
clud
ed m
edic
al re
cord
s or o
ther
reco
rds f
rom
regi
stry
not
incl
udin
g se
lf re
porte
d in
form
atio
n S
tudi
es a
scer
tain
ing
case
s of t
ype
2 di
abet
es b
y sel
f rep
ort i
nvol
ved
unce
rtai
nty i
n as
cert
ainm
ent
and
thus
num
bers
of c
ases
wer
e re
vise
d by
a p
ositi
ve p
redi
ctiv
e va
lue
(pro
port
ion
of v
erifi
ed c
ases
am
ong
self
repo
rted
case
s) (s
ee su
pple
men
tary
info
rmat
ion
and
tabl
e S3
) Th
e EP
IC-In
terA
ct s
tudy
ado
pted
diff
eren
t met
hods
acr
oss p
artic
ipat
ing
coho
rts
in w
hich
no
coho
rt us
ed s
elf r
epor
ted
diag
nosi
s onl
ysectI
n AR
IC a
nd F
OS a
naly
ses
sug
ar s
wee
tene
d an
d ar
tifici
ally
sw
eete
ned
beve
rage
s wer
e co
mbi
ned
In K
IHD
the
artic
le d
escr
ibed
frui
t jui
ces
but
trea
ted
them
as s
ugar
sw
eete
ned
beve
rage
s b
ecau
se m
ore
than
90
of f
ruit
juic
e co
nsum
ed in
Fin
land
in
1980
s and
1990
s was
sw
eete
ned
with
sug
ars (
confi
rmed
by t
he a
utho
rs)
paraCon
side
red
as h
avin
g po
tent
ial b
ias (
see
supp
lem
enta
ry in
form
atio
n an
d ta
ble
S2)
In e
ach
of C
ARDI
A an
d JP
HC d
istin
ct a
naly
tic a
ppro
ache
s wer
e un
dert
aken
in d
iffer
ent p
ublic
atio
ns b
y the
sam
e au
thor
s Io
wa
WHS
repo
rted
resu
lts o
nly i
n a
conf
eren
ce a
bstra
ct E
3N p
rese
nted
pro
spec
tive
asso
ciat
ions
adj
uste
d fo
r cru
de c
ateg
oric
al v
aria
bles
for b
ody m
ass i
ndex
whi
ch c
ould
cau
se s
ubst
antia
l res
idua
l con
foun
ding
SCH
S pr
esen
ted
resu
lts w
ithou
t cla
ssifi
catio
n be
twee
n 10
0 fr
uit j
uice
an
d su
gar s
wee
tene
d fru
it ju
ice
and
had
a lik
elih
ood
of a
ttriti
on b
ias b
y los
s of f
ollo
w-u
p by
dea
ths (
15
) HI
POP-
OHP
lost
31
of p
artic
ipan
ts d
urin
g fo
llow
-up
whi
ch c
ould
cau
se b
ias d
ue to
diff
eren
tial m
iscl
assi
ficat
ion
doi1 020076bmjh1576 | BMJ 2015101h1576 | thethinspbmj
RESEARCH
6
the relative risk was shifted only slightly from 107 (101 to 114) to 110 (101 to 120)
sensitivity analysis and quality of evidenceNone of the study specific factors evaluated could explain heterogeneity of results for sugar sweetened beverages and artificially sweetened beverages (Pgt01) (see supplementary table S5) Exploratory meta- regression produced an I2 of 234 for sugar sweet-ened beverages and of 678 for artificially sweetened beverages adjusted for population demographics (age sex country incidence) body mass index fol-low-up duration and measures of study quality The results for fruit juice varied by study design While studies assessing self reported type 2 diabetes only showed a positive association the significant associa-tion disappeared in studies ascertaining the incidence of type 2 diabetes by medical records or by blood glu-cose or glycated haemoglobin level (relative risk 108 097 to 120 P for heterogeneity=0008) Additionally studies with repeated measures of diets supported a null finding (098 086 to 111 P for heterogene-ity=0068) These factors of study design explained heterogeneity of the association reducing I2 from 29 to 0 Demographic variables and body mass index did not explain heterogeneity (Pgt014 each) whereas sugar sweetened beverages artificially sweetened beverages and fruit juice were not significantly asso-ciated with type 2 diabetes in studies recruiting more men than women or conducted in Asia with a fewer number of studies than in the main analysis (supple-mentary table S5)
Publication bias was not evident by Eggerrsquos test (Pgt005) except for fruit juice (P=003) where esti-mates with the greater precision showed stronger asso-ciations (fig 2) Trim and fill indicated publication bias for both sugar sweetened and artificially sweetened
beverages (table 2) In particular publication bias could influence inference for artificially sweetened beverages With adjustment for adiposity the relative risk per one servingday of artificially sweetened bev-erages was 129 (108 to 154) before calibration for publication bias and 122 (098 to 152) after calibration (table 2)
Contour enhanced funnel plots indicated that the findings for artificially sweetened beverages and fruit juice were not stable (fig 2) For example if a study with a relative risk of 05 contributed to the meta-analysis associations of artificially sweetened beverages and fruit juice with type 2 diabetes incidence would not be significant In influence analysis positive associations persisted for sugar sweetened beverages and artificially sweetened beverages (see supplementary figure S3) whereas a significant result of fruit juice was not seen after excluding any single studies supporting the posi-tive association
The results varied little by methodological assump-tion (see supplementary table S6) using estimates per 250 mLday (median of 17 studies) rather than per servingday excluding studies with a high risk of potential bias or with relatively large within person dietary variability and incorporating uncertainty of within person variability and precision of type 2 diabe-tes diagnosis When we examined the potential influ-ence of residual confounding by measured adiposity bias towards the null appeared substantial for artifi-cially sweetened beverages (see supplementary figure S4) Under a realistic assumption of a correlation of 080 between measured and true adiposity36 the asso-ciation for sugar sweetened beverages was attenuated by 26 (relative risk 120 104 to 138) for artificially sweetened beverages was attenuated by 96 (101 081 to 125) and for fruit juice was strengthened by 19 (112 103 to 122)
table 2 | associations between consumption of sugar sweetened beverages artificially sweetened beverages and fruit juice and incident type 2 diabetes meta-analysis of prospective cohort studies
beverages (no of cohorts) and models of meta-analysis
not adjusted for adipositydagger adjusted for adipositydaggerrelative risk (95 Ci) i2 () relative risk (95 Ci) i2 ()
sugar sweetened beverages (n=17)Meta-analysis crude 125 (114 to 137) 89 mdash mdash +multivariable adjusted 118 (109 to 128) 89 113 (106 to 121) 79 +calibration for information bias 143 (120 to 170) 86 128 (112 to 146) 73 +calibration for publication bias 142 (119 to 169) 85 127 (110 to 146) 73artificially sweetened beverages (n=10)Meta-analysis crude 148 (135 to 162) 85 mdash mdash +multivariable adjusted 125 (118 to 133) 70 108 (102 to 115) 64 +calibration for information bias 213 (157 to 288) 72 129 (108 to 154) 50 +calibration for publication bias 181 (133 to 247) 76 122 (098 to 152) 64Fruit juices (n=13)Meta-analysis crude 097 (090 to 106) 79 mdash +multivariable adjusted 105 (099 to 111) 58 107 (101 to 114) 51 +calibration for information bias 106 (098 to 114) 49 110 (101 to 120) 29 +calibration for publication bias Not detected mdash Not detected mdashNumber of cohorts varied slightly by models (see fig 1) Crude meta-analysis pooled estimates without any adjustment Multivariable adjusted estimates were based on meta-analysis of estimates adjusted for demographic and lifestyle covariates (see supplementary table S4 for details) Calibration for information bias accounted for within person variation for dietary consumption and imprecise ascertainment of self reported diabetes Calibration for publication bias was carried out if indicated in trim and fill analysis daggerRelative risk and 95 confidence intervals per servingday before and after adjustment for adiposity All relative risks were significant (Plt005) except for artificially sweetened beverages after adjustment for publication bias (P=007)
thethinspbmj | BMJ 2015101h1576 | doi1 020076bmjh1576
RESEARCH
7
We rated the quality of evidence for sugar sweetened beverages artificially sweetened beverages and fruit juice The evidence for sugar sweetened beverages was rated as being of moderate quality The main finding rejected the null hypothesis and was likely to have a small degree of heterogeneity unexplained a dose-re-sponse relation and robustness against potential bias
or limitations including publication bias We rated the evidence for artificially sweetened beverages and fruit juice to be of low quality Findings for artificially sweet-ened beverages were likely to have publication bias and residual confounding and for fruit juice the posi-tive association was not stable and varied by study design
Sugar sweetened beverages
EPIC-InterAct11
ARIC64
Black WHS58
NHS II41 60 61
KIHD54
NHS I41 51
CARDIA55 56
HPFS41 49 50
FOS65
Iowa WHS62
MESA39
Occupation cohort Japan59
SCHS57
HIPOP-OHP63
E3N40
JPHC52
FMCHES53
Overall
Arti13cially sweetened beverages
EPIC-InterAct11
NHS II41 60 61
NHS I41 51
MESA39
HPFS41 49 50
Black WHS58
CARDIA55 56
FOS65
Occupation cohort Japan59
E3N40
Overall
Fruit juice
NHS I41 51
EPIC-InterAct11
NHS II41 60 61
HPFS41 49 50
FOS65
Black WHS58
Iowa WHS62
CARDIA55 56
E3N40
SCHS57
HIPOP-OHP63
JPHC52
Occupation cohort Japan59
Overall
05 1 2 4
Cohort Relative risk(95 CI)
121 (112 to 131)
101 (096 to 106)
110 (105 to 116)
117 (111 to 124)
106 (095 to 118)
139 (130 to 148)
Unavailable
131 (120 to 144)
112 (090 to 140)
Unavailable
Unavailable
108 (088 to 133)
222 (164 to 300)
089 (075 to 106)
282 (087 to 917)
125 (099 to 158)
Unavailable
118 (109 to 128)
I2=890
136 (118 to 156)
120 (116 to 125)
124 (119 to 130)
148 (121 to 180)
123 (115 to 132)
105 (086 to 127)
Unavailable
124 (113 to 137)
134 (090 to 199)
117
125 (118 to 133)
I2=703
114 (108 to 121)
102 (095 to 108)
107 (100 to 114)
105 (097 to 114)
081 (066 to 099)
105 (099 to 111)
Unavailable
Unavailable
083 (061 to 115)
172 (109 to 272)
089 (050 to 158)
111 (082 to 151)
056 (021 to 148)
105 (099 to 111)
I2=579
99
105
105
104
91
102
95
60
63
44
73
05
56
1000
104
209
203
67
176
70
146
22
03
1000
183
172
172
153
56
183
26
13
09
29
03
1000
Relative risk(95 CI)
Weight()
05 1 2 4 05 1 2 4
Relative risk(95 CI)dagger
113 (105 to 122)
101 (096 to 106)
106 (097 to 116)
111 (104 to 119)
105 (095 to 117)
123 (114 to 132)
103 (093 to 114)
122 (110 to 135)
112 (090 to 139)
149 (127 to 175)
086 (063 to 118)
107 (087 to 132)
195 (144 to 265)
089 (075 to 106)
270 (082 to 882)
115 (088 to 150)
150
113 (106 to 121)
I2=798
109 (097 to 123)
104 (100 to 109)
104 (099 to 109)
129 (105 to 158)
106 (099 to 114)
Unavailable
094 (076 to 115)
117 (105 to 131)
125 (084 to 187)
672
108 (102 to 115)
I2=636
111 (105 to 118)
104 (096 to 113)
115 (101 to 131)
107 (098 to 116)
084 (069 to 102)
Unavailable
128 (112 to 146)
100 (085 to 118)
090 (065 to 124)
154 (097 to 245)
083 (047 to 147)
109 (079 to 151)
054 (021 to 141)
107 (101 to 114)
I2=508
88
94
83
90
78
88
79
80
47
62
30
49
32
58
03
38
01
1000
121
214
209
63
180
62
130
20
03
1000
187
163
115
160
72
114
91
33
17
12
32
04
1000
Relative risk(95 CI)dagger
Weight()
Relative risk(95 CI)Dagger
124 (109 to 141)
103 (090 to 118)
110 (095 to 126)
125 (107 to 146)
108 (092 to 127)
156 (131 to 185)
107 (083 to 138)
168 (126 to 223)
127 (080 to 202)
238 (146 to 388)
079 (048 to 129)
120 (068 to 213)
516 (237 to 112)
048 (015 to 158)
902
159
19520
128 (112 to 146)
I2=727
116 (094 to 144)
120 (096 to 149)
120 (094 to 153)
148 (106 to 206)
137 (091 to 208)
Unavailable
085 (052 to 139)
200 (114 to 350)
183 (059 to 568)
6850
129 (108 to 154)
I2=501
113 (104 to 122)
108 (094 to 125)
117 (100 to 137)
114 (096 to 136)
082 (066 to 103)
Unavailable
134 (103 to 175)
100 (066 to 152)
079 (038 to 161)
260 (092 to 741)
031
326
lt01
110 (101 to 120)
I2=298
107
106
105
103
102
99
83
77
49
46
46
37
24
11
02
02
01
1000
192
191
179
139
109
89
74
23
04
1000
279
174
164
141
106
78
36
13
06
01
lt01
lt01
1000
Relative risk(95 CI)Dagger
Weight()
11 684
1437
2550
5121
506
7300
174
3229
303
999
413
170
2250
212
1054
676
175
38 253
11 684
5121
7300
413
3229
2550
174
303
170
1054
31 998
7300
11 684
5121
3229
303
2550
999
174
1054
2250
212
676
170
35 722
No ofcases
Fig 1 | Prospective associations of beverage consumption with incident type 2 diabetes random effects meta-analysis unadjusted for adiposity daggeradjusted for adiposity Daggeradjusted for adiposity and within person variation Cohorts were ordered by weights in the most adjusted model estimates with 95 confidence intervals greater than 10 are not presented supplementary table s4 summarises the covariates adjusted for in each study
doi1 020076bmjh1576 | BMJ 2015101h1576 | thethinspbmj
RESEARCH
8
type 2 diabetes risk attributable to sugar sweetened beveragesOverall sugar sweetened beverages were consumed by 544 of people in the USA and 494 in the UK Of a total population the mean consumption of sugar sweetened beverages was 284 (SD 412) gday in the USA and 114 (SD 157) gday in the UK (fig 3 and supplemen-tary table S7) Absolute event rates over 10 years from 2010 were estimated to be 110 in the USA (209 mil-lion events) and 58 in the UK (26 million events) Assuming a causal effect of consumption of sugar sweetened beverages partly mediated by obesity status
(adiposity unadjusted) consumption in the USA would result in 26 million excess events of type 2 diabetes over 10 years (population attributable fraction 119 95 confidence interval 74 to 165) and 126 000 excess events in the UK (population attributable fraction 49 30 to 72) Assuming a causal effect of consumption of sugar sweetened beverages independent of obesity status (adiposity adjusted) consumption would result in 18 million excess events in the USA (population attributable fraction 87 39 to 129) and 79 000 excess events in the UK (population attributable frac-tion 36 17 to 56) Younger adults and men would have greater numbers of type 2 diabetes events related to consumption of sugar sweetened beverages than older adults and women respectively (fig 3 and supple-mentary table S7) The greater the uncertainty accounted for the lesser the precision was computed (see supplementary figure S5) For example if I2=50 the population attributable fraction of 119 in the USA would have a 95 confidence interval of 52 to 183 but remained significant from 0 for the relative risks we estimated
discussionIn this systematic review and meta-analysis we have produced summary evidence that habitual consump-tion of sugar sweetened beverages artificially sweet-ened beverages and fruit juice was prospectively associated with incident type 2 diabetes independently of adiposity Sensitivity analyses consistently sup-ported the positive association of sugar sweetened bev-erages with incident type 2 diabetes In contrast the association between artificially sweetened beverages or fruit juice and incident type 2 diabetes was less evident For artificially sweetened beverages potential publica-tion bias and residual confounding were likely to exist For fruit juice the finding seemed to be unstable and was sensitive to study design Under assumption of cau-sality for the association of consumption of sugar sweetened beverages with incidence of type 2 diabetes we provided efficacy estimates that over 10 years two million type 2 diabetes events in the USA and 80 000 in the UK would be related to consumption of sugar sweet-ened beverages
strengths and limitations of this reviewThis study has limitations typical of observational stud-ies and meta-analysis Residual confounding could exist37 Confounding by socioeconomic and dietary factors was not detected to be strong in published stud-ies However measures of these variables were likely to involve errors such that residual confounding persisted in individual studies and our meta-analysis Addition-ally lifestyle factors and adiposity could change over time The time varying characteristics might not be ran-dom and could result in bias in an unknown direction Reverse causality could also exist because of unmea-sured comorbid conditions and health consciousness that might alter consumption of beverages particularly artificially sweetened ones and risk of type 2 diabetes Weakness of meta-analysis includes the exclusion of
Precision (1standard error)
Rela
tive
risk
Sugar sweetened beverages
0 4 8 12 1601
05
025
1
2
4
10
Precision (1standard error)
Rela
tive
risk
Fruit juice
0 10 20 30025
05
1
2
4
Precision (1standard error)
Rela
tive
risk
Articially sweetened beverages
0 2 4 6 8 1001
05
025
1
2
4
10
Eggerrsquos test P=040
Eggerrsquos test P=003
Eggerrsquos test P=069
Fig 2 | Funnel plot for associations of sugar sweetened beverages artificially sweetened beverages and fruit juice with incident type 2 diabetes Dots represent point estimates plotted over precision measures (1standard error) estimates outside each panel are not presented horizontal lines represent summary estimates and 95 confidence intervals across precision shaded areas represent any of a single estimate that if included would make the summary estimate insignificant (Pgt005) P values by eggerrsquos test are presented for fruit juice estimates with greater precision indicated stronger positive association
thethinspbmj | BMJ 2015101h1576 | doi1 020076bmjh1576
RESEARCH
9
eligible cohorts for lack of information Our meta- analysis included statistical approximation that might involve errors For example we derived dose-response esti-mates partly from categorical estimates and odds ratios Without such approximations analysis standardised across different cohorts is of future interest to character-ise associations between various beverages and risks of type 2 diabetes Finally assessments of bias and quality of evidence involved subjectivity although we objec-tively examined the influence of potential bias in tests for heterogeneity and sensitivity analyses
One strength of this study was in estimating popula-tion attributable fraction for risks of type 2 diabetes related to consumption of sugar sweetened beverages in the USA and UK using data on beverage consumption for each individual While a few studies estimated how much taxation on sugar sweetened beverages influ-enced risk of obesity and type 2 diabetes12-14 no study examined the population impact by combining esti-mates for consumption of sugar sweetened beverages in multiple populations predicted the risk of type 2 diabe-tes by using a validated algorithm or provided quanti-tative evidence on the association of consumption of sugar sweetened beverages with incidence of type 2 diabetes However the population attributable fraction was limited in precision owing to underlying relative risks and uncertainty in generalisability The other lim-itations are that we estimated the population attribut-able fraction under the assumption of causality although it has not been established and the assump-tion that there would be no change over time in lifestyle associated with consumption of sugar sweetened bever-ages Future work should seek to improve precision of evidence and to characterise efficacy and effectiveness of policy interventions for different populations Gener-alisability should be exploredmdashfor example for popu-lations in Central and South America with the highest recorded per capita sales of sugar sweetened beverages in the world and China and India where the highest
prevalence of type 2 diabetes is expected1 67 To mini-mise limitations typical of observational research and understand effectiveness of a policy intervention in dif-ferent populations future research should also include randomised trials examining peoplersquos health and behaviours and informing effectiveness
interpretation in relation to other studiesOther quantitative reviews have been published recently4 5 9 None of them quantified the population attributable fraction One meta-analysis evaluated the influence of adiposity on the association of sugar sweet-ened beverages and type 2 diabetes based on three stud-ies but not artificially sweetened beverages or fruit juice5 For sugar sweetened beverages we evaluated a greater number of type 2 diabetes cases (38 285 v 19 054) and studies (17 v 3) including bias assessments and sensitivity analyses For fruit juice and artificially sweetened beverages we evaluated a greater number of studies than previous work (9 v 4 and 12 v 4 respec-tively) and drew conclusions based on assessment of the influences of adiposity and potential bias that were found to be important
The plausibility of our findings deserves discussion Detrimental effects of sugar sweetened beverages inde-pendent of obesity may exist Sugars in sugar sweet-ened beverages acutely increased blood glucose levels and have a high glycaemic index (80 to 110100 of white bread) a risk factor for type 2 diabetes68 69 Fructose in sugar sweetened beverages promotes hepatic lipogene-sis and further insulin resistance2 Effects of caramels for colouring beverages70 caffeine49 71 phosphoric acid72 and other constituents may also exist These non-glycaemic effects may be present in artificially sweetened beverages if such beverages truly increase the risk of type 2 diabetes Artificially sweetened bever-ages might have effects on hormones microbiota and taste preference but evidence for these remains weak6 73 74 Adverse effects of fruit juice would be
United States
Suga
r sw
eete
ned
beve
rage
(gd
ay)
0
200
300
500
400
100
110
189
10 year risk for type 2 diabetes ()
No at risk (millions)
75
98
141
65
111
90
110
45
165
27
United Kingdom
Age (years)
PAF
for t
ype
2 di
abet
es
All0
10
15
25
20
5
20-44 45-64 Men Womenge65
Age (years)
All 20-44 45-64 Men Womenge65
58
45
21
21
80
15
55
21
61
23
107
9
PAF unadjusted for adiposityMean sugar sweetened beverage consumptionPAF adjusted for adiposity
Fig 3 | Consumption of sugar sweetened beverages and population attributable fraction (PaF) for type 2 diabetes in the united states and the united Kingdom Circles represent mean of consumption of sugar sweetened beverages (left axis) and each bar represents PaF () for type 2 diabetes due to consumption of sugar sweetened beverages (right axis) absolute event rates over 10 years were 110 in the usa (209 million events) and 58 in the uK (26 million events) (see supplementary table 7)
doi1 020076bmjh1576 | BMJ 2015101h1576 | thethinspbmj
RESEARCH
10
present because of its moderately high glycaemic index (50-80)68 Healthful constituents may exist but decrease during processing7 75 This explains why our finding was discordant with the inverse association of consum-ing fruits as food with type 2 diabetes76
Our analysis indicated possible publication bias for the associations between artificially sweetened bever-ages and type 2 diabetes The bias toward a false posi-tive finding would be plausible according to existing public interest over the health effects6 77 The finding at least underscores potential low quality of evidence and the need for cautious interpretation Residual confounding in the finding for artificially sweetened beverages is also plausible because adults at high risk of type 2 diabetes preferentially consumed more artifi-cially sweetened beverages5 6 8 10 11 36 Confounding in the opposite direction in the finding for fruit juice is also plausible because leaner adults at lower risk of type 2 diabetes consumed more fruit juice10 11 These observations provide research and clinical implications for better understanding of health seeking behaviours related to beverage consumption6 78
Clinical and public health implicationsAlthough causality has not been established our find-ings and available evidence indicate a benefit of reduc-ing the consumption of sugar sweetened beverages for the primary prevention of type 2 diabetes In the same context our findings also imply that consumption of artificially sweetened beverages or fruit juice is not likely to reduce the risk of type 2 diabetes and thus not suitable as a healthy option None the less the lower caloric intake of artificially sweetened beverages may be of clinical benefit in obese or overweight adults by helping to reduce body weight6 78 This effect on body weight should be considered separately from our study which could not rule out the effect of body weight on beverage consumption8 Additionally clinical applica-tions of our finding deserve further appraisal about the effects of altering beverage consumption on changes in lifestyle behaviours and on risks of other clinical outcomes3 6 8
Our findings have strong public health implications Despite the limitations of this review the current con-sumption of sugar sweetened beverages was estimated to cause approximately two million excess events of type 2 diabetes in the USA and 80 000 in the UK over 10 years This could cost nearly pound120bn in the USA and pound206m in the UK ($9800 in the USA and $3994 in the UK per patient67 $1 (pound065 euro091 as of 7 July 2015) In future our work on efficacy should be extended to that on effectiveness to identify needs for interventions In addition to observational evidence trial evidence should be available accounting for the effects on car-diometabolic health and lifestyle change associated with a possible intervention8 78 Despite a population attributable fraction of no more than 20 effectiveness should be evaluated for different populations as an estimated 592 million adults globally will have type 2 diabetes in 20351 67 Additionally the average popula-tion attributable fraction of no more than 20 confirms
the importance of modifying multiple lifestyle risk fac-tors rather than a single dietary component for the pri-mary prevention of type 2 diabetes For artificially sweetened beverages and fruit juice our findings inform little benefit of using them as an alternative to sugar sweetened beverages In addition fruit juice con-sumption should not be a part of dietary recommenda-tions for greater consumption of fruits and vegetables as suggested to limit fruit juice consumption among children7 79
ConclusionsObservational cohort studies support that consumption of sugar sweetened beverages is associated with inci-dent type 2 diabetes and independently of adiposity This finding was stable in sensitivity analyses assessing influence of population characteristics potential resid-ual confounding and publication bias By contrast although artificially sweetened beverages and fruit juice showed a positive association with incident type 2 diabetes the quality of evidence is limited by potential bias and heterogeneity by study design Although cau-sality has not been established and precision needs to be improved this study informs the potential efficacy of reducing the consumption of sugar sweetened bever-ages in a contemporary population Moreover findings support that neither artificially sweetened beverages nor fruit juice are suitable alternatives to sugar sweet-ened beverages for the prevention of type 2 diabetes The following contributors provided additional information Emilie Rossignol Guy Fagherazzi Franccediloise Clavel-Chapelon and Beverley Balkau Center for Research in Epidemiology and Population Health Villejuif Cedex France Tomonori Okamura Department of Preventive Medicine and Public Health Keio University School of Medicine Tokyo Japan and Hirotsugu Ueshima Department of Health Science and Center for Epidemiologic Research in Asia Sari Voutilainen Institute of Public Health and Clinical Nutrition Kuopio Finland Frank B Hu Harvard T H Chan School of Public Health Boston Massachusetts USA Manabu Sakurai Department of Epidemiology and Public Health Kanazawa Medical University Uchinada Ishikawa Japan Paul F Jacques Nicola M McKeown and Ma Jiantao Human Nutrition Research Center on Aging Tufts University Boston Massachusetts USAContributors FI and NGF conceived the study FI LOrsquoC YZ and NGF designed the study FI LOrsquoC and YZ undertook the literature search and extracted data FI JM YH and SNB did data analysis FI LOrsquoC YZ and NGF interpreted data FI developed the first draft FI as guarantor accepts full responsibility for the work and the conduct of the study had access to the data and controlled the decision to publish All authors provided critical comments and approved the final version The sponsor of the study had no role in design and conduct of the study collection management analysis and interpretation of the data preparation review or approval of the manuscript and decision to submit the manuscript for publication The corresponding author had full access to all the data in the study and had final responsibility for the decision to submit for publication Funding This study was funded by the Medical Research Council Epidemiology Unit Core Support (MC_UU_120155) SNB was supported by an American Heart Association postdoctoral fellowship grant (13POST14370012) Competing interests All authors have completed the ICMJE uniform disclosure form at wwwicmjeorgcoi_disclosurepdf and declare no support from any organisation for the submitted work no financial relationships with any organisations that might have an interest in the submitted work in the previous three years no other relationships or activities that could appear to have influenced the submitted workEthical approval Not requiredData sharing A protocol and data for tables and figures are available on request
thethinspbmj | BMJ 2015101h1576 | doi1 020076bmjh1576
RESEARCH
11
Transparency The guarantor (FI) affirms that the manuscript is an honest accurate and transparent account of the study being reported that no important aspects of the study have been omitted and that any discrepancies from the study as planned have been explained as post hoc analysis Data sharing is available from the corresponding author
This is an Open Access article distributed in accordance with the terms of the Creative Commons Attribution (CC BY 40) license which permits others to distribute remix adapt and build upon this work for commercial use provided the original work is properly cited See httpcreativecommonsorglicensesby40
1 Basu S McKee M Galea G Stuckler D Relationship of soft drink consumption to global overweight obesity and diabetes a cross-national analysis of 75 countries Am J Public Health 20131032071-7
2 Stanhope KL Role of fructose-containing sugars in the epidemics of obesity and metabolic syndrome Annu Rev Med 201263329-43
3 Weed DL Althuis MD Mink PJ Quality of reviews on sugar-sweetened beverages and health outcomes a systematic review Am J Clin Nutr 2011941340-7
4 Malik VS Popkin BM Bray GA et al Sugar-sweetened beverages and risk of metabolic syndrome and type 2 diabetes a meta-analysis Diabetes Care 2010332477-83
5 Greenwood DC Threapleton DE Evans CEL et al Association between sugar-sweetened and artificially sweetened soft drinks and type 2 diabetes systematic review and dose-response meta-analysis of prospective studies Br J Nutr 2014112725-34
6 Gardner C Wylie-Rosett J Gidding SS et al Nonnutritive sweeteners current use and health perspectives a scientific statement from the American Heart Association and the American Diabetes Association Circulation 2012126509-19
7 Slavin JL Lloyd B Health benefits of fruits and vegetables Adv Nutr 20123506-16
8 Malik VS Popkin BM Bray GA Despreacutes J-P Hu FB Sugar-sweetened beverages obesity type 2 diabetes mellitus and cardiovascular disease risk Circulation 20101211356-64
9 Xi B Li S Liu Z et al Intake of fruit juice and incidence of type 2 diabetes a systematic review and meta-analysis PloS One 20149e93471
10 Bleich SN Wolfson JA Vine S Wang YC Diet-beverage consumption and caloric intake among US adults overall and by body weight Am J Public Health 2014104e72-8
11 The InterAct Consortium Consumption of sweet beverages and type 2 diabetes incidence in European adults results from EPIC-InterAct Diabetologia 2013561520-30
12 Basu S Vellakkal S Agrawal S Stuckler D Popkin B Ebrahim S Averting obesity and type 2 diabetes in India through sugar-sweetened beverage taxation an economic-epidemiologic modeling study PLoS Med 201411e1001582
13 Brownell KD Farley T Willett WC et al The public health and economic benefits of taxing sugar-sweetened beverages N Engl J Med 20093611599-605
14 Briggs ADM Mytton OT Kehlbacher A Tiffin R Rayner M Scarborough P Overall and income specific effect on prevalence of overweight and obesity of 20 sugar sweetened drink tax in UK econometric and comparative risk assessment modelling study BMJ 2013347f6189
15 Liberati A Altman DG Tetzlaff J et al The PRISMA statement for reporting systematic reviews and meta-analyses of studies that evaluate healthcare interventions explanation and elaboration BMJ 2009339b2700
16 The Diabetes Prevention Program Research Group Diabetes Prevention Program Research Group Knowler WC et al Reduction in the incidence of type 2 diabetes with lifestyle intervention or metformin N Engl J Med 2002346393-403
17 Franco M Bilal U Orduntildeez P et al Population-wide weight loss and regain in relation to diabetes burden and cardiovascular mortality in Cuba 1980-2010 repeated cross sectional surveys and ecological comparison of secular trends BMJ 2013346f1515
18 Willett WC Howe GR Kushi LH Adjustment for total energy intake in epidemiologic studies Am J Clin Nutr 1997651220S-8S discussion 1229S-31S
19 Higgins JP Altman DG Gotzsche PC et al The Cochrane Collaborationrsquos tool for assessing risk of bias in randomised trials BMJ 2011343d5928
20 Sterne JA Higgins JP Reeves BC on behalf of the development group for ACROBAT-NRSI A A Cochrane risk of bias assessment tool for non-randomized studies of interventions version 100 September 2014 2014 wwwriskofbiasinfo
21 Higgins J Assessing risk of bias in included studies In Higgins J Green S eds Cochrane handbook for systematic reviews of interventions Cochrane Collaboration 20081-50
22 Schuumlnemann H Brożek J Oxman GGA Handbook for grading the quality of evidence and the strength of recommendations using the GRADE approach 2013 wwwguidelinedevelopmentorghandbook
23 Zhang J Yu KF Whatrsquos the relative risk A method of correcting the odds ratio in cohort studies of common outcomes JAMA 19982801690
24 Greenland S Longnecker MP Methods for trend estimation from summarized dose-response data with applications to meta-analysis Am J Epidemiol 19921351301-9
25 Higgins JP Thompson SG Quantifying heterogeneity in a meta-analysis Stat Med 2002211539-58
26 Walter WC Correction for the effects of measurement error In Willett WC ed Nutritional epidemiology 3rd ed Oxford University Press 2012
27 MacMahon S Peto R Cutler J et al Blood pressure stroke and coronary heart disease Part 1 prolonged differences in blood pressure prospective observational studies corrected for the regression dilution bias Lancet 1990335765-74
28 Carroll RJ Stefanski LA Measurement error instrumental variables and corrections for attenuation with applications to meta-analyses Stat Med 1994131265-82
29 Prospective Studies Collaboration Blood cholesterol and vascular mortality by age sex and blood pressure a meta-analysis of individual data from 61 prospective studies with 55 000 vascular deaths Lancet 20073701829-39
30 Di Angelantonio E Sarwar N Perry P et al Major lipids apolipoproteins and risk of vascular disease JAMA 20093021993-2000
31 Hunter DJ Spiegelman D Adami HO et al Cohort studies of fat intake and the risk of breast cancer--a pooled analysis N Engl J Med 1996334356-61
32 Greenland S Quantitative methods in the review of epidemiologic literature Epidemiol Rev 198791-30
33 Brenner H Gefeller O Use of the positive predictive value to correct for disease misclassification in epidemiologic studies Am J Epidemiol 19931381007-15
34 Jonathan E Sterne AC Egger M Moher D Bias C Addressing reporting biases In Higgins J Green S eds Cochrane handbook for systematic reviews of interventions Cochrane Collaboration 20081-33
35 Lash TL Fink AK Semi-automated sensitivity analysis to assess systematic errors in observational data Epidemiology 200314 451-8
36 Sun Q van Dam RM Spiegelman D Heymsfield SB Willett WC Hu FB Comparison of dual-energy x-ray absorptiometric and anthropometric measures of adiposity in relation to adiposity-related biologic factors Am J Epidemiol 20101721442-54
37 Smith GD Phillips AN Inflation in epidemiology ldquothe proof and measurement of association between two thingsrdquo revisited BMJ 19963121659-61
38 Bray GA Energy and fructose from beverages sweetened with sugar or high-fructose corn syrup pose a health risk for some people Adv Nutr 20134220-5
39 Nettleton JA Lutsey PL Wang Y et al Diet soda intake and risk of incident metabolic syndrome and type 2 diabetes in the Multi-Ethnic Study of Atherosclerosis (MESA) Diabetes Care 200932688-9440
40 Fagherazzi G Vilier A Saes Sartorelli D Lajous M Balkau B Clavel-Chapelon F Consumption of artificially and sugar-sweetened beverages and incident type 2 diabetes in the Etude Epidemiologique aupres des femmes de la Mutuelle Generale de lrsquoEducation Nationale-European Prospective Investigation into Cancer and Nutrition cohort Am J Clin Nutr 201397517-23
41 Muraki I Imamura F Manson JE et al Fruit consumption and risk of type 2 diabetes results from three prospective longitudinal cohort studies BMJ 2013347f5001
42 Cook JR Stefanski LA Simulation-extrapolation estimation in parametric measurement error models J Am Stat Assoc 1994891314-28
43 Greenland S Estimation of population attributable fractions from fitted incidence ratios and exposure survey data with an application to electromagnetic fields and childhood leukemia Biometrics 200157182-8
44 Schuumlnemann AHJ Oxman AD Vist GE Higgins JPT Jonathan J Interpreting results and drawing conclusions In Higgins J Green S eds Cochrane Handbook for Systematic Reviews of Interventions Cochrane Collaboration 20081-24
45 National Center for Health Statistics National Health and Nutrition Examination Survey NHANES (2009-2010) 2005 wwwcdcgovnchsnhaneshtm
46 Public Health England and Food Standards Agency National Diet and Nutrition Survey results from years 1 to 4 (combined) of the rolling programme for 2008 and 2009 to 2011 and 2012 2014 wwwgovukgovernmentpublicationsnational-diet-and-nutrition-survey- results-from-years-1-to-4-combined-of-the-rolling-programme-for-2008-and-2009-to-2011-and-2012
47 Hippisley-Cox J Coupland C Robson J Sheikh A Brindle P Predicting risk of type 2 diabetes in England and Wales prospective derivation and validation of QDScore BMJ 2009338b880
48 Schmidt MI Duncan BB Bang H et al Identifying individuals at high risk for diabetes the Atherosclerosis Risk in Communities study Diabetes Care 2005282013-8
RESEARCH
No commercial reuse See rights and reprints httpwwwbmjcompermissions Subscribe httpwwwbmjcomsubscribe
49 Bhupathiraju SN Pan A Malik VS et al Caffeinated and caffeine- free beverages and risk of type 2 diabetes Am J Clin Nutr 2013 97155-66
50 De Koning L Malik VS Rimm EB Willett WC Hu FB Sugar-sweetened and artificially sweetened beverage consumption and risk of type 2 diabetes in men Am J Clin Nutr 2011931321-7
51 Bazzano LA Li TY Joshipura KJ Hu FB Intake of fruit vegetables and fruit juices and risk of diabetes in women Diabetes Care 2008311311-7
52 Eshak ES Iso H Mizoue T Inoue M Noda M Tsugane S Soft drink 100 fruit juice and vegetable juice intakes and risk of diabetes mellitus Clin Nutr 201332300-8
53 Montonen J Jarvinen R Knekt P Heliovaara M Reunanen A Consumption of sweetened beverages and intakes of fructose and glucose predict type 2 diabetes occurrence J Nutr 20071371447-54
54 Mursu J Virtanen JK Tuomainen T-P Nurmi T Voutilainen S Intake of fruit berries and vegetables and risk of type 2 diabetes in Finnish men the Kuopio Ischaemic Heart Disease Risk Factor Study Am J Clin Nutr 201499328-33
55 Duffey KJ Gordon-Larsen P Steffen LM et al Drinking caloric beverages increases the risk of adverse cardiometabolic outcomes in the Coronary Artery Risk Development in Young Adults (CARDIA) Study Am J Clin Nutr 201092954-9
56 Duffey KJ Steffen LM Van Horn L Jacobs DR Popkin BM Dietary patterns matter diet beverages and cardiometabolic risks in the longitudinal Coronary Artery Risk Development in Young Adults (CARDIA) Study Am J Clin Nutr 201295909-15
57 Odegaard AO Koh W-PP Arakawa K Yu MC Pereira MA Soft drink and juice consumption and risk of physician-diagnosed incident type 2 diabetes the Singapore Chinese Health Study Am J Epidemiol 2010171701-8
58 Palmer JR Boggs DA Krishnan S Hu FB Singer M Rosenberg L Sugar-sweetened beverages and incidence of type 2 diabetes mellitus in African American women Arch Intern Med 2008168 1487-92
59 Sakurai M Nakamura K Miura K et al Sugar-sweetened beverage and diet soda consumption and the 7-year risk for type 2 diabetes mellitus in middle-aged Japanese men Eur J Nutr 201453251-8
60 Schulze MB Manson JE Ludwig DS et al Sugar-sweetened beverages weight gain and incidence of type 2 diabetes in young and middle-aged women JAMA 2004292927-34
61 Pan A Malik VS Schulze MB Manson JE Willett WC Hu FB Plain-water intake and risk of type 2 diabetes in young and middle-aged women Am J Clin Nutr 2012951454-60
62 Pereira MA Parker ED Folsom AR Intake of sugar sweetened beverages fruit juice and incidence of type 2 diabetes A prospective study of postmenopausal women Diabetes 200554A258
63 Hayashino Y Fukuhara S Okamura T et al A prospective study of passive smoking and risk of diabetes in a cohort of workers the High-Risk and Population Strategy for Occupational Health Promotion (HIPOP-OHP) study Diabetes Care 200831732-4
64 Paynter NP Yeh H-CC Voutilainen S et al Coffee and sweetened beverage consumption and the risk of type 2 diabetes mellitus the atherosclerosis risk in communities study Am J Epidemiol 20061641075-84
65 Dhingra R Sullivan L Jacques PF et al Soft drink consumption and risk of developing cardiometabolic risk factors and the metabolic syndrome in middle-aged adults in the community Circulation 2007116480-8
66 Duffey KJ Steffen LM Van Horn L Jacobs DR Jr Popkin BM Dietary patterns matter diet beverages and cardiometabolic risks in the longitudinal Coronary Artery Risk Development in Young Adults (CARDIA) Study Am J Clin Nutr 201295909-15
67 International Diabetes Federatoin The Global Burden In IDF diabetes atlas 6th ed IDF 201329-49
68 Atkinson FS Foster-Powell K Brand-Miller JC International tables of glycemic index and glycemic load values 2008 Diabetes Care 2008312281-3
69 Livesey G Taylor R Livesey H Liu S Is there a dose-response relation of dietary glycemic load to risk of type 2 diabetes Meta-analysis of prospective cohort studies Am J Clin Nutr 201397584-96
70 Kellow NJ Savige GS Dietary advanced glycation end-product restriction for the attenuation of insulin resistance oxidative stress and endothelial dysfunction a systematic review Eur J Clin Nutr 201367239-48
71 Jiang X Zhang D Jiang W Coffee and caffeine intake and incidence of type 2 diabetes mellitus a meta-analysis of prospective studies Eur J Nutr 20145325-38
72 Fitzpatrick L Heaney RP Got soda J Bone Miner Metab 2003181570-2
73 Pepino MY Bourne C Non-nutritive sweeteners energy balance and glucose homeostasis Curr Opin Clin Nutr Metab Care 201114 391-5
74 Suez J Korem T Zeevi D et al Artificial sweeteners induce glucose intolerance by altering the gut microbiota Nature 2014514181-6
75 Crowe KM Murray E Deconstructing a fruit serving comparing the antioxidant density of select whole fruit and 100 fruit juices J Acad Nutr Diet 20131131354-8
76 Cooper AJ Forouhi NG Ye Z et al Fruit and vegetable intake and type 2 diabetes EPIC-InterAct prospective study and meta-analysis Eur J Clin Nutr 2012661082-92
77 De la Pentildea C Artificial sweetener as a historical window to culturally situated health Ann N Y Acad Sci 20101190159-65
78 Piernas C Tate DF Wang X Popkin BM Does diet-beverage intake affect dietary consumption patterns Results from the Choose Healthy Options Consciously Everyday (CHOICE) randomized clinical trial Am J Clin Nutr 201397604-11
79 Wojcicki JM Heyman MB Reducing childhood obesity by eliminating 100 fruit juice Am J Public Health 20121021630-3
copy BMJ Publishing Group Ltd 2015
Appendix supplementary material
doi1 020076bmjh1576 | BMJ 2015101h1576 | thethinspbmj
RESEARCH
4
each country47 48 The predicted risk for each individ-ual was considered as an ldquoassumed control riskrdquo44 if the current consumption of sugar sweetened bever-ages would remain constant Then we calculated an alternative risk if the consumption of sugar sweetened beverages would become zero calculating assumed control risktimes(1relative risk per servingday)timesobserved sugar sweetened beverages servingsday The differ-ence between the two risk estimates represented a risk attributable to consumption of sugar sweetened bever-ages Using the risk estimates sampling weights and a population size we estimated the absolute numbers of events over 10 years events attributable to con-sumption of sugar sweetened beverages (absolute risk reduction44) and population attributable fraction (the proportion of events attributable to consumption of sugar sweetened beverages) The estimation assumed causality and no change in individualsrsquo characteris-tics over time Validation of 10 year risk prediction was performed in the US survey in which we pre-dicted diabetes prevalence in 2009-10 by using data collected in 1999-2000 Sensitivity analysis was per-formed to estimate the population attributable frac-tion by varying relative risks and accounting for uncertainty Further details are presented in the sup-plementary information
ResultsAfter the removal of duplicates we identified 1937 arti-cles reviewed 33 in full text and identified 21 articles of 16 cohorts as being eligible for this meta-analysis (see supplementary figure S1) We obtained unpublished information on one cohort from a publication that did not meet eligibility criteria (see supplementary table S1)22 Finally we evaluated data from 17 cohorts (table 1 )11 39-41 49-65 comprising 38 253 cases of type 2 dia-betes over 10 126 756 person years in total No study or publication was funded by industry
The quality of the studies has been examined (see supplementary table S2) Methods of assessing diets and ascertaining type 2 diabetes and validity of these measurements varied across studies (table 1 and sup-plementary table S3) We identified potential bias in the quantitative results for six cohorts based on at least one of the following publication of a conference abstract only62 exclusion of participants lost during follow-up57 63 likelihood of substantial residual con-founding40 and no separation between fruit juice and sugar sweetened beverages (fruit drinks) or between sugar sweetened beverages and artificially sweetened beverages57 64 Selective reporting might exist in some studies39 52 55 58 62 64 but it was unlikely to cause biasmdashfor example reporting only non-quan-titative results for sugar sweetened beverages in a study mainly on artificially sweetened beverages39 Other potential sources of bias were detected but we did not consider them to be substantially influential on overall bias in each study partly based on results of sensitivity analyses No study assessed subtypes of sugar sweetened beverages artificially sweetened
beverages or fruit juice except one that separated beverages by caffeine content49
Confounding was likely to exist in all of the studies As would be expected consumers of artificially sweet-ened beverages tended to be overweight or obese or hypertensive11 39 50 59 66 In longitudinal analysis all studies statistically adjusted for potential confounders such as sociodemographic variables clinical factors (family history of diabetes or prevalent diseases) and lifestyle factors including diet (see supplementary table S4) None of these factors was identified as a single cause of confounding according to studies assessing influence of potential confounding in differ-ent regression models11 41 49-51 54 59 61 63-65 However a com-bination of multiple factors was likely to cause confounding (table 2 and supplementary table S4) After adjustment for multiple potential confounders the relative risk for sugar sweetened beverages was attenuated from 125 to 118 (32 change) and for artifi-cially sweetened beverages from 148 to 125 (43) By contrast the point estimate for fruit juice was shifted upwards from 097 to 105
beverage consumption and type 2 diabetesTable 2 summarises the findings from meta-analysis Higher consumption of sugar sweetened beverages by one serving per day was associated with an 18 greater incidence of type 2 diabetes (95 confidence interval 88 to 28 I2=89) before adjustment for adiposity (fig 1 and table 2) When adjusted for potential media-tion and confounding by adiposity the association was attenuated with the incidence increased by 13 per servingday (58 to 21 I2=79) In the analysis of artificially sweetened beverages in which adiposity was unlikely to be a mediator higher consumption of artificially sweetened beverages by one serving per day was associated with a 25 greater incidence of type 2 diabetes (95 confidence interval 18 to 33 I2=70) before adjustment for adiposity After adjustment the estimate of 25 greater incidence was attenuated to 8 (21 to 15)
In the analysis of fruit juice the influence of adjust-ment for adiposity was in the direction opposite to that of the analysis for sugar sweetened beverages and arti-ficially sweetened beverages The association of fruit juice consumption with incident type 2 diabetes was strengthened after adjustment for adiposity measures Higher consumption of fruit juice by one servingday was associated with a 7 greater incidence of type 2 diabetes (95 confidence interval 08 to 14)
Each of the beverages showed significant non-linear associations (Pgt005) (supplementary figure S2) Cali-bration for within person variation strengthened the association between each type of beverage and incident type 2 diabetes (fig 1 and table 2) For example the rela-tive risk per one servingday of sugar sweetened bever-ages was strengthened from 113 (95 confidence interval 106 to 121) to 128 (112 to 146) Estimates for artificially sweetened beverages were strengthened similarly The influence was small for fruit juice where
thethinspbmj | BMJ 2015101h1576 | doi1 020076bmjh1576
RESEARCH
5
tabl
e 1 |
Cha
ract
eris
tics o
f pro
spec
tive
coho
rt st
udie
s inc
lude
d in
met
a-an
alys
is o
n as
soci
atio
ns b
etw
een
cons
umpt
ion
of su
gar s
wee
tene
d be
vera
ges
art
ifici
ally
swee
tene
d be
vera
ges
and
frui
t ju
ice
and
inci
denc
e of
type
2 d
iabe
tes
Coho
rt c
ount
ry
base
line
year
s
med
ian
follo
w-u
p (y
ears
)no
age
rang
e or
mea
n ag
e (y
ears
)m
en
()
mea
n bm
i
beve
rage
con
sum
ptio
ndaggerin
cide
nt ty
pe 2
dia
bete
sDaggerm
etho
d of
as
sess
men
tty
pes
met
hod
of a
scer
tain
men
tno
of c
ases
(r
ate
1000
)DaggerFM
CHES
Fin
land
5319
66-7
213
743
0440
-69
531
265
Diet
his
tory
SSB
Reco
rds
175
(30
)NH
S I
USA41
51
1984
211
74 5
1340
-69
023
6FF
Qdagger
SSB
ASB
FJ
Self
repo
rt73
00 (4
6)Dagger
KIHD
Fin
land
5419
84-8
918
924
8142
-60
100
268
4 da
y die
t rec
ord
SSBsect
Reco
rds
bio
mar
kers
506
(10
8)CA
RDIA
USA
55 5
6 para19
85-8
618
821
6018
-30
465
245
Diet
his
tory
daggerSS
B A
SB F
JSe
lf re
port
rec
ords
bio
mar
kers
174
(43
)DaggerHP
FS U
SA41
49
5019
8619
340
290
40-7
510
025
5FF
Qdagger
SSB
ASB
FJ
Self
repo
rt32
29 (4
2)Dagger
Iow
a W
HS U
SA62
para19
8610
731
489
55-6
90
270
FFQ
SSB
FJ
Self
repo
rt99
9 (3
0)Dagger
ARIC
men
USA
64
1987
-89
7554
1445
-64
100
272
FFQ
SSBDagger
Self
repo
rt b
iom
arke
rs71
8 (1
77)
ARIC
wom
en U
SA64
19
87-8
977
6790
45-6
40
272
FFQ
SSBDagger
Self
repo
rt b
iom
arke
rs71
9 (1
38)
JPHC
men
Jap
an52
para19
909
812
137
40-5
910
023
5FF
Qdagger
SSB
FJ
Self
repo
rt39
7 (3
3)Dagger
JPHC
wom
en J
apan
52para
1990
99
15 4
4840
-59
023
5FF
Qdagger
SSB
FJ
Self
repo
rt27
9 (1
8)Dagger
FOS
USA
6519
9112
127
3654
245
526
7FF
Qdagger
SSB
ASB
FJ
Reco
rds
sel
f rep
ort
biom
arke
rs30
3 (9
1)NH
S II
USA
41 6
0 61
1991
184
90 4
2324
-44
024
4FF
Qdagger
SSB
ASB
FJ
Self
repo
rt51
21 (3
1)Dagger
EPIC
-Inte
rAct
eig
ht E
urop
ean
coun
tries
1119
91-9
811
727
058
524
378
260
FFQ
SSB
ASB
FJ
Reco
rds
bio
mar
kers
Dagger11
684
(29
)E3
N Fr
ance
40para
1993
124
48 9
8552
80
228
Diet
his
tory
SSB
ASB
FJ
Reco
rds
1054
(17
)SC
HS S
inga
pore
57para
1993
-98
57
43 5
8045
-74
429
230
FFQ
SSB
FJ
Self
repo
rt r
ecor
ds b
iom
arke
rs22
50 (9
0)Dagger
Blac
k W
HS U
SA58
1995
7743
960
21-6
90
276
FFQ
SSB
ASB
FJ
Self
repo
rt25
50 (7
5)Dagger
HIPO
P-OH
P Ja
pan63
para19
993
461
2119
-69
789
226
FFQ
SSB
FJ
Self
repo
rt r
ecor
ds b
iom
arke
rs21
2 (1
02)
MES
A U
SA39
2000
-02
58
5011
45-8
447
427
9FF
QSS
B A
SBSe
lf re
port
rec
ords
bio
mar
kers
413
(14
3)Oc
cupa
tiona
l coh
ort
Japa
n5920
035
520
3735
-55
100
233
FFQ
SSB
ASB
FJ
Reco
rds
bio
mar
kers
170
(151
)AS
B=ar
tifici
ally
sw
eete
ned
beve
rage
s A
RIC=
Athe
rosc
lero
sis R
isk
in C
omm
uniti
es S
tudy
CAR
DIA=
Coro
nary
Arte
ry R
isk
Deve
lopm
ent i
n Yo
ung
Adul
ts S
tudy
EPI
C=Eu
rope
an P
rosp
ectiv
e In
vest
igat
ion
into
Can
cer a
nd N
utrit
ion
Stud
y F
FQ=f
ood
frequ
ency
que
stio
nnai
res
FJ=
fruit
juic
e F
MCH
ES=F
inni
sh M
obile
Clin
ic H
ealth
Exa
min
atio
n Su
rvey
FOS
=Fra
min
gham
Offs
prin
g St
udy
HIP
OP-
OHP
=Hig
h-ris
k an
d Po
pula
tion
Stra
tegy
for O
ccup
atio
nal H
ealth
Pro
mot
ion
Stud
y H
PFS=
Heal
th
Prof
essi
onal
Fol
low
-up
Stud
y JP
HC=J
apan
Pub
lic H
ealth
Cen
ter-b
ased
Pro
spec
tive
Stud
y K
IHD=
Kuop
io Is
chae
mic
Hea
rt Di
seas
e Ri
sk Fa
ctor
Stu
dy M
ESA=
Mul
ti-Et
hnic
Stu
dy o
f Ath
eros
cler
osis
NHS
=Nur
sesrsquo
Heal
th S
tudy
SCH
S=Si
ngap
ore
Chin
ese
Heal
th S
tudy
SSB
=sug
ar s
wee
tene
d be
vera
ges
WHS
=Wom
enrsquos
Heal
th S
tudy
O
rder
ed in
yea
rs o
f bas
elin
e as
sess
men
ts N
umbe
rs re
pres
ent c
itatio
ns A
RIC
and
JPHS
repo
rted
resu
lts s
tratifi
ed b
y sex
In
met
a-an
alys
is s
ex s
tratifi
ed e
stim
ates
wer
e ag
greg
ated
in a
dvan
ce
daggerDie
ts w
ere
asse
ssed
repe
ated
ly d
urin
g fo
llow
-up
and
inco
rpor
ated
in lo
ngitu
dina
l ana
lysi
s JP
HC m
easu
red
repe
ated
ly b
ut u
sed
base
line
FFQ
only
DaggerB
iom
arke
rs in
clud
ed a
ny o
f fas
ting
gluc
ose
two
hour
glu
cose
by o
ral g
luco
se to
lera
nce
test
and
gly
cate
d ha
emog
lobi
n R
ecor
ds in
clud
ed m
edic
al re
cord
s or o
ther
reco
rds f
rom
regi
stry
not
incl
udin
g se
lf re
porte
d in
form
atio
n S
tudi
es a
scer
tain
ing
case
s of t
ype
2 di
abet
es b
y sel
f rep
ort i
nvol
ved
unce
rtai
nty i
n as
cert
ainm
ent
and
thus
num
bers
of c
ases
wer
e re
vise
d by
a p
ositi
ve p
redi
ctiv
e va
lue
(pro
port
ion
of v
erifi
ed c
ases
am
ong
self
repo
rted
case
s) (s
ee su
pple
men
tary
info
rmat
ion
and
tabl
e S3
) Th
e EP
IC-In
terA
ct s
tudy
ado
pted
diff
eren
t met
hods
acr
oss p
artic
ipat
ing
coho
rts
in w
hich
no
coho
rt us
ed s
elf r
epor
ted
diag
nosi
s onl
ysectI
n AR
IC a
nd F
OS a
naly
ses
sug
ar s
wee
tene
d an
d ar
tifici
ally
sw
eete
ned
beve
rage
s wer
e co
mbi
ned
In K
IHD
the
artic
le d
escr
ibed
frui
t jui
ces
but
trea
ted
them
as s
ugar
sw
eete
ned
beve
rage
s b
ecau
se m
ore
than
90
of f
ruit
juic
e co
nsum
ed in
Fin
land
in
1980
s and
1990
s was
sw
eete
ned
with
sug
ars (
confi
rmed
by t
he a
utho
rs)
paraCon
side
red
as h
avin
g po
tent
ial b
ias (
see
supp
lem
enta
ry in
form
atio
n an
d ta
ble
S2)
In e
ach
of C
ARDI
A an
d JP
HC d
istin
ct a
naly
tic a
ppro
ache
s wer
e un
dert
aken
in d
iffer
ent p
ublic
atio
ns b
y the
sam
e au
thor
s Io
wa
WHS
repo
rted
resu
lts o
nly i
n a
conf
eren
ce a
bstra
ct E
3N p
rese
nted
pro
spec
tive
asso
ciat
ions
adj
uste
d fo
r cru
de c
ateg
oric
al v
aria
bles
for b
ody m
ass i
ndex
whi
ch c
ould
cau
se s
ubst
antia
l res
idua
l con
foun
ding
SCH
S pr
esen
ted
resu
lts w
ithou
t cla
ssifi
catio
n be
twee
n 10
0 fr
uit j
uice
an
d su
gar s
wee
tene
d fru
it ju
ice
and
had
a lik
elih
ood
of a
ttriti
on b
ias b
y los
s of f
ollo
w-u
p by
dea
ths (
15
) HI
POP-
OHP
lost
31
of p
artic
ipan
ts d
urin
g fo
llow
-up
whi
ch c
ould
cau
se b
ias d
ue to
diff
eren
tial m
iscl
assi
ficat
ion
doi1 020076bmjh1576 | BMJ 2015101h1576 | thethinspbmj
RESEARCH
6
the relative risk was shifted only slightly from 107 (101 to 114) to 110 (101 to 120)
sensitivity analysis and quality of evidenceNone of the study specific factors evaluated could explain heterogeneity of results for sugar sweetened beverages and artificially sweetened beverages (Pgt01) (see supplementary table S5) Exploratory meta- regression produced an I2 of 234 for sugar sweet-ened beverages and of 678 for artificially sweetened beverages adjusted for population demographics (age sex country incidence) body mass index fol-low-up duration and measures of study quality The results for fruit juice varied by study design While studies assessing self reported type 2 diabetes only showed a positive association the significant associa-tion disappeared in studies ascertaining the incidence of type 2 diabetes by medical records or by blood glu-cose or glycated haemoglobin level (relative risk 108 097 to 120 P for heterogeneity=0008) Additionally studies with repeated measures of diets supported a null finding (098 086 to 111 P for heterogene-ity=0068) These factors of study design explained heterogeneity of the association reducing I2 from 29 to 0 Demographic variables and body mass index did not explain heterogeneity (Pgt014 each) whereas sugar sweetened beverages artificially sweetened beverages and fruit juice were not significantly asso-ciated with type 2 diabetes in studies recruiting more men than women or conducted in Asia with a fewer number of studies than in the main analysis (supple-mentary table S5)
Publication bias was not evident by Eggerrsquos test (Pgt005) except for fruit juice (P=003) where esti-mates with the greater precision showed stronger asso-ciations (fig 2) Trim and fill indicated publication bias for both sugar sweetened and artificially sweetened
beverages (table 2) In particular publication bias could influence inference for artificially sweetened beverages With adjustment for adiposity the relative risk per one servingday of artificially sweetened bev-erages was 129 (108 to 154) before calibration for publication bias and 122 (098 to 152) after calibration (table 2)
Contour enhanced funnel plots indicated that the findings for artificially sweetened beverages and fruit juice were not stable (fig 2) For example if a study with a relative risk of 05 contributed to the meta-analysis associations of artificially sweetened beverages and fruit juice with type 2 diabetes incidence would not be significant In influence analysis positive associations persisted for sugar sweetened beverages and artificially sweetened beverages (see supplementary figure S3) whereas a significant result of fruit juice was not seen after excluding any single studies supporting the posi-tive association
The results varied little by methodological assump-tion (see supplementary table S6) using estimates per 250 mLday (median of 17 studies) rather than per servingday excluding studies with a high risk of potential bias or with relatively large within person dietary variability and incorporating uncertainty of within person variability and precision of type 2 diabe-tes diagnosis When we examined the potential influ-ence of residual confounding by measured adiposity bias towards the null appeared substantial for artifi-cially sweetened beverages (see supplementary figure S4) Under a realistic assumption of a correlation of 080 between measured and true adiposity36 the asso-ciation for sugar sweetened beverages was attenuated by 26 (relative risk 120 104 to 138) for artificially sweetened beverages was attenuated by 96 (101 081 to 125) and for fruit juice was strengthened by 19 (112 103 to 122)
table 2 | associations between consumption of sugar sweetened beverages artificially sweetened beverages and fruit juice and incident type 2 diabetes meta-analysis of prospective cohort studies
beverages (no of cohorts) and models of meta-analysis
not adjusted for adipositydagger adjusted for adipositydaggerrelative risk (95 Ci) i2 () relative risk (95 Ci) i2 ()
sugar sweetened beverages (n=17)Meta-analysis crude 125 (114 to 137) 89 mdash mdash +multivariable adjusted 118 (109 to 128) 89 113 (106 to 121) 79 +calibration for information bias 143 (120 to 170) 86 128 (112 to 146) 73 +calibration for publication bias 142 (119 to 169) 85 127 (110 to 146) 73artificially sweetened beverages (n=10)Meta-analysis crude 148 (135 to 162) 85 mdash mdash +multivariable adjusted 125 (118 to 133) 70 108 (102 to 115) 64 +calibration for information bias 213 (157 to 288) 72 129 (108 to 154) 50 +calibration for publication bias 181 (133 to 247) 76 122 (098 to 152) 64Fruit juices (n=13)Meta-analysis crude 097 (090 to 106) 79 mdash +multivariable adjusted 105 (099 to 111) 58 107 (101 to 114) 51 +calibration for information bias 106 (098 to 114) 49 110 (101 to 120) 29 +calibration for publication bias Not detected mdash Not detected mdashNumber of cohorts varied slightly by models (see fig 1) Crude meta-analysis pooled estimates without any adjustment Multivariable adjusted estimates were based on meta-analysis of estimates adjusted for demographic and lifestyle covariates (see supplementary table S4 for details) Calibration for information bias accounted for within person variation for dietary consumption and imprecise ascertainment of self reported diabetes Calibration for publication bias was carried out if indicated in trim and fill analysis daggerRelative risk and 95 confidence intervals per servingday before and after adjustment for adiposity All relative risks were significant (Plt005) except for artificially sweetened beverages after adjustment for publication bias (P=007)
thethinspbmj | BMJ 2015101h1576 | doi1 020076bmjh1576
RESEARCH
7
We rated the quality of evidence for sugar sweetened beverages artificially sweetened beverages and fruit juice The evidence for sugar sweetened beverages was rated as being of moderate quality The main finding rejected the null hypothesis and was likely to have a small degree of heterogeneity unexplained a dose-re-sponse relation and robustness against potential bias
or limitations including publication bias We rated the evidence for artificially sweetened beverages and fruit juice to be of low quality Findings for artificially sweet-ened beverages were likely to have publication bias and residual confounding and for fruit juice the posi-tive association was not stable and varied by study design
Sugar sweetened beverages
EPIC-InterAct11
ARIC64
Black WHS58
NHS II41 60 61
KIHD54
NHS I41 51
CARDIA55 56
HPFS41 49 50
FOS65
Iowa WHS62
MESA39
Occupation cohort Japan59
SCHS57
HIPOP-OHP63
E3N40
JPHC52
FMCHES53
Overall
Arti13cially sweetened beverages
EPIC-InterAct11
NHS II41 60 61
NHS I41 51
MESA39
HPFS41 49 50
Black WHS58
CARDIA55 56
FOS65
Occupation cohort Japan59
E3N40
Overall
Fruit juice
NHS I41 51
EPIC-InterAct11
NHS II41 60 61
HPFS41 49 50
FOS65
Black WHS58
Iowa WHS62
CARDIA55 56
E3N40
SCHS57
HIPOP-OHP63
JPHC52
Occupation cohort Japan59
Overall
05 1 2 4
Cohort Relative risk(95 CI)
121 (112 to 131)
101 (096 to 106)
110 (105 to 116)
117 (111 to 124)
106 (095 to 118)
139 (130 to 148)
Unavailable
131 (120 to 144)
112 (090 to 140)
Unavailable
Unavailable
108 (088 to 133)
222 (164 to 300)
089 (075 to 106)
282 (087 to 917)
125 (099 to 158)
Unavailable
118 (109 to 128)
I2=890
136 (118 to 156)
120 (116 to 125)
124 (119 to 130)
148 (121 to 180)
123 (115 to 132)
105 (086 to 127)
Unavailable
124 (113 to 137)
134 (090 to 199)
117
125 (118 to 133)
I2=703
114 (108 to 121)
102 (095 to 108)
107 (100 to 114)
105 (097 to 114)
081 (066 to 099)
105 (099 to 111)
Unavailable
Unavailable
083 (061 to 115)
172 (109 to 272)
089 (050 to 158)
111 (082 to 151)
056 (021 to 148)
105 (099 to 111)
I2=579
99
105
105
104
91
102
95
60
63
44
73
05
56
1000
104
209
203
67
176
70
146
22
03
1000
183
172
172
153
56
183
26
13
09
29
03
1000
Relative risk(95 CI)
Weight()
05 1 2 4 05 1 2 4
Relative risk(95 CI)dagger
113 (105 to 122)
101 (096 to 106)
106 (097 to 116)
111 (104 to 119)
105 (095 to 117)
123 (114 to 132)
103 (093 to 114)
122 (110 to 135)
112 (090 to 139)
149 (127 to 175)
086 (063 to 118)
107 (087 to 132)
195 (144 to 265)
089 (075 to 106)
270 (082 to 882)
115 (088 to 150)
150
113 (106 to 121)
I2=798
109 (097 to 123)
104 (100 to 109)
104 (099 to 109)
129 (105 to 158)
106 (099 to 114)
Unavailable
094 (076 to 115)
117 (105 to 131)
125 (084 to 187)
672
108 (102 to 115)
I2=636
111 (105 to 118)
104 (096 to 113)
115 (101 to 131)
107 (098 to 116)
084 (069 to 102)
Unavailable
128 (112 to 146)
100 (085 to 118)
090 (065 to 124)
154 (097 to 245)
083 (047 to 147)
109 (079 to 151)
054 (021 to 141)
107 (101 to 114)
I2=508
88
94
83
90
78
88
79
80
47
62
30
49
32
58
03
38
01
1000
121
214
209
63
180
62
130
20
03
1000
187
163
115
160
72
114
91
33
17
12
32
04
1000
Relative risk(95 CI)dagger
Weight()
Relative risk(95 CI)Dagger
124 (109 to 141)
103 (090 to 118)
110 (095 to 126)
125 (107 to 146)
108 (092 to 127)
156 (131 to 185)
107 (083 to 138)
168 (126 to 223)
127 (080 to 202)
238 (146 to 388)
079 (048 to 129)
120 (068 to 213)
516 (237 to 112)
048 (015 to 158)
902
159
19520
128 (112 to 146)
I2=727
116 (094 to 144)
120 (096 to 149)
120 (094 to 153)
148 (106 to 206)
137 (091 to 208)
Unavailable
085 (052 to 139)
200 (114 to 350)
183 (059 to 568)
6850
129 (108 to 154)
I2=501
113 (104 to 122)
108 (094 to 125)
117 (100 to 137)
114 (096 to 136)
082 (066 to 103)
Unavailable
134 (103 to 175)
100 (066 to 152)
079 (038 to 161)
260 (092 to 741)
031
326
lt01
110 (101 to 120)
I2=298
107
106
105
103
102
99
83
77
49
46
46
37
24
11
02
02
01
1000
192
191
179
139
109
89
74
23
04
1000
279
174
164
141
106
78
36
13
06
01
lt01
lt01
1000
Relative risk(95 CI)Dagger
Weight()
11 684
1437
2550
5121
506
7300
174
3229
303
999
413
170
2250
212
1054
676
175
38 253
11 684
5121
7300
413
3229
2550
174
303
170
1054
31 998
7300
11 684
5121
3229
303
2550
999
174
1054
2250
212
676
170
35 722
No ofcases
Fig 1 | Prospective associations of beverage consumption with incident type 2 diabetes random effects meta-analysis unadjusted for adiposity daggeradjusted for adiposity Daggeradjusted for adiposity and within person variation Cohorts were ordered by weights in the most adjusted model estimates with 95 confidence intervals greater than 10 are not presented supplementary table s4 summarises the covariates adjusted for in each study
doi1 020076bmjh1576 | BMJ 2015101h1576 | thethinspbmj
RESEARCH
8
type 2 diabetes risk attributable to sugar sweetened beveragesOverall sugar sweetened beverages were consumed by 544 of people in the USA and 494 in the UK Of a total population the mean consumption of sugar sweetened beverages was 284 (SD 412) gday in the USA and 114 (SD 157) gday in the UK (fig 3 and supplemen-tary table S7) Absolute event rates over 10 years from 2010 were estimated to be 110 in the USA (209 mil-lion events) and 58 in the UK (26 million events) Assuming a causal effect of consumption of sugar sweetened beverages partly mediated by obesity status
(adiposity unadjusted) consumption in the USA would result in 26 million excess events of type 2 diabetes over 10 years (population attributable fraction 119 95 confidence interval 74 to 165) and 126 000 excess events in the UK (population attributable fraction 49 30 to 72) Assuming a causal effect of consumption of sugar sweetened beverages independent of obesity status (adiposity adjusted) consumption would result in 18 million excess events in the USA (population attributable fraction 87 39 to 129) and 79 000 excess events in the UK (population attributable frac-tion 36 17 to 56) Younger adults and men would have greater numbers of type 2 diabetes events related to consumption of sugar sweetened beverages than older adults and women respectively (fig 3 and supple-mentary table S7) The greater the uncertainty accounted for the lesser the precision was computed (see supplementary figure S5) For example if I2=50 the population attributable fraction of 119 in the USA would have a 95 confidence interval of 52 to 183 but remained significant from 0 for the relative risks we estimated
discussionIn this systematic review and meta-analysis we have produced summary evidence that habitual consump-tion of sugar sweetened beverages artificially sweet-ened beverages and fruit juice was prospectively associated with incident type 2 diabetes independently of adiposity Sensitivity analyses consistently sup-ported the positive association of sugar sweetened bev-erages with incident type 2 diabetes In contrast the association between artificially sweetened beverages or fruit juice and incident type 2 diabetes was less evident For artificially sweetened beverages potential publica-tion bias and residual confounding were likely to exist For fruit juice the finding seemed to be unstable and was sensitive to study design Under assumption of cau-sality for the association of consumption of sugar sweetened beverages with incidence of type 2 diabetes we provided efficacy estimates that over 10 years two million type 2 diabetes events in the USA and 80 000 in the UK would be related to consumption of sugar sweet-ened beverages
strengths and limitations of this reviewThis study has limitations typical of observational stud-ies and meta-analysis Residual confounding could exist37 Confounding by socioeconomic and dietary factors was not detected to be strong in published stud-ies However measures of these variables were likely to involve errors such that residual confounding persisted in individual studies and our meta-analysis Addition-ally lifestyle factors and adiposity could change over time The time varying characteristics might not be ran-dom and could result in bias in an unknown direction Reverse causality could also exist because of unmea-sured comorbid conditions and health consciousness that might alter consumption of beverages particularly artificially sweetened ones and risk of type 2 diabetes Weakness of meta-analysis includes the exclusion of
Precision (1standard error)
Rela
tive
risk
Sugar sweetened beverages
0 4 8 12 1601
05
025
1
2
4
10
Precision (1standard error)
Rela
tive
risk
Fruit juice
0 10 20 30025
05
1
2
4
Precision (1standard error)
Rela
tive
risk
Articially sweetened beverages
0 2 4 6 8 1001
05
025
1
2
4
10
Eggerrsquos test P=040
Eggerrsquos test P=003
Eggerrsquos test P=069
Fig 2 | Funnel plot for associations of sugar sweetened beverages artificially sweetened beverages and fruit juice with incident type 2 diabetes Dots represent point estimates plotted over precision measures (1standard error) estimates outside each panel are not presented horizontal lines represent summary estimates and 95 confidence intervals across precision shaded areas represent any of a single estimate that if included would make the summary estimate insignificant (Pgt005) P values by eggerrsquos test are presented for fruit juice estimates with greater precision indicated stronger positive association
thethinspbmj | BMJ 2015101h1576 | doi1 020076bmjh1576
RESEARCH
9
eligible cohorts for lack of information Our meta- analysis included statistical approximation that might involve errors For example we derived dose-response esti-mates partly from categorical estimates and odds ratios Without such approximations analysis standardised across different cohorts is of future interest to character-ise associations between various beverages and risks of type 2 diabetes Finally assessments of bias and quality of evidence involved subjectivity although we objec-tively examined the influence of potential bias in tests for heterogeneity and sensitivity analyses
One strength of this study was in estimating popula-tion attributable fraction for risks of type 2 diabetes related to consumption of sugar sweetened beverages in the USA and UK using data on beverage consumption for each individual While a few studies estimated how much taxation on sugar sweetened beverages influ-enced risk of obesity and type 2 diabetes12-14 no study examined the population impact by combining esti-mates for consumption of sugar sweetened beverages in multiple populations predicted the risk of type 2 diabe-tes by using a validated algorithm or provided quanti-tative evidence on the association of consumption of sugar sweetened beverages with incidence of type 2 diabetes However the population attributable fraction was limited in precision owing to underlying relative risks and uncertainty in generalisability The other lim-itations are that we estimated the population attribut-able fraction under the assumption of causality although it has not been established and the assump-tion that there would be no change over time in lifestyle associated with consumption of sugar sweetened bever-ages Future work should seek to improve precision of evidence and to characterise efficacy and effectiveness of policy interventions for different populations Gener-alisability should be exploredmdashfor example for popu-lations in Central and South America with the highest recorded per capita sales of sugar sweetened beverages in the world and China and India where the highest
prevalence of type 2 diabetes is expected1 67 To mini-mise limitations typical of observational research and understand effectiveness of a policy intervention in dif-ferent populations future research should also include randomised trials examining peoplersquos health and behaviours and informing effectiveness
interpretation in relation to other studiesOther quantitative reviews have been published recently4 5 9 None of them quantified the population attributable fraction One meta-analysis evaluated the influence of adiposity on the association of sugar sweet-ened beverages and type 2 diabetes based on three stud-ies but not artificially sweetened beverages or fruit juice5 For sugar sweetened beverages we evaluated a greater number of type 2 diabetes cases (38 285 v 19 054) and studies (17 v 3) including bias assessments and sensitivity analyses For fruit juice and artificially sweetened beverages we evaluated a greater number of studies than previous work (9 v 4 and 12 v 4 respec-tively) and drew conclusions based on assessment of the influences of adiposity and potential bias that were found to be important
The plausibility of our findings deserves discussion Detrimental effects of sugar sweetened beverages inde-pendent of obesity may exist Sugars in sugar sweet-ened beverages acutely increased blood glucose levels and have a high glycaemic index (80 to 110100 of white bread) a risk factor for type 2 diabetes68 69 Fructose in sugar sweetened beverages promotes hepatic lipogene-sis and further insulin resistance2 Effects of caramels for colouring beverages70 caffeine49 71 phosphoric acid72 and other constituents may also exist These non-glycaemic effects may be present in artificially sweetened beverages if such beverages truly increase the risk of type 2 diabetes Artificially sweetened bever-ages might have effects on hormones microbiota and taste preference but evidence for these remains weak6 73 74 Adverse effects of fruit juice would be
United States
Suga
r sw
eete
ned
beve
rage
(gd
ay)
0
200
300
500
400
100
110
189
10 year risk for type 2 diabetes ()
No at risk (millions)
75
98
141
65
111
90
110
45
165
27
United Kingdom
Age (years)
PAF
for t
ype
2 di
abet
es
All0
10
15
25
20
5
20-44 45-64 Men Womenge65
Age (years)
All 20-44 45-64 Men Womenge65
58
45
21
21
80
15
55
21
61
23
107
9
PAF unadjusted for adiposityMean sugar sweetened beverage consumptionPAF adjusted for adiposity
Fig 3 | Consumption of sugar sweetened beverages and population attributable fraction (PaF) for type 2 diabetes in the united states and the united Kingdom Circles represent mean of consumption of sugar sweetened beverages (left axis) and each bar represents PaF () for type 2 diabetes due to consumption of sugar sweetened beverages (right axis) absolute event rates over 10 years were 110 in the usa (209 million events) and 58 in the uK (26 million events) (see supplementary table 7)
doi1 020076bmjh1576 | BMJ 2015101h1576 | thethinspbmj
RESEARCH
10
present because of its moderately high glycaemic index (50-80)68 Healthful constituents may exist but decrease during processing7 75 This explains why our finding was discordant with the inverse association of consum-ing fruits as food with type 2 diabetes76
Our analysis indicated possible publication bias for the associations between artificially sweetened bever-ages and type 2 diabetes The bias toward a false posi-tive finding would be plausible according to existing public interest over the health effects6 77 The finding at least underscores potential low quality of evidence and the need for cautious interpretation Residual confounding in the finding for artificially sweetened beverages is also plausible because adults at high risk of type 2 diabetes preferentially consumed more artifi-cially sweetened beverages5 6 8 10 11 36 Confounding in the opposite direction in the finding for fruit juice is also plausible because leaner adults at lower risk of type 2 diabetes consumed more fruit juice10 11 These observations provide research and clinical implications for better understanding of health seeking behaviours related to beverage consumption6 78
Clinical and public health implicationsAlthough causality has not been established our find-ings and available evidence indicate a benefit of reduc-ing the consumption of sugar sweetened beverages for the primary prevention of type 2 diabetes In the same context our findings also imply that consumption of artificially sweetened beverages or fruit juice is not likely to reduce the risk of type 2 diabetes and thus not suitable as a healthy option None the less the lower caloric intake of artificially sweetened beverages may be of clinical benefit in obese or overweight adults by helping to reduce body weight6 78 This effect on body weight should be considered separately from our study which could not rule out the effect of body weight on beverage consumption8 Additionally clinical applica-tions of our finding deserve further appraisal about the effects of altering beverage consumption on changes in lifestyle behaviours and on risks of other clinical outcomes3 6 8
Our findings have strong public health implications Despite the limitations of this review the current con-sumption of sugar sweetened beverages was estimated to cause approximately two million excess events of type 2 diabetes in the USA and 80 000 in the UK over 10 years This could cost nearly pound120bn in the USA and pound206m in the UK ($9800 in the USA and $3994 in the UK per patient67 $1 (pound065 euro091 as of 7 July 2015) In future our work on efficacy should be extended to that on effectiveness to identify needs for interventions In addition to observational evidence trial evidence should be available accounting for the effects on car-diometabolic health and lifestyle change associated with a possible intervention8 78 Despite a population attributable fraction of no more than 20 effectiveness should be evaluated for different populations as an estimated 592 million adults globally will have type 2 diabetes in 20351 67 Additionally the average popula-tion attributable fraction of no more than 20 confirms
the importance of modifying multiple lifestyle risk fac-tors rather than a single dietary component for the pri-mary prevention of type 2 diabetes For artificially sweetened beverages and fruit juice our findings inform little benefit of using them as an alternative to sugar sweetened beverages In addition fruit juice con-sumption should not be a part of dietary recommenda-tions for greater consumption of fruits and vegetables as suggested to limit fruit juice consumption among children7 79
ConclusionsObservational cohort studies support that consumption of sugar sweetened beverages is associated with inci-dent type 2 diabetes and independently of adiposity This finding was stable in sensitivity analyses assessing influence of population characteristics potential resid-ual confounding and publication bias By contrast although artificially sweetened beverages and fruit juice showed a positive association with incident type 2 diabetes the quality of evidence is limited by potential bias and heterogeneity by study design Although cau-sality has not been established and precision needs to be improved this study informs the potential efficacy of reducing the consumption of sugar sweetened bever-ages in a contemporary population Moreover findings support that neither artificially sweetened beverages nor fruit juice are suitable alternatives to sugar sweet-ened beverages for the prevention of type 2 diabetes The following contributors provided additional information Emilie Rossignol Guy Fagherazzi Franccediloise Clavel-Chapelon and Beverley Balkau Center for Research in Epidemiology and Population Health Villejuif Cedex France Tomonori Okamura Department of Preventive Medicine and Public Health Keio University School of Medicine Tokyo Japan and Hirotsugu Ueshima Department of Health Science and Center for Epidemiologic Research in Asia Sari Voutilainen Institute of Public Health and Clinical Nutrition Kuopio Finland Frank B Hu Harvard T H Chan School of Public Health Boston Massachusetts USA Manabu Sakurai Department of Epidemiology and Public Health Kanazawa Medical University Uchinada Ishikawa Japan Paul F Jacques Nicola M McKeown and Ma Jiantao Human Nutrition Research Center on Aging Tufts University Boston Massachusetts USAContributors FI and NGF conceived the study FI LOrsquoC YZ and NGF designed the study FI LOrsquoC and YZ undertook the literature search and extracted data FI JM YH and SNB did data analysis FI LOrsquoC YZ and NGF interpreted data FI developed the first draft FI as guarantor accepts full responsibility for the work and the conduct of the study had access to the data and controlled the decision to publish All authors provided critical comments and approved the final version The sponsor of the study had no role in design and conduct of the study collection management analysis and interpretation of the data preparation review or approval of the manuscript and decision to submit the manuscript for publication The corresponding author had full access to all the data in the study and had final responsibility for the decision to submit for publication Funding This study was funded by the Medical Research Council Epidemiology Unit Core Support (MC_UU_120155) SNB was supported by an American Heart Association postdoctoral fellowship grant (13POST14370012) Competing interests All authors have completed the ICMJE uniform disclosure form at wwwicmjeorgcoi_disclosurepdf and declare no support from any organisation for the submitted work no financial relationships with any organisations that might have an interest in the submitted work in the previous three years no other relationships or activities that could appear to have influenced the submitted workEthical approval Not requiredData sharing A protocol and data for tables and figures are available on request
thethinspbmj | BMJ 2015101h1576 | doi1 020076bmjh1576
RESEARCH
11
Transparency The guarantor (FI) affirms that the manuscript is an honest accurate and transparent account of the study being reported that no important aspects of the study have been omitted and that any discrepancies from the study as planned have been explained as post hoc analysis Data sharing is available from the corresponding author
This is an Open Access article distributed in accordance with the terms of the Creative Commons Attribution (CC BY 40) license which permits others to distribute remix adapt and build upon this work for commercial use provided the original work is properly cited See httpcreativecommonsorglicensesby40
1 Basu S McKee M Galea G Stuckler D Relationship of soft drink consumption to global overweight obesity and diabetes a cross-national analysis of 75 countries Am J Public Health 20131032071-7
2 Stanhope KL Role of fructose-containing sugars in the epidemics of obesity and metabolic syndrome Annu Rev Med 201263329-43
3 Weed DL Althuis MD Mink PJ Quality of reviews on sugar-sweetened beverages and health outcomes a systematic review Am J Clin Nutr 2011941340-7
4 Malik VS Popkin BM Bray GA et al Sugar-sweetened beverages and risk of metabolic syndrome and type 2 diabetes a meta-analysis Diabetes Care 2010332477-83
5 Greenwood DC Threapleton DE Evans CEL et al Association between sugar-sweetened and artificially sweetened soft drinks and type 2 diabetes systematic review and dose-response meta-analysis of prospective studies Br J Nutr 2014112725-34
6 Gardner C Wylie-Rosett J Gidding SS et al Nonnutritive sweeteners current use and health perspectives a scientific statement from the American Heart Association and the American Diabetes Association Circulation 2012126509-19
7 Slavin JL Lloyd B Health benefits of fruits and vegetables Adv Nutr 20123506-16
8 Malik VS Popkin BM Bray GA Despreacutes J-P Hu FB Sugar-sweetened beverages obesity type 2 diabetes mellitus and cardiovascular disease risk Circulation 20101211356-64
9 Xi B Li S Liu Z et al Intake of fruit juice and incidence of type 2 diabetes a systematic review and meta-analysis PloS One 20149e93471
10 Bleich SN Wolfson JA Vine S Wang YC Diet-beverage consumption and caloric intake among US adults overall and by body weight Am J Public Health 2014104e72-8
11 The InterAct Consortium Consumption of sweet beverages and type 2 diabetes incidence in European adults results from EPIC-InterAct Diabetologia 2013561520-30
12 Basu S Vellakkal S Agrawal S Stuckler D Popkin B Ebrahim S Averting obesity and type 2 diabetes in India through sugar-sweetened beverage taxation an economic-epidemiologic modeling study PLoS Med 201411e1001582
13 Brownell KD Farley T Willett WC et al The public health and economic benefits of taxing sugar-sweetened beverages N Engl J Med 20093611599-605
14 Briggs ADM Mytton OT Kehlbacher A Tiffin R Rayner M Scarborough P Overall and income specific effect on prevalence of overweight and obesity of 20 sugar sweetened drink tax in UK econometric and comparative risk assessment modelling study BMJ 2013347f6189
15 Liberati A Altman DG Tetzlaff J et al The PRISMA statement for reporting systematic reviews and meta-analyses of studies that evaluate healthcare interventions explanation and elaboration BMJ 2009339b2700
16 The Diabetes Prevention Program Research Group Diabetes Prevention Program Research Group Knowler WC et al Reduction in the incidence of type 2 diabetes with lifestyle intervention or metformin N Engl J Med 2002346393-403
17 Franco M Bilal U Orduntildeez P et al Population-wide weight loss and regain in relation to diabetes burden and cardiovascular mortality in Cuba 1980-2010 repeated cross sectional surveys and ecological comparison of secular trends BMJ 2013346f1515
18 Willett WC Howe GR Kushi LH Adjustment for total energy intake in epidemiologic studies Am J Clin Nutr 1997651220S-8S discussion 1229S-31S
19 Higgins JP Altman DG Gotzsche PC et al The Cochrane Collaborationrsquos tool for assessing risk of bias in randomised trials BMJ 2011343d5928
20 Sterne JA Higgins JP Reeves BC on behalf of the development group for ACROBAT-NRSI A A Cochrane risk of bias assessment tool for non-randomized studies of interventions version 100 September 2014 2014 wwwriskofbiasinfo
21 Higgins J Assessing risk of bias in included studies In Higgins J Green S eds Cochrane handbook for systematic reviews of interventions Cochrane Collaboration 20081-50
22 Schuumlnemann H Brożek J Oxman GGA Handbook for grading the quality of evidence and the strength of recommendations using the GRADE approach 2013 wwwguidelinedevelopmentorghandbook
23 Zhang J Yu KF Whatrsquos the relative risk A method of correcting the odds ratio in cohort studies of common outcomes JAMA 19982801690
24 Greenland S Longnecker MP Methods for trend estimation from summarized dose-response data with applications to meta-analysis Am J Epidemiol 19921351301-9
25 Higgins JP Thompson SG Quantifying heterogeneity in a meta-analysis Stat Med 2002211539-58
26 Walter WC Correction for the effects of measurement error In Willett WC ed Nutritional epidemiology 3rd ed Oxford University Press 2012
27 MacMahon S Peto R Cutler J et al Blood pressure stroke and coronary heart disease Part 1 prolonged differences in blood pressure prospective observational studies corrected for the regression dilution bias Lancet 1990335765-74
28 Carroll RJ Stefanski LA Measurement error instrumental variables and corrections for attenuation with applications to meta-analyses Stat Med 1994131265-82
29 Prospective Studies Collaboration Blood cholesterol and vascular mortality by age sex and blood pressure a meta-analysis of individual data from 61 prospective studies with 55 000 vascular deaths Lancet 20073701829-39
30 Di Angelantonio E Sarwar N Perry P et al Major lipids apolipoproteins and risk of vascular disease JAMA 20093021993-2000
31 Hunter DJ Spiegelman D Adami HO et al Cohort studies of fat intake and the risk of breast cancer--a pooled analysis N Engl J Med 1996334356-61
32 Greenland S Quantitative methods in the review of epidemiologic literature Epidemiol Rev 198791-30
33 Brenner H Gefeller O Use of the positive predictive value to correct for disease misclassification in epidemiologic studies Am J Epidemiol 19931381007-15
34 Jonathan E Sterne AC Egger M Moher D Bias C Addressing reporting biases In Higgins J Green S eds Cochrane handbook for systematic reviews of interventions Cochrane Collaboration 20081-33
35 Lash TL Fink AK Semi-automated sensitivity analysis to assess systematic errors in observational data Epidemiology 200314 451-8
36 Sun Q van Dam RM Spiegelman D Heymsfield SB Willett WC Hu FB Comparison of dual-energy x-ray absorptiometric and anthropometric measures of adiposity in relation to adiposity-related biologic factors Am J Epidemiol 20101721442-54
37 Smith GD Phillips AN Inflation in epidemiology ldquothe proof and measurement of association between two thingsrdquo revisited BMJ 19963121659-61
38 Bray GA Energy and fructose from beverages sweetened with sugar or high-fructose corn syrup pose a health risk for some people Adv Nutr 20134220-5
39 Nettleton JA Lutsey PL Wang Y et al Diet soda intake and risk of incident metabolic syndrome and type 2 diabetes in the Multi-Ethnic Study of Atherosclerosis (MESA) Diabetes Care 200932688-9440
40 Fagherazzi G Vilier A Saes Sartorelli D Lajous M Balkau B Clavel-Chapelon F Consumption of artificially and sugar-sweetened beverages and incident type 2 diabetes in the Etude Epidemiologique aupres des femmes de la Mutuelle Generale de lrsquoEducation Nationale-European Prospective Investigation into Cancer and Nutrition cohort Am J Clin Nutr 201397517-23
41 Muraki I Imamura F Manson JE et al Fruit consumption and risk of type 2 diabetes results from three prospective longitudinal cohort studies BMJ 2013347f5001
42 Cook JR Stefanski LA Simulation-extrapolation estimation in parametric measurement error models J Am Stat Assoc 1994891314-28
43 Greenland S Estimation of population attributable fractions from fitted incidence ratios and exposure survey data with an application to electromagnetic fields and childhood leukemia Biometrics 200157182-8
44 Schuumlnemann AHJ Oxman AD Vist GE Higgins JPT Jonathan J Interpreting results and drawing conclusions In Higgins J Green S eds Cochrane Handbook for Systematic Reviews of Interventions Cochrane Collaboration 20081-24
45 National Center for Health Statistics National Health and Nutrition Examination Survey NHANES (2009-2010) 2005 wwwcdcgovnchsnhaneshtm
46 Public Health England and Food Standards Agency National Diet and Nutrition Survey results from years 1 to 4 (combined) of the rolling programme for 2008 and 2009 to 2011 and 2012 2014 wwwgovukgovernmentpublicationsnational-diet-and-nutrition-survey- results-from-years-1-to-4-combined-of-the-rolling-programme-for-2008-and-2009-to-2011-and-2012
47 Hippisley-Cox J Coupland C Robson J Sheikh A Brindle P Predicting risk of type 2 diabetes in England and Wales prospective derivation and validation of QDScore BMJ 2009338b880
48 Schmidt MI Duncan BB Bang H et al Identifying individuals at high risk for diabetes the Atherosclerosis Risk in Communities study Diabetes Care 2005282013-8
RESEARCH
No commercial reuse See rights and reprints httpwwwbmjcompermissions Subscribe httpwwwbmjcomsubscribe
49 Bhupathiraju SN Pan A Malik VS et al Caffeinated and caffeine- free beverages and risk of type 2 diabetes Am J Clin Nutr 2013 97155-66
50 De Koning L Malik VS Rimm EB Willett WC Hu FB Sugar-sweetened and artificially sweetened beverage consumption and risk of type 2 diabetes in men Am J Clin Nutr 2011931321-7
51 Bazzano LA Li TY Joshipura KJ Hu FB Intake of fruit vegetables and fruit juices and risk of diabetes in women Diabetes Care 2008311311-7
52 Eshak ES Iso H Mizoue T Inoue M Noda M Tsugane S Soft drink 100 fruit juice and vegetable juice intakes and risk of diabetes mellitus Clin Nutr 201332300-8
53 Montonen J Jarvinen R Knekt P Heliovaara M Reunanen A Consumption of sweetened beverages and intakes of fructose and glucose predict type 2 diabetes occurrence J Nutr 20071371447-54
54 Mursu J Virtanen JK Tuomainen T-P Nurmi T Voutilainen S Intake of fruit berries and vegetables and risk of type 2 diabetes in Finnish men the Kuopio Ischaemic Heart Disease Risk Factor Study Am J Clin Nutr 201499328-33
55 Duffey KJ Gordon-Larsen P Steffen LM et al Drinking caloric beverages increases the risk of adverse cardiometabolic outcomes in the Coronary Artery Risk Development in Young Adults (CARDIA) Study Am J Clin Nutr 201092954-9
56 Duffey KJ Steffen LM Van Horn L Jacobs DR Popkin BM Dietary patterns matter diet beverages and cardiometabolic risks in the longitudinal Coronary Artery Risk Development in Young Adults (CARDIA) Study Am J Clin Nutr 201295909-15
57 Odegaard AO Koh W-PP Arakawa K Yu MC Pereira MA Soft drink and juice consumption and risk of physician-diagnosed incident type 2 diabetes the Singapore Chinese Health Study Am J Epidemiol 2010171701-8
58 Palmer JR Boggs DA Krishnan S Hu FB Singer M Rosenberg L Sugar-sweetened beverages and incidence of type 2 diabetes mellitus in African American women Arch Intern Med 2008168 1487-92
59 Sakurai M Nakamura K Miura K et al Sugar-sweetened beverage and diet soda consumption and the 7-year risk for type 2 diabetes mellitus in middle-aged Japanese men Eur J Nutr 201453251-8
60 Schulze MB Manson JE Ludwig DS et al Sugar-sweetened beverages weight gain and incidence of type 2 diabetes in young and middle-aged women JAMA 2004292927-34
61 Pan A Malik VS Schulze MB Manson JE Willett WC Hu FB Plain-water intake and risk of type 2 diabetes in young and middle-aged women Am J Clin Nutr 2012951454-60
62 Pereira MA Parker ED Folsom AR Intake of sugar sweetened beverages fruit juice and incidence of type 2 diabetes A prospective study of postmenopausal women Diabetes 200554A258
63 Hayashino Y Fukuhara S Okamura T et al A prospective study of passive smoking and risk of diabetes in a cohort of workers the High-Risk and Population Strategy for Occupational Health Promotion (HIPOP-OHP) study Diabetes Care 200831732-4
64 Paynter NP Yeh H-CC Voutilainen S et al Coffee and sweetened beverage consumption and the risk of type 2 diabetes mellitus the atherosclerosis risk in communities study Am J Epidemiol 20061641075-84
65 Dhingra R Sullivan L Jacques PF et al Soft drink consumption and risk of developing cardiometabolic risk factors and the metabolic syndrome in middle-aged adults in the community Circulation 2007116480-8
66 Duffey KJ Steffen LM Van Horn L Jacobs DR Jr Popkin BM Dietary patterns matter diet beverages and cardiometabolic risks in the longitudinal Coronary Artery Risk Development in Young Adults (CARDIA) Study Am J Clin Nutr 201295909-15
67 International Diabetes Federatoin The Global Burden In IDF diabetes atlas 6th ed IDF 201329-49
68 Atkinson FS Foster-Powell K Brand-Miller JC International tables of glycemic index and glycemic load values 2008 Diabetes Care 2008312281-3
69 Livesey G Taylor R Livesey H Liu S Is there a dose-response relation of dietary glycemic load to risk of type 2 diabetes Meta-analysis of prospective cohort studies Am J Clin Nutr 201397584-96
70 Kellow NJ Savige GS Dietary advanced glycation end-product restriction for the attenuation of insulin resistance oxidative stress and endothelial dysfunction a systematic review Eur J Clin Nutr 201367239-48
71 Jiang X Zhang D Jiang W Coffee and caffeine intake and incidence of type 2 diabetes mellitus a meta-analysis of prospective studies Eur J Nutr 20145325-38
72 Fitzpatrick L Heaney RP Got soda J Bone Miner Metab 2003181570-2
73 Pepino MY Bourne C Non-nutritive sweeteners energy balance and glucose homeostasis Curr Opin Clin Nutr Metab Care 201114 391-5
74 Suez J Korem T Zeevi D et al Artificial sweeteners induce glucose intolerance by altering the gut microbiota Nature 2014514181-6
75 Crowe KM Murray E Deconstructing a fruit serving comparing the antioxidant density of select whole fruit and 100 fruit juices J Acad Nutr Diet 20131131354-8
76 Cooper AJ Forouhi NG Ye Z et al Fruit and vegetable intake and type 2 diabetes EPIC-InterAct prospective study and meta-analysis Eur J Clin Nutr 2012661082-92
77 De la Pentildea C Artificial sweetener as a historical window to culturally situated health Ann N Y Acad Sci 20101190159-65
78 Piernas C Tate DF Wang X Popkin BM Does diet-beverage intake affect dietary consumption patterns Results from the Choose Healthy Options Consciously Everyday (CHOICE) randomized clinical trial Am J Clin Nutr 201397604-11
79 Wojcicki JM Heyman MB Reducing childhood obesity by eliminating 100 fruit juice Am J Public Health 20121021630-3
copy BMJ Publishing Group Ltd 2015
Appendix supplementary material
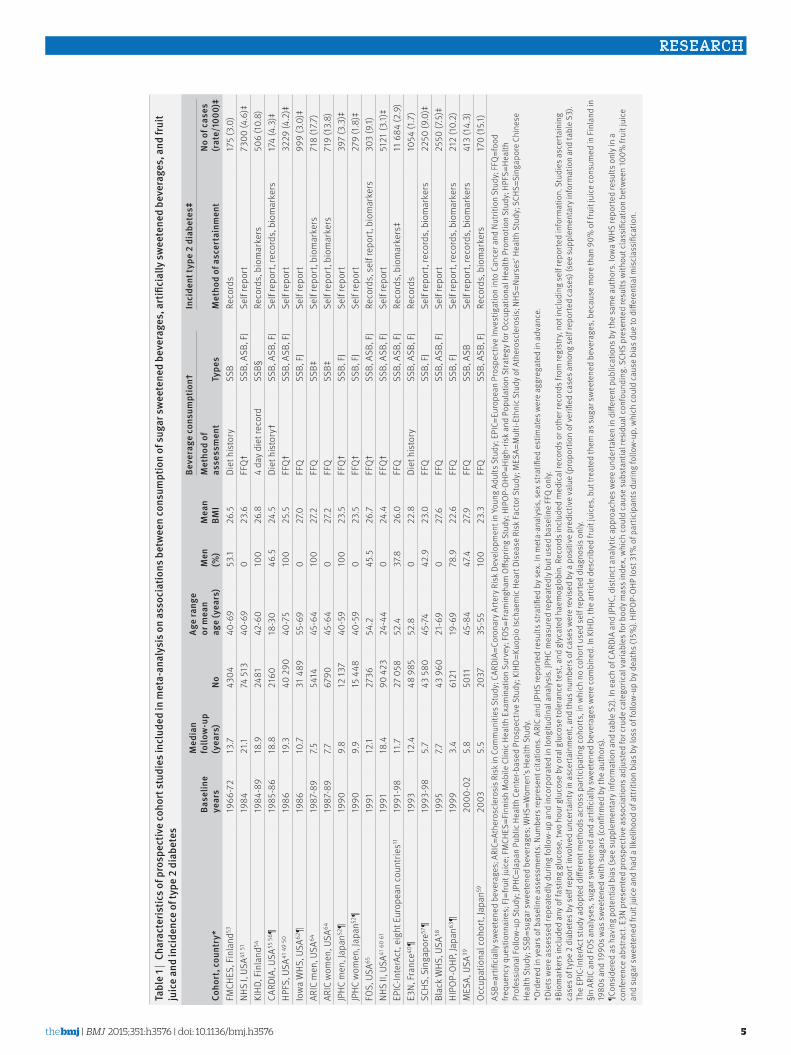
thethinspbmj | BMJ 2015101h1576 | doi1 020076bmjh1576
RESEARCH
5
tabl
e 1 |
Cha
ract
eris
tics o
f pro
spec
tive
coho
rt st
udie
s inc
lude
d in
met
a-an
alys
is o
n as
soci
atio
ns b
etw
een
cons
umpt
ion
of su
gar s
wee
tene
d be
vera
ges
art
ifici
ally
swee
tene
d be
vera
ges
and
frui
t ju
ice
and
inci
denc
e of
type
2 d
iabe
tes
Coho
rt c
ount
ry
base
line
year
s
med
ian
follo
w-u
p (y
ears
)no
age
rang
e or
mea
n ag
e (y
ears
)m
en
()
mea
n bm
i
beve
rage
con
sum
ptio
ndaggerin
cide
nt ty
pe 2
dia
bete
sDaggerm
etho
d of
as
sess
men
tty
pes
met
hod
of a
scer
tain
men
tno
of c
ases
(r
ate
1000
)DaggerFM
CHES
Fin
land
5319
66-7
213
743
0440
-69
531
265
Diet
his
tory
SSB
Reco
rds
175
(30
)NH
S I
USA41
51
1984
211
74 5
1340
-69
023
6FF
Qdagger
SSB
ASB
FJ
Self
repo
rt73
00 (4
6)Dagger
KIHD
Fin
land
5419
84-8
918
924
8142
-60
100
268
4 da
y die
t rec
ord
SSBsect
Reco
rds
bio
mar
kers
506
(10
8)CA
RDIA
USA
55 5
6 para19
85-8
618
821
6018
-30
465
245
Diet
his
tory
daggerSS
B A
SB F
JSe
lf re
port
rec
ords
bio
mar
kers
174
(43
)DaggerHP
FS U
SA41
49
5019
8619
340
290
40-7
510
025
5FF
Qdagger
SSB
ASB
FJ
Self
repo
rt32
29 (4
2)Dagger
Iow
a W
HS U
SA62
para19
8610
731
489
55-6
90
270
FFQ
SSB
FJ
Self
repo
rt99
9 (3
0)Dagger
ARIC
men
USA
64
1987
-89
7554
1445
-64
100
272
FFQ
SSBDagger
Self
repo
rt b
iom
arke
rs71
8 (1
77)
ARIC
wom
en U
SA64
19
87-8
977
6790
45-6
40
272
FFQ
SSBDagger
Self
repo
rt b
iom
arke
rs71
9 (1
38)
JPHC
men
Jap
an52
para19
909
812
137
40-5
910
023
5FF
Qdagger
SSB
FJ
Self
repo
rt39
7 (3
3)Dagger
JPHC
wom
en J
apan
52para
1990
99
15 4
4840
-59
023
5FF
Qdagger
SSB
FJ
Self
repo
rt27
9 (1
8)Dagger
FOS
USA
6519
9112
127
3654
245
526
7FF
Qdagger
SSB
ASB
FJ
Reco
rds
sel
f rep
ort
biom
arke
rs30
3 (9
1)NH
S II
USA
41 6
0 61
1991
184
90 4
2324
-44
024
4FF
Qdagger
SSB
ASB
FJ
Self
repo
rt51
21 (3
1)Dagger
EPIC
-Inte
rAct
eig
ht E
urop
ean
coun
tries
1119
91-9
811
727
058
524
378
260
FFQ
SSB
ASB
FJ
Reco
rds
bio
mar
kers
Dagger11
684
(29
)E3
N Fr
ance
40para
1993
124
48 9
8552
80
228
Diet
his
tory
SSB
ASB
FJ
Reco
rds
1054
(17
)SC
HS S
inga
pore
57para
1993
-98
57
43 5
8045
-74
429
230
FFQ
SSB
FJ
Self
repo
rt r
ecor
ds b
iom
arke
rs22
50 (9
0)Dagger
Blac
k W
HS U
SA58
1995
7743
960
21-6
90
276
FFQ
SSB
ASB
FJ
Self
repo
rt25
50 (7
5)Dagger
HIPO
P-OH
P Ja
pan63
para19
993
461
2119
-69
789
226
FFQ
SSB
FJ
Self
repo
rt r
ecor
ds b
iom
arke
rs21
2 (1
02)
MES
A U
SA39
2000
-02
58
5011
45-8
447
427
9FF
QSS
B A
SBSe
lf re
port
rec
ords
bio
mar
kers
413
(14
3)Oc
cupa
tiona
l coh
ort
Japa
n5920
035
520
3735
-55
100
233
FFQ
SSB
ASB
FJ
Reco
rds
bio
mar
kers
170
(151
)AS
B=ar
tifici
ally
sw
eete
ned
beve
rage
s A
RIC=
Athe
rosc
lero
sis R
isk
in C
omm
uniti
es S
tudy
CAR
DIA=
Coro
nary
Arte
ry R
isk
Deve
lopm
ent i
n Yo
ung
Adul
ts S
tudy
EPI
C=Eu
rope
an P
rosp
ectiv
e In
vest
igat
ion
into
Can
cer a
nd N
utrit
ion
Stud
y F
FQ=f
ood
frequ
ency
que
stio
nnai
res
FJ=
fruit
juic
e F
MCH
ES=F
inni
sh M
obile
Clin
ic H
ealth
Exa
min
atio
n Su
rvey
FOS
=Fra
min
gham
Offs
prin
g St
udy
HIP
OP-
OHP
=Hig
h-ris
k an
d Po
pula
tion
Stra
tegy
for O
ccup
atio
nal H
ealth
Pro
mot
ion
Stud
y H
PFS=
Heal
th
Prof
essi
onal
Fol
low
-up
Stud
y JP
HC=J
apan
Pub
lic H
ealth
Cen
ter-b
ased
Pro
spec
tive
Stud
y K
IHD=
Kuop
io Is
chae
mic
Hea
rt Di
seas
e Ri
sk Fa
ctor
Stu
dy M
ESA=
Mul
ti-Et
hnic
Stu
dy o
f Ath
eros
cler
osis
NHS
=Nur
sesrsquo
Heal
th S
tudy
SCH
S=Si
ngap
ore
Chin
ese
Heal
th S
tudy
SSB
=sug
ar s
wee
tene
d be
vera
ges
WHS
=Wom
enrsquos
Heal
th S
tudy
O
rder
ed in
yea
rs o
f bas
elin
e as
sess
men
ts N
umbe
rs re
pres
ent c
itatio
ns A
RIC
and
JPHS
repo
rted
resu
lts s
tratifi
ed b
y sex
In
met
a-an
alys
is s
ex s
tratifi
ed e
stim
ates
wer
e ag
greg
ated
in a
dvan
ce
daggerDie
ts w
ere
asse
ssed
repe
ated
ly d
urin
g fo
llow
-up
and
inco
rpor
ated
in lo
ngitu
dina
l ana
lysi
s JP
HC m
easu
red
repe
ated
ly b
ut u
sed
base
line
FFQ
only
DaggerB
iom
arke
rs in
clud
ed a
ny o
f fas
ting
gluc
ose
two
hour
glu
cose
by o
ral g
luco
se to
lera
nce
test
and
gly
cate
d ha
emog
lobi
n R
ecor
ds in
clud
ed m
edic
al re
cord
s or o
ther
reco
rds f
rom
regi
stry
not
incl
udin
g se
lf re
porte
d in
form
atio
n S
tudi
es a
scer
tain
ing
case
s of t
ype
2 di
abet
es b
y sel
f rep
ort i
nvol
ved
unce
rtai
nty i
n as
cert
ainm
ent
and
thus
num
bers
of c
ases
wer
e re
vise
d by
a p
ositi
ve p
redi
ctiv
e va
lue
(pro
port
ion
of v
erifi
ed c
ases
am
ong
self
repo
rted
case
s) (s
ee su
pple
men
tary
info
rmat
ion
and
tabl
e S3
) Th
e EP
IC-In
terA
ct s
tudy
ado
pted
diff
eren
t met
hods
acr
oss p
artic
ipat
ing
coho
rts
in w
hich
no
coho
rt us
ed s
elf r
epor
ted
diag
nosi
s onl
ysectI
n AR
IC a
nd F
OS a
naly
ses
sug
ar s
wee
tene
d an
d ar
tifici
ally
sw
eete
ned
beve
rage
s wer
e co
mbi
ned
In K
IHD
the
artic
le d
escr
ibed
frui
t jui
ces
but
trea
ted
them
as s
ugar
sw
eete
ned
beve
rage
s b
ecau
se m
ore
than
90
of f
ruit
juic
e co
nsum
ed in
Fin
land
in
1980
s and
1990
s was
sw
eete
ned
with
sug
ars (
confi
rmed
by t
he a
utho
rs)
paraCon
side
red
as h
avin
g po
tent
ial b
ias (
see
supp
lem
enta
ry in
form
atio
n an
d ta
ble
S2)
In e
ach
of C
ARDI
A an
d JP
HC d
istin
ct a
naly
tic a
ppro
ache
s wer
e un
dert
aken
in d
iffer
ent p
ublic
atio
ns b
y the
sam
e au
thor
s Io
wa
WHS
repo
rted
resu
lts o
nly i
n a
conf
eren
ce a
bstra
ct E
3N p
rese
nted
pro
spec
tive
asso
ciat
ions
adj
uste
d fo
r cru
de c
ateg
oric
al v
aria
bles
for b
ody m
ass i
ndex
whi
ch c
ould
cau
se s
ubst
antia
l res
idua
l con
foun
ding
SCH
S pr
esen
ted
resu
lts w
ithou
t cla
ssifi
catio
n be
twee
n 10
0 fr
uit j
uice
an
d su
gar s
wee
tene
d fru
it ju
ice
and
had
a lik
elih
ood
of a
ttriti
on b
ias b
y los
s of f
ollo
w-u
p by
dea
ths (
15
) HI
POP-
OHP
lost
31
of p
artic
ipan
ts d
urin
g fo
llow
-up
whi
ch c
ould
cau
se b
ias d
ue to
diff
eren
tial m
iscl
assi
ficat
ion
doi1 020076bmjh1576 | BMJ 2015101h1576 | thethinspbmj
RESEARCH
6
the relative risk was shifted only slightly from 107 (101 to 114) to 110 (101 to 120)
sensitivity analysis and quality of evidenceNone of the study specific factors evaluated could explain heterogeneity of results for sugar sweetened beverages and artificially sweetened beverages (Pgt01) (see supplementary table S5) Exploratory meta- regression produced an I2 of 234 for sugar sweet-ened beverages and of 678 for artificially sweetened beverages adjusted for population demographics (age sex country incidence) body mass index fol-low-up duration and measures of study quality The results for fruit juice varied by study design While studies assessing self reported type 2 diabetes only showed a positive association the significant associa-tion disappeared in studies ascertaining the incidence of type 2 diabetes by medical records or by blood glu-cose or glycated haemoglobin level (relative risk 108 097 to 120 P for heterogeneity=0008) Additionally studies with repeated measures of diets supported a null finding (098 086 to 111 P for heterogene-ity=0068) These factors of study design explained heterogeneity of the association reducing I2 from 29 to 0 Demographic variables and body mass index did not explain heterogeneity (Pgt014 each) whereas sugar sweetened beverages artificially sweetened beverages and fruit juice were not significantly asso-ciated with type 2 diabetes in studies recruiting more men than women or conducted in Asia with a fewer number of studies than in the main analysis (supple-mentary table S5)
Publication bias was not evident by Eggerrsquos test (Pgt005) except for fruit juice (P=003) where esti-mates with the greater precision showed stronger asso-ciations (fig 2) Trim and fill indicated publication bias for both sugar sweetened and artificially sweetened
beverages (table 2) In particular publication bias could influence inference for artificially sweetened beverages With adjustment for adiposity the relative risk per one servingday of artificially sweetened bev-erages was 129 (108 to 154) before calibration for publication bias and 122 (098 to 152) after calibration (table 2)
Contour enhanced funnel plots indicated that the findings for artificially sweetened beverages and fruit juice were not stable (fig 2) For example if a study with a relative risk of 05 contributed to the meta-analysis associations of artificially sweetened beverages and fruit juice with type 2 diabetes incidence would not be significant In influence analysis positive associations persisted for sugar sweetened beverages and artificially sweetened beverages (see supplementary figure S3) whereas a significant result of fruit juice was not seen after excluding any single studies supporting the posi-tive association
The results varied little by methodological assump-tion (see supplementary table S6) using estimates per 250 mLday (median of 17 studies) rather than per servingday excluding studies with a high risk of potential bias or with relatively large within person dietary variability and incorporating uncertainty of within person variability and precision of type 2 diabe-tes diagnosis When we examined the potential influ-ence of residual confounding by measured adiposity bias towards the null appeared substantial for artifi-cially sweetened beverages (see supplementary figure S4) Under a realistic assumption of a correlation of 080 between measured and true adiposity36 the asso-ciation for sugar sweetened beverages was attenuated by 26 (relative risk 120 104 to 138) for artificially sweetened beverages was attenuated by 96 (101 081 to 125) and for fruit juice was strengthened by 19 (112 103 to 122)
table 2 | associations between consumption of sugar sweetened beverages artificially sweetened beverages and fruit juice and incident type 2 diabetes meta-analysis of prospective cohort studies
beverages (no of cohorts) and models of meta-analysis
not adjusted for adipositydagger adjusted for adipositydaggerrelative risk (95 Ci) i2 () relative risk (95 Ci) i2 ()
sugar sweetened beverages (n=17)Meta-analysis crude 125 (114 to 137) 89 mdash mdash +multivariable adjusted 118 (109 to 128) 89 113 (106 to 121) 79 +calibration for information bias 143 (120 to 170) 86 128 (112 to 146) 73 +calibration for publication bias 142 (119 to 169) 85 127 (110 to 146) 73artificially sweetened beverages (n=10)Meta-analysis crude 148 (135 to 162) 85 mdash mdash +multivariable adjusted 125 (118 to 133) 70 108 (102 to 115) 64 +calibration for information bias 213 (157 to 288) 72 129 (108 to 154) 50 +calibration for publication bias 181 (133 to 247) 76 122 (098 to 152) 64Fruit juices (n=13)Meta-analysis crude 097 (090 to 106) 79 mdash +multivariable adjusted 105 (099 to 111) 58 107 (101 to 114) 51 +calibration for information bias 106 (098 to 114) 49 110 (101 to 120) 29 +calibration for publication bias Not detected mdash Not detected mdashNumber of cohorts varied slightly by models (see fig 1) Crude meta-analysis pooled estimates without any adjustment Multivariable adjusted estimates were based on meta-analysis of estimates adjusted for demographic and lifestyle covariates (see supplementary table S4 for details) Calibration for information bias accounted for within person variation for dietary consumption and imprecise ascertainment of self reported diabetes Calibration for publication bias was carried out if indicated in trim and fill analysis daggerRelative risk and 95 confidence intervals per servingday before and after adjustment for adiposity All relative risks were significant (Plt005) except for artificially sweetened beverages after adjustment for publication bias (P=007)
thethinspbmj | BMJ 2015101h1576 | doi1 020076bmjh1576
RESEARCH
7
We rated the quality of evidence for sugar sweetened beverages artificially sweetened beverages and fruit juice The evidence for sugar sweetened beverages was rated as being of moderate quality The main finding rejected the null hypothesis and was likely to have a small degree of heterogeneity unexplained a dose-re-sponse relation and robustness against potential bias
or limitations including publication bias We rated the evidence for artificially sweetened beverages and fruit juice to be of low quality Findings for artificially sweet-ened beverages were likely to have publication bias and residual confounding and for fruit juice the posi-tive association was not stable and varied by study design
Sugar sweetened beverages
EPIC-InterAct11
ARIC64
Black WHS58
NHS II41 60 61
KIHD54
NHS I41 51
CARDIA55 56
HPFS41 49 50
FOS65
Iowa WHS62
MESA39
Occupation cohort Japan59
SCHS57
HIPOP-OHP63
E3N40
JPHC52
FMCHES53
Overall
Arti13cially sweetened beverages
EPIC-InterAct11
NHS II41 60 61
NHS I41 51
MESA39
HPFS41 49 50
Black WHS58
CARDIA55 56
FOS65
Occupation cohort Japan59
E3N40
Overall
Fruit juice
NHS I41 51
EPIC-InterAct11
NHS II41 60 61
HPFS41 49 50
FOS65
Black WHS58
Iowa WHS62
CARDIA55 56
E3N40
SCHS57
HIPOP-OHP63
JPHC52
Occupation cohort Japan59
Overall
05 1 2 4
Cohort Relative risk(95 CI)
121 (112 to 131)
101 (096 to 106)
110 (105 to 116)
117 (111 to 124)
106 (095 to 118)
139 (130 to 148)
Unavailable
131 (120 to 144)
112 (090 to 140)
Unavailable
Unavailable
108 (088 to 133)
222 (164 to 300)
089 (075 to 106)
282 (087 to 917)
125 (099 to 158)
Unavailable
118 (109 to 128)
I2=890
136 (118 to 156)
120 (116 to 125)
124 (119 to 130)
148 (121 to 180)
123 (115 to 132)
105 (086 to 127)
Unavailable
124 (113 to 137)
134 (090 to 199)
117
125 (118 to 133)
I2=703
114 (108 to 121)
102 (095 to 108)
107 (100 to 114)
105 (097 to 114)
081 (066 to 099)
105 (099 to 111)
Unavailable
Unavailable
083 (061 to 115)
172 (109 to 272)
089 (050 to 158)
111 (082 to 151)
056 (021 to 148)
105 (099 to 111)
I2=579
99
105
105
104
91
102
95
60
63
44
73
05
56
1000
104
209
203
67
176
70
146
22
03
1000
183
172
172
153
56
183
26
13
09
29
03
1000
Relative risk(95 CI)
Weight()
05 1 2 4 05 1 2 4
Relative risk(95 CI)dagger
113 (105 to 122)
101 (096 to 106)
106 (097 to 116)
111 (104 to 119)
105 (095 to 117)
123 (114 to 132)
103 (093 to 114)
122 (110 to 135)
112 (090 to 139)
149 (127 to 175)
086 (063 to 118)
107 (087 to 132)
195 (144 to 265)
089 (075 to 106)
270 (082 to 882)
115 (088 to 150)
150
113 (106 to 121)
I2=798
109 (097 to 123)
104 (100 to 109)
104 (099 to 109)
129 (105 to 158)
106 (099 to 114)
Unavailable
094 (076 to 115)
117 (105 to 131)
125 (084 to 187)
672
108 (102 to 115)
I2=636
111 (105 to 118)
104 (096 to 113)
115 (101 to 131)
107 (098 to 116)
084 (069 to 102)
Unavailable
128 (112 to 146)
100 (085 to 118)
090 (065 to 124)
154 (097 to 245)
083 (047 to 147)
109 (079 to 151)
054 (021 to 141)
107 (101 to 114)
I2=508
88
94
83
90
78
88
79
80
47
62
30
49
32
58
03
38
01
1000
121
214
209
63
180
62
130
20
03
1000
187
163
115
160
72
114
91
33
17
12
32
04
1000
Relative risk(95 CI)dagger
Weight()
Relative risk(95 CI)Dagger
124 (109 to 141)
103 (090 to 118)
110 (095 to 126)
125 (107 to 146)
108 (092 to 127)
156 (131 to 185)
107 (083 to 138)
168 (126 to 223)
127 (080 to 202)
238 (146 to 388)
079 (048 to 129)
120 (068 to 213)
516 (237 to 112)
048 (015 to 158)
902
159
19520
128 (112 to 146)
I2=727
116 (094 to 144)
120 (096 to 149)
120 (094 to 153)
148 (106 to 206)
137 (091 to 208)
Unavailable
085 (052 to 139)
200 (114 to 350)
183 (059 to 568)
6850
129 (108 to 154)
I2=501
113 (104 to 122)
108 (094 to 125)
117 (100 to 137)
114 (096 to 136)
082 (066 to 103)
Unavailable
134 (103 to 175)
100 (066 to 152)
079 (038 to 161)
260 (092 to 741)
031
326
lt01
110 (101 to 120)
I2=298
107
106
105
103
102
99
83
77
49
46
46
37
24
11
02
02
01
1000
192
191
179
139
109
89
74
23
04
1000
279
174
164
141
106
78
36
13
06
01
lt01
lt01
1000
Relative risk(95 CI)Dagger
Weight()
11 684
1437
2550
5121
506
7300
174
3229
303
999
413
170
2250
212
1054
676
175
38 253
11 684
5121
7300
413
3229
2550
174
303
170
1054
31 998
7300
11 684
5121
3229
303
2550
999
174
1054
2250
212
676
170
35 722
No ofcases
Fig 1 | Prospective associations of beverage consumption with incident type 2 diabetes random effects meta-analysis unadjusted for adiposity daggeradjusted for adiposity Daggeradjusted for adiposity and within person variation Cohorts were ordered by weights in the most adjusted model estimates with 95 confidence intervals greater than 10 are not presented supplementary table s4 summarises the covariates adjusted for in each study
doi1 020076bmjh1576 | BMJ 2015101h1576 | thethinspbmj
RESEARCH
8
type 2 diabetes risk attributable to sugar sweetened beveragesOverall sugar sweetened beverages were consumed by 544 of people in the USA and 494 in the UK Of a total population the mean consumption of sugar sweetened beverages was 284 (SD 412) gday in the USA and 114 (SD 157) gday in the UK (fig 3 and supplemen-tary table S7) Absolute event rates over 10 years from 2010 were estimated to be 110 in the USA (209 mil-lion events) and 58 in the UK (26 million events) Assuming a causal effect of consumption of sugar sweetened beverages partly mediated by obesity status
(adiposity unadjusted) consumption in the USA would result in 26 million excess events of type 2 diabetes over 10 years (population attributable fraction 119 95 confidence interval 74 to 165) and 126 000 excess events in the UK (population attributable fraction 49 30 to 72) Assuming a causal effect of consumption of sugar sweetened beverages independent of obesity status (adiposity adjusted) consumption would result in 18 million excess events in the USA (population attributable fraction 87 39 to 129) and 79 000 excess events in the UK (population attributable frac-tion 36 17 to 56) Younger adults and men would have greater numbers of type 2 diabetes events related to consumption of sugar sweetened beverages than older adults and women respectively (fig 3 and supple-mentary table S7) The greater the uncertainty accounted for the lesser the precision was computed (see supplementary figure S5) For example if I2=50 the population attributable fraction of 119 in the USA would have a 95 confidence interval of 52 to 183 but remained significant from 0 for the relative risks we estimated
discussionIn this systematic review and meta-analysis we have produced summary evidence that habitual consump-tion of sugar sweetened beverages artificially sweet-ened beverages and fruit juice was prospectively associated with incident type 2 diabetes independently of adiposity Sensitivity analyses consistently sup-ported the positive association of sugar sweetened bev-erages with incident type 2 diabetes In contrast the association between artificially sweetened beverages or fruit juice and incident type 2 diabetes was less evident For artificially sweetened beverages potential publica-tion bias and residual confounding were likely to exist For fruit juice the finding seemed to be unstable and was sensitive to study design Under assumption of cau-sality for the association of consumption of sugar sweetened beverages with incidence of type 2 diabetes we provided efficacy estimates that over 10 years two million type 2 diabetes events in the USA and 80 000 in the UK would be related to consumption of sugar sweet-ened beverages
strengths and limitations of this reviewThis study has limitations typical of observational stud-ies and meta-analysis Residual confounding could exist37 Confounding by socioeconomic and dietary factors was not detected to be strong in published stud-ies However measures of these variables were likely to involve errors such that residual confounding persisted in individual studies and our meta-analysis Addition-ally lifestyle factors and adiposity could change over time The time varying characteristics might not be ran-dom and could result in bias in an unknown direction Reverse causality could also exist because of unmea-sured comorbid conditions and health consciousness that might alter consumption of beverages particularly artificially sweetened ones and risk of type 2 diabetes Weakness of meta-analysis includes the exclusion of
Precision (1standard error)
Rela
tive
risk
Sugar sweetened beverages
0 4 8 12 1601
05
025
1
2
4
10
Precision (1standard error)
Rela
tive
risk
Fruit juice
0 10 20 30025
05
1
2
4
Precision (1standard error)
Rela
tive
risk
Articially sweetened beverages
0 2 4 6 8 1001
05
025
1
2
4
10
Eggerrsquos test P=040
Eggerrsquos test P=003
Eggerrsquos test P=069
Fig 2 | Funnel plot for associations of sugar sweetened beverages artificially sweetened beverages and fruit juice with incident type 2 diabetes Dots represent point estimates plotted over precision measures (1standard error) estimates outside each panel are not presented horizontal lines represent summary estimates and 95 confidence intervals across precision shaded areas represent any of a single estimate that if included would make the summary estimate insignificant (Pgt005) P values by eggerrsquos test are presented for fruit juice estimates with greater precision indicated stronger positive association
thethinspbmj | BMJ 2015101h1576 | doi1 020076bmjh1576
RESEARCH
9
eligible cohorts for lack of information Our meta- analysis included statistical approximation that might involve errors For example we derived dose-response esti-mates partly from categorical estimates and odds ratios Without such approximations analysis standardised across different cohorts is of future interest to character-ise associations between various beverages and risks of type 2 diabetes Finally assessments of bias and quality of evidence involved subjectivity although we objec-tively examined the influence of potential bias in tests for heterogeneity and sensitivity analyses
One strength of this study was in estimating popula-tion attributable fraction for risks of type 2 diabetes related to consumption of sugar sweetened beverages in the USA and UK using data on beverage consumption for each individual While a few studies estimated how much taxation on sugar sweetened beverages influ-enced risk of obesity and type 2 diabetes12-14 no study examined the population impact by combining esti-mates for consumption of sugar sweetened beverages in multiple populations predicted the risk of type 2 diabe-tes by using a validated algorithm or provided quanti-tative evidence on the association of consumption of sugar sweetened beverages with incidence of type 2 diabetes However the population attributable fraction was limited in precision owing to underlying relative risks and uncertainty in generalisability The other lim-itations are that we estimated the population attribut-able fraction under the assumption of causality although it has not been established and the assump-tion that there would be no change over time in lifestyle associated with consumption of sugar sweetened bever-ages Future work should seek to improve precision of evidence and to characterise efficacy and effectiveness of policy interventions for different populations Gener-alisability should be exploredmdashfor example for popu-lations in Central and South America with the highest recorded per capita sales of sugar sweetened beverages in the world and China and India where the highest
prevalence of type 2 diabetes is expected1 67 To mini-mise limitations typical of observational research and understand effectiveness of a policy intervention in dif-ferent populations future research should also include randomised trials examining peoplersquos health and behaviours and informing effectiveness
interpretation in relation to other studiesOther quantitative reviews have been published recently4 5 9 None of them quantified the population attributable fraction One meta-analysis evaluated the influence of adiposity on the association of sugar sweet-ened beverages and type 2 diabetes based on three stud-ies but not artificially sweetened beverages or fruit juice5 For sugar sweetened beverages we evaluated a greater number of type 2 diabetes cases (38 285 v 19 054) and studies (17 v 3) including bias assessments and sensitivity analyses For fruit juice and artificially sweetened beverages we evaluated a greater number of studies than previous work (9 v 4 and 12 v 4 respec-tively) and drew conclusions based on assessment of the influences of adiposity and potential bias that were found to be important
The plausibility of our findings deserves discussion Detrimental effects of sugar sweetened beverages inde-pendent of obesity may exist Sugars in sugar sweet-ened beverages acutely increased blood glucose levels and have a high glycaemic index (80 to 110100 of white bread) a risk factor for type 2 diabetes68 69 Fructose in sugar sweetened beverages promotes hepatic lipogene-sis and further insulin resistance2 Effects of caramels for colouring beverages70 caffeine49 71 phosphoric acid72 and other constituents may also exist These non-glycaemic effects may be present in artificially sweetened beverages if such beverages truly increase the risk of type 2 diabetes Artificially sweetened bever-ages might have effects on hormones microbiota and taste preference but evidence for these remains weak6 73 74 Adverse effects of fruit juice would be
United States
Suga
r sw
eete
ned
beve
rage
(gd
ay)
0
200
300
500
400
100
110
189
10 year risk for type 2 diabetes ()
No at risk (millions)
75
98
141
65
111
90
110
45
165
27
United Kingdom
Age (years)
PAF
for t
ype
2 di
abet
es
All0
10
15
25
20
5
20-44 45-64 Men Womenge65
Age (years)
All 20-44 45-64 Men Womenge65
58
45
21
21
80
15
55
21
61
23
107
9
PAF unadjusted for adiposityMean sugar sweetened beverage consumptionPAF adjusted for adiposity
Fig 3 | Consumption of sugar sweetened beverages and population attributable fraction (PaF) for type 2 diabetes in the united states and the united Kingdom Circles represent mean of consumption of sugar sweetened beverages (left axis) and each bar represents PaF () for type 2 diabetes due to consumption of sugar sweetened beverages (right axis) absolute event rates over 10 years were 110 in the usa (209 million events) and 58 in the uK (26 million events) (see supplementary table 7)
doi1 020076bmjh1576 | BMJ 2015101h1576 | thethinspbmj
RESEARCH
10
present because of its moderately high glycaemic index (50-80)68 Healthful constituents may exist but decrease during processing7 75 This explains why our finding was discordant with the inverse association of consum-ing fruits as food with type 2 diabetes76
Our analysis indicated possible publication bias for the associations between artificially sweetened bever-ages and type 2 diabetes The bias toward a false posi-tive finding would be plausible according to existing public interest over the health effects6 77 The finding at least underscores potential low quality of evidence and the need for cautious interpretation Residual confounding in the finding for artificially sweetened beverages is also plausible because adults at high risk of type 2 diabetes preferentially consumed more artifi-cially sweetened beverages5 6 8 10 11 36 Confounding in the opposite direction in the finding for fruit juice is also plausible because leaner adults at lower risk of type 2 diabetes consumed more fruit juice10 11 These observations provide research and clinical implications for better understanding of health seeking behaviours related to beverage consumption6 78
Clinical and public health implicationsAlthough causality has not been established our find-ings and available evidence indicate a benefit of reduc-ing the consumption of sugar sweetened beverages for the primary prevention of type 2 diabetes In the same context our findings also imply that consumption of artificially sweetened beverages or fruit juice is not likely to reduce the risk of type 2 diabetes and thus not suitable as a healthy option None the less the lower caloric intake of artificially sweetened beverages may be of clinical benefit in obese or overweight adults by helping to reduce body weight6 78 This effect on body weight should be considered separately from our study which could not rule out the effect of body weight on beverage consumption8 Additionally clinical applica-tions of our finding deserve further appraisal about the effects of altering beverage consumption on changes in lifestyle behaviours and on risks of other clinical outcomes3 6 8
Our findings have strong public health implications Despite the limitations of this review the current con-sumption of sugar sweetened beverages was estimated to cause approximately two million excess events of type 2 diabetes in the USA and 80 000 in the UK over 10 years This could cost nearly pound120bn in the USA and pound206m in the UK ($9800 in the USA and $3994 in the UK per patient67 $1 (pound065 euro091 as of 7 July 2015) In future our work on efficacy should be extended to that on effectiveness to identify needs for interventions In addition to observational evidence trial evidence should be available accounting for the effects on car-diometabolic health and lifestyle change associated with a possible intervention8 78 Despite a population attributable fraction of no more than 20 effectiveness should be evaluated for different populations as an estimated 592 million adults globally will have type 2 diabetes in 20351 67 Additionally the average popula-tion attributable fraction of no more than 20 confirms
the importance of modifying multiple lifestyle risk fac-tors rather than a single dietary component for the pri-mary prevention of type 2 diabetes For artificially sweetened beverages and fruit juice our findings inform little benefit of using them as an alternative to sugar sweetened beverages In addition fruit juice con-sumption should not be a part of dietary recommenda-tions for greater consumption of fruits and vegetables as suggested to limit fruit juice consumption among children7 79
ConclusionsObservational cohort studies support that consumption of sugar sweetened beverages is associated with inci-dent type 2 diabetes and independently of adiposity This finding was stable in sensitivity analyses assessing influence of population characteristics potential resid-ual confounding and publication bias By contrast although artificially sweetened beverages and fruit juice showed a positive association with incident type 2 diabetes the quality of evidence is limited by potential bias and heterogeneity by study design Although cau-sality has not been established and precision needs to be improved this study informs the potential efficacy of reducing the consumption of sugar sweetened bever-ages in a contemporary population Moreover findings support that neither artificially sweetened beverages nor fruit juice are suitable alternatives to sugar sweet-ened beverages for the prevention of type 2 diabetes The following contributors provided additional information Emilie Rossignol Guy Fagherazzi Franccediloise Clavel-Chapelon and Beverley Balkau Center for Research in Epidemiology and Population Health Villejuif Cedex France Tomonori Okamura Department of Preventive Medicine and Public Health Keio University School of Medicine Tokyo Japan and Hirotsugu Ueshima Department of Health Science and Center for Epidemiologic Research in Asia Sari Voutilainen Institute of Public Health and Clinical Nutrition Kuopio Finland Frank B Hu Harvard T H Chan School of Public Health Boston Massachusetts USA Manabu Sakurai Department of Epidemiology and Public Health Kanazawa Medical University Uchinada Ishikawa Japan Paul F Jacques Nicola M McKeown and Ma Jiantao Human Nutrition Research Center on Aging Tufts University Boston Massachusetts USAContributors FI and NGF conceived the study FI LOrsquoC YZ and NGF designed the study FI LOrsquoC and YZ undertook the literature search and extracted data FI JM YH and SNB did data analysis FI LOrsquoC YZ and NGF interpreted data FI developed the first draft FI as guarantor accepts full responsibility for the work and the conduct of the study had access to the data and controlled the decision to publish All authors provided critical comments and approved the final version The sponsor of the study had no role in design and conduct of the study collection management analysis and interpretation of the data preparation review or approval of the manuscript and decision to submit the manuscript for publication The corresponding author had full access to all the data in the study and had final responsibility for the decision to submit for publication Funding This study was funded by the Medical Research Council Epidemiology Unit Core Support (MC_UU_120155) SNB was supported by an American Heart Association postdoctoral fellowship grant (13POST14370012) Competing interests All authors have completed the ICMJE uniform disclosure form at wwwicmjeorgcoi_disclosurepdf and declare no support from any organisation for the submitted work no financial relationships with any organisations that might have an interest in the submitted work in the previous three years no other relationships or activities that could appear to have influenced the submitted workEthical approval Not requiredData sharing A protocol and data for tables and figures are available on request
thethinspbmj | BMJ 2015101h1576 | doi1 020076bmjh1576
RESEARCH
11
Transparency The guarantor (FI) affirms that the manuscript is an honest accurate and transparent account of the study being reported that no important aspects of the study have been omitted and that any discrepancies from the study as planned have been explained as post hoc analysis Data sharing is available from the corresponding author
This is an Open Access article distributed in accordance with the terms of the Creative Commons Attribution (CC BY 40) license which permits others to distribute remix adapt and build upon this work for commercial use provided the original work is properly cited See httpcreativecommonsorglicensesby40
1 Basu S McKee M Galea G Stuckler D Relationship of soft drink consumption to global overweight obesity and diabetes a cross-national analysis of 75 countries Am J Public Health 20131032071-7
2 Stanhope KL Role of fructose-containing sugars in the epidemics of obesity and metabolic syndrome Annu Rev Med 201263329-43
3 Weed DL Althuis MD Mink PJ Quality of reviews on sugar-sweetened beverages and health outcomes a systematic review Am J Clin Nutr 2011941340-7
4 Malik VS Popkin BM Bray GA et al Sugar-sweetened beverages and risk of metabolic syndrome and type 2 diabetes a meta-analysis Diabetes Care 2010332477-83
5 Greenwood DC Threapleton DE Evans CEL et al Association between sugar-sweetened and artificially sweetened soft drinks and type 2 diabetes systematic review and dose-response meta-analysis of prospective studies Br J Nutr 2014112725-34
6 Gardner C Wylie-Rosett J Gidding SS et al Nonnutritive sweeteners current use and health perspectives a scientific statement from the American Heart Association and the American Diabetes Association Circulation 2012126509-19
7 Slavin JL Lloyd B Health benefits of fruits and vegetables Adv Nutr 20123506-16
8 Malik VS Popkin BM Bray GA Despreacutes J-P Hu FB Sugar-sweetened beverages obesity type 2 diabetes mellitus and cardiovascular disease risk Circulation 20101211356-64
9 Xi B Li S Liu Z et al Intake of fruit juice and incidence of type 2 diabetes a systematic review and meta-analysis PloS One 20149e93471
10 Bleich SN Wolfson JA Vine S Wang YC Diet-beverage consumption and caloric intake among US adults overall and by body weight Am J Public Health 2014104e72-8
11 The InterAct Consortium Consumption of sweet beverages and type 2 diabetes incidence in European adults results from EPIC-InterAct Diabetologia 2013561520-30
12 Basu S Vellakkal S Agrawal S Stuckler D Popkin B Ebrahim S Averting obesity and type 2 diabetes in India through sugar-sweetened beverage taxation an economic-epidemiologic modeling study PLoS Med 201411e1001582
13 Brownell KD Farley T Willett WC et al The public health and economic benefits of taxing sugar-sweetened beverages N Engl J Med 20093611599-605
14 Briggs ADM Mytton OT Kehlbacher A Tiffin R Rayner M Scarborough P Overall and income specific effect on prevalence of overweight and obesity of 20 sugar sweetened drink tax in UK econometric and comparative risk assessment modelling study BMJ 2013347f6189
15 Liberati A Altman DG Tetzlaff J et al The PRISMA statement for reporting systematic reviews and meta-analyses of studies that evaluate healthcare interventions explanation and elaboration BMJ 2009339b2700
16 The Diabetes Prevention Program Research Group Diabetes Prevention Program Research Group Knowler WC et al Reduction in the incidence of type 2 diabetes with lifestyle intervention or metformin N Engl J Med 2002346393-403
17 Franco M Bilal U Orduntildeez P et al Population-wide weight loss and regain in relation to diabetes burden and cardiovascular mortality in Cuba 1980-2010 repeated cross sectional surveys and ecological comparison of secular trends BMJ 2013346f1515
18 Willett WC Howe GR Kushi LH Adjustment for total energy intake in epidemiologic studies Am J Clin Nutr 1997651220S-8S discussion 1229S-31S
19 Higgins JP Altman DG Gotzsche PC et al The Cochrane Collaborationrsquos tool for assessing risk of bias in randomised trials BMJ 2011343d5928
20 Sterne JA Higgins JP Reeves BC on behalf of the development group for ACROBAT-NRSI A A Cochrane risk of bias assessment tool for non-randomized studies of interventions version 100 September 2014 2014 wwwriskofbiasinfo
21 Higgins J Assessing risk of bias in included studies In Higgins J Green S eds Cochrane handbook for systematic reviews of interventions Cochrane Collaboration 20081-50
22 Schuumlnemann H Brożek J Oxman GGA Handbook for grading the quality of evidence and the strength of recommendations using the GRADE approach 2013 wwwguidelinedevelopmentorghandbook
23 Zhang J Yu KF Whatrsquos the relative risk A method of correcting the odds ratio in cohort studies of common outcomes JAMA 19982801690
24 Greenland S Longnecker MP Methods for trend estimation from summarized dose-response data with applications to meta-analysis Am J Epidemiol 19921351301-9
25 Higgins JP Thompson SG Quantifying heterogeneity in a meta-analysis Stat Med 2002211539-58
26 Walter WC Correction for the effects of measurement error In Willett WC ed Nutritional epidemiology 3rd ed Oxford University Press 2012
27 MacMahon S Peto R Cutler J et al Blood pressure stroke and coronary heart disease Part 1 prolonged differences in blood pressure prospective observational studies corrected for the regression dilution bias Lancet 1990335765-74
28 Carroll RJ Stefanski LA Measurement error instrumental variables and corrections for attenuation with applications to meta-analyses Stat Med 1994131265-82
29 Prospective Studies Collaboration Blood cholesterol and vascular mortality by age sex and blood pressure a meta-analysis of individual data from 61 prospective studies with 55 000 vascular deaths Lancet 20073701829-39
30 Di Angelantonio E Sarwar N Perry P et al Major lipids apolipoproteins and risk of vascular disease JAMA 20093021993-2000
31 Hunter DJ Spiegelman D Adami HO et al Cohort studies of fat intake and the risk of breast cancer--a pooled analysis N Engl J Med 1996334356-61
32 Greenland S Quantitative methods in the review of epidemiologic literature Epidemiol Rev 198791-30
33 Brenner H Gefeller O Use of the positive predictive value to correct for disease misclassification in epidemiologic studies Am J Epidemiol 19931381007-15
34 Jonathan E Sterne AC Egger M Moher D Bias C Addressing reporting biases In Higgins J Green S eds Cochrane handbook for systematic reviews of interventions Cochrane Collaboration 20081-33
35 Lash TL Fink AK Semi-automated sensitivity analysis to assess systematic errors in observational data Epidemiology 200314 451-8
36 Sun Q van Dam RM Spiegelman D Heymsfield SB Willett WC Hu FB Comparison of dual-energy x-ray absorptiometric and anthropometric measures of adiposity in relation to adiposity-related biologic factors Am J Epidemiol 20101721442-54
37 Smith GD Phillips AN Inflation in epidemiology ldquothe proof and measurement of association between two thingsrdquo revisited BMJ 19963121659-61
38 Bray GA Energy and fructose from beverages sweetened with sugar or high-fructose corn syrup pose a health risk for some people Adv Nutr 20134220-5
39 Nettleton JA Lutsey PL Wang Y et al Diet soda intake and risk of incident metabolic syndrome and type 2 diabetes in the Multi-Ethnic Study of Atherosclerosis (MESA) Diabetes Care 200932688-9440
40 Fagherazzi G Vilier A Saes Sartorelli D Lajous M Balkau B Clavel-Chapelon F Consumption of artificially and sugar-sweetened beverages and incident type 2 diabetes in the Etude Epidemiologique aupres des femmes de la Mutuelle Generale de lrsquoEducation Nationale-European Prospective Investigation into Cancer and Nutrition cohort Am J Clin Nutr 201397517-23
41 Muraki I Imamura F Manson JE et al Fruit consumption and risk of type 2 diabetes results from three prospective longitudinal cohort studies BMJ 2013347f5001
42 Cook JR Stefanski LA Simulation-extrapolation estimation in parametric measurement error models J Am Stat Assoc 1994891314-28
43 Greenland S Estimation of population attributable fractions from fitted incidence ratios and exposure survey data with an application to electromagnetic fields and childhood leukemia Biometrics 200157182-8
44 Schuumlnemann AHJ Oxman AD Vist GE Higgins JPT Jonathan J Interpreting results and drawing conclusions In Higgins J Green S eds Cochrane Handbook for Systematic Reviews of Interventions Cochrane Collaboration 20081-24
45 National Center for Health Statistics National Health and Nutrition Examination Survey NHANES (2009-2010) 2005 wwwcdcgovnchsnhaneshtm
46 Public Health England and Food Standards Agency National Diet and Nutrition Survey results from years 1 to 4 (combined) of the rolling programme for 2008 and 2009 to 2011 and 2012 2014 wwwgovukgovernmentpublicationsnational-diet-and-nutrition-survey- results-from-years-1-to-4-combined-of-the-rolling-programme-for-2008-and-2009-to-2011-and-2012
47 Hippisley-Cox J Coupland C Robson J Sheikh A Brindle P Predicting risk of type 2 diabetes in England and Wales prospective derivation and validation of QDScore BMJ 2009338b880
48 Schmidt MI Duncan BB Bang H et al Identifying individuals at high risk for diabetes the Atherosclerosis Risk in Communities study Diabetes Care 2005282013-8
RESEARCH
No commercial reuse See rights and reprints httpwwwbmjcompermissions Subscribe httpwwwbmjcomsubscribe
49 Bhupathiraju SN Pan A Malik VS et al Caffeinated and caffeine- free beverages and risk of type 2 diabetes Am J Clin Nutr 2013 97155-66
50 De Koning L Malik VS Rimm EB Willett WC Hu FB Sugar-sweetened and artificially sweetened beverage consumption and risk of type 2 diabetes in men Am J Clin Nutr 2011931321-7
51 Bazzano LA Li TY Joshipura KJ Hu FB Intake of fruit vegetables and fruit juices and risk of diabetes in women Diabetes Care 2008311311-7
52 Eshak ES Iso H Mizoue T Inoue M Noda M Tsugane S Soft drink 100 fruit juice and vegetable juice intakes and risk of diabetes mellitus Clin Nutr 201332300-8
53 Montonen J Jarvinen R Knekt P Heliovaara M Reunanen A Consumption of sweetened beverages and intakes of fructose and glucose predict type 2 diabetes occurrence J Nutr 20071371447-54
54 Mursu J Virtanen JK Tuomainen T-P Nurmi T Voutilainen S Intake of fruit berries and vegetables and risk of type 2 diabetes in Finnish men the Kuopio Ischaemic Heart Disease Risk Factor Study Am J Clin Nutr 201499328-33
55 Duffey KJ Gordon-Larsen P Steffen LM et al Drinking caloric beverages increases the risk of adverse cardiometabolic outcomes in the Coronary Artery Risk Development in Young Adults (CARDIA) Study Am J Clin Nutr 201092954-9
56 Duffey KJ Steffen LM Van Horn L Jacobs DR Popkin BM Dietary patterns matter diet beverages and cardiometabolic risks in the longitudinal Coronary Artery Risk Development in Young Adults (CARDIA) Study Am J Clin Nutr 201295909-15
57 Odegaard AO Koh W-PP Arakawa K Yu MC Pereira MA Soft drink and juice consumption and risk of physician-diagnosed incident type 2 diabetes the Singapore Chinese Health Study Am J Epidemiol 2010171701-8
58 Palmer JR Boggs DA Krishnan S Hu FB Singer M Rosenberg L Sugar-sweetened beverages and incidence of type 2 diabetes mellitus in African American women Arch Intern Med 2008168 1487-92
59 Sakurai M Nakamura K Miura K et al Sugar-sweetened beverage and diet soda consumption and the 7-year risk for type 2 diabetes mellitus in middle-aged Japanese men Eur J Nutr 201453251-8
60 Schulze MB Manson JE Ludwig DS et al Sugar-sweetened beverages weight gain and incidence of type 2 diabetes in young and middle-aged women JAMA 2004292927-34
61 Pan A Malik VS Schulze MB Manson JE Willett WC Hu FB Plain-water intake and risk of type 2 diabetes in young and middle-aged women Am J Clin Nutr 2012951454-60
62 Pereira MA Parker ED Folsom AR Intake of sugar sweetened beverages fruit juice and incidence of type 2 diabetes A prospective study of postmenopausal women Diabetes 200554A258
63 Hayashino Y Fukuhara S Okamura T et al A prospective study of passive smoking and risk of diabetes in a cohort of workers the High-Risk and Population Strategy for Occupational Health Promotion (HIPOP-OHP) study Diabetes Care 200831732-4
64 Paynter NP Yeh H-CC Voutilainen S et al Coffee and sweetened beverage consumption and the risk of type 2 diabetes mellitus the atherosclerosis risk in communities study Am J Epidemiol 20061641075-84
65 Dhingra R Sullivan L Jacques PF et al Soft drink consumption and risk of developing cardiometabolic risk factors and the metabolic syndrome in middle-aged adults in the community Circulation 2007116480-8
66 Duffey KJ Steffen LM Van Horn L Jacobs DR Jr Popkin BM Dietary patterns matter diet beverages and cardiometabolic risks in the longitudinal Coronary Artery Risk Development in Young Adults (CARDIA) Study Am J Clin Nutr 201295909-15
67 International Diabetes Federatoin The Global Burden In IDF diabetes atlas 6th ed IDF 201329-49
68 Atkinson FS Foster-Powell K Brand-Miller JC International tables of glycemic index and glycemic load values 2008 Diabetes Care 2008312281-3
69 Livesey G Taylor R Livesey H Liu S Is there a dose-response relation of dietary glycemic load to risk of type 2 diabetes Meta-analysis of prospective cohort studies Am J Clin Nutr 201397584-96
70 Kellow NJ Savige GS Dietary advanced glycation end-product restriction for the attenuation of insulin resistance oxidative stress and endothelial dysfunction a systematic review Eur J Clin Nutr 201367239-48
71 Jiang X Zhang D Jiang W Coffee and caffeine intake and incidence of type 2 diabetes mellitus a meta-analysis of prospective studies Eur J Nutr 20145325-38
72 Fitzpatrick L Heaney RP Got soda J Bone Miner Metab 2003181570-2
73 Pepino MY Bourne C Non-nutritive sweeteners energy balance and glucose homeostasis Curr Opin Clin Nutr Metab Care 201114 391-5
74 Suez J Korem T Zeevi D et al Artificial sweeteners induce glucose intolerance by altering the gut microbiota Nature 2014514181-6
75 Crowe KM Murray E Deconstructing a fruit serving comparing the antioxidant density of select whole fruit and 100 fruit juices J Acad Nutr Diet 20131131354-8
76 Cooper AJ Forouhi NG Ye Z et al Fruit and vegetable intake and type 2 diabetes EPIC-InterAct prospective study and meta-analysis Eur J Clin Nutr 2012661082-92
77 De la Pentildea C Artificial sweetener as a historical window to culturally situated health Ann N Y Acad Sci 20101190159-65
78 Piernas C Tate DF Wang X Popkin BM Does diet-beverage intake affect dietary consumption patterns Results from the Choose Healthy Options Consciously Everyday (CHOICE) randomized clinical trial Am J Clin Nutr 201397604-11
79 Wojcicki JM Heyman MB Reducing childhood obesity by eliminating 100 fruit juice Am J Public Health 20121021630-3
copy BMJ Publishing Group Ltd 2015
Appendix supplementary material
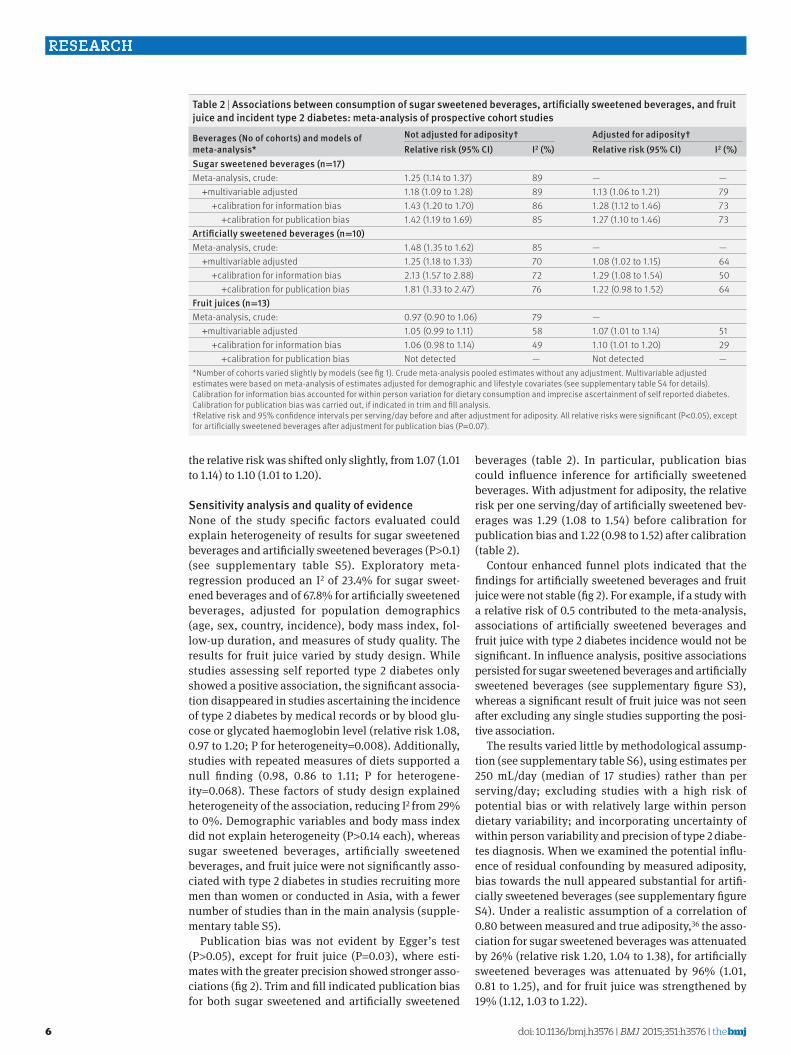
doi1 020076bmjh1576 | BMJ 2015101h1576 | thethinspbmj
RESEARCH
6
the relative risk was shifted only slightly from 107 (101 to 114) to 110 (101 to 120)
sensitivity analysis and quality of evidenceNone of the study specific factors evaluated could explain heterogeneity of results for sugar sweetened beverages and artificially sweetened beverages (Pgt01) (see supplementary table S5) Exploratory meta- regression produced an I2 of 234 for sugar sweet-ened beverages and of 678 for artificially sweetened beverages adjusted for population demographics (age sex country incidence) body mass index fol-low-up duration and measures of study quality The results for fruit juice varied by study design While studies assessing self reported type 2 diabetes only showed a positive association the significant associa-tion disappeared in studies ascertaining the incidence of type 2 diabetes by medical records or by blood glu-cose or glycated haemoglobin level (relative risk 108 097 to 120 P for heterogeneity=0008) Additionally studies with repeated measures of diets supported a null finding (098 086 to 111 P for heterogene-ity=0068) These factors of study design explained heterogeneity of the association reducing I2 from 29 to 0 Demographic variables and body mass index did not explain heterogeneity (Pgt014 each) whereas sugar sweetened beverages artificially sweetened beverages and fruit juice were not significantly asso-ciated with type 2 diabetes in studies recruiting more men than women or conducted in Asia with a fewer number of studies than in the main analysis (supple-mentary table S5)
Publication bias was not evident by Eggerrsquos test (Pgt005) except for fruit juice (P=003) where esti-mates with the greater precision showed stronger asso-ciations (fig 2) Trim and fill indicated publication bias for both sugar sweetened and artificially sweetened
beverages (table 2) In particular publication bias could influence inference for artificially sweetened beverages With adjustment for adiposity the relative risk per one servingday of artificially sweetened bev-erages was 129 (108 to 154) before calibration for publication bias and 122 (098 to 152) after calibration (table 2)
Contour enhanced funnel plots indicated that the findings for artificially sweetened beverages and fruit juice were not stable (fig 2) For example if a study with a relative risk of 05 contributed to the meta-analysis associations of artificially sweetened beverages and fruit juice with type 2 diabetes incidence would not be significant In influence analysis positive associations persisted for sugar sweetened beverages and artificially sweetened beverages (see supplementary figure S3) whereas a significant result of fruit juice was not seen after excluding any single studies supporting the posi-tive association
The results varied little by methodological assump-tion (see supplementary table S6) using estimates per 250 mLday (median of 17 studies) rather than per servingday excluding studies with a high risk of potential bias or with relatively large within person dietary variability and incorporating uncertainty of within person variability and precision of type 2 diabe-tes diagnosis When we examined the potential influ-ence of residual confounding by measured adiposity bias towards the null appeared substantial for artifi-cially sweetened beverages (see supplementary figure S4) Under a realistic assumption of a correlation of 080 between measured and true adiposity36 the asso-ciation for sugar sweetened beverages was attenuated by 26 (relative risk 120 104 to 138) for artificially sweetened beverages was attenuated by 96 (101 081 to 125) and for fruit juice was strengthened by 19 (112 103 to 122)
table 2 | associations between consumption of sugar sweetened beverages artificially sweetened beverages and fruit juice and incident type 2 diabetes meta-analysis of prospective cohort studies
beverages (no of cohorts) and models of meta-analysis
not adjusted for adipositydagger adjusted for adipositydaggerrelative risk (95 Ci) i2 () relative risk (95 Ci) i2 ()
sugar sweetened beverages (n=17)Meta-analysis crude 125 (114 to 137) 89 mdash mdash +multivariable adjusted 118 (109 to 128) 89 113 (106 to 121) 79 +calibration for information bias 143 (120 to 170) 86 128 (112 to 146) 73 +calibration for publication bias 142 (119 to 169) 85 127 (110 to 146) 73artificially sweetened beverages (n=10)Meta-analysis crude 148 (135 to 162) 85 mdash mdash +multivariable adjusted 125 (118 to 133) 70 108 (102 to 115) 64 +calibration for information bias 213 (157 to 288) 72 129 (108 to 154) 50 +calibration for publication bias 181 (133 to 247) 76 122 (098 to 152) 64Fruit juices (n=13)Meta-analysis crude 097 (090 to 106) 79 mdash +multivariable adjusted 105 (099 to 111) 58 107 (101 to 114) 51 +calibration for information bias 106 (098 to 114) 49 110 (101 to 120) 29 +calibration for publication bias Not detected mdash Not detected mdashNumber of cohorts varied slightly by models (see fig 1) Crude meta-analysis pooled estimates without any adjustment Multivariable adjusted estimates were based on meta-analysis of estimates adjusted for demographic and lifestyle covariates (see supplementary table S4 for details) Calibration for information bias accounted for within person variation for dietary consumption and imprecise ascertainment of self reported diabetes Calibration for publication bias was carried out if indicated in trim and fill analysis daggerRelative risk and 95 confidence intervals per servingday before and after adjustment for adiposity All relative risks were significant (Plt005) except for artificially sweetened beverages after adjustment for publication bias (P=007)
thethinspbmj | BMJ 2015101h1576 | doi1 020076bmjh1576
RESEARCH
7
We rated the quality of evidence for sugar sweetened beverages artificially sweetened beverages and fruit juice The evidence for sugar sweetened beverages was rated as being of moderate quality The main finding rejected the null hypothesis and was likely to have a small degree of heterogeneity unexplained a dose-re-sponse relation and robustness against potential bias
or limitations including publication bias We rated the evidence for artificially sweetened beverages and fruit juice to be of low quality Findings for artificially sweet-ened beverages were likely to have publication bias and residual confounding and for fruit juice the posi-tive association was not stable and varied by study design
Sugar sweetened beverages
EPIC-InterAct11
ARIC64
Black WHS58
NHS II41 60 61
KIHD54
NHS I41 51
CARDIA55 56
HPFS41 49 50
FOS65
Iowa WHS62
MESA39
Occupation cohort Japan59
SCHS57
HIPOP-OHP63
E3N40
JPHC52
FMCHES53
Overall
Arti13cially sweetened beverages
EPIC-InterAct11
NHS II41 60 61
NHS I41 51
MESA39
HPFS41 49 50
Black WHS58
CARDIA55 56
FOS65
Occupation cohort Japan59
E3N40
Overall
Fruit juice
NHS I41 51
EPIC-InterAct11
NHS II41 60 61
HPFS41 49 50
FOS65
Black WHS58
Iowa WHS62
CARDIA55 56
E3N40
SCHS57
HIPOP-OHP63
JPHC52
Occupation cohort Japan59
Overall
05 1 2 4
Cohort Relative risk(95 CI)
121 (112 to 131)
101 (096 to 106)
110 (105 to 116)
117 (111 to 124)
106 (095 to 118)
139 (130 to 148)
Unavailable
131 (120 to 144)
112 (090 to 140)
Unavailable
Unavailable
108 (088 to 133)
222 (164 to 300)
089 (075 to 106)
282 (087 to 917)
125 (099 to 158)
Unavailable
118 (109 to 128)
I2=890
136 (118 to 156)
120 (116 to 125)
124 (119 to 130)
148 (121 to 180)
123 (115 to 132)
105 (086 to 127)
Unavailable
124 (113 to 137)
134 (090 to 199)
117
125 (118 to 133)
I2=703
114 (108 to 121)
102 (095 to 108)
107 (100 to 114)
105 (097 to 114)
081 (066 to 099)
105 (099 to 111)
Unavailable
Unavailable
083 (061 to 115)
172 (109 to 272)
089 (050 to 158)
111 (082 to 151)
056 (021 to 148)
105 (099 to 111)
I2=579
99
105
105
104
91
102
95
60
63
44
73
05
56
1000
104
209
203
67
176
70
146
22
03
1000
183
172
172
153
56
183
26
13
09
29
03
1000
Relative risk(95 CI)
Weight()
05 1 2 4 05 1 2 4
Relative risk(95 CI)dagger
113 (105 to 122)
101 (096 to 106)
106 (097 to 116)
111 (104 to 119)
105 (095 to 117)
123 (114 to 132)
103 (093 to 114)
122 (110 to 135)
112 (090 to 139)
149 (127 to 175)
086 (063 to 118)
107 (087 to 132)
195 (144 to 265)
089 (075 to 106)
270 (082 to 882)
115 (088 to 150)
150
113 (106 to 121)
I2=798
109 (097 to 123)
104 (100 to 109)
104 (099 to 109)
129 (105 to 158)
106 (099 to 114)
Unavailable
094 (076 to 115)
117 (105 to 131)
125 (084 to 187)
672
108 (102 to 115)
I2=636
111 (105 to 118)
104 (096 to 113)
115 (101 to 131)
107 (098 to 116)
084 (069 to 102)
Unavailable
128 (112 to 146)
100 (085 to 118)
090 (065 to 124)
154 (097 to 245)
083 (047 to 147)
109 (079 to 151)
054 (021 to 141)
107 (101 to 114)
I2=508
88
94
83
90
78
88
79
80
47
62
30
49
32
58
03
38
01
1000
121
214
209
63
180
62
130
20
03
1000
187
163
115
160
72
114
91
33
17
12
32
04
1000
Relative risk(95 CI)dagger
Weight()
Relative risk(95 CI)Dagger
124 (109 to 141)
103 (090 to 118)
110 (095 to 126)
125 (107 to 146)
108 (092 to 127)
156 (131 to 185)
107 (083 to 138)
168 (126 to 223)
127 (080 to 202)
238 (146 to 388)
079 (048 to 129)
120 (068 to 213)
516 (237 to 112)
048 (015 to 158)
902
159
19520
128 (112 to 146)
I2=727
116 (094 to 144)
120 (096 to 149)
120 (094 to 153)
148 (106 to 206)
137 (091 to 208)
Unavailable
085 (052 to 139)
200 (114 to 350)
183 (059 to 568)
6850
129 (108 to 154)
I2=501
113 (104 to 122)
108 (094 to 125)
117 (100 to 137)
114 (096 to 136)
082 (066 to 103)
Unavailable
134 (103 to 175)
100 (066 to 152)
079 (038 to 161)
260 (092 to 741)
031
326
lt01
110 (101 to 120)
I2=298
107
106
105
103
102
99
83
77
49
46
46
37
24
11
02
02
01
1000
192
191
179
139
109
89
74
23
04
1000
279
174
164
141
106
78
36
13
06
01
lt01
lt01
1000
Relative risk(95 CI)Dagger
Weight()
11 684
1437
2550
5121
506
7300
174
3229
303
999
413
170
2250
212
1054
676
175
38 253
11 684
5121
7300
413
3229
2550
174
303
170
1054
31 998
7300
11 684
5121
3229
303
2550
999
174
1054
2250
212
676
170
35 722
No ofcases
Fig 1 | Prospective associations of beverage consumption with incident type 2 diabetes random effects meta-analysis unadjusted for adiposity daggeradjusted for adiposity Daggeradjusted for adiposity and within person variation Cohorts were ordered by weights in the most adjusted model estimates with 95 confidence intervals greater than 10 are not presented supplementary table s4 summarises the covariates adjusted for in each study
doi1 020076bmjh1576 | BMJ 2015101h1576 | thethinspbmj
RESEARCH
8
type 2 diabetes risk attributable to sugar sweetened beveragesOverall sugar sweetened beverages were consumed by 544 of people in the USA and 494 in the UK Of a total population the mean consumption of sugar sweetened beverages was 284 (SD 412) gday in the USA and 114 (SD 157) gday in the UK (fig 3 and supplemen-tary table S7) Absolute event rates over 10 years from 2010 were estimated to be 110 in the USA (209 mil-lion events) and 58 in the UK (26 million events) Assuming a causal effect of consumption of sugar sweetened beverages partly mediated by obesity status
(adiposity unadjusted) consumption in the USA would result in 26 million excess events of type 2 diabetes over 10 years (population attributable fraction 119 95 confidence interval 74 to 165) and 126 000 excess events in the UK (population attributable fraction 49 30 to 72) Assuming a causal effect of consumption of sugar sweetened beverages independent of obesity status (adiposity adjusted) consumption would result in 18 million excess events in the USA (population attributable fraction 87 39 to 129) and 79 000 excess events in the UK (population attributable frac-tion 36 17 to 56) Younger adults and men would have greater numbers of type 2 diabetes events related to consumption of sugar sweetened beverages than older adults and women respectively (fig 3 and supple-mentary table S7) The greater the uncertainty accounted for the lesser the precision was computed (see supplementary figure S5) For example if I2=50 the population attributable fraction of 119 in the USA would have a 95 confidence interval of 52 to 183 but remained significant from 0 for the relative risks we estimated
discussionIn this systematic review and meta-analysis we have produced summary evidence that habitual consump-tion of sugar sweetened beverages artificially sweet-ened beverages and fruit juice was prospectively associated with incident type 2 diabetes independently of adiposity Sensitivity analyses consistently sup-ported the positive association of sugar sweetened bev-erages with incident type 2 diabetes In contrast the association between artificially sweetened beverages or fruit juice and incident type 2 diabetes was less evident For artificially sweetened beverages potential publica-tion bias and residual confounding were likely to exist For fruit juice the finding seemed to be unstable and was sensitive to study design Under assumption of cau-sality for the association of consumption of sugar sweetened beverages with incidence of type 2 diabetes we provided efficacy estimates that over 10 years two million type 2 diabetes events in the USA and 80 000 in the UK would be related to consumption of sugar sweet-ened beverages
strengths and limitations of this reviewThis study has limitations typical of observational stud-ies and meta-analysis Residual confounding could exist37 Confounding by socioeconomic and dietary factors was not detected to be strong in published stud-ies However measures of these variables were likely to involve errors such that residual confounding persisted in individual studies and our meta-analysis Addition-ally lifestyle factors and adiposity could change over time The time varying characteristics might not be ran-dom and could result in bias in an unknown direction Reverse causality could also exist because of unmea-sured comorbid conditions and health consciousness that might alter consumption of beverages particularly artificially sweetened ones and risk of type 2 diabetes Weakness of meta-analysis includes the exclusion of
Precision (1standard error)
Rela
tive
risk
Sugar sweetened beverages
0 4 8 12 1601
05
025
1
2
4
10
Precision (1standard error)
Rela
tive
risk
Fruit juice
0 10 20 30025
05
1
2
4
Precision (1standard error)
Rela
tive
risk
Articially sweetened beverages
0 2 4 6 8 1001
05
025
1
2
4
10
Eggerrsquos test P=040
Eggerrsquos test P=003
Eggerrsquos test P=069
Fig 2 | Funnel plot for associations of sugar sweetened beverages artificially sweetened beverages and fruit juice with incident type 2 diabetes Dots represent point estimates plotted over precision measures (1standard error) estimates outside each panel are not presented horizontal lines represent summary estimates and 95 confidence intervals across precision shaded areas represent any of a single estimate that if included would make the summary estimate insignificant (Pgt005) P values by eggerrsquos test are presented for fruit juice estimates with greater precision indicated stronger positive association
thethinspbmj | BMJ 2015101h1576 | doi1 020076bmjh1576
RESEARCH
9
eligible cohorts for lack of information Our meta- analysis included statistical approximation that might involve errors For example we derived dose-response esti-mates partly from categorical estimates and odds ratios Without such approximations analysis standardised across different cohorts is of future interest to character-ise associations between various beverages and risks of type 2 diabetes Finally assessments of bias and quality of evidence involved subjectivity although we objec-tively examined the influence of potential bias in tests for heterogeneity and sensitivity analyses
One strength of this study was in estimating popula-tion attributable fraction for risks of type 2 diabetes related to consumption of sugar sweetened beverages in the USA and UK using data on beverage consumption for each individual While a few studies estimated how much taxation on sugar sweetened beverages influ-enced risk of obesity and type 2 diabetes12-14 no study examined the population impact by combining esti-mates for consumption of sugar sweetened beverages in multiple populations predicted the risk of type 2 diabe-tes by using a validated algorithm or provided quanti-tative evidence on the association of consumption of sugar sweetened beverages with incidence of type 2 diabetes However the population attributable fraction was limited in precision owing to underlying relative risks and uncertainty in generalisability The other lim-itations are that we estimated the population attribut-able fraction under the assumption of causality although it has not been established and the assump-tion that there would be no change over time in lifestyle associated with consumption of sugar sweetened bever-ages Future work should seek to improve precision of evidence and to characterise efficacy and effectiveness of policy interventions for different populations Gener-alisability should be exploredmdashfor example for popu-lations in Central and South America with the highest recorded per capita sales of sugar sweetened beverages in the world and China and India where the highest
prevalence of type 2 diabetes is expected1 67 To mini-mise limitations typical of observational research and understand effectiveness of a policy intervention in dif-ferent populations future research should also include randomised trials examining peoplersquos health and behaviours and informing effectiveness
interpretation in relation to other studiesOther quantitative reviews have been published recently4 5 9 None of them quantified the population attributable fraction One meta-analysis evaluated the influence of adiposity on the association of sugar sweet-ened beverages and type 2 diabetes based on three stud-ies but not artificially sweetened beverages or fruit juice5 For sugar sweetened beverages we evaluated a greater number of type 2 diabetes cases (38 285 v 19 054) and studies (17 v 3) including bias assessments and sensitivity analyses For fruit juice and artificially sweetened beverages we evaluated a greater number of studies than previous work (9 v 4 and 12 v 4 respec-tively) and drew conclusions based on assessment of the influences of adiposity and potential bias that were found to be important
The plausibility of our findings deserves discussion Detrimental effects of sugar sweetened beverages inde-pendent of obesity may exist Sugars in sugar sweet-ened beverages acutely increased blood glucose levels and have a high glycaemic index (80 to 110100 of white bread) a risk factor for type 2 diabetes68 69 Fructose in sugar sweetened beverages promotes hepatic lipogene-sis and further insulin resistance2 Effects of caramels for colouring beverages70 caffeine49 71 phosphoric acid72 and other constituents may also exist These non-glycaemic effects may be present in artificially sweetened beverages if such beverages truly increase the risk of type 2 diabetes Artificially sweetened bever-ages might have effects on hormones microbiota and taste preference but evidence for these remains weak6 73 74 Adverse effects of fruit juice would be
United States
Suga
r sw
eete
ned
beve
rage
(gd
ay)
0
200
300
500
400
100
110
189
10 year risk for type 2 diabetes ()
No at risk (millions)
75
98
141
65
111
90
110
45
165
27
United Kingdom
Age (years)
PAF
for t
ype
2 di
abet
es
All0
10
15
25
20
5
20-44 45-64 Men Womenge65
Age (years)
All 20-44 45-64 Men Womenge65
58
45
21
21
80
15
55
21
61
23
107
9
PAF unadjusted for adiposityMean sugar sweetened beverage consumptionPAF adjusted for adiposity
Fig 3 | Consumption of sugar sweetened beverages and population attributable fraction (PaF) for type 2 diabetes in the united states and the united Kingdom Circles represent mean of consumption of sugar sweetened beverages (left axis) and each bar represents PaF () for type 2 diabetes due to consumption of sugar sweetened beverages (right axis) absolute event rates over 10 years were 110 in the usa (209 million events) and 58 in the uK (26 million events) (see supplementary table 7)
doi1 020076bmjh1576 | BMJ 2015101h1576 | thethinspbmj
RESEARCH
10
present because of its moderately high glycaemic index (50-80)68 Healthful constituents may exist but decrease during processing7 75 This explains why our finding was discordant with the inverse association of consum-ing fruits as food with type 2 diabetes76
Our analysis indicated possible publication bias for the associations between artificially sweetened bever-ages and type 2 diabetes The bias toward a false posi-tive finding would be plausible according to existing public interest over the health effects6 77 The finding at least underscores potential low quality of evidence and the need for cautious interpretation Residual confounding in the finding for artificially sweetened beverages is also plausible because adults at high risk of type 2 diabetes preferentially consumed more artifi-cially sweetened beverages5 6 8 10 11 36 Confounding in the opposite direction in the finding for fruit juice is also plausible because leaner adults at lower risk of type 2 diabetes consumed more fruit juice10 11 These observations provide research and clinical implications for better understanding of health seeking behaviours related to beverage consumption6 78
Clinical and public health implicationsAlthough causality has not been established our find-ings and available evidence indicate a benefit of reduc-ing the consumption of sugar sweetened beverages for the primary prevention of type 2 diabetes In the same context our findings also imply that consumption of artificially sweetened beverages or fruit juice is not likely to reduce the risk of type 2 diabetes and thus not suitable as a healthy option None the less the lower caloric intake of artificially sweetened beverages may be of clinical benefit in obese or overweight adults by helping to reduce body weight6 78 This effect on body weight should be considered separately from our study which could not rule out the effect of body weight on beverage consumption8 Additionally clinical applica-tions of our finding deserve further appraisal about the effects of altering beverage consumption on changes in lifestyle behaviours and on risks of other clinical outcomes3 6 8
Our findings have strong public health implications Despite the limitations of this review the current con-sumption of sugar sweetened beverages was estimated to cause approximately two million excess events of type 2 diabetes in the USA and 80 000 in the UK over 10 years This could cost nearly pound120bn in the USA and pound206m in the UK ($9800 in the USA and $3994 in the UK per patient67 $1 (pound065 euro091 as of 7 July 2015) In future our work on efficacy should be extended to that on effectiveness to identify needs for interventions In addition to observational evidence trial evidence should be available accounting for the effects on car-diometabolic health and lifestyle change associated with a possible intervention8 78 Despite a population attributable fraction of no more than 20 effectiveness should be evaluated for different populations as an estimated 592 million adults globally will have type 2 diabetes in 20351 67 Additionally the average popula-tion attributable fraction of no more than 20 confirms
the importance of modifying multiple lifestyle risk fac-tors rather than a single dietary component for the pri-mary prevention of type 2 diabetes For artificially sweetened beverages and fruit juice our findings inform little benefit of using them as an alternative to sugar sweetened beverages In addition fruit juice con-sumption should not be a part of dietary recommenda-tions for greater consumption of fruits and vegetables as suggested to limit fruit juice consumption among children7 79
ConclusionsObservational cohort studies support that consumption of sugar sweetened beverages is associated with inci-dent type 2 diabetes and independently of adiposity This finding was stable in sensitivity analyses assessing influence of population characteristics potential resid-ual confounding and publication bias By contrast although artificially sweetened beverages and fruit juice showed a positive association with incident type 2 diabetes the quality of evidence is limited by potential bias and heterogeneity by study design Although cau-sality has not been established and precision needs to be improved this study informs the potential efficacy of reducing the consumption of sugar sweetened bever-ages in a contemporary population Moreover findings support that neither artificially sweetened beverages nor fruit juice are suitable alternatives to sugar sweet-ened beverages for the prevention of type 2 diabetes The following contributors provided additional information Emilie Rossignol Guy Fagherazzi Franccediloise Clavel-Chapelon and Beverley Balkau Center for Research in Epidemiology and Population Health Villejuif Cedex France Tomonori Okamura Department of Preventive Medicine and Public Health Keio University School of Medicine Tokyo Japan and Hirotsugu Ueshima Department of Health Science and Center for Epidemiologic Research in Asia Sari Voutilainen Institute of Public Health and Clinical Nutrition Kuopio Finland Frank B Hu Harvard T H Chan School of Public Health Boston Massachusetts USA Manabu Sakurai Department of Epidemiology and Public Health Kanazawa Medical University Uchinada Ishikawa Japan Paul F Jacques Nicola M McKeown and Ma Jiantao Human Nutrition Research Center on Aging Tufts University Boston Massachusetts USAContributors FI and NGF conceived the study FI LOrsquoC YZ and NGF designed the study FI LOrsquoC and YZ undertook the literature search and extracted data FI JM YH and SNB did data analysis FI LOrsquoC YZ and NGF interpreted data FI developed the first draft FI as guarantor accepts full responsibility for the work and the conduct of the study had access to the data and controlled the decision to publish All authors provided critical comments and approved the final version The sponsor of the study had no role in design and conduct of the study collection management analysis and interpretation of the data preparation review or approval of the manuscript and decision to submit the manuscript for publication The corresponding author had full access to all the data in the study and had final responsibility for the decision to submit for publication Funding This study was funded by the Medical Research Council Epidemiology Unit Core Support (MC_UU_120155) SNB was supported by an American Heart Association postdoctoral fellowship grant (13POST14370012) Competing interests All authors have completed the ICMJE uniform disclosure form at wwwicmjeorgcoi_disclosurepdf and declare no support from any organisation for the submitted work no financial relationships with any organisations that might have an interest in the submitted work in the previous three years no other relationships or activities that could appear to have influenced the submitted workEthical approval Not requiredData sharing A protocol and data for tables and figures are available on request
thethinspbmj | BMJ 2015101h1576 | doi1 020076bmjh1576
RESEARCH
11
Transparency The guarantor (FI) affirms that the manuscript is an honest accurate and transparent account of the study being reported that no important aspects of the study have been omitted and that any discrepancies from the study as planned have been explained as post hoc analysis Data sharing is available from the corresponding author
This is an Open Access article distributed in accordance with the terms of the Creative Commons Attribution (CC BY 40) license which permits others to distribute remix adapt and build upon this work for commercial use provided the original work is properly cited See httpcreativecommonsorglicensesby40
1 Basu S McKee M Galea G Stuckler D Relationship of soft drink consumption to global overweight obesity and diabetes a cross-national analysis of 75 countries Am J Public Health 20131032071-7
2 Stanhope KL Role of fructose-containing sugars in the epidemics of obesity and metabolic syndrome Annu Rev Med 201263329-43
3 Weed DL Althuis MD Mink PJ Quality of reviews on sugar-sweetened beverages and health outcomes a systematic review Am J Clin Nutr 2011941340-7
4 Malik VS Popkin BM Bray GA et al Sugar-sweetened beverages and risk of metabolic syndrome and type 2 diabetes a meta-analysis Diabetes Care 2010332477-83
5 Greenwood DC Threapleton DE Evans CEL et al Association between sugar-sweetened and artificially sweetened soft drinks and type 2 diabetes systematic review and dose-response meta-analysis of prospective studies Br J Nutr 2014112725-34
6 Gardner C Wylie-Rosett J Gidding SS et al Nonnutritive sweeteners current use and health perspectives a scientific statement from the American Heart Association and the American Diabetes Association Circulation 2012126509-19
7 Slavin JL Lloyd B Health benefits of fruits and vegetables Adv Nutr 20123506-16
8 Malik VS Popkin BM Bray GA Despreacutes J-P Hu FB Sugar-sweetened beverages obesity type 2 diabetes mellitus and cardiovascular disease risk Circulation 20101211356-64
9 Xi B Li S Liu Z et al Intake of fruit juice and incidence of type 2 diabetes a systematic review and meta-analysis PloS One 20149e93471
10 Bleich SN Wolfson JA Vine S Wang YC Diet-beverage consumption and caloric intake among US adults overall and by body weight Am J Public Health 2014104e72-8
11 The InterAct Consortium Consumption of sweet beverages and type 2 diabetes incidence in European adults results from EPIC-InterAct Diabetologia 2013561520-30
12 Basu S Vellakkal S Agrawal S Stuckler D Popkin B Ebrahim S Averting obesity and type 2 diabetes in India through sugar-sweetened beverage taxation an economic-epidemiologic modeling study PLoS Med 201411e1001582
13 Brownell KD Farley T Willett WC et al The public health and economic benefits of taxing sugar-sweetened beverages N Engl J Med 20093611599-605
14 Briggs ADM Mytton OT Kehlbacher A Tiffin R Rayner M Scarborough P Overall and income specific effect on prevalence of overweight and obesity of 20 sugar sweetened drink tax in UK econometric and comparative risk assessment modelling study BMJ 2013347f6189
15 Liberati A Altman DG Tetzlaff J et al The PRISMA statement for reporting systematic reviews and meta-analyses of studies that evaluate healthcare interventions explanation and elaboration BMJ 2009339b2700
16 The Diabetes Prevention Program Research Group Diabetes Prevention Program Research Group Knowler WC et al Reduction in the incidence of type 2 diabetes with lifestyle intervention or metformin N Engl J Med 2002346393-403
17 Franco M Bilal U Orduntildeez P et al Population-wide weight loss and regain in relation to diabetes burden and cardiovascular mortality in Cuba 1980-2010 repeated cross sectional surveys and ecological comparison of secular trends BMJ 2013346f1515
18 Willett WC Howe GR Kushi LH Adjustment for total energy intake in epidemiologic studies Am J Clin Nutr 1997651220S-8S discussion 1229S-31S
19 Higgins JP Altman DG Gotzsche PC et al The Cochrane Collaborationrsquos tool for assessing risk of bias in randomised trials BMJ 2011343d5928
20 Sterne JA Higgins JP Reeves BC on behalf of the development group for ACROBAT-NRSI A A Cochrane risk of bias assessment tool for non-randomized studies of interventions version 100 September 2014 2014 wwwriskofbiasinfo
21 Higgins J Assessing risk of bias in included studies In Higgins J Green S eds Cochrane handbook for systematic reviews of interventions Cochrane Collaboration 20081-50
22 Schuumlnemann H Brożek J Oxman GGA Handbook for grading the quality of evidence and the strength of recommendations using the GRADE approach 2013 wwwguidelinedevelopmentorghandbook
23 Zhang J Yu KF Whatrsquos the relative risk A method of correcting the odds ratio in cohort studies of common outcomes JAMA 19982801690
24 Greenland S Longnecker MP Methods for trend estimation from summarized dose-response data with applications to meta-analysis Am J Epidemiol 19921351301-9
25 Higgins JP Thompson SG Quantifying heterogeneity in a meta-analysis Stat Med 2002211539-58
26 Walter WC Correction for the effects of measurement error In Willett WC ed Nutritional epidemiology 3rd ed Oxford University Press 2012
27 MacMahon S Peto R Cutler J et al Blood pressure stroke and coronary heart disease Part 1 prolonged differences in blood pressure prospective observational studies corrected for the regression dilution bias Lancet 1990335765-74
28 Carroll RJ Stefanski LA Measurement error instrumental variables and corrections for attenuation with applications to meta-analyses Stat Med 1994131265-82
29 Prospective Studies Collaboration Blood cholesterol and vascular mortality by age sex and blood pressure a meta-analysis of individual data from 61 prospective studies with 55 000 vascular deaths Lancet 20073701829-39
30 Di Angelantonio E Sarwar N Perry P et al Major lipids apolipoproteins and risk of vascular disease JAMA 20093021993-2000
31 Hunter DJ Spiegelman D Adami HO et al Cohort studies of fat intake and the risk of breast cancer--a pooled analysis N Engl J Med 1996334356-61
32 Greenland S Quantitative methods in the review of epidemiologic literature Epidemiol Rev 198791-30
33 Brenner H Gefeller O Use of the positive predictive value to correct for disease misclassification in epidemiologic studies Am J Epidemiol 19931381007-15
34 Jonathan E Sterne AC Egger M Moher D Bias C Addressing reporting biases In Higgins J Green S eds Cochrane handbook for systematic reviews of interventions Cochrane Collaboration 20081-33
35 Lash TL Fink AK Semi-automated sensitivity analysis to assess systematic errors in observational data Epidemiology 200314 451-8
36 Sun Q van Dam RM Spiegelman D Heymsfield SB Willett WC Hu FB Comparison of dual-energy x-ray absorptiometric and anthropometric measures of adiposity in relation to adiposity-related biologic factors Am J Epidemiol 20101721442-54
37 Smith GD Phillips AN Inflation in epidemiology ldquothe proof and measurement of association between two thingsrdquo revisited BMJ 19963121659-61
38 Bray GA Energy and fructose from beverages sweetened with sugar or high-fructose corn syrup pose a health risk for some people Adv Nutr 20134220-5
39 Nettleton JA Lutsey PL Wang Y et al Diet soda intake and risk of incident metabolic syndrome and type 2 diabetes in the Multi-Ethnic Study of Atherosclerosis (MESA) Diabetes Care 200932688-9440
40 Fagherazzi G Vilier A Saes Sartorelli D Lajous M Balkau B Clavel-Chapelon F Consumption of artificially and sugar-sweetened beverages and incident type 2 diabetes in the Etude Epidemiologique aupres des femmes de la Mutuelle Generale de lrsquoEducation Nationale-European Prospective Investigation into Cancer and Nutrition cohort Am J Clin Nutr 201397517-23
41 Muraki I Imamura F Manson JE et al Fruit consumption and risk of type 2 diabetes results from three prospective longitudinal cohort studies BMJ 2013347f5001
42 Cook JR Stefanski LA Simulation-extrapolation estimation in parametric measurement error models J Am Stat Assoc 1994891314-28
43 Greenland S Estimation of population attributable fractions from fitted incidence ratios and exposure survey data with an application to electromagnetic fields and childhood leukemia Biometrics 200157182-8
44 Schuumlnemann AHJ Oxman AD Vist GE Higgins JPT Jonathan J Interpreting results and drawing conclusions In Higgins J Green S eds Cochrane Handbook for Systematic Reviews of Interventions Cochrane Collaboration 20081-24
45 National Center for Health Statistics National Health and Nutrition Examination Survey NHANES (2009-2010) 2005 wwwcdcgovnchsnhaneshtm
46 Public Health England and Food Standards Agency National Diet and Nutrition Survey results from years 1 to 4 (combined) of the rolling programme for 2008 and 2009 to 2011 and 2012 2014 wwwgovukgovernmentpublicationsnational-diet-and-nutrition-survey- results-from-years-1-to-4-combined-of-the-rolling-programme-for-2008-and-2009-to-2011-and-2012
47 Hippisley-Cox J Coupland C Robson J Sheikh A Brindle P Predicting risk of type 2 diabetes in England and Wales prospective derivation and validation of QDScore BMJ 2009338b880
48 Schmidt MI Duncan BB Bang H et al Identifying individuals at high risk for diabetes the Atherosclerosis Risk in Communities study Diabetes Care 2005282013-8
RESEARCH
No commercial reuse See rights and reprints httpwwwbmjcompermissions Subscribe httpwwwbmjcomsubscribe
49 Bhupathiraju SN Pan A Malik VS et al Caffeinated and caffeine- free beverages and risk of type 2 diabetes Am J Clin Nutr 2013 97155-66
50 De Koning L Malik VS Rimm EB Willett WC Hu FB Sugar-sweetened and artificially sweetened beverage consumption and risk of type 2 diabetes in men Am J Clin Nutr 2011931321-7
51 Bazzano LA Li TY Joshipura KJ Hu FB Intake of fruit vegetables and fruit juices and risk of diabetes in women Diabetes Care 2008311311-7
52 Eshak ES Iso H Mizoue T Inoue M Noda M Tsugane S Soft drink 100 fruit juice and vegetable juice intakes and risk of diabetes mellitus Clin Nutr 201332300-8
53 Montonen J Jarvinen R Knekt P Heliovaara M Reunanen A Consumption of sweetened beverages and intakes of fructose and glucose predict type 2 diabetes occurrence J Nutr 20071371447-54
54 Mursu J Virtanen JK Tuomainen T-P Nurmi T Voutilainen S Intake of fruit berries and vegetables and risk of type 2 diabetes in Finnish men the Kuopio Ischaemic Heart Disease Risk Factor Study Am J Clin Nutr 201499328-33
55 Duffey KJ Gordon-Larsen P Steffen LM et al Drinking caloric beverages increases the risk of adverse cardiometabolic outcomes in the Coronary Artery Risk Development in Young Adults (CARDIA) Study Am J Clin Nutr 201092954-9
56 Duffey KJ Steffen LM Van Horn L Jacobs DR Popkin BM Dietary patterns matter diet beverages and cardiometabolic risks in the longitudinal Coronary Artery Risk Development in Young Adults (CARDIA) Study Am J Clin Nutr 201295909-15
57 Odegaard AO Koh W-PP Arakawa K Yu MC Pereira MA Soft drink and juice consumption and risk of physician-diagnosed incident type 2 diabetes the Singapore Chinese Health Study Am J Epidemiol 2010171701-8
58 Palmer JR Boggs DA Krishnan S Hu FB Singer M Rosenberg L Sugar-sweetened beverages and incidence of type 2 diabetes mellitus in African American women Arch Intern Med 2008168 1487-92
59 Sakurai M Nakamura K Miura K et al Sugar-sweetened beverage and diet soda consumption and the 7-year risk for type 2 diabetes mellitus in middle-aged Japanese men Eur J Nutr 201453251-8
60 Schulze MB Manson JE Ludwig DS et al Sugar-sweetened beverages weight gain and incidence of type 2 diabetes in young and middle-aged women JAMA 2004292927-34
61 Pan A Malik VS Schulze MB Manson JE Willett WC Hu FB Plain-water intake and risk of type 2 diabetes in young and middle-aged women Am J Clin Nutr 2012951454-60
62 Pereira MA Parker ED Folsom AR Intake of sugar sweetened beverages fruit juice and incidence of type 2 diabetes A prospective study of postmenopausal women Diabetes 200554A258
63 Hayashino Y Fukuhara S Okamura T et al A prospective study of passive smoking and risk of diabetes in a cohort of workers the High-Risk and Population Strategy for Occupational Health Promotion (HIPOP-OHP) study Diabetes Care 200831732-4
64 Paynter NP Yeh H-CC Voutilainen S et al Coffee and sweetened beverage consumption and the risk of type 2 diabetes mellitus the atherosclerosis risk in communities study Am J Epidemiol 20061641075-84
65 Dhingra R Sullivan L Jacques PF et al Soft drink consumption and risk of developing cardiometabolic risk factors and the metabolic syndrome in middle-aged adults in the community Circulation 2007116480-8
66 Duffey KJ Steffen LM Van Horn L Jacobs DR Jr Popkin BM Dietary patterns matter diet beverages and cardiometabolic risks in the longitudinal Coronary Artery Risk Development in Young Adults (CARDIA) Study Am J Clin Nutr 201295909-15
67 International Diabetes Federatoin The Global Burden In IDF diabetes atlas 6th ed IDF 201329-49
68 Atkinson FS Foster-Powell K Brand-Miller JC International tables of glycemic index and glycemic load values 2008 Diabetes Care 2008312281-3
69 Livesey G Taylor R Livesey H Liu S Is there a dose-response relation of dietary glycemic load to risk of type 2 diabetes Meta-analysis of prospective cohort studies Am J Clin Nutr 201397584-96
70 Kellow NJ Savige GS Dietary advanced glycation end-product restriction for the attenuation of insulin resistance oxidative stress and endothelial dysfunction a systematic review Eur J Clin Nutr 201367239-48
71 Jiang X Zhang D Jiang W Coffee and caffeine intake and incidence of type 2 diabetes mellitus a meta-analysis of prospective studies Eur J Nutr 20145325-38
72 Fitzpatrick L Heaney RP Got soda J Bone Miner Metab 2003181570-2
73 Pepino MY Bourne C Non-nutritive sweeteners energy balance and glucose homeostasis Curr Opin Clin Nutr Metab Care 201114 391-5
74 Suez J Korem T Zeevi D et al Artificial sweeteners induce glucose intolerance by altering the gut microbiota Nature 2014514181-6
75 Crowe KM Murray E Deconstructing a fruit serving comparing the antioxidant density of select whole fruit and 100 fruit juices J Acad Nutr Diet 20131131354-8
76 Cooper AJ Forouhi NG Ye Z et al Fruit and vegetable intake and type 2 diabetes EPIC-InterAct prospective study and meta-analysis Eur J Clin Nutr 2012661082-92
77 De la Pentildea C Artificial sweetener as a historical window to culturally situated health Ann N Y Acad Sci 20101190159-65
78 Piernas C Tate DF Wang X Popkin BM Does diet-beverage intake affect dietary consumption patterns Results from the Choose Healthy Options Consciously Everyday (CHOICE) randomized clinical trial Am J Clin Nutr 201397604-11
79 Wojcicki JM Heyman MB Reducing childhood obesity by eliminating 100 fruit juice Am J Public Health 20121021630-3
copy BMJ Publishing Group Ltd 2015
Appendix supplementary material
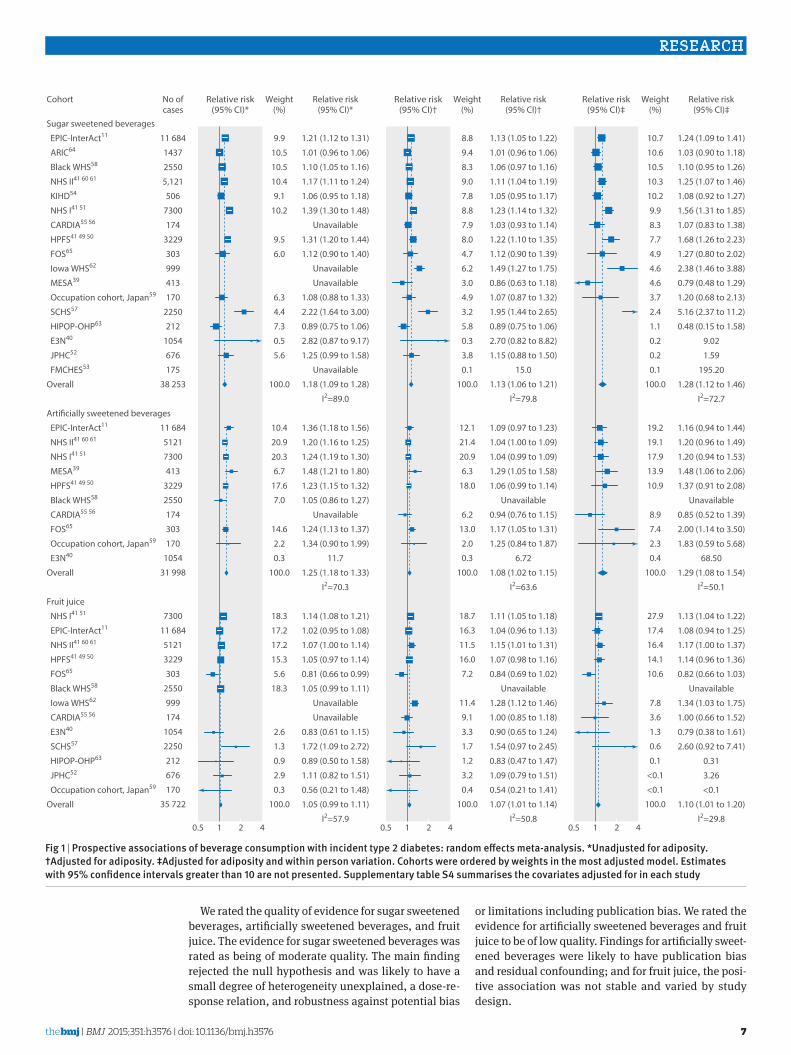
thethinspbmj | BMJ 2015101h1576 | doi1 020076bmjh1576
RESEARCH
7
We rated the quality of evidence for sugar sweetened beverages artificially sweetened beverages and fruit juice The evidence for sugar sweetened beverages was rated as being of moderate quality The main finding rejected the null hypothesis and was likely to have a small degree of heterogeneity unexplained a dose-re-sponse relation and robustness against potential bias
or limitations including publication bias We rated the evidence for artificially sweetened beverages and fruit juice to be of low quality Findings for artificially sweet-ened beverages were likely to have publication bias and residual confounding and for fruit juice the posi-tive association was not stable and varied by study design
Sugar sweetened beverages
EPIC-InterAct11
ARIC64
Black WHS58
NHS II41 60 61
KIHD54
NHS I41 51
CARDIA55 56
HPFS41 49 50
FOS65
Iowa WHS62
MESA39
Occupation cohort Japan59
SCHS57
HIPOP-OHP63
E3N40
JPHC52
FMCHES53
Overall
Arti13cially sweetened beverages
EPIC-InterAct11
NHS II41 60 61
NHS I41 51
MESA39
HPFS41 49 50
Black WHS58
CARDIA55 56
FOS65
Occupation cohort Japan59
E3N40
Overall
Fruit juice
NHS I41 51
EPIC-InterAct11
NHS II41 60 61
HPFS41 49 50
FOS65
Black WHS58
Iowa WHS62
CARDIA55 56
E3N40
SCHS57
HIPOP-OHP63
JPHC52
Occupation cohort Japan59
Overall
05 1 2 4
Cohort Relative risk(95 CI)
121 (112 to 131)
101 (096 to 106)
110 (105 to 116)
117 (111 to 124)
106 (095 to 118)
139 (130 to 148)
Unavailable
131 (120 to 144)
112 (090 to 140)
Unavailable
Unavailable
108 (088 to 133)
222 (164 to 300)
089 (075 to 106)
282 (087 to 917)
125 (099 to 158)
Unavailable
118 (109 to 128)
I2=890
136 (118 to 156)
120 (116 to 125)
124 (119 to 130)
148 (121 to 180)
123 (115 to 132)
105 (086 to 127)
Unavailable
124 (113 to 137)
134 (090 to 199)
117
125 (118 to 133)
I2=703
114 (108 to 121)
102 (095 to 108)
107 (100 to 114)
105 (097 to 114)
081 (066 to 099)
105 (099 to 111)
Unavailable
Unavailable
083 (061 to 115)
172 (109 to 272)
089 (050 to 158)
111 (082 to 151)
056 (021 to 148)
105 (099 to 111)
I2=579
99
105
105
104
91
102
95
60
63
44
73
05
56
1000
104
209
203
67
176
70
146
22
03
1000
183
172
172
153
56
183
26
13
09
29
03
1000
Relative risk(95 CI)
Weight()
05 1 2 4 05 1 2 4
Relative risk(95 CI)dagger
113 (105 to 122)
101 (096 to 106)
106 (097 to 116)
111 (104 to 119)
105 (095 to 117)
123 (114 to 132)
103 (093 to 114)
122 (110 to 135)
112 (090 to 139)
149 (127 to 175)
086 (063 to 118)
107 (087 to 132)
195 (144 to 265)
089 (075 to 106)
270 (082 to 882)
115 (088 to 150)
150
113 (106 to 121)
I2=798
109 (097 to 123)
104 (100 to 109)
104 (099 to 109)
129 (105 to 158)
106 (099 to 114)
Unavailable
094 (076 to 115)
117 (105 to 131)
125 (084 to 187)
672
108 (102 to 115)
I2=636
111 (105 to 118)
104 (096 to 113)
115 (101 to 131)
107 (098 to 116)
084 (069 to 102)
Unavailable
128 (112 to 146)
100 (085 to 118)
090 (065 to 124)
154 (097 to 245)
083 (047 to 147)
109 (079 to 151)
054 (021 to 141)
107 (101 to 114)
I2=508
88
94
83
90
78
88
79
80
47
62
30
49
32
58
03
38
01
1000
121
214
209
63
180
62
130
20
03
1000
187
163
115
160
72
114
91
33
17
12
32
04
1000
Relative risk(95 CI)dagger
Weight()
Relative risk(95 CI)Dagger
124 (109 to 141)
103 (090 to 118)
110 (095 to 126)
125 (107 to 146)
108 (092 to 127)
156 (131 to 185)
107 (083 to 138)
168 (126 to 223)
127 (080 to 202)
238 (146 to 388)
079 (048 to 129)
120 (068 to 213)
516 (237 to 112)
048 (015 to 158)
902
159
19520
128 (112 to 146)
I2=727
116 (094 to 144)
120 (096 to 149)
120 (094 to 153)
148 (106 to 206)
137 (091 to 208)
Unavailable
085 (052 to 139)
200 (114 to 350)
183 (059 to 568)
6850
129 (108 to 154)
I2=501
113 (104 to 122)
108 (094 to 125)
117 (100 to 137)
114 (096 to 136)
082 (066 to 103)
Unavailable
134 (103 to 175)
100 (066 to 152)
079 (038 to 161)
260 (092 to 741)
031
326
lt01
110 (101 to 120)
I2=298
107
106
105
103
102
99
83
77
49
46
46
37
24
11
02
02
01
1000
192
191
179
139
109
89
74
23
04
1000
279
174
164
141
106
78
36
13
06
01
lt01
lt01
1000
Relative risk(95 CI)Dagger
Weight()
11 684
1437
2550
5121
506
7300
174
3229
303
999
413
170
2250
212
1054
676
175
38 253
11 684
5121
7300
413
3229
2550
174
303
170
1054
31 998
7300
11 684
5121
3229
303
2550
999
174
1054
2250
212
676
170
35 722
No ofcases
Fig 1 | Prospective associations of beverage consumption with incident type 2 diabetes random effects meta-analysis unadjusted for adiposity daggeradjusted for adiposity Daggeradjusted for adiposity and within person variation Cohorts were ordered by weights in the most adjusted model estimates with 95 confidence intervals greater than 10 are not presented supplementary table s4 summarises the covariates adjusted for in each study
doi1 020076bmjh1576 | BMJ 2015101h1576 | thethinspbmj
RESEARCH
8
type 2 diabetes risk attributable to sugar sweetened beveragesOverall sugar sweetened beverages were consumed by 544 of people in the USA and 494 in the UK Of a total population the mean consumption of sugar sweetened beverages was 284 (SD 412) gday in the USA and 114 (SD 157) gday in the UK (fig 3 and supplemen-tary table S7) Absolute event rates over 10 years from 2010 were estimated to be 110 in the USA (209 mil-lion events) and 58 in the UK (26 million events) Assuming a causal effect of consumption of sugar sweetened beverages partly mediated by obesity status
(adiposity unadjusted) consumption in the USA would result in 26 million excess events of type 2 diabetes over 10 years (population attributable fraction 119 95 confidence interval 74 to 165) and 126 000 excess events in the UK (population attributable fraction 49 30 to 72) Assuming a causal effect of consumption of sugar sweetened beverages independent of obesity status (adiposity adjusted) consumption would result in 18 million excess events in the USA (population attributable fraction 87 39 to 129) and 79 000 excess events in the UK (population attributable frac-tion 36 17 to 56) Younger adults and men would have greater numbers of type 2 diabetes events related to consumption of sugar sweetened beverages than older adults and women respectively (fig 3 and supple-mentary table S7) The greater the uncertainty accounted for the lesser the precision was computed (see supplementary figure S5) For example if I2=50 the population attributable fraction of 119 in the USA would have a 95 confidence interval of 52 to 183 but remained significant from 0 for the relative risks we estimated
discussionIn this systematic review and meta-analysis we have produced summary evidence that habitual consump-tion of sugar sweetened beverages artificially sweet-ened beverages and fruit juice was prospectively associated with incident type 2 diabetes independently of adiposity Sensitivity analyses consistently sup-ported the positive association of sugar sweetened bev-erages with incident type 2 diabetes In contrast the association between artificially sweetened beverages or fruit juice and incident type 2 diabetes was less evident For artificially sweetened beverages potential publica-tion bias and residual confounding were likely to exist For fruit juice the finding seemed to be unstable and was sensitive to study design Under assumption of cau-sality for the association of consumption of sugar sweetened beverages with incidence of type 2 diabetes we provided efficacy estimates that over 10 years two million type 2 diabetes events in the USA and 80 000 in the UK would be related to consumption of sugar sweet-ened beverages
strengths and limitations of this reviewThis study has limitations typical of observational stud-ies and meta-analysis Residual confounding could exist37 Confounding by socioeconomic and dietary factors was not detected to be strong in published stud-ies However measures of these variables were likely to involve errors such that residual confounding persisted in individual studies and our meta-analysis Addition-ally lifestyle factors and adiposity could change over time The time varying characteristics might not be ran-dom and could result in bias in an unknown direction Reverse causality could also exist because of unmea-sured comorbid conditions and health consciousness that might alter consumption of beverages particularly artificially sweetened ones and risk of type 2 diabetes Weakness of meta-analysis includes the exclusion of
Precision (1standard error)
Rela
tive
risk
Sugar sweetened beverages
0 4 8 12 1601
05
025
1
2
4
10
Precision (1standard error)
Rela
tive
risk
Fruit juice
0 10 20 30025
05
1
2
4
Precision (1standard error)
Rela
tive
risk
Articially sweetened beverages
0 2 4 6 8 1001
05
025
1
2
4
10
Eggerrsquos test P=040
Eggerrsquos test P=003
Eggerrsquos test P=069
Fig 2 | Funnel plot for associations of sugar sweetened beverages artificially sweetened beverages and fruit juice with incident type 2 diabetes Dots represent point estimates plotted over precision measures (1standard error) estimates outside each panel are not presented horizontal lines represent summary estimates and 95 confidence intervals across precision shaded areas represent any of a single estimate that if included would make the summary estimate insignificant (Pgt005) P values by eggerrsquos test are presented for fruit juice estimates with greater precision indicated stronger positive association
thethinspbmj | BMJ 2015101h1576 | doi1 020076bmjh1576
RESEARCH
9
eligible cohorts for lack of information Our meta- analysis included statistical approximation that might involve errors For example we derived dose-response esti-mates partly from categorical estimates and odds ratios Without such approximations analysis standardised across different cohorts is of future interest to character-ise associations between various beverages and risks of type 2 diabetes Finally assessments of bias and quality of evidence involved subjectivity although we objec-tively examined the influence of potential bias in tests for heterogeneity and sensitivity analyses
One strength of this study was in estimating popula-tion attributable fraction for risks of type 2 diabetes related to consumption of sugar sweetened beverages in the USA and UK using data on beverage consumption for each individual While a few studies estimated how much taxation on sugar sweetened beverages influ-enced risk of obesity and type 2 diabetes12-14 no study examined the population impact by combining esti-mates for consumption of sugar sweetened beverages in multiple populations predicted the risk of type 2 diabe-tes by using a validated algorithm or provided quanti-tative evidence on the association of consumption of sugar sweetened beverages with incidence of type 2 diabetes However the population attributable fraction was limited in precision owing to underlying relative risks and uncertainty in generalisability The other lim-itations are that we estimated the population attribut-able fraction under the assumption of causality although it has not been established and the assump-tion that there would be no change over time in lifestyle associated with consumption of sugar sweetened bever-ages Future work should seek to improve precision of evidence and to characterise efficacy and effectiveness of policy interventions for different populations Gener-alisability should be exploredmdashfor example for popu-lations in Central and South America with the highest recorded per capita sales of sugar sweetened beverages in the world and China and India where the highest
prevalence of type 2 diabetes is expected1 67 To mini-mise limitations typical of observational research and understand effectiveness of a policy intervention in dif-ferent populations future research should also include randomised trials examining peoplersquos health and behaviours and informing effectiveness
interpretation in relation to other studiesOther quantitative reviews have been published recently4 5 9 None of them quantified the population attributable fraction One meta-analysis evaluated the influence of adiposity on the association of sugar sweet-ened beverages and type 2 diabetes based on three stud-ies but not artificially sweetened beverages or fruit juice5 For sugar sweetened beverages we evaluated a greater number of type 2 diabetes cases (38 285 v 19 054) and studies (17 v 3) including bias assessments and sensitivity analyses For fruit juice and artificially sweetened beverages we evaluated a greater number of studies than previous work (9 v 4 and 12 v 4 respec-tively) and drew conclusions based on assessment of the influences of adiposity and potential bias that were found to be important
The plausibility of our findings deserves discussion Detrimental effects of sugar sweetened beverages inde-pendent of obesity may exist Sugars in sugar sweet-ened beverages acutely increased blood glucose levels and have a high glycaemic index (80 to 110100 of white bread) a risk factor for type 2 diabetes68 69 Fructose in sugar sweetened beverages promotes hepatic lipogene-sis and further insulin resistance2 Effects of caramels for colouring beverages70 caffeine49 71 phosphoric acid72 and other constituents may also exist These non-glycaemic effects may be present in artificially sweetened beverages if such beverages truly increase the risk of type 2 diabetes Artificially sweetened bever-ages might have effects on hormones microbiota and taste preference but evidence for these remains weak6 73 74 Adverse effects of fruit juice would be
United States
Suga
r sw
eete
ned
beve
rage
(gd
ay)
0
200
300
500
400
100
110
189
10 year risk for type 2 diabetes ()
No at risk (millions)
75
98
141
65
111
90
110
45
165
27
United Kingdom
Age (years)
PAF
for t
ype
2 di
abet
es
All0
10
15
25
20
5
20-44 45-64 Men Womenge65
Age (years)
All 20-44 45-64 Men Womenge65
58
45
21
21
80
15
55
21
61
23
107
9
PAF unadjusted for adiposityMean sugar sweetened beverage consumptionPAF adjusted for adiposity
Fig 3 | Consumption of sugar sweetened beverages and population attributable fraction (PaF) for type 2 diabetes in the united states and the united Kingdom Circles represent mean of consumption of sugar sweetened beverages (left axis) and each bar represents PaF () for type 2 diabetes due to consumption of sugar sweetened beverages (right axis) absolute event rates over 10 years were 110 in the usa (209 million events) and 58 in the uK (26 million events) (see supplementary table 7)
doi1 020076bmjh1576 | BMJ 2015101h1576 | thethinspbmj
RESEARCH
10
present because of its moderately high glycaemic index (50-80)68 Healthful constituents may exist but decrease during processing7 75 This explains why our finding was discordant with the inverse association of consum-ing fruits as food with type 2 diabetes76
Our analysis indicated possible publication bias for the associations between artificially sweetened bever-ages and type 2 diabetes The bias toward a false posi-tive finding would be plausible according to existing public interest over the health effects6 77 The finding at least underscores potential low quality of evidence and the need for cautious interpretation Residual confounding in the finding for artificially sweetened beverages is also plausible because adults at high risk of type 2 diabetes preferentially consumed more artifi-cially sweetened beverages5 6 8 10 11 36 Confounding in the opposite direction in the finding for fruit juice is also plausible because leaner adults at lower risk of type 2 diabetes consumed more fruit juice10 11 These observations provide research and clinical implications for better understanding of health seeking behaviours related to beverage consumption6 78
Clinical and public health implicationsAlthough causality has not been established our find-ings and available evidence indicate a benefit of reduc-ing the consumption of sugar sweetened beverages for the primary prevention of type 2 diabetes In the same context our findings also imply that consumption of artificially sweetened beverages or fruit juice is not likely to reduce the risk of type 2 diabetes and thus not suitable as a healthy option None the less the lower caloric intake of artificially sweetened beverages may be of clinical benefit in obese or overweight adults by helping to reduce body weight6 78 This effect on body weight should be considered separately from our study which could not rule out the effect of body weight on beverage consumption8 Additionally clinical applica-tions of our finding deserve further appraisal about the effects of altering beverage consumption on changes in lifestyle behaviours and on risks of other clinical outcomes3 6 8
Our findings have strong public health implications Despite the limitations of this review the current con-sumption of sugar sweetened beverages was estimated to cause approximately two million excess events of type 2 diabetes in the USA and 80 000 in the UK over 10 years This could cost nearly pound120bn in the USA and pound206m in the UK ($9800 in the USA and $3994 in the UK per patient67 $1 (pound065 euro091 as of 7 July 2015) In future our work on efficacy should be extended to that on effectiveness to identify needs for interventions In addition to observational evidence trial evidence should be available accounting for the effects on car-diometabolic health and lifestyle change associated with a possible intervention8 78 Despite a population attributable fraction of no more than 20 effectiveness should be evaluated for different populations as an estimated 592 million adults globally will have type 2 diabetes in 20351 67 Additionally the average popula-tion attributable fraction of no more than 20 confirms
the importance of modifying multiple lifestyle risk fac-tors rather than a single dietary component for the pri-mary prevention of type 2 diabetes For artificially sweetened beverages and fruit juice our findings inform little benefit of using them as an alternative to sugar sweetened beverages In addition fruit juice con-sumption should not be a part of dietary recommenda-tions for greater consumption of fruits and vegetables as suggested to limit fruit juice consumption among children7 79
ConclusionsObservational cohort studies support that consumption of sugar sweetened beverages is associated with inci-dent type 2 diabetes and independently of adiposity This finding was stable in sensitivity analyses assessing influence of population characteristics potential resid-ual confounding and publication bias By contrast although artificially sweetened beverages and fruit juice showed a positive association with incident type 2 diabetes the quality of evidence is limited by potential bias and heterogeneity by study design Although cau-sality has not been established and precision needs to be improved this study informs the potential efficacy of reducing the consumption of sugar sweetened bever-ages in a contemporary population Moreover findings support that neither artificially sweetened beverages nor fruit juice are suitable alternatives to sugar sweet-ened beverages for the prevention of type 2 diabetes The following contributors provided additional information Emilie Rossignol Guy Fagherazzi Franccediloise Clavel-Chapelon and Beverley Balkau Center for Research in Epidemiology and Population Health Villejuif Cedex France Tomonori Okamura Department of Preventive Medicine and Public Health Keio University School of Medicine Tokyo Japan and Hirotsugu Ueshima Department of Health Science and Center for Epidemiologic Research in Asia Sari Voutilainen Institute of Public Health and Clinical Nutrition Kuopio Finland Frank B Hu Harvard T H Chan School of Public Health Boston Massachusetts USA Manabu Sakurai Department of Epidemiology and Public Health Kanazawa Medical University Uchinada Ishikawa Japan Paul F Jacques Nicola M McKeown and Ma Jiantao Human Nutrition Research Center on Aging Tufts University Boston Massachusetts USAContributors FI and NGF conceived the study FI LOrsquoC YZ and NGF designed the study FI LOrsquoC and YZ undertook the literature search and extracted data FI JM YH and SNB did data analysis FI LOrsquoC YZ and NGF interpreted data FI developed the first draft FI as guarantor accepts full responsibility for the work and the conduct of the study had access to the data and controlled the decision to publish All authors provided critical comments and approved the final version The sponsor of the study had no role in design and conduct of the study collection management analysis and interpretation of the data preparation review or approval of the manuscript and decision to submit the manuscript for publication The corresponding author had full access to all the data in the study and had final responsibility for the decision to submit for publication Funding This study was funded by the Medical Research Council Epidemiology Unit Core Support (MC_UU_120155) SNB was supported by an American Heart Association postdoctoral fellowship grant (13POST14370012) Competing interests All authors have completed the ICMJE uniform disclosure form at wwwicmjeorgcoi_disclosurepdf and declare no support from any organisation for the submitted work no financial relationships with any organisations that might have an interest in the submitted work in the previous three years no other relationships or activities that could appear to have influenced the submitted workEthical approval Not requiredData sharing A protocol and data for tables and figures are available on request
thethinspbmj | BMJ 2015101h1576 | doi1 020076bmjh1576
RESEARCH
11
Transparency The guarantor (FI) affirms that the manuscript is an honest accurate and transparent account of the study being reported that no important aspects of the study have been omitted and that any discrepancies from the study as planned have been explained as post hoc analysis Data sharing is available from the corresponding author
This is an Open Access article distributed in accordance with the terms of the Creative Commons Attribution (CC BY 40) license which permits others to distribute remix adapt and build upon this work for commercial use provided the original work is properly cited See httpcreativecommonsorglicensesby40
1 Basu S McKee M Galea G Stuckler D Relationship of soft drink consumption to global overweight obesity and diabetes a cross-national analysis of 75 countries Am J Public Health 20131032071-7
2 Stanhope KL Role of fructose-containing sugars in the epidemics of obesity and metabolic syndrome Annu Rev Med 201263329-43
3 Weed DL Althuis MD Mink PJ Quality of reviews on sugar-sweetened beverages and health outcomes a systematic review Am J Clin Nutr 2011941340-7
4 Malik VS Popkin BM Bray GA et al Sugar-sweetened beverages and risk of metabolic syndrome and type 2 diabetes a meta-analysis Diabetes Care 2010332477-83
5 Greenwood DC Threapleton DE Evans CEL et al Association between sugar-sweetened and artificially sweetened soft drinks and type 2 diabetes systematic review and dose-response meta-analysis of prospective studies Br J Nutr 2014112725-34
6 Gardner C Wylie-Rosett J Gidding SS et al Nonnutritive sweeteners current use and health perspectives a scientific statement from the American Heart Association and the American Diabetes Association Circulation 2012126509-19
7 Slavin JL Lloyd B Health benefits of fruits and vegetables Adv Nutr 20123506-16
8 Malik VS Popkin BM Bray GA Despreacutes J-P Hu FB Sugar-sweetened beverages obesity type 2 diabetes mellitus and cardiovascular disease risk Circulation 20101211356-64
9 Xi B Li S Liu Z et al Intake of fruit juice and incidence of type 2 diabetes a systematic review and meta-analysis PloS One 20149e93471
10 Bleich SN Wolfson JA Vine S Wang YC Diet-beverage consumption and caloric intake among US adults overall and by body weight Am J Public Health 2014104e72-8
11 The InterAct Consortium Consumption of sweet beverages and type 2 diabetes incidence in European adults results from EPIC-InterAct Diabetologia 2013561520-30
12 Basu S Vellakkal S Agrawal S Stuckler D Popkin B Ebrahim S Averting obesity and type 2 diabetes in India through sugar-sweetened beverage taxation an economic-epidemiologic modeling study PLoS Med 201411e1001582
13 Brownell KD Farley T Willett WC et al The public health and economic benefits of taxing sugar-sweetened beverages N Engl J Med 20093611599-605
14 Briggs ADM Mytton OT Kehlbacher A Tiffin R Rayner M Scarborough P Overall and income specific effect on prevalence of overweight and obesity of 20 sugar sweetened drink tax in UK econometric and comparative risk assessment modelling study BMJ 2013347f6189
15 Liberati A Altman DG Tetzlaff J et al The PRISMA statement for reporting systematic reviews and meta-analyses of studies that evaluate healthcare interventions explanation and elaboration BMJ 2009339b2700
16 The Diabetes Prevention Program Research Group Diabetes Prevention Program Research Group Knowler WC et al Reduction in the incidence of type 2 diabetes with lifestyle intervention or metformin N Engl J Med 2002346393-403
17 Franco M Bilal U Orduntildeez P et al Population-wide weight loss and regain in relation to diabetes burden and cardiovascular mortality in Cuba 1980-2010 repeated cross sectional surveys and ecological comparison of secular trends BMJ 2013346f1515
18 Willett WC Howe GR Kushi LH Adjustment for total energy intake in epidemiologic studies Am J Clin Nutr 1997651220S-8S discussion 1229S-31S
19 Higgins JP Altman DG Gotzsche PC et al The Cochrane Collaborationrsquos tool for assessing risk of bias in randomised trials BMJ 2011343d5928
20 Sterne JA Higgins JP Reeves BC on behalf of the development group for ACROBAT-NRSI A A Cochrane risk of bias assessment tool for non-randomized studies of interventions version 100 September 2014 2014 wwwriskofbiasinfo
21 Higgins J Assessing risk of bias in included studies In Higgins J Green S eds Cochrane handbook for systematic reviews of interventions Cochrane Collaboration 20081-50
22 Schuumlnemann H Brożek J Oxman GGA Handbook for grading the quality of evidence and the strength of recommendations using the GRADE approach 2013 wwwguidelinedevelopmentorghandbook
23 Zhang J Yu KF Whatrsquos the relative risk A method of correcting the odds ratio in cohort studies of common outcomes JAMA 19982801690
24 Greenland S Longnecker MP Methods for trend estimation from summarized dose-response data with applications to meta-analysis Am J Epidemiol 19921351301-9
25 Higgins JP Thompson SG Quantifying heterogeneity in a meta-analysis Stat Med 2002211539-58
26 Walter WC Correction for the effects of measurement error In Willett WC ed Nutritional epidemiology 3rd ed Oxford University Press 2012
27 MacMahon S Peto R Cutler J et al Blood pressure stroke and coronary heart disease Part 1 prolonged differences in blood pressure prospective observational studies corrected for the regression dilution bias Lancet 1990335765-74
28 Carroll RJ Stefanski LA Measurement error instrumental variables and corrections for attenuation with applications to meta-analyses Stat Med 1994131265-82
29 Prospective Studies Collaboration Blood cholesterol and vascular mortality by age sex and blood pressure a meta-analysis of individual data from 61 prospective studies with 55 000 vascular deaths Lancet 20073701829-39
30 Di Angelantonio E Sarwar N Perry P et al Major lipids apolipoproteins and risk of vascular disease JAMA 20093021993-2000
31 Hunter DJ Spiegelman D Adami HO et al Cohort studies of fat intake and the risk of breast cancer--a pooled analysis N Engl J Med 1996334356-61
32 Greenland S Quantitative methods in the review of epidemiologic literature Epidemiol Rev 198791-30
33 Brenner H Gefeller O Use of the positive predictive value to correct for disease misclassification in epidemiologic studies Am J Epidemiol 19931381007-15
34 Jonathan E Sterne AC Egger M Moher D Bias C Addressing reporting biases In Higgins J Green S eds Cochrane handbook for systematic reviews of interventions Cochrane Collaboration 20081-33
35 Lash TL Fink AK Semi-automated sensitivity analysis to assess systematic errors in observational data Epidemiology 200314 451-8
36 Sun Q van Dam RM Spiegelman D Heymsfield SB Willett WC Hu FB Comparison of dual-energy x-ray absorptiometric and anthropometric measures of adiposity in relation to adiposity-related biologic factors Am J Epidemiol 20101721442-54
37 Smith GD Phillips AN Inflation in epidemiology ldquothe proof and measurement of association between two thingsrdquo revisited BMJ 19963121659-61
38 Bray GA Energy and fructose from beverages sweetened with sugar or high-fructose corn syrup pose a health risk for some people Adv Nutr 20134220-5
39 Nettleton JA Lutsey PL Wang Y et al Diet soda intake and risk of incident metabolic syndrome and type 2 diabetes in the Multi-Ethnic Study of Atherosclerosis (MESA) Diabetes Care 200932688-9440
40 Fagherazzi G Vilier A Saes Sartorelli D Lajous M Balkau B Clavel-Chapelon F Consumption of artificially and sugar-sweetened beverages and incident type 2 diabetes in the Etude Epidemiologique aupres des femmes de la Mutuelle Generale de lrsquoEducation Nationale-European Prospective Investigation into Cancer and Nutrition cohort Am J Clin Nutr 201397517-23
41 Muraki I Imamura F Manson JE et al Fruit consumption and risk of type 2 diabetes results from three prospective longitudinal cohort studies BMJ 2013347f5001
42 Cook JR Stefanski LA Simulation-extrapolation estimation in parametric measurement error models J Am Stat Assoc 1994891314-28
43 Greenland S Estimation of population attributable fractions from fitted incidence ratios and exposure survey data with an application to electromagnetic fields and childhood leukemia Biometrics 200157182-8
44 Schuumlnemann AHJ Oxman AD Vist GE Higgins JPT Jonathan J Interpreting results and drawing conclusions In Higgins J Green S eds Cochrane Handbook for Systematic Reviews of Interventions Cochrane Collaboration 20081-24
45 National Center for Health Statistics National Health and Nutrition Examination Survey NHANES (2009-2010) 2005 wwwcdcgovnchsnhaneshtm
46 Public Health England and Food Standards Agency National Diet and Nutrition Survey results from years 1 to 4 (combined) of the rolling programme for 2008 and 2009 to 2011 and 2012 2014 wwwgovukgovernmentpublicationsnational-diet-and-nutrition-survey- results-from-years-1-to-4-combined-of-the-rolling-programme-for-2008-and-2009-to-2011-and-2012
47 Hippisley-Cox J Coupland C Robson J Sheikh A Brindle P Predicting risk of type 2 diabetes in England and Wales prospective derivation and validation of QDScore BMJ 2009338b880
48 Schmidt MI Duncan BB Bang H et al Identifying individuals at high risk for diabetes the Atherosclerosis Risk in Communities study Diabetes Care 2005282013-8
RESEARCH
No commercial reuse See rights and reprints httpwwwbmjcompermissions Subscribe httpwwwbmjcomsubscribe
49 Bhupathiraju SN Pan A Malik VS et al Caffeinated and caffeine- free beverages and risk of type 2 diabetes Am J Clin Nutr 2013 97155-66
50 De Koning L Malik VS Rimm EB Willett WC Hu FB Sugar-sweetened and artificially sweetened beverage consumption and risk of type 2 diabetes in men Am J Clin Nutr 2011931321-7
51 Bazzano LA Li TY Joshipura KJ Hu FB Intake of fruit vegetables and fruit juices and risk of diabetes in women Diabetes Care 2008311311-7
52 Eshak ES Iso H Mizoue T Inoue M Noda M Tsugane S Soft drink 100 fruit juice and vegetable juice intakes and risk of diabetes mellitus Clin Nutr 201332300-8
53 Montonen J Jarvinen R Knekt P Heliovaara M Reunanen A Consumption of sweetened beverages and intakes of fructose and glucose predict type 2 diabetes occurrence J Nutr 20071371447-54
54 Mursu J Virtanen JK Tuomainen T-P Nurmi T Voutilainen S Intake of fruit berries and vegetables and risk of type 2 diabetes in Finnish men the Kuopio Ischaemic Heart Disease Risk Factor Study Am J Clin Nutr 201499328-33
55 Duffey KJ Gordon-Larsen P Steffen LM et al Drinking caloric beverages increases the risk of adverse cardiometabolic outcomes in the Coronary Artery Risk Development in Young Adults (CARDIA) Study Am J Clin Nutr 201092954-9
56 Duffey KJ Steffen LM Van Horn L Jacobs DR Popkin BM Dietary patterns matter diet beverages and cardiometabolic risks in the longitudinal Coronary Artery Risk Development in Young Adults (CARDIA) Study Am J Clin Nutr 201295909-15
57 Odegaard AO Koh W-PP Arakawa K Yu MC Pereira MA Soft drink and juice consumption and risk of physician-diagnosed incident type 2 diabetes the Singapore Chinese Health Study Am J Epidemiol 2010171701-8
58 Palmer JR Boggs DA Krishnan S Hu FB Singer M Rosenberg L Sugar-sweetened beverages and incidence of type 2 diabetes mellitus in African American women Arch Intern Med 2008168 1487-92
59 Sakurai M Nakamura K Miura K et al Sugar-sweetened beverage and diet soda consumption and the 7-year risk for type 2 diabetes mellitus in middle-aged Japanese men Eur J Nutr 201453251-8
60 Schulze MB Manson JE Ludwig DS et al Sugar-sweetened beverages weight gain and incidence of type 2 diabetes in young and middle-aged women JAMA 2004292927-34
61 Pan A Malik VS Schulze MB Manson JE Willett WC Hu FB Plain-water intake and risk of type 2 diabetes in young and middle-aged women Am J Clin Nutr 2012951454-60
62 Pereira MA Parker ED Folsom AR Intake of sugar sweetened beverages fruit juice and incidence of type 2 diabetes A prospective study of postmenopausal women Diabetes 200554A258
63 Hayashino Y Fukuhara S Okamura T et al A prospective study of passive smoking and risk of diabetes in a cohort of workers the High-Risk and Population Strategy for Occupational Health Promotion (HIPOP-OHP) study Diabetes Care 200831732-4
64 Paynter NP Yeh H-CC Voutilainen S et al Coffee and sweetened beverage consumption and the risk of type 2 diabetes mellitus the atherosclerosis risk in communities study Am J Epidemiol 20061641075-84
65 Dhingra R Sullivan L Jacques PF et al Soft drink consumption and risk of developing cardiometabolic risk factors and the metabolic syndrome in middle-aged adults in the community Circulation 2007116480-8
66 Duffey KJ Steffen LM Van Horn L Jacobs DR Jr Popkin BM Dietary patterns matter diet beverages and cardiometabolic risks in the longitudinal Coronary Artery Risk Development in Young Adults (CARDIA) Study Am J Clin Nutr 201295909-15
67 International Diabetes Federatoin The Global Burden In IDF diabetes atlas 6th ed IDF 201329-49
68 Atkinson FS Foster-Powell K Brand-Miller JC International tables of glycemic index and glycemic load values 2008 Diabetes Care 2008312281-3
69 Livesey G Taylor R Livesey H Liu S Is there a dose-response relation of dietary glycemic load to risk of type 2 diabetes Meta-analysis of prospective cohort studies Am J Clin Nutr 201397584-96
70 Kellow NJ Savige GS Dietary advanced glycation end-product restriction for the attenuation of insulin resistance oxidative stress and endothelial dysfunction a systematic review Eur J Clin Nutr 201367239-48
71 Jiang X Zhang D Jiang W Coffee and caffeine intake and incidence of type 2 diabetes mellitus a meta-analysis of prospective studies Eur J Nutr 20145325-38
72 Fitzpatrick L Heaney RP Got soda J Bone Miner Metab 2003181570-2
73 Pepino MY Bourne C Non-nutritive sweeteners energy balance and glucose homeostasis Curr Opin Clin Nutr Metab Care 201114 391-5
74 Suez J Korem T Zeevi D et al Artificial sweeteners induce glucose intolerance by altering the gut microbiota Nature 2014514181-6
75 Crowe KM Murray E Deconstructing a fruit serving comparing the antioxidant density of select whole fruit and 100 fruit juices J Acad Nutr Diet 20131131354-8
76 Cooper AJ Forouhi NG Ye Z et al Fruit and vegetable intake and type 2 diabetes EPIC-InterAct prospective study and meta-analysis Eur J Clin Nutr 2012661082-92
77 De la Pentildea C Artificial sweetener as a historical window to culturally situated health Ann N Y Acad Sci 20101190159-65
78 Piernas C Tate DF Wang X Popkin BM Does diet-beverage intake affect dietary consumption patterns Results from the Choose Healthy Options Consciously Everyday (CHOICE) randomized clinical trial Am J Clin Nutr 201397604-11
79 Wojcicki JM Heyman MB Reducing childhood obesity by eliminating 100 fruit juice Am J Public Health 20121021630-3
copy BMJ Publishing Group Ltd 2015
Appendix supplementary material
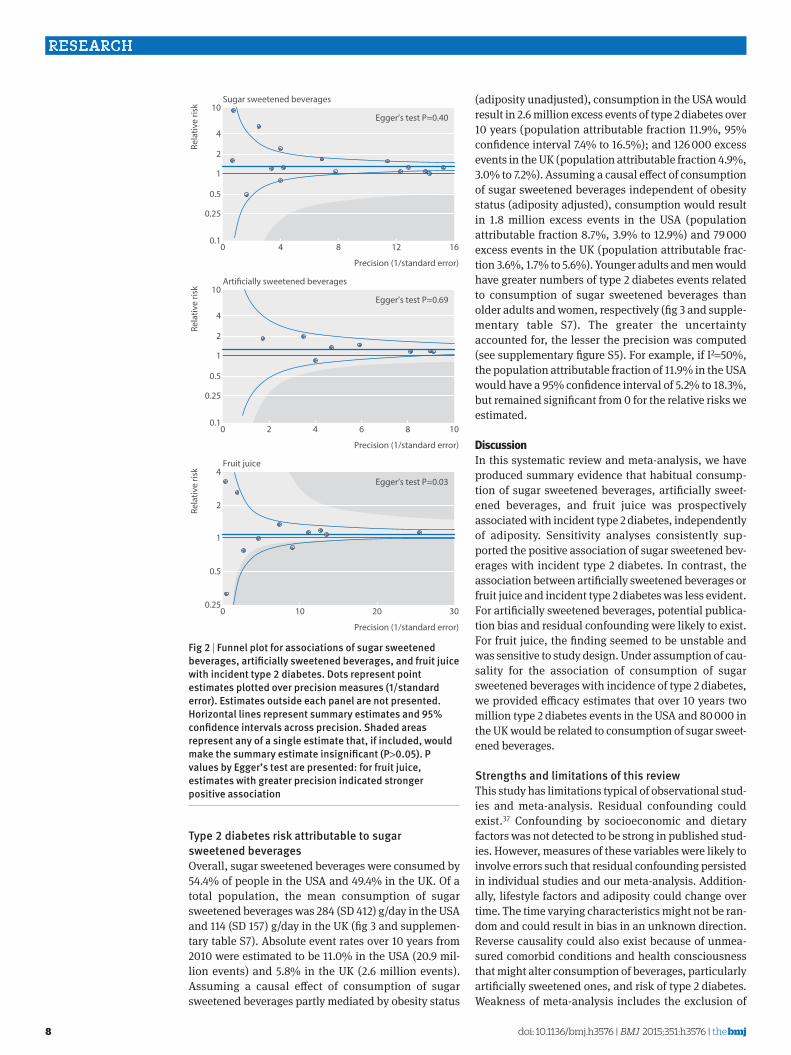
doi1 020076bmjh1576 | BMJ 2015101h1576 | thethinspbmj
RESEARCH
8
type 2 diabetes risk attributable to sugar sweetened beveragesOverall sugar sweetened beverages were consumed by 544 of people in the USA and 494 in the UK Of a total population the mean consumption of sugar sweetened beverages was 284 (SD 412) gday in the USA and 114 (SD 157) gday in the UK (fig 3 and supplemen-tary table S7) Absolute event rates over 10 years from 2010 were estimated to be 110 in the USA (209 mil-lion events) and 58 in the UK (26 million events) Assuming a causal effect of consumption of sugar sweetened beverages partly mediated by obesity status
(adiposity unadjusted) consumption in the USA would result in 26 million excess events of type 2 diabetes over 10 years (population attributable fraction 119 95 confidence interval 74 to 165) and 126 000 excess events in the UK (population attributable fraction 49 30 to 72) Assuming a causal effect of consumption of sugar sweetened beverages independent of obesity status (adiposity adjusted) consumption would result in 18 million excess events in the USA (population attributable fraction 87 39 to 129) and 79 000 excess events in the UK (population attributable frac-tion 36 17 to 56) Younger adults and men would have greater numbers of type 2 diabetes events related to consumption of sugar sweetened beverages than older adults and women respectively (fig 3 and supple-mentary table S7) The greater the uncertainty accounted for the lesser the precision was computed (see supplementary figure S5) For example if I2=50 the population attributable fraction of 119 in the USA would have a 95 confidence interval of 52 to 183 but remained significant from 0 for the relative risks we estimated
discussionIn this systematic review and meta-analysis we have produced summary evidence that habitual consump-tion of sugar sweetened beverages artificially sweet-ened beverages and fruit juice was prospectively associated with incident type 2 diabetes independently of adiposity Sensitivity analyses consistently sup-ported the positive association of sugar sweetened bev-erages with incident type 2 diabetes In contrast the association between artificially sweetened beverages or fruit juice and incident type 2 diabetes was less evident For artificially sweetened beverages potential publica-tion bias and residual confounding were likely to exist For fruit juice the finding seemed to be unstable and was sensitive to study design Under assumption of cau-sality for the association of consumption of sugar sweetened beverages with incidence of type 2 diabetes we provided efficacy estimates that over 10 years two million type 2 diabetes events in the USA and 80 000 in the UK would be related to consumption of sugar sweet-ened beverages
strengths and limitations of this reviewThis study has limitations typical of observational stud-ies and meta-analysis Residual confounding could exist37 Confounding by socioeconomic and dietary factors was not detected to be strong in published stud-ies However measures of these variables were likely to involve errors such that residual confounding persisted in individual studies and our meta-analysis Addition-ally lifestyle factors and adiposity could change over time The time varying characteristics might not be ran-dom and could result in bias in an unknown direction Reverse causality could also exist because of unmea-sured comorbid conditions and health consciousness that might alter consumption of beverages particularly artificially sweetened ones and risk of type 2 diabetes Weakness of meta-analysis includes the exclusion of
Precision (1standard error)
Rela
tive
risk
Sugar sweetened beverages
0 4 8 12 1601
05
025
1
2
4
10
Precision (1standard error)
Rela
tive
risk
Fruit juice
0 10 20 30025
05
1
2
4
Precision (1standard error)
Rela
tive
risk
Articially sweetened beverages
0 2 4 6 8 1001
05
025
1
2
4
10
Eggerrsquos test P=040
Eggerrsquos test P=003
Eggerrsquos test P=069
Fig 2 | Funnel plot for associations of sugar sweetened beverages artificially sweetened beverages and fruit juice with incident type 2 diabetes Dots represent point estimates plotted over precision measures (1standard error) estimates outside each panel are not presented horizontal lines represent summary estimates and 95 confidence intervals across precision shaded areas represent any of a single estimate that if included would make the summary estimate insignificant (Pgt005) P values by eggerrsquos test are presented for fruit juice estimates with greater precision indicated stronger positive association
thethinspbmj | BMJ 2015101h1576 | doi1 020076bmjh1576
RESEARCH
9
eligible cohorts for lack of information Our meta- analysis included statistical approximation that might involve errors For example we derived dose-response esti-mates partly from categorical estimates and odds ratios Without such approximations analysis standardised across different cohorts is of future interest to character-ise associations between various beverages and risks of type 2 diabetes Finally assessments of bias and quality of evidence involved subjectivity although we objec-tively examined the influence of potential bias in tests for heterogeneity and sensitivity analyses
One strength of this study was in estimating popula-tion attributable fraction for risks of type 2 diabetes related to consumption of sugar sweetened beverages in the USA and UK using data on beverage consumption for each individual While a few studies estimated how much taxation on sugar sweetened beverages influ-enced risk of obesity and type 2 diabetes12-14 no study examined the population impact by combining esti-mates for consumption of sugar sweetened beverages in multiple populations predicted the risk of type 2 diabe-tes by using a validated algorithm or provided quanti-tative evidence on the association of consumption of sugar sweetened beverages with incidence of type 2 diabetes However the population attributable fraction was limited in precision owing to underlying relative risks and uncertainty in generalisability The other lim-itations are that we estimated the population attribut-able fraction under the assumption of causality although it has not been established and the assump-tion that there would be no change over time in lifestyle associated with consumption of sugar sweetened bever-ages Future work should seek to improve precision of evidence and to characterise efficacy and effectiveness of policy interventions for different populations Gener-alisability should be exploredmdashfor example for popu-lations in Central and South America with the highest recorded per capita sales of sugar sweetened beverages in the world and China and India where the highest
prevalence of type 2 diabetes is expected1 67 To mini-mise limitations typical of observational research and understand effectiveness of a policy intervention in dif-ferent populations future research should also include randomised trials examining peoplersquos health and behaviours and informing effectiveness
interpretation in relation to other studiesOther quantitative reviews have been published recently4 5 9 None of them quantified the population attributable fraction One meta-analysis evaluated the influence of adiposity on the association of sugar sweet-ened beverages and type 2 diabetes based on three stud-ies but not artificially sweetened beverages or fruit juice5 For sugar sweetened beverages we evaluated a greater number of type 2 diabetes cases (38 285 v 19 054) and studies (17 v 3) including bias assessments and sensitivity analyses For fruit juice and artificially sweetened beverages we evaluated a greater number of studies than previous work (9 v 4 and 12 v 4 respec-tively) and drew conclusions based on assessment of the influences of adiposity and potential bias that were found to be important
The plausibility of our findings deserves discussion Detrimental effects of sugar sweetened beverages inde-pendent of obesity may exist Sugars in sugar sweet-ened beverages acutely increased blood glucose levels and have a high glycaemic index (80 to 110100 of white bread) a risk factor for type 2 diabetes68 69 Fructose in sugar sweetened beverages promotes hepatic lipogene-sis and further insulin resistance2 Effects of caramels for colouring beverages70 caffeine49 71 phosphoric acid72 and other constituents may also exist These non-glycaemic effects may be present in artificially sweetened beverages if such beverages truly increase the risk of type 2 diabetes Artificially sweetened bever-ages might have effects on hormones microbiota and taste preference but evidence for these remains weak6 73 74 Adverse effects of fruit juice would be
United States
Suga
r sw
eete
ned
beve
rage
(gd
ay)
0
200
300
500
400
100
110
189
10 year risk for type 2 diabetes ()
No at risk (millions)
75
98
141
65
111
90
110
45
165
27
United Kingdom
Age (years)
PAF
for t
ype
2 di
abet
es
All0
10
15
25
20
5
20-44 45-64 Men Womenge65
Age (years)
All 20-44 45-64 Men Womenge65
58
45
21
21
80
15
55
21
61
23
107
9
PAF unadjusted for adiposityMean sugar sweetened beverage consumptionPAF adjusted for adiposity
Fig 3 | Consumption of sugar sweetened beverages and population attributable fraction (PaF) for type 2 diabetes in the united states and the united Kingdom Circles represent mean of consumption of sugar sweetened beverages (left axis) and each bar represents PaF () for type 2 diabetes due to consumption of sugar sweetened beverages (right axis) absolute event rates over 10 years were 110 in the usa (209 million events) and 58 in the uK (26 million events) (see supplementary table 7)
doi1 020076bmjh1576 | BMJ 2015101h1576 | thethinspbmj
RESEARCH
10
present because of its moderately high glycaemic index (50-80)68 Healthful constituents may exist but decrease during processing7 75 This explains why our finding was discordant with the inverse association of consum-ing fruits as food with type 2 diabetes76
Our analysis indicated possible publication bias for the associations between artificially sweetened bever-ages and type 2 diabetes The bias toward a false posi-tive finding would be plausible according to existing public interest over the health effects6 77 The finding at least underscores potential low quality of evidence and the need for cautious interpretation Residual confounding in the finding for artificially sweetened beverages is also plausible because adults at high risk of type 2 diabetes preferentially consumed more artifi-cially sweetened beverages5 6 8 10 11 36 Confounding in the opposite direction in the finding for fruit juice is also plausible because leaner adults at lower risk of type 2 diabetes consumed more fruit juice10 11 These observations provide research and clinical implications for better understanding of health seeking behaviours related to beverage consumption6 78
Clinical and public health implicationsAlthough causality has not been established our find-ings and available evidence indicate a benefit of reduc-ing the consumption of sugar sweetened beverages for the primary prevention of type 2 diabetes In the same context our findings also imply that consumption of artificially sweetened beverages or fruit juice is not likely to reduce the risk of type 2 diabetes and thus not suitable as a healthy option None the less the lower caloric intake of artificially sweetened beverages may be of clinical benefit in obese or overweight adults by helping to reduce body weight6 78 This effect on body weight should be considered separately from our study which could not rule out the effect of body weight on beverage consumption8 Additionally clinical applica-tions of our finding deserve further appraisal about the effects of altering beverage consumption on changes in lifestyle behaviours and on risks of other clinical outcomes3 6 8
Our findings have strong public health implications Despite the limitations of this review the current con-sumption of sugar sweetened beverages was estimated to cause approximately two million excess events of type 2 diabetes in the USA and 80 000 in the UK over 10 years This could cost nearly pound120bn in the USA and pound206m in the UK ($9800 in the USA and $3994 in the UK per patient67 $1 (pound065 euro091 as of 7 July 2015) In future our work on efficacy should be extended to that on effectiveness to identify needs for interventions In addition to observational evidence trial evidence should be available accounting for the effects on car-diometabolic health and lifestyle change associated with a possible intervention8 78 Despite a population attributable fraction of no more than 20 effectiveness should be evaluated for different populations as an estimated 592 million adults globally will have type 2 diabetes in 20351 67 Additionally the average popula-tion attributable fraction of no more than 20 confirms
the importance of modifying multiple lifestyle risk fac-tors rather than a single dietary component for the pri-mary prevention of type 2 diabetes For artificially sweetened beverages and fruit juice our findings inform little benefit of using them as an alternative to sugar sweetened beverages In addition fruit juice con-sumption should not be a part of dietary recommenda-tions for greater consumption of fruits and vegetables as suggested to limit fruit juice consumption among children7 79
ConclusionsObservational cohort studies support that consumption of sugar sweetened beverages is associated with inci-dent type 2 diabetes and independently of adiposity This finding was stable in sensitivity analyses assessing influence of population characteristics potential resid-ual confounding and publication bias By contrast although artificially sweetened beverages and fruit juice showed a positive association with incident type 2 diabetes the quality of evidence is limited by potential bias and heterogeneity by study design Although cau-sality has not been established and precision needs to be improved this study informs the potential efficacy of reducing the consumption of sugar sweetened bever-ages in a contemporary population Moreover findings support that neither artificially sweetened beverages nor fruit juice are suitable alternatives to sugar sweet-ened beverages for the prevention of type 2 diabetes The following contributors provided additional information Emilie Rossignol Guy Fagherazzi Franccediloise Clavel-Chapelon and Beverley Balkau Center for Research in Epidemiology and Population Health Villejuif Cedex France Tomonori Okamura Department of Preventive Medicine and Public Health Keio University School of Medicine Tokyo Japan and Hirotsugu Ueshima Department of Health Science and Center for Epidemiologic Research in Asia Sari Voutilainen Institute of Public Health and Clinical Nutrition Kuopio Finland Frank B Hu Harvard T H Chan School of Public Health Boston Massachusetts USA Manabu Sakurai Department of Epidemiology and Public Health Kanazawa Medical University Uchinada Ishikawa Japan Paul F Jacques Nicola M McKeown and Ma Jiantao Human Nutrition Research Center on Aging Tufts University Boston Massachusetts USAContributors FI and NGF conceived the study FI LOrsquoC YZ and NGF designed the study FI LOrsquoC and YZ undertook the literature search and extracted data FI JM YH and SNB did data analysis FI LOrsquoC YZ and NGF interpreted data FI developed the first draft FI as guarantor accepts full responsibility for the work and the conduct of the study had access to the data and controlled the decision to publish All authors provided critical comments and approved the final version The sponsor of the study had no role in design and conduct of the study collection management analysis and interpretation of the data preparation review or approval of the manuscript and decision to submit the manuscript for publication The corresponding author had full access to all the data in the study and had final responsibility for the decision to submit for publication Funding This study was funded by the Medical Research Council Epidemiology Unit Core Support (MC_UU_120155) SNB was supported by an American Heart Association postdoctoral fellowship grant (13POST14370012) Competing interests All authors have completed the ICMJE uniform disclosure form at wwwicmjeorgcoi_disclosurepdf and declare no support from any organisation for the submitted work no financial relationships with any organisations that might have an interest in the submitted work in the previous three years no other relationships or activities that could appear to have influenced the submitted workEthical approval Not requiredData sharing A protocol and data for tables and figures are available on request
thethinspbmj | BMJ 2015101h1576 | doi1 020076bmjh1576
RESEARCH
11
Transparency The guarantor (FI) affirms that the manuscript is an honest accurate and transparent account of the study being reported that no important aspects of the study have been omitted and that any discrepancies from the study as planned have been explained as post hoc analysis Data sharing is available from the corresponding author
This is an Open Access article distributed in accordance with the terms of the Creative Commons Attribution (CC BY 40) license which permits others to distribute remix adapt and build upon this work for commercial use provided the original work is properly cited See httpcreativecommonsorglicensesby40
1 Basu S McKee M Galea G Stuckler D Relationship of soft drink consumption to global overweight obesity and diabetes a cross-national analysis of 75 countries Am J Public Health 20131032071-7
2 Stanhope KL Role of fructose-containing sugars in the epidemics of obesity and metabolic syndrome Annu Rev Med 201263329-43
3 Weed DL Althuis MD Mink PJ Quality of reviews on sugar-sweetened beverages and health outcomes a systematic review Am J Clin Nutr 2011941340-7
4 Malik VS Popkin BM Bray GA et al Sugar-sweetened beverages and risk of metabolic syndrome and type 2 diabetes a meta-analysis Diabetes Care 2010332477-83
5 Greenwood DC Threapleton DE Evans CEL et al Association between sugar-sweetened and artificially sweetened soft drinks and type 2 diabetes systematic review and dose-response meta-analysis of prospective studies Br J Nutr 2014112725-34
6 Gardner C Wylie-Rosett J Gidding SS et al Nonnutritive sweeteners current use and health perspectives a scientific statement from the American Heart Association and the American Diabetes Association Circulation 2012126509-19
7 Slavin JL Lloyd B Health benefits of fruits and vegetables Adv Nutr 20123506-16
8 Malik VS Popkin BM Bray GA Despreacutes J-P Hu FB Sugar-sweetened beverages obesity type 2 diabetes mellitus and cardiovascular disease risk Circulation 20101211356-64
9 Xi B Li S Liu Z et al Intake of fruit juice and incidence of type 2 diabetes a systematic review and meta-analysis PloS One 20149e93471
10 Bleich SN Wolfson JA Vine S Wang YC Diet-beverage consumption and caloric intake among US adults overall and by body weight Am J Public Health 2014104e72-8
11 The InterAct Consortium Consumption of sweet beverages and type 2 diabetes incidence in European adults results from EPIC-InterAct Diabetologia 2013561520-30
12 Basu S Vellakkal S Agrawal S Stuckler D Popkin B Ebrahim S Averting obesity and type 2 diabetes in India through sugar-sweetened beverage taxation an economic-epidemiologic modeling study PLoS Med 201411e1001582
13 Brownell KD Farley T Willett WC et al The public health and economic benefits of taxing sugar-sweetened beverages N Engl J Med 20093611599-605
14 Briggs ADM Mytton OT Kehlbacher A Tiffin R Rayner M Scarborough P Overall and income specific effect on prevalence of overweight and obesity of 20 sugar sweetened drink tax in UK econometric and comparative risk assessment modelling study BMJ 2013347f6189
15 Liberati A Altman DG Tetzlaff J et al The PRISMA statement for reporting systematic reviews and meta-analyses of studies that evaluate healthcare interventions explanation and elaboration BMJ 2009339b2700
16 The Diabetes Prevention Program Research Group Diabetes Prevention Program Research Group Knowler WC et al Reduction in the incidence of type 2 diabetes with lifestyle intervention or metformin N Engl J Med 2002346393-403
17 Franco M Bilal U Orduntildeez P et al Population-wide weight loss and regain in relation to diabetes burden and cardiovascular mortality in Cuba 1980-2010 repeated cross sectional surveys and ecological comparison of secular trends BMJ 2013346f1515
18 Willett WC Howe GR Kushi LH Adjustment for total energy intake in epidemiologic studies Am J Clin Nutr 1997651220S-8S discussion 1229S-31S
19 Higgins JP Altman DG Gotzsche PC et al The Cochrane Collaborationrsquos tool for assessing risk of bias in randomised trials BMJ 2011343d5928
20 Sterne JA Higgins JP Reeves BC on behalf of the development group for ACROBAT-NRSI A A Cochrane risk of bias assessment tool for non-randomized studies of interventions version 100 September 2014 2014 wwwriskofbiasinfo
21 Higgins J Assessing risk of bias in included studies In Higgins J Green S eds Cochrane handbook for systematic reviews of interventions Cochrane Collaboration 20081-50
22 Schuumlnemann H Brożek J Oxman GGA Handbook for grading the quality of evidence and the strength of recommendations using the GRADE approach 2013 wwwguidelinedevelopmentorghandbook
23 Zhang J Yu KF Whatrsquos the relative risk A method of correcting the odds ratio in cohort studies of common outcomes JAMA 19982801690
24 Greenland S Longnecker MP Methods for trend estimation from summarized dose-response data with applications to meta-analysis Am J Epidemiol 19921351301-9
25 Higgins JP Thompson SG Quantifying heterogeneity in a meta-analysis Stat Med 2002211539-58
26 Walter WC Correction for the effects of measurement error In Willett WC ed Nutritional epidemiology 3rd ed Oxford University Press 2012
27 MacMahon S Peto R Cutler J et al Blood pressure stroke and coronary heart disease Part 1 prolonged differences in blood pressure prospective observational studies corrected for the regression dilution bias Lancet 1990335765-74
28 Carroll RJ Stefanski LA Measurement error instrumental variables and corrections for attenuation with applications to meta-analyses Stat Med 1994131265-82
29 Prospective Studies Collaboration Blood cholesterol and vascular mortality by age sex and blood pressure a meta-analysis of individual data from 61 prospective studies with 55 000 vascular deaths Lancet 20073701829-39
30 Di Angelantonio E Sarwar N Perry P et al Major lipids apolipoproteins and risk of vascular disease JAMA 20093021993-2000
31 Hunter DJ Spiegelman D Adami HO et al Cohort studies of fat intake and the risk of breast cancer--a pooled analysis N Engl J Med 1996334356-61
32 Greenland S Quantitative methods in the review of epidemiologic literature Epidemiol Rev 198791-30
33 Brenner H Gefeller O Use of the positive predictive value to correct for disease misclassification in epidemiologic studies Am J Epidemiol 19931381007-15
34 Jonathan E Sterne AC Egger M Moher D Bias C Addressing reporting biases In Higgins J Green S eds Cochrane handbook for systematic reviews of interventions Cochrane Collaboration 20081-33
35 Lash TL Fink AK Semi-automated sensitivity analysis to assess systematic errors in observational data Epidemiology 200314 451-8
36 Sun Q van Dam RM Spiegelman D Heymsfield SB Willett WC Hu FB Comparison of dual-energy x-ray absorptiometric and anthropometric measures of adiposity in relation to adiposity-related biologic factors Am J Epidemiol 20101721442-54
37 Smith GD Phillips AN Inflation in epidemiology ldquothe proof and measurement of association between two thingsrdquo revisited BMJ 19963121659-61
38 Bray GA Energy and fructose from beverages sweetened with sugar or high-fructose corn syrup pose a health risk for some people Adv Nutr 20134220-5
39 Nettleton JA Lutsey PL Wang Y et al Diet soda intake and risk of incident metabolic syndrome and type 2 diabetes in the Multi-Ethnic Study of Atherosclerosis (MESA) Diabetes Care 200932688-9440
40 Fagherazzi G Vilier A Saes Sartorelli D Lajous M Balkau B Clavel-Chapelon F Consumption of artificially and sugar-sweetened beverages and incident type 2 diabetes in the Etude Epidemiologique aupres des femmes de la Mutuelle Generale de lrsquoEducation Nationale-European Prospective Investigation into Cancer and Nutrition cohort Am J Clin Nutr 201397517-23
41 Muraki I Imamura F Manson JE et al Fruit consumption and risk of type 2 diabetes results from three prospective longitudinal cohort studies BMJ 2013347f5001
42 Cook JR Stefanski LA Simulation-extrapolation estimation in parametric measurement error models J Am Stat Assoc 1994891314-28
43 Greenland S Estimation of population attributable fractions from fitted incidence ratios and exposure survey data with an application to electromagnetic fields and childhood leukemia Biometrics 200157182-8
44 Schuumlnemann AHJ Oxman AD Vist GE Higgins JPT Jonathan J Interpreting results and drawing conclusions In Higgins J Green S eds Cochrane Handbook for Systematic Reviews of Interventions Cochrane Collaboration 20081-24
45 National Center for Health Statistics National Health and Nutrition Examination Survey NHANES (2009-2010) 2005 wwwcdcgovnchsnhaneshtm
46 Public Health England and Food Standards Agency National Diet and Nutrition Survey results from years 1 to 4 (combined) of the rolling programme for 2008 and 2009 to 2011 and 2012 2014 wwwgovukgovernmentpublicationsnational-diet-and-nutrition-survey- results-from-years-1-to-4-combined-of-the-rolling-programme-for-2008-and-2009-to-2011-and-2012
47 Hippisley-Cox J Coupland C Robson J Sheikh A Brindle P Predicting risk of type 2 diabetes in England and Wales prospective derivation and validation of QDScore BMJ 2009338b880
48 Schmidt MI Duncan BB Bang H et al Identifying individuals at high risk for diabetes the Atherosclerosis Risk in Communities study Diabetes Care 2005282013-8
RESEARCH
No commercial reuse See rights and reprints httpwwwbmjcompermissions Subscribe httpwwwbmjcomsubscribe
49 Bhupathiraju SN Pan A Malik VS et al Caffeinated and caffeine- free beverages and risk of type 2 diabetes Am J Clin Nutr 2013 97155-66
50 De Koning L Malik VS Rimm EB Willett WC Hu FB Sugar-sweetened and artificially sweetened beverage consumption and risk of type 2 diabetes in men Am J Clin Nutr 2011931321-7
51 Bazzano LA Li TY Joshipura KJ Hu FB Intake of fruit vegetables and fruit juices and risk of diabetes in women Diabetes Care 2008311311-7
52 Eshak ES Iso H Mizoue T Inoue M Noda M Tsugane S Soft drink 100 fruit juice and vegetable juice intakes and risk of diabetes mellitus Clin Nutr 201332300-8
53 Montonen J Jarvinen R Knekt P Heliovaara M Reunanen A Consumption of sweetened beverages and intakes of fructose and glucose predict type 2 diabetes occurrence J Nutr 20071371447-54
54 Mursu J Virtanen JK Tuomainen T-P Nurmi T Voutilainen S Intake of fruit berries and vegetables and risk of type 2 diabetes in Finnish men the Kuopio Ischaemic Heart Disease Risk Factor Study Am J Clin Nutr 201499328-33
55 Duffey KJ Gordon-Larsen P Steffen LM et al Drinking caloric beverages increases the risk of adverse cardiometabolic outcomes in the Coronary Artery Risk Development in Young Adults (CARDIA) Study Am J Clin Nutr 201092954-9
56 Duffey KJ Steffen LM Van Horn L Jacobs DR Popkin BM Dietary patterns matter diet beverages and cardiometabolic risks in the longitudinal Coronary Artery Risk Development in Young Adults (CARDIA) Study Am J Clin Nutr 201295909-15
57 Odegaard AO Koh W-PP Arakawa K Yu MC Pereira MA Soft drink and juice consumption and risk of physician-diagnosed incident type 2 diabetes the Singapore Chinese Health Study Am J Epidemiol 2010171701-8
58 Palmer JR Boggs DA Krishnan S Hu FB Singer M Rosenberg L Sugar-sweetened beverages and incidence of type 2 diabetes mellitus in African American women Arch Intern Med 2008168 1487-92
59 Sakurai M Nakamura K Miura K et al Sugar-sweetened beverage and diet soda consumption and the 7-year risk for type 2 diabetes mellitus in middle-aged Japanese men Eur J Nutr 201453251-8
60 Schulze MB Manson JE Ludwig DS et al Sugar-sweetened beverages weight gain and incidence of type 2 diabetes in young and middle-aged women JAMA 2004292927-34
61 Pan A Malik VS Schulze MB Manson JE Willett WC Hu FB Plain-water intake and risk of type 2 diabetes in young and middle-aged women Am J Clin Nutr 2012951454-60
62 Pereira MA Parker ED Folsom AR Intake of sugar sweetened beverages fruit juice and incidence of type 2 diabetes A prospective study of postmenopausal women Diabetes 200554A258
63 Hayashino Y Fukuhara S Okamura T et al A prospective study of passive smoking and risk of diabetes in a cohort of workers the High-Risk and Population Strategy for Occupational Health Promotion (HIPOP-OHP) study Diabetes Care 200831732-4
64 Paynter NP Yeh H-CC Voutilainen S et al Coffee and sweetened beverage consumption and the risk of type 2 diabetes mellitus the atherosclerosis risk in communities study Am J Epidemiol 20061641075-84
65 Dhingra R Sullivan L Jacques PF et al Soft drink consumption and risk of developing cardiometabolic risk factors and the metabolic syndrome in middle-aged adults in the community Circulation 2007116480-8
66 Duffey KJ Steffen LM Van Horn L Jacobs DR Jr Popkin BM Dietary patterns matter diet beverages and cardiometabolic risks in the longitudinal Coronary Artery Risk Development in Young Adults (CARDIA) Study Am J Clin Nutr 201295909-15
67 International Diabetes Federatoin The Global Burden In IDF diabetes atlas 6th ed IDF 201329-49
68 Atkinson FS Foster-Powell K Brand-Miller JC International tables of glycemic index and glycemic load values 2008 Diabetes Care 2008312281-3
69 Livesey G Taylor R Livesey H Liu S Is there a dose-response relation of dietary glycemic load to risk of type 2 diabetes Meta-analysis of prospective cohort studies Am J Clin Nutr 201397584-96
70 Kellow NJ Savige GS Dietary advanced glycation end-product restriction for the attenuation of insulin resistance oxidative stress and endothelial dysfunction a systematic review Eur J Clin Nutr 201367239-48
71 Jiang X Zhang D Jiang W Coffee and caffeine intake and incidence of type 2 diabetes mellitus a meta-analysis of prospective studies Eur J Nutr 20145325-38
72 Fitzpatrick L Heaney RP Got soda J Bone Miner Metab 2003181570-2
73 Pepino MY Bourne C Non-nutritive sweeteners energy balance and glucose homeostasis Curr Opin Clin Nutr Metab Care 201114 391-5
74 Suez J Korem T Zeevi D et al Artificial sweeteners induce glucose intolerance by altering the gut microbiota Nature 2014514181-6
75 Crowe KM Murray E Deconstructing a fruit serving comparing the antioxidant density of select whole fruit and 100 fruit juices J Acad Nutr Diet 20131131354-8
76 Cooper AJ Forouhi NG Ye Z et al Fruit and vegetable intake and type 2 diabetes EPIC-InterAct prospective study and meta-analysis Eur J Clin Nutr 2012661082-92
77 De la Pentildea C Artificial sweetener as a historical window to culturally situated health Ann N Y Acad Sci 20101190159-65
78 Piernas C Tate DF Wang X Popkin BM Does diet-beverage intake affect dietary consumption patterns Results from the Choose Healthy Options Consciously Everyday (CHOICE) randomized clinical trial Am J Clin Nutr 201397604-11
79 Wojcicki JM Heyman MB Reducing childhood obesity by eliminating 100 fruit juice Am J Public Health 20121021630-3
copy BMJ Publishing Group Ltd 2015
Appendix supplementary material
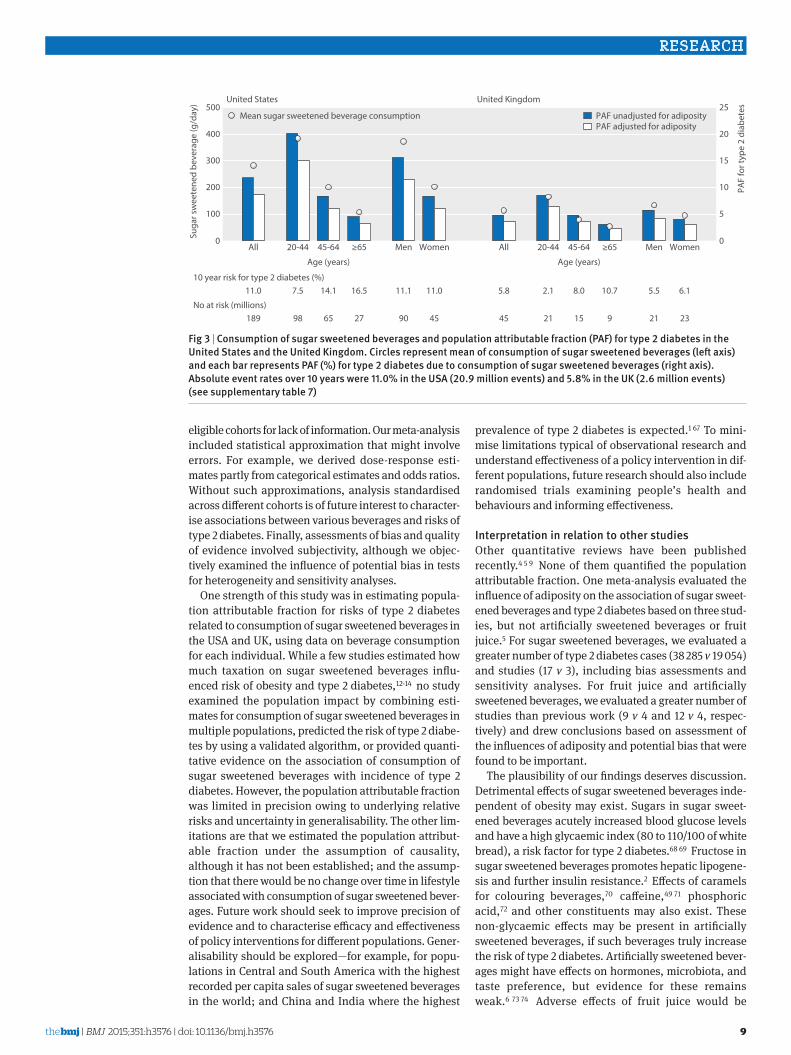
thethinspbmj | BMJ 2015101h1576 | doi1 020076bmjh1576
RESEARCH
9
eligible cohorts for lack of information Our meta- analysis included statistical approximation that might involve errors For example we derived dose-response esti-mates partly from categorical estimates and odds ratios Without such approximations analysis standardised across different cohorts is of future interest to character-ise associations between various beverages and risks of type 2 diabetes Finally assessments of bias and quality of evidence involved subjectivity although we objec-tively examined the influence of potential bias in tests for heterogeneity and sensitivity analyses
One strength of this study was in estimating popula-tion attributable fraction for risks of type 2 diabetes related to consumption of sugar sweetened beverages in the USA and UK using data on beverage consumption for each individual While a few studies estimated how much taxation on sugar sweetened beverages influ-enced risk of obesity and type 2 diabetes12-14 no study examined the population impact by combining esti-mates for consumption of sugar sweetened beverages in multiple populations predicted the risk of type 2 diabe-tes by using a validated algorithm or provided quanti-tative evidence on the association of consumption of sugar sweetened beverages with incidence of type 2 diabetes However the population attributable fraction was limited in precision owing to underlying relative risks and uncertainty in generalisability The other lim-itations are that we estimated the population attribut-able fraction under the assumption of causality although it has not been established and the assump-tion that there would be no change over time in lifestyle associated with consumption of sugar sweetened bever-ages Future work should seek to improve precision of evidence and to characterise efficacy and effectiveness of policy interventions for different populations Gener-alisability should be exploredmdashfor example for popu-lations in Central and South America with the highest recorded per capita sales of sugar sweetened beverages in the world and China and India where the highest
prevalence of type 2 diabetes is expected1 67 To mini-mise limitations typical of observational research and understand effectiveness of a policy intervention in dif-ferent populations future research should also include randomised trials examining peoplersquos health and behaviours and informing effectiveness
interpretation in relation to other studiesOther quantitative reviews have been published recently4 5 9 None of them quantified the population attributable fraction One meta-analysis evaluated the influence of adiposity on the association of sugar sweet-ened beverages and type 2 diabetes based on three stud-ies but not artificially sweetened beverages or fruit juice5 For sugar sweetened beverages we evaluated a greater number of type 2 diabetes cases (38 285 v 19 054) and studies (17 v 3) including bias assessments and sensitivity analyses For fruit juice and artificially sweetened beverages we evaluated a greater number of studies than previous work (9 v 4 and 12 v 4 respec-tively) and drew conclusions based on assessment of the influences of adiposity and potential bias that were found to be important
The plausibility of our findings deserves discussion Detrimental effects of sugar sweetened beverages inde-pendent of obesity may exist Sugars in sugar sweet-ened beverages acutely increased blood glucose levels and have a high glycaemic index (80 to 110100 of white bread) a risk factor for type 2 diabetes68 69 Fructose in sugar sweetened beverages promotes hepatic lipogene-sis and further insulin resistance2 Effects of caramels for colouring beverages70 caffeine49 71 phosphoric acid72 and other constituents may also exist These non-glycaemic effects may be present in artificially sweetened beverages if such beverages truly increase the risk of type 2 diabetes Artificially sweetened bever-ages might have effects on hormones microbiota and taste preference but evidence for these remains weak6 73 74 Adverse effects of fruit juice would be
United States
Suga
r sw
eete
ned
beve
rage
(gd
ay)
0
200
300
500
400
100
110
189
10 year risk for type 2 diabetes ()
No at risk (millions)
75
98
141
65
111
90
110
45
165
27
United Kingdom
Age (years)
PAF
for t
ype
2 di
abet
es
All0
10
15
25
20
5
20-44 45-64 Men Womenge65
Age (years)
All 20-44 45-64 Men Womenge65
58
45
21
21
80
15
55
21
61
23
107
9
PAF unadjusted for adiposityMean sugar sweetened beverage consumptionPAF adjusted for adiposity
Fig 3 | Consumption of sugar sweetened beverages and population attributable fraction (PaF) for type 2 diabetes in the united states and the united Kingdom Circles represent mean of consumption of sugar sweetened beverages (left axis) and each bar represents PaF () for type 2 diabetes due to consumption of sugar sweetened beverages (right axis) absolute event rates over 10 years were 110 in the usa (209 million events) and 58 in the uK (26 million events) (see supplementary table 7)
doi1 020076bmjh1576 | BMJ 2015101h1576 | thethinspbmj
RESEARCH
10
present because of its moderately high glycaemic index (50-80)68 Healthful constituents may exist but decrease during processing7 75 This explains why our finding was discordant with the inverse association of consum-ing fruits as food with type 2 diabetes76
Our analysis indicated possible publication bias for the associations between artificially sweetened bever-ages and type 2 diabetes The bias toward a false posi-tive finding would be plausible according to existing public interest over the health effects6 77 The finding at least underscores potential low quality of evidence and the need for cautious interpretation Residual confounding in the finding for artificially sweetened beverages is also plausible because adults at high risk of type 2 diabetes preferentially consumed more artifi-cially sweetened beverages5 6 8 10 11 36 Confounding in the opposite direction in the finding for fruit juice is also plausible because leaner adults at lower risk of type 2 diabetes consumed more fruit juice10 11 These observations provide research and clinical implications for better understanding of health seeking behaviours related to beverage consumption6 78
Clinical and public health implicationsAlthough causality has not been established our find-ings and available evidence indicate a benefit of reduc-ing the consumption of sugar sweetened beverages for the primary prevention of type 2 diabetes In the same context our findings also imply that consumption of artificially sweetened beverages or fruit juice is not likely to reduce the risk of type 2 diabetes and thus not suitable as a healthy option None the less the lower caloric intake of artificially sweetened beverages may be of clinical benefit in obese or overweight adults by helping to reduce body weight6 78 This effect on body weight should be considered separately from our study which could not rule out the effect of body weight on beverage consumption8 Additionally clinical applica-tions of our finding deserve further appraisal about the effects of altering beverage consumption on changes in lifestyle behaviours and on risks of other clinical outcomes3 6 8
Our findings have strong public health implications Despite the limitations of this review the current con-sumption of sugar sweetened beverages was estimated to cause approximately two million excess events of type 2 diabetes in the USA and 80 000 in the UK over 10 years This could cost nearly pound120bn in the USA and pound206m in the UK ($9800 in the USA and $3994 in the UK per patient67 $1 (pound065 euro091 as of 7 July 2015) In future our work on efficacy should be extended to that on effectiveness to identify needs for interventions In addition to observational evidence trial evidence should be available accounting for the effects on car-diometabolic health and lifestyle change associated with a possible intervention8 78 Despite a population attributable fraction of no more than 20 effectiveness should be evaluated for different populations as an estimated 592 million adults globally will have type 2 diabetes in 20351 67 Additionally the average popula-tion attributable fraction of no more than 20 confirms
the importance of modifying multiple lifestyle risk fac-tors rather than a single dietary component for the pri-mary prevention of type 2 diabetes For artificially sweetened beverages and fruit juice our findings inform little benefit of using them as an alternative to sugar sweetened beverages In addition fruit juice con-sumption should not be a part of dietary recommenda-tions for greater consumption of fruits and vegetables as suggested to limit fruit juice consumption among children7 79
ConclusionsObservational cohort studies support that consumption of sugar sweetened beverages is associated with inci-dent type 2 diabetes and independently of adiposity This finding was stable in sensitivity analyses assessing influence of population characteristics potential resid-ual confounding and publication bias By contrast although artificially sweetened beverages and fruit juice showed a positive association with incident type 2 diabetes the quality of evidence is limited by potential bias and heterogeneity by study design Although cau-sality has not been established and precision needs to be improved this study informs the potential efficacy of reducing the consumption of sugar sweetened bever-ages in a contemporary population Moreover findings support that neither artificially sweetened beverages nor fruit juice are suitable alternatives to sugar sweet-ened beverages for the prevention of type 2 diabetes The following contributors provided additional information Emilie Rossignol Guy Fagherazzi Franccediloise Clavel-Chapelon and Beverley Balkau Center for Research in Epidemiology and Population Health Villejuif Cedex France Tomonori Okamura Department of Preventive Medicine and Public Health Keio University School of Medicine Tokyo Japan and Hirotsugu Ueshima Department of Health Science and Center for Epidemiologic Research in Asia Sari Voutilainen Institute of Public Health and Clinical Nutrition Kuopio Finland Frank B Hu Harvard T H Chan School of Public Health Boston Massachusetts USA Manabu Sakurai Department of Epidemiology and Public Health Kanazawa Medical University Uchinada Ishikawa Japan Paul F Jacques Nicola M McKeown and Ma Jiantao Human Nutrition Research Center on Aging Tufts University Boston Massachusetts USAContributors FI and NGF conceived the study FI LOrsquoC YZ and NGF designed the study FI LOrsquoC and YZ undertook the literature search and extracted data FI JM YH and SNB did data analysis FI LOrsquoC YZ and NGF interpreted data FI developed the first draft FI as guarantor accepts full responsibility for the work and the conduct of the study had access to the data and controlled the decision to publish All authors provided critical comments and approved the final version The sponsor of the study had no role in design and conduct of the study collection management analysis and interpretation of the data preparation review or approval of the manuscript and decision to submit the manuscript for publication The corresponding author had full access to all the data in the study and had final responsibility for the decision to submit for publication Funding This study was funded by the Medical Research Council Epidemiology Unit Core Support (MC_UU_120155) SNB was supported by an American Heart Association postdoctoral fellowship grant (13POST14370012) Competing interests All authors have completed the ICMJE uniform disclosure form at wwwicmjeorgcoi_disclosurepdf and declare no support from any organisation for the submitted work no financial relationships with any organisations that might have an interest in the submitted work in the previous three years no other relationships or activities that could appear to have influenced the submitted workEthical approval Not requiredData sharing A protocol and data for tables and figures are available on request
thethinspbmj | BMJ 2015101h1576 | doi1 020076bmjh1576
RESEARCH
11
Transparency The guarantor (FI) affirms that the manuscript is an honest accurate and transparent account of the study being reported that no important aspects of the study have been omitted and that any discrepancies from the study as planned have been explained as post hoc analysis Data sharing is available from the corresponding author
This is an Open Access article distributed in accordance with the terms of the Creative Commons Attribution (CC BY 40) license which permits others to distribute remix adapt and build upon this work for commercial use provided the original work is properly cited See httpcreativecommonsorglicensesby40
1 Basu S McKee M Galea G Stuckler D Relationship of soft drink consumption to global overweight obesity and diabetes a cross-national analysis of 75 countries Am J Public Health 20131032071-7
2 Stanhope KL Role of fructose-containing sugars in the epidemics of obesity and metabolic syndrome Annu Rev Med 201263329-43
3 Weed DL Althuis MD Mink PJ Quality of reviews on sugar-sweetened beverages and health outcomes a systematic review Am J Clin Nutr 2011941340-7
4 Malik VS Popkin BM Bray GA et al Sugar-sweetened beverages and risk of metabolic syndrome and type 2 diabetes a meta-analysis Diabetes Care 2010332477-83
5 Greenwood DC Threapleton DE Evans CEL et al Association between sugar-sweetened and artificially sweetened soft drinks and type 2 diabetes systematic review and dose-response meta-analysis of prospective studies Br J Nutr 2014112725-34
6 Gardner C Wylie-Rosett J Gidding SS et al Nonnutritive sweeteners current use and health perspectives a scientific statement from the American Heart Association and the American Diabetes Association Circulation 2012126509-19
7 Slavin JL Lloyd B Health benefits of fruits and vegetables Adv Nutr 20123506-16
8 Malik VS Popkin BM Bray GA Despreacutes J-P Hu FB Sugar-sweetened beverages obesity type 2 diabetes mellitus and cardiovascular disease risk Circulation 20101211356-64
9 Xi B Li S Liu Z et al Intake of fruit juice and incidence of type 2 diabetes a systematic review and meta-analysis PloS One 20149e93471
10 Bleich SN Wolfson JA Vine S Wang YC Diet-beverage consumption and caloric intake among US adults overall and by body weight Am J Public Health 2014104e72-8
11 The InterAct Consortium Consumption of sweet beverages and type 2 diabetes incidence in European adults results from EPIC-InterAct Diabetologia 2013561520-30
12 Basu S Vellakkal S Agrawal S Stuckler D Popkin B Ebrahim S Averting obesity and type 2 diabetes in India through sugar-sweetened beverage taxation an economic-epidemiologic modeling study PLoS Med 201411e1001582
13 Brownell KD Farley T Willett WC et al The public health and economic benefits of taxing sugar-sweetened beverages N Engl J Med 20093611599-605
14 Briggs ADM Mytton OT Kehlbacher A Tiffin R Rayner M Scarborough P Overall and income specific effect on prevalence of overweight and obesity of 20 sugar sweetened drink tax in UK econometric and comparative risk assessment modelling study BMJ 2013347f6189
15 Liberati A Altman DG Tetzlaff J et al The PRISMA statement for reporting systematic reviews and meta-analyses of studies that evaluate healthcare interventions explanation and elaboration BMJ 2009339b2700
16 The Diabetes Prevention Program Research Group Diabetes Prevention Program Research Group Knowler WC et al Reduction in the incidence of type 2 diabetes with lifestyle intervention or metformin N Engl J Med 2002346393-403
17 Franco M Bilal U Orduntildeez P et al Population-wide weight loss and regain in relation to diabetes burden and cardiovascular mortality in Cuba 1980-2010 repeated cross sectional surveys and ecological comparison of secular trends BMJ 2013346f1515
18 Willett WC Howe GR Kushi LH Adjustment for total energy intake in epidemiologic studies Am J Clin Nutr 1997651220S-8S discussion 1229S-31S
19 Higgins JP Altman DG Gotzsche PC et al The Cochrane Collaborationrsquos tool for assessing risk of bias in randomised trials BMJ 2011343d5928
20 Sterne JA Higgins JP Reeves BC on behalf of the development group for ACROBAT-NRSI A A Cochrane risk of bias assessment tool for non-randomized studies of interventions version 100 September 2014 2014 wwwriskofbiasinfo
21 Higgins J Assessing risk of bias in included studies In Higgins J Green S eds Cochrane handbook for systematic reviews of interventions Cochrane Collaboration 20081-50
22 Schuumlnemann H Brożek J Oxman GGA Handbook for grading the quality of evidence and the strength of recommendations using the GRADE approach 2013 wwwguidelinedevelopmentorghandbook
23 Zhang J Yu KF Whatrsquos the relative risk A method of correcting the odds ratio in cohort studies of common outcomes JAMA 19982801690
24 Greenland S Longnecker MP Methods for trend estimation from summarized dose-response data with applications to meta-analysis Am J Epidemiol 19921351301-9
25 Higgins JP Thompson SG Quantifying heterogeneity in a meta-analysis Stat Med 2002211539-58
26 Walter WC Correction for the effects of measurement error In Willett WC ed Nutritional epidemiology 3rd ed Oxford University Press 2012
27 MacMahon S Peto R Cutler J et al Blood pressure stroke and coronary heart disease Part 1 prolonged differences in blood pressure prospective observational studies corrected for the regression dilution bias Lancet 1990335765-74
28 Carroll RJ Stefanski LA Measurement error instrumental variables and corrections for attenuation with applications to meta-analyses Stat Med 1994131265-82
29 Prospective Studies Collaboration Blood cholesterol and vascular mortality by age sex and blood pressure a meta-analysis of individual data from 61 prospective studies with 55 000 vascular deaths Lancet 20073701829-39
30 Di Angelantonio E Sarwar N Perry P et al Major lipids apolipoproteins and risk of vascular disease JAMA 20093021993-2000
31 Hunter DJ Spiegelman D Adami HO et al Cohort studies of fat intake and the risk of breast cancer--a pooled analysis N Engl J Med 1996334356-61
32 Greenland S Quantitative methods in the review of epidemiologic literature Epidemiol Rev 198791-30
33 Brenner H Gefeller O Use of the positive predictive value to correct for disease misclassification in epidemiologic studies Am J Epidemiol 19931381007-15
34 Jonathan E Sterne AC Egger M Moher D Bias C Addressing reporting biases In Higgins J Green S eds Cochrane handbook for systematic reviews of interventions Cochrane Collaboration 20081-33
35 Lash TL Fink AK Semi-automated sensitivity analysis to assess systematic errors in observational data Epidemiology 200314 451-8
36 Sun Q van Dam RM Spiegelman D Heymsfield SB Willett WC Hu FB Comparison of dual-energy x-ray absorptiometric and anthropometric measures of adiposity in relation to adiposity-related biologic factors Am J Epidemiol 20101721442-54
37 Smith GD Phillips AN Inflation in epidemiology ldquothe proof and measurement of association between two thingsrdquo revisited BMJ 19963121659-61
38 Bray GA Energy and fructose from beverages sweetened with sugar or high-fructose corn syrup pose a health risk for some people Adv Nutr 20134220-5
39 Nettleton JA Lutsey PL Wang Y et al Diet soda intake and risk of incident metabolic syndrome and type 2 diabetes in the Multi-Ethnic Study of Atherosclerosis (MESA) Diabetes Care 200932688-9440
40 Fagherazzi G Vilier A Saes Sartorelli D Lajous M Balkau B Clavel-Chapelon F Consumption of artificially and sugar-sweetened beverages and incident type 2 diabetes in the Etude Epidemiologique aupres des femmes de la Mutuelle Generale de lrsquoEducation Nationale-European Prospective Investigation into Cancer and Nutrition cohort Am J Clin Nutr 201397517-23
41 Muraki I Imamura F Manson JE et al Fruit consumption and risk of type 2 diabetes results from three prospective longitudinal cohort studies BMJ 2013347f5001
42 Cook JR Stefanski LA Simulation-extrapolation estimation in parametric measurement error models J Am Stat Assoc 1994891314-28
43 Greenland S Estimation of population attributable fractions from fitted incidence ratios and exposure survey data with an application to electromagnetic fields and childhood leukemia Biometrics 200157182-8
44 Schuumlnemann AHJ Oxman AD Vist GE Higgins JPT Jonathan J Interpreting results and drawing conclusions In Higgins J Green S eds Cochrane Handbook for Systematic Reviews of Interventions Cochrane Collaboration 20081-24
45 National Center for Health Statistics National Health and Nutrition Examination Survey NHANES (2009-2010) 2005 wwwcdcgovnchsnhaneshtm
46 Public Health England and Food Standards Agency National Diet and Nutrition Survey results from years 1 to 4 (combined) of the rolling programme for 2008 and 2009 to 2011 and 2012 2014 wwwgovukgovernmentpublicationsnational-diet-and-nutrition-survey- results-from-years-1-to-4-combined-of-the-rolling-programme-for-2008-and-2009-to-2011-and-2012
47 Hippisley-Cox J Coupland C Robson J Sheikh A Brindle P Predicting risk of type 2 diabetes in England and Wales prospective derivation and validation of QDScore BMJ 2009338b880
48 Schmidt MI Duncan BB Bang H et al Identifying individuals at high risk for diabetes the Atherosclerosis Risk in Communities study Diabetes Care 2005282013-8
RESEARCH
No commercial reuse See rights and reprints httpwwwbmjcompermissions Subscribe httpwwwbmjcomsubscribe
49 Bhupathiraju SN Pan A Malik VS et al Caffeinated and caffeine- free beverages and risk of type 2 diabetes Am J Clin Nutr 2013 97155-66
50 De Koning L Malik VS Rimm EB Willett WC Hu FB Sugar-sweetened and artificially sweetened beverage consumption and risk of type 2 diabetes in men Am J Clin Nutr 2011931321-7
51 Bazzano LA Li TY Joshipura KJ Hu FB Intake of fruit vegetables and fruit juices and risk of diabetes in women Diabetes Care 2008311311-7
52 Eshak ES Iso H Mizoue T Inoue M Noda M Tsugane S Soft drink 100 fruit juice and vegetable juice intakes and risk of diabetes mellitus Clin Nutr 201332300-8
53 Montonen J Jarvinen R Knekt P Heliovaara M Reunanen A Consumption of sweetened beverages and intakes of fructose and glucose predict type 2 diabetes occurrence J Nutr 20071371447-54
54 Mursu J Virtanen JK Tuomainen T-P Nurmi T Voutilainen S Intake of fruit berries and vegetables and risk of type 2 diabetes in Finnish men the Kuopio Ischaemic Heart Disease Risk Factor Study Am J Clin Nutr 201499328-33
55 Duffey KJ Gordon-Larsen P Steffen LM et al Drinking caloric beverages increases the risk of adverse cardiometabolic outcomes in the Coronary Artery Risk Development in Young Adults (CARDIA) Study Am J Clin Nutr 201092954-9
56 Duffey KJ Steffen LM Van Horn L Jacobs DR Popkin BM Dietary patterns matter diet beverages and cardiometabolic risks in the longitudinal Coronary Artery Risk Development in Young Adults (CARDIA) Study Am J Clin Nutr 201295909-15
57 Odegaard AO Koh W-PP Arakawa K Yu MC Pereira MA Soft drink and juice consumption and risk of physician-diagnosed incident type 2 diabetes the Singapore Chinese Health Study Am J Epidemiol 2010171701-8
58 Palmer JR Boggs DA Krishnan S Hu FB Singer M Rosenberg L Sugar-sweetened beverages and incidence of type 2 diabetes mellitus in African American women Arch Intern Med 2008168 1487-92
59 Sakurai M Nakamura K Miura K et al Sugar-sweetened beverage and diet soda consumption and the 7-year risk for type 2 diabetes mellitus in middle-aged Japanese men Eur J Nutr 201453251-8
60 Schulze MB Manson JE Ludwig DS et al Sugar-sweetened beverages weight gain and incidence of type 2 diabetes in young and middle-aged women JAMA 2004292927-34
61 Pan A Malik VS Schulze MB Manson JE Willett WC Hu FB Plain-water intake and risk of type 2 diabetes in young and middle-aged women Am J Clin Nutr 2012951454-60
62 Pereira MA Parker ED Folsom AR Intake of sugar sweetened beverages fruit juice and incidence of type 2 diabetes A prospective study of postmenopausal women Diabetes 200554A258
63 Hayashino Y Fukuhara S Okamura T et al A prospective study of passive smoking and risk of diabetes in a cohort of workers the High-Risk and Population Strategy for Occupational Health Promotion (HIPOP-OHP) study Diabetes Care 200831732-4
64 Paynter NP Yeh H-CC Voutilainen S et al Coffee and sweetened beverage consumption and the risk of type 2 diabetes mellitus the atherosclerosis risk in communities study Am J Epidemiol 20061641075-84
65 Dhingra R Sullivan L Jacques PF et al Soft drink consumption and risk of developing cardiometabolic risk factors and the metabolic syndrome in middle-aged adults in the community Circulation 2007116480-8
66 Duffey KJ Steffen LM Van Horn L Jacobs DR Jr Popkin BM Dietary patterns matter diet beverages and cardiometabolic risks in the longitudinal Coronary Artery Risk Development in Young Adults (CARDIA) Study Am J Clin Nutr 201295909-15
67 International Diabetes Federatoin The Global Burden In IDF diabetes atlas 6th ed IDF 201329-49
68 Atkinson FS Foster-Powell K Brand-Miller JC International tables of glycemic index and glycemic load values 2008 Diabetes Care 2008312281-3
69 Livesey G Taylor R Livesey H Liu S Is there a dose-response relation of dietary glycemic load to risk of type 2 diabetes Meta-analysis of prospective cohort studies Am J Clin Nutr 201397584-96
70 Kellow NJ Savige GS Dietary advanced glycation end-product restriction for the attenuation of insulin resistance oxidative stress and endothelial dysfunction a systematic review Eur J Clin Nutr 201367239-48
71 Jiang X Zhang D Jiang W Coffee and caffeine intake and incidence of type 2 diabetes mellitus a meta-analysis of prospective studies Eur J Nutr 20145325-38
72 Fitzpatrick L Heaney RP Got soda J Bone Miner Metab 2003181570-2
73 Pepino MY Bourne C Non-nutritive sweeteners energy balance and glucose homeostasis Curr Opin Clin Nutr Metab Care 201114 391-5
74 Suez J Korem T Zeevi D et al Artificial sweeteners induce glucose intolerance by altering the gut microbiota Nature 2014514181-6
75 Crowe KM Murray E Deconstructing a fruit serving comparing the antioxidant density of select whole fruit and 100 fruit juices J Acad Nutr Diet 20131131354-8
76 Cooper AJ Forouhi NG Ye Z et al Fruit and vegetable intake and type 2 diabetes EPIC-InterAct prospective study and meta-analysis Eur J Clin Nutr 2012661082-92
77 De la Pentildea C Artificial sweetener as a historical window to culturally situated health Ann N Y Acad Sci 20101190159-65
78 Piernas C Tate DF Wang X Popkin BM Does diet-beverage intake affect dietary consumption patterns Results from the Choose Healthy Options Consciously Everyday (CHOICE) randomized clinical trial Am J Clin Nutr 201397604-11
79 Wojcicki JM Heyman MB Reducing childhood obesity by eliminating 100 fruit juice Am J Public Health 20121021630-3
copy BMJ Publishing Group Ltd 2015
Appendix supplementary material