consumer willingness to pay for vehicle … willingness to pay for vehicle characteristics: what do...
TRANSCRIPT
Consumer Willingness to Pay for Vehicle Characteristics:
What Do We Know?David Greene,* Anushah Hossein,** Gloria Helfand,*** Robert Beach**
*University of Tennessee
**RTI International
***U.S. Environmental Protection Agency
1
Why study willingness to pay (WTP) for vehicle attributes?• Related to consumer vehicle choice modeling:
• To use such a model to estimate the effects of policy on vehicle demand, one would want to know whether the model does a reasonable job of capturing responses.
• If models using different data or estimation methods produce similar values for WTP, then the models may have found common consumer behavioral responses
• If models produce different estimates, then how do we know that these models are consistently modeling or predicting behavior?
• The value of knowing a value:• As more fuel-saving technologies are used, there may be engineering tradeoffs (or
complementarities) between fuel savings & other vehicle characteristics.• If we identify such tradeoffs/complementarities, having WTP values would allow us
to monetize the changes in values.
2
WTP for Vehicle Attributes
• Many researchers have estimated demand for vehicles or their characteristics
• Typically, in discrete choice models• Some in hedonic models
• Different kinds of data• Market-level data• Individual revealed preference data• Stated preference data
• These researchers have not necessarily reported WTP values implied by their analyses
• Having these values would facilitate comparisons across studies
3
Estimating WTP from existing literature• Goal: to estimate WTP values for vehicle attributes out of as many
studies as possible• To have available estimates of these values• To see whether values are reasonably consistent across studies
• We decided to focus on US-based studies, 1995-present• Older & foreign studies are not as likely to be relevant
• Final sample of 52 papers
4
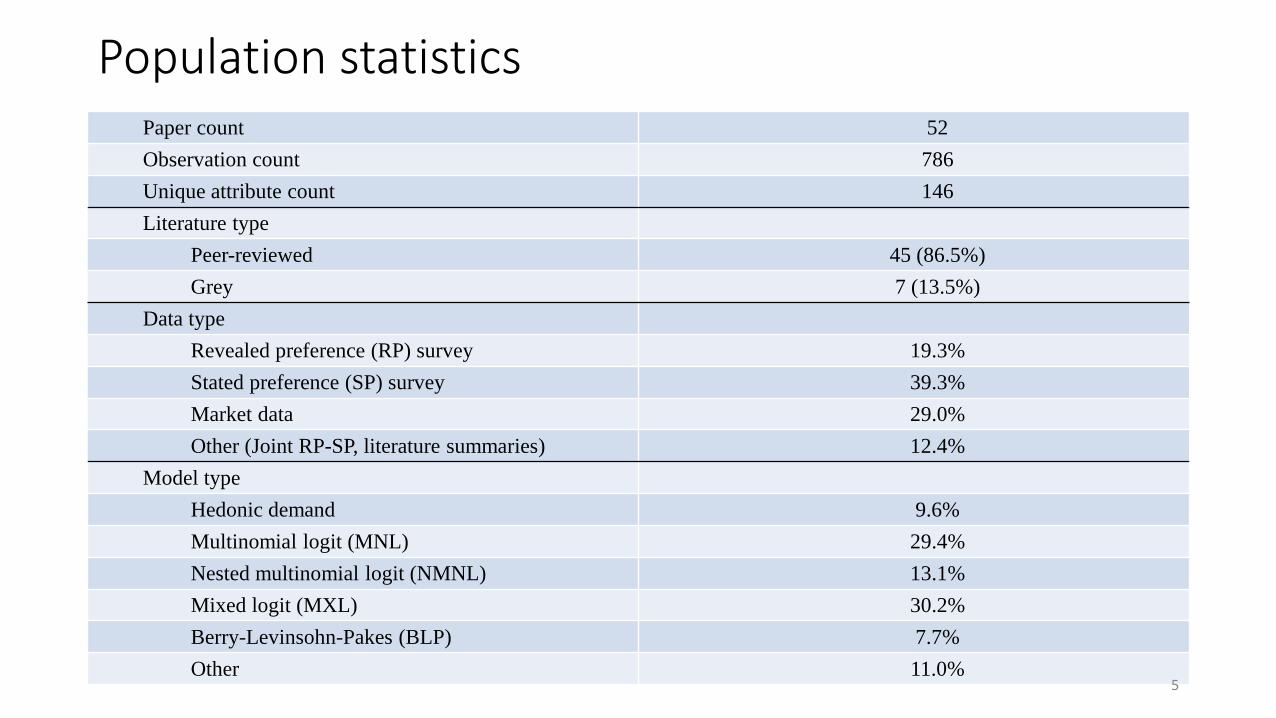
Population statisticsPaper count 52Observation count 786Unique attribute count 146Literature type
Peer-reviewed 45 (86.5%)Grey 7 (13.5%)
Data typeRevealed preference (RP) survey 19.3%Stated preference (SP) survey 39.3%Market data 29.0%Other (Joint RP-SP, literature summaries) 12.4%
Model typeHedonic demand 9.6%Multinomial logit (MNL) 29.4%Nested multinomial logit (NMNL) 13.1%Mixed logit (MXL) 30.2%Berry-Levinsohn-Pakes (BLP) 7.7%Other 11.0%
5

Bottom line: Lots of variability• Results vary pretty widely, not only across studies, but within studies• Modeling results appear sensitive to a number of factors, potentially
including:• Sources of underlying data• Modeling methods• Included & omitted variables• Functional form
• They suggest a lack of robustness in the measurement of these WTP values.
• Which raises the question of the robustness of the underlying models &/or parameters
6
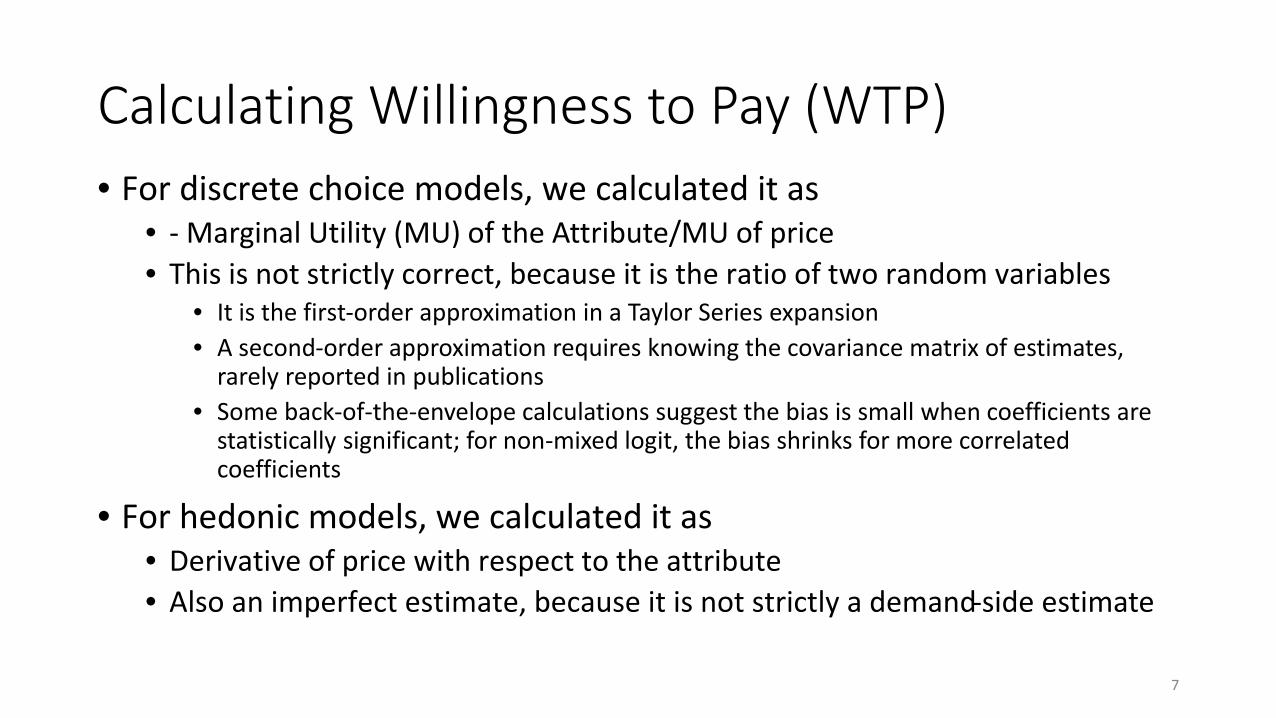
Calculating Willingness to Pay (WTP)• For discrete choice models, we calculated it as
• - Marginal Utility (MU) of the Attribute/MU of price• This is not strictly correct, because it is the ratio of two random variables
• It is the first-order approximation in a Taylor Series expansion• A second-order approximation requires knowing the covariance matrix of estimates,
rarely reported in publications• Some back-of-the-envelope calculations suggest the bias is small when coefficients are
statistically significant; for non-mixed logit, the bias shrinks for more correlated coefficients
• For hedonic models, we calculated it as• Derivative of price with respect to the attribute• Also an imperfect estimate, because it is not strictly a demand-side estimate
7
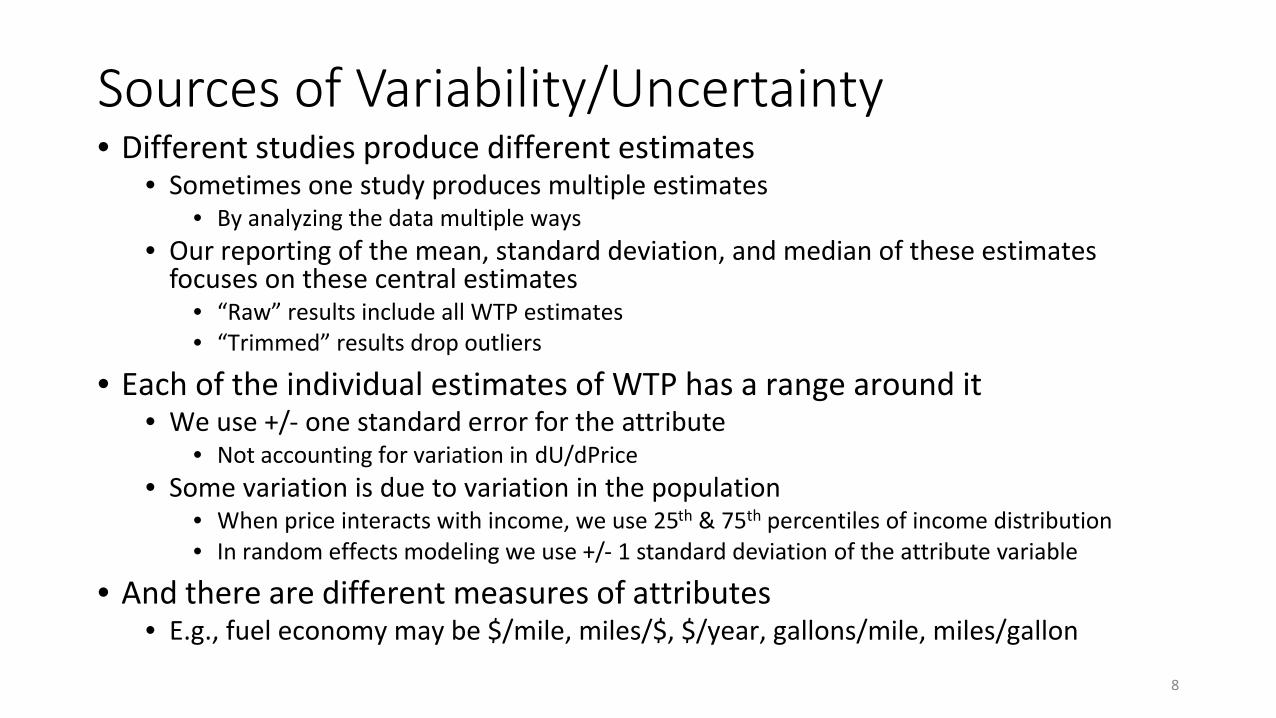
Sources of Variability/Uncertainty• Different studies produce different estimates
• Sometimes one study produces multiple estimates• By analyzing the data multiple ways
• Our reporting of the mean, standard deviation, and median of these estimates focuses on these central estimates
• “Raw” results include all WTP estimates• “Trimmed” results drop outliers
• Each of the individual estimates of WTP has a range around it• We use +/- one standard error for the attribute
• Not accounting for variation in dU/dPrice• Some variation is due to variation in the population
• When price interacts with income, we use 25th & 75th percentiles of income distribution• In random effects modeling we use +/- 1 standard deviation of the attribute variable
• And there are different measures of attributes• E.g., fuel economy may be $/mile, miles/$, $/year, gallons/mile, miles/gallon
8
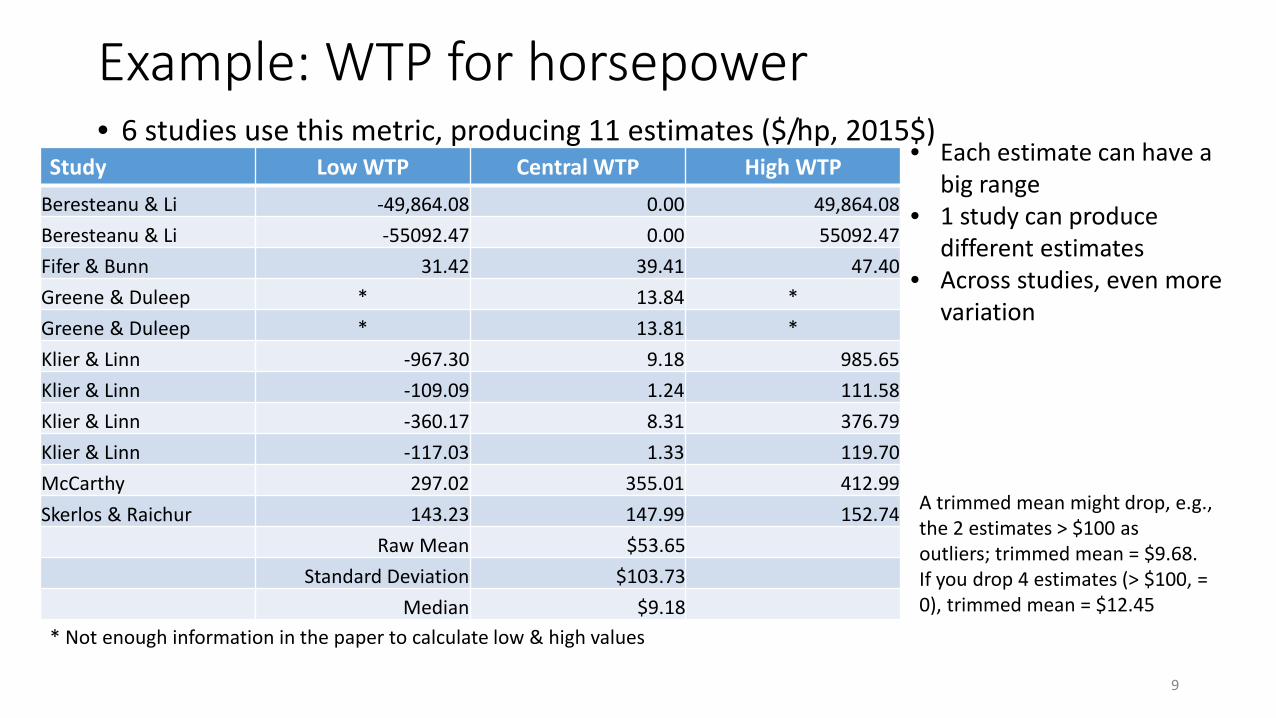
Example: WTP for horsepower• 6 studies use this metric, producing 11 estimates ($/hp, 2015$)
9
Study Low WTP Central WTP High WTPBeresteanu & Li -49,864.08 0.00 49,864.08Beresteanu & Li -55092.47 0.00 55092.47Fifer & Bunn 31.42 39.41 47.40Greene & Duleep * 13.84 *Greene & Duleep * 13.81 *Klier & Linn -967.30 9.18 985.65Klier & Linn -109.09 1.24 111.58Klier & Linn -360.17 8.31 376.79Klier & Linn -117.03 1.33 119.70McCarthy 297.02 355.01 412.99Skerlos & Raichur 143.23 147.99 152.74
Raw Mean $53.65Standard Deviation $103.73
Median $9.18* Not enough information in the paper to calculate low & high values
A trimmed mean might drop, e.g., the 2 estimates > $100 as outliers; trimmed mean = $9.68.If you drop 4 estimates (> $100, = 0), trimmed mean = $12.45
• Each estimate can have a big range
• 1 study can produce different estimates
• Across studies, even more variation
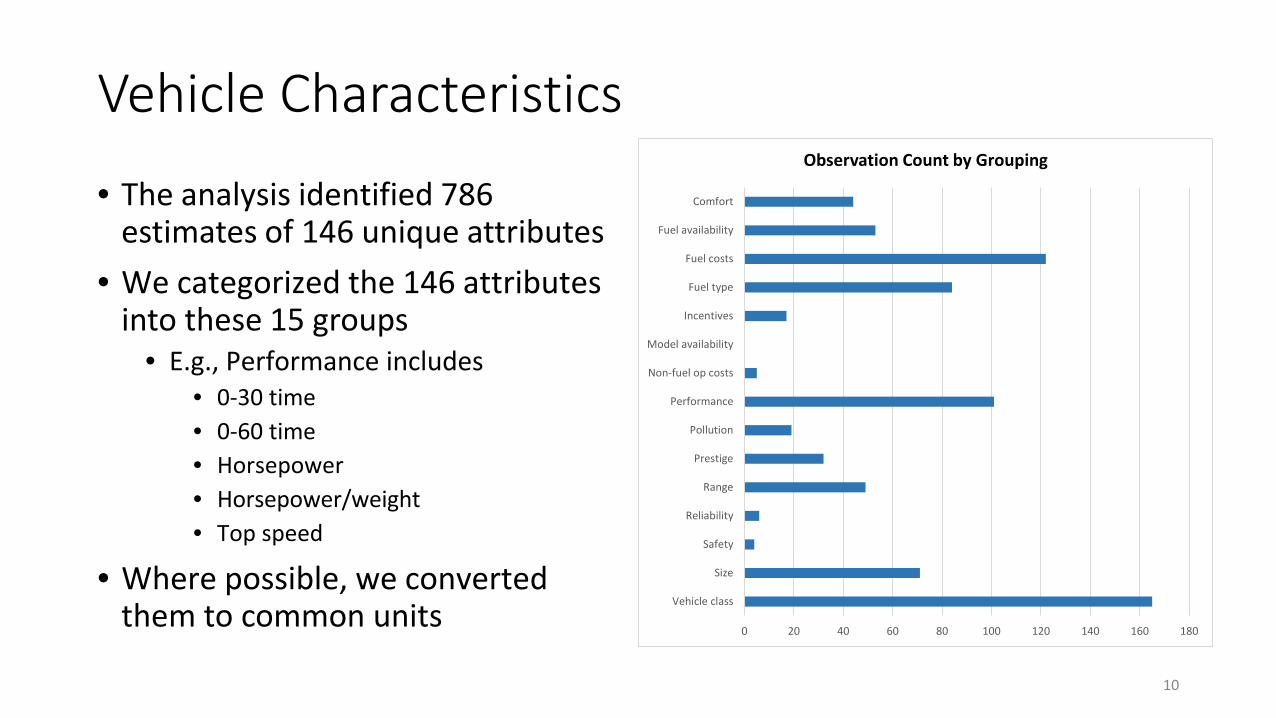
Vehicle Characteristics
• The analysis identified 786 estimates of 146 unique attributes
• We categorized the 146 attributes into these 15 groups
• E.g., Performance includes• 0-30 time• 0-60 time• Horsepower• Horsepower/weight• Top speed
• Where possible, we converted them to common units
10
0 20 40 60 80 100 120 140 160 180
Vehicle class
Size
Safety
Reliability
Range
Prestige
Pollution
Performance
Non-fuel op costs
Model availability
Incentives
Fuel type
Fuel costs
Fuel availability
Comfort
Observation Count by Grouping
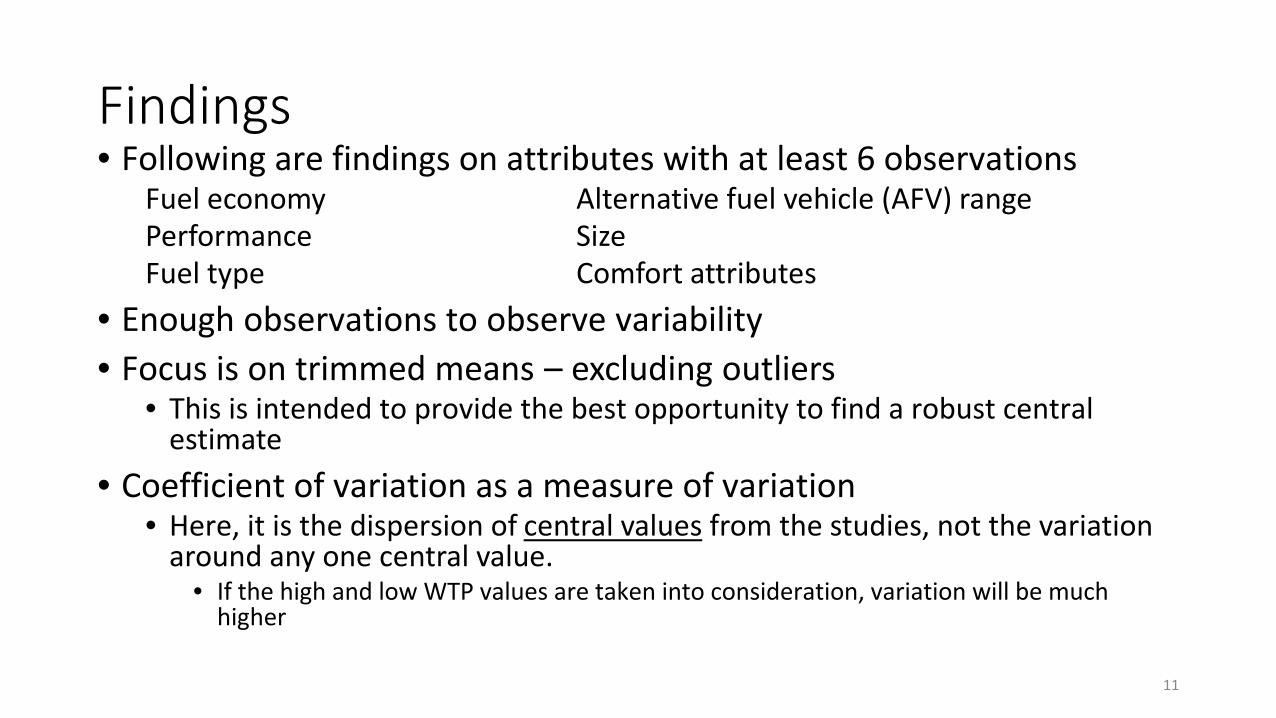
Findings• Following are findings on attributes with at least 6 observations
Fuel economy Alternative fuel vehicle (AFV) rangePerformance SizeFuel type Comfort attributes
• Enough observations to observe variability• Focus is on trimmed means – excluding outliers
• This is intended to provide the best opportunity to find a robust central estimate
• Coefficient of variation as a measure of variation• Here, it is the dispersion of central values from the studies, not the variation
around any one central value.• If the high and low WTP values are taken into consideration, variation will be much
higher
11
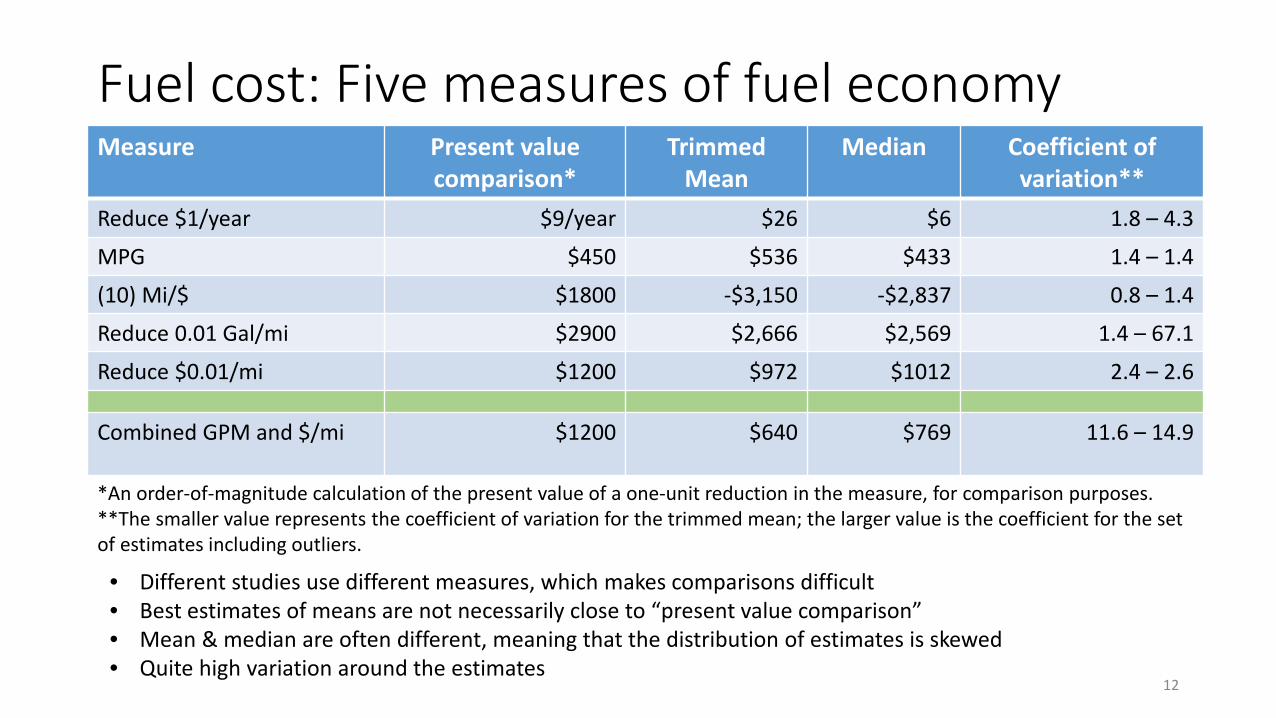
Fuel cost: Five measures of fuel economyMeasure Present value
comparison*Trimmed
MeanMedian Coefficient of
variation**Reduce $1/year $9/year $26 $6 1.8 – 4.3
MPG $450 $536 $433 1.4 – 1.4
(10) Mi/$ $1800 -$3,150 -$2,837 0.8 – 1.4
Reduce 0.01 Gal/mi $2900 $2,666 $2,569 1.4 – 67.1
Reduce $0.01/mi $1200 $972 $1012 2.4 – 2.6
Combined GPM and $/mi $1200 $640 $769 11.6 – 14.9
*An order-of-magnitude calculation of the present value of a one-unit reduction in the measure, for comparison purposes.**The smaller value represents the coefficient of variation for the trimmed mean; the larger value is the coefficient for the set of estimates including outliers.
12
• Different studies use different measures, which makes comparisons difficult• Best estimates of means are not necessarily close to “present value comparison”• Mean & median are often different, meaning that the distribution of estimates is skewed• Quite high variation around the estimates
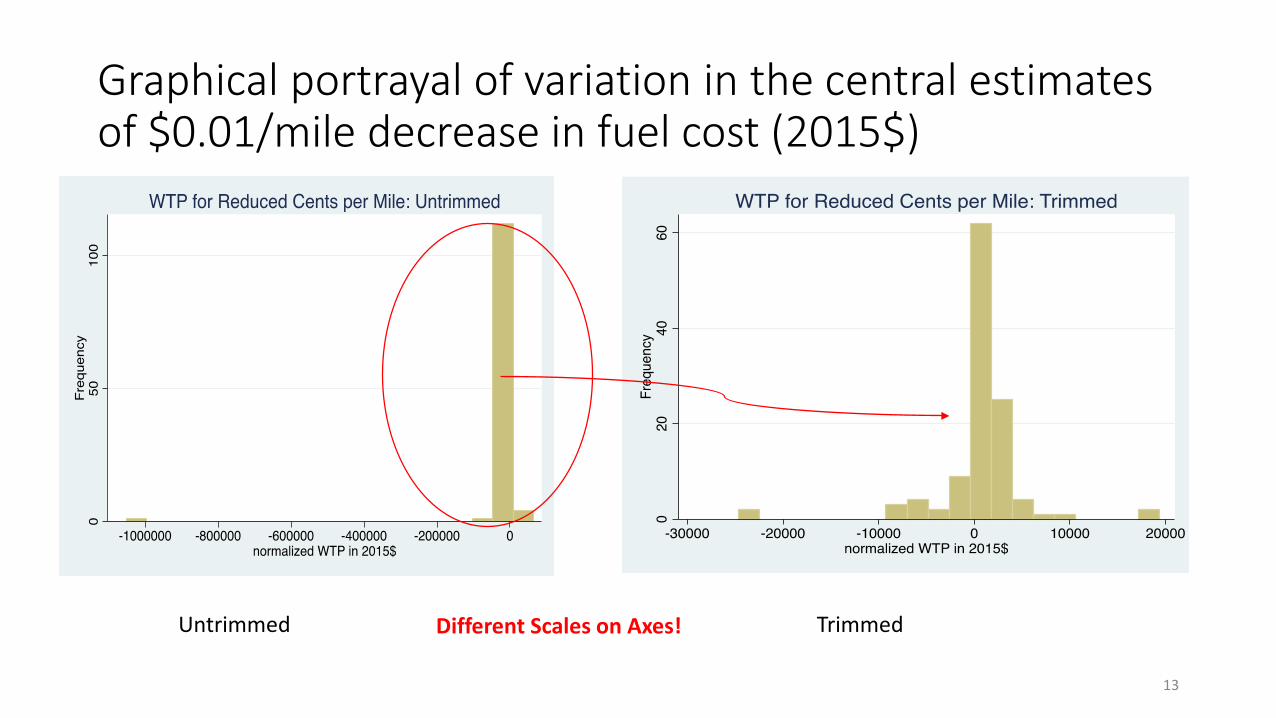
Graphical portrayal of variation in the central estimates of $0.01/mile decrease in fuel cost (2015$)
13
Untrimmed TrimmedDifferent Scales on Axes!

Variation in WTP for $0.01/mi decrease in fuel cost• In some studies, variation is due to preference heterogeneity via random
coefficients• In some studies, variation is due to the standard errors about each estimate
14
Preference Heterogeneity
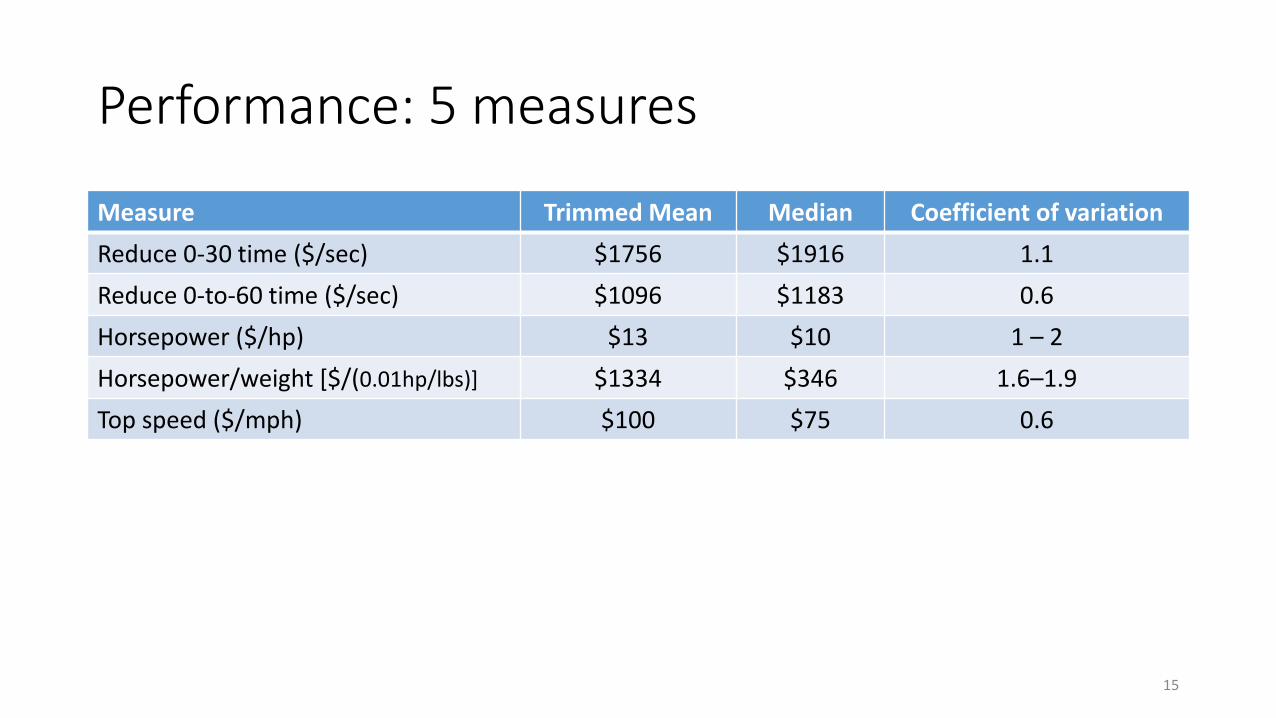
Performance: 5 measures
Measure Trimmed Mean Median Coefficient of variationReduce 0-30 time ($/sec) $1756 $1916 1.1Reduce 0-to-60 time ($/sec) $1096 $1183 0.6Horsepower ($/hp) $13 $10 1 – 2Horsepower/weight [$/(0.01hp/lbs)] $1334 $346 1.6–1.9Top speed ($/mph) $100 $75 0.6
15
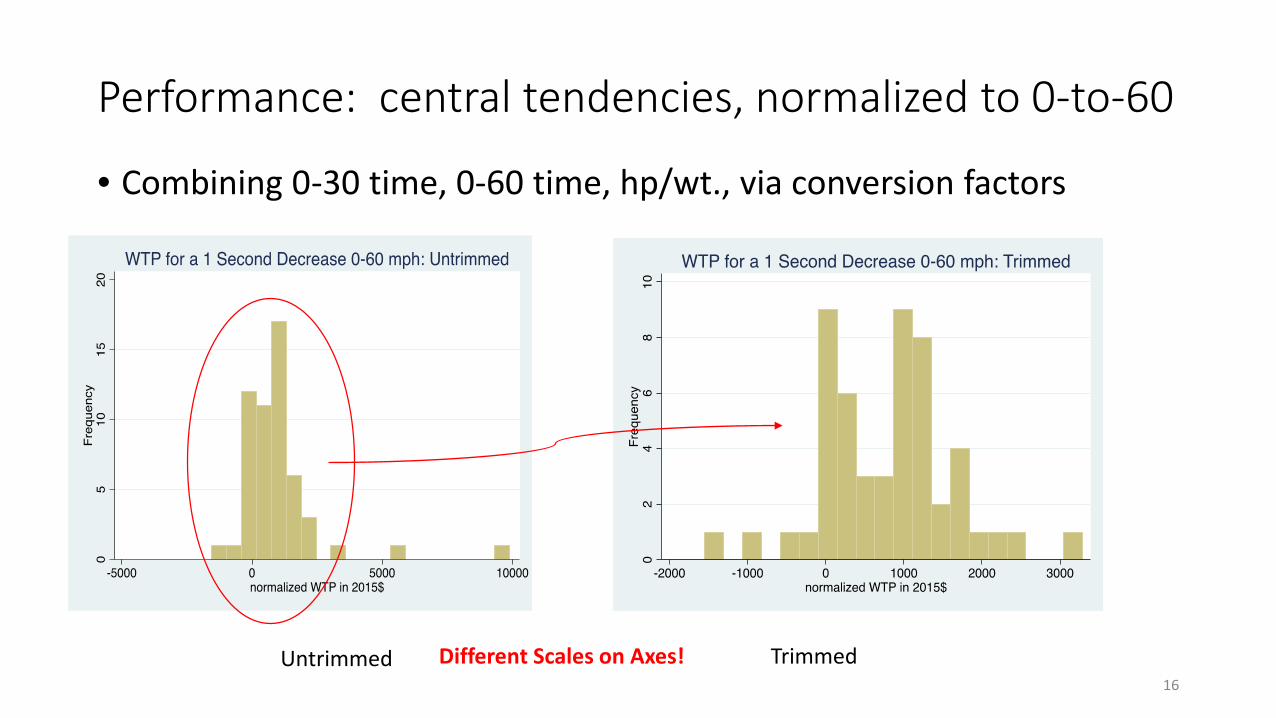
Performance: central tendencies, normalized to 0-to-60
• Combining 0-30 time, 0-60 time, hp/wt., via conversion factors
Untrimmed TrimmedDifferent Scales on Axes!16
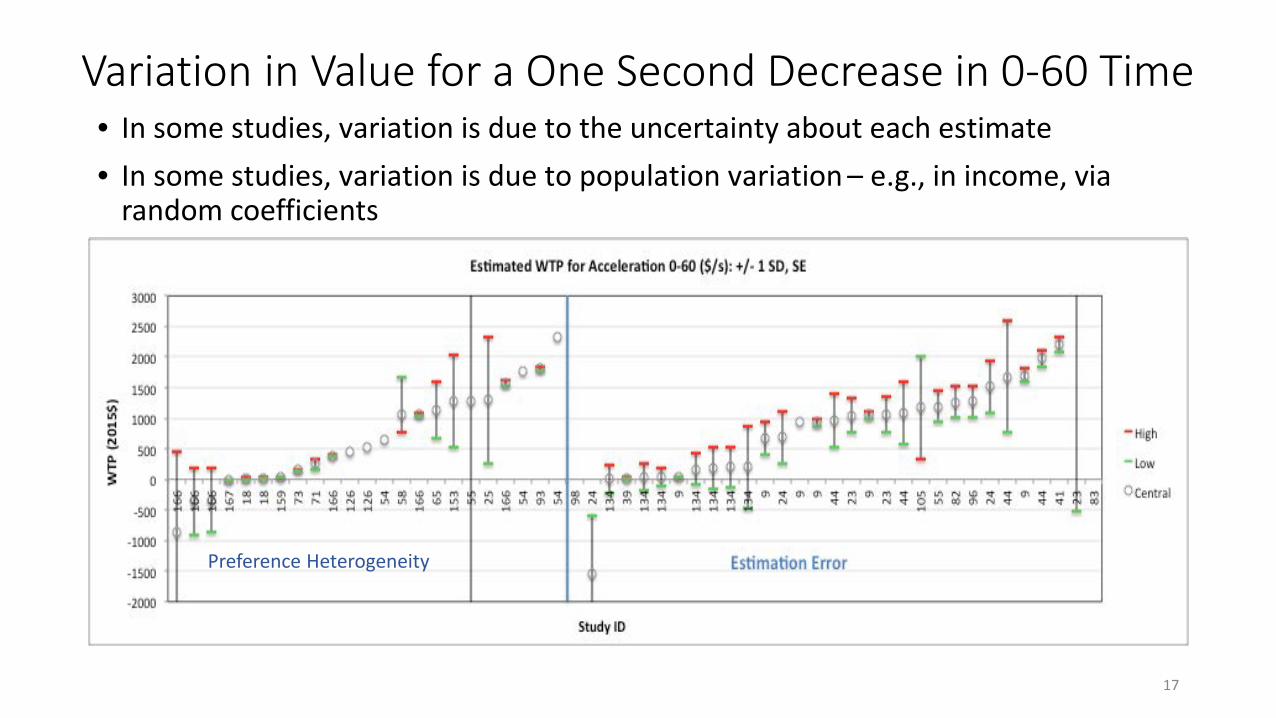
Variation in Value for a One Second Decrease in 0-60 Time• In some studies, variation is due to the uncertainty about each estimate• In some studies, variation is due to population variation – e.g., in income, via
random coefficients
17
Preference Heterogeneity
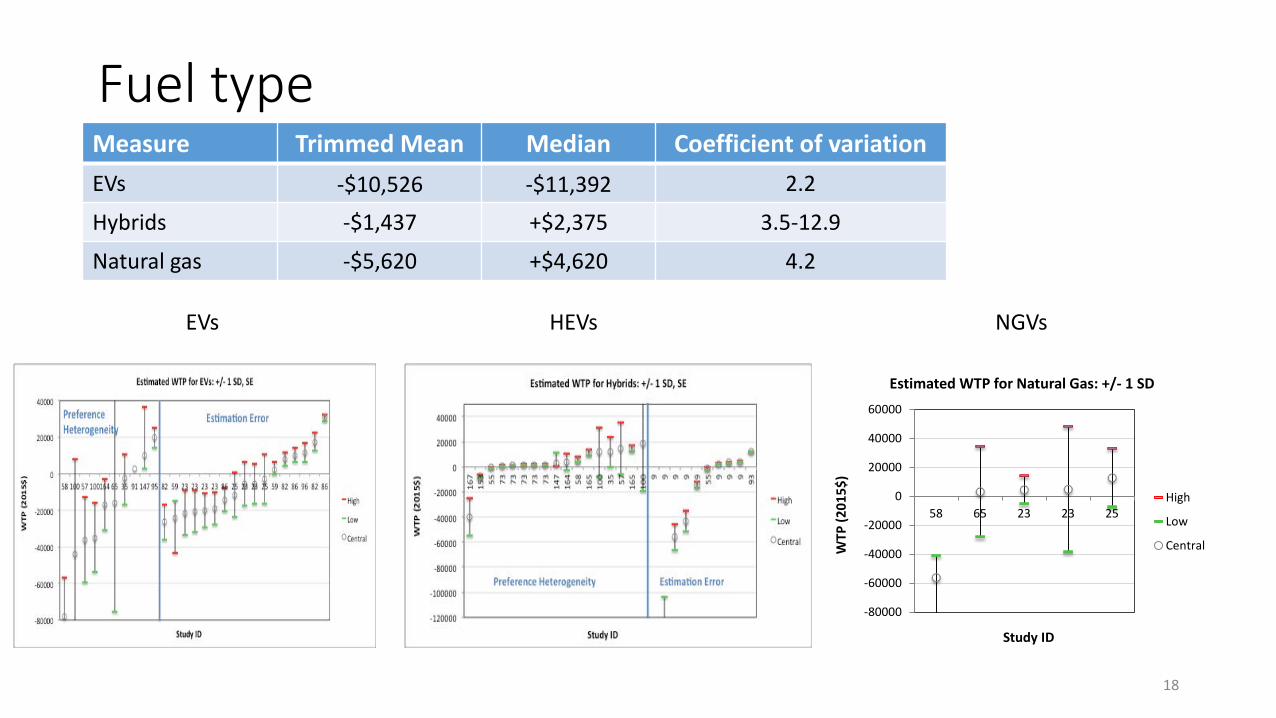
Fuel typeMeasure Trimmed Mean Median Coefficient of variationEVs -$10,526 -$11,392 2.2
Hybrids -$1,437 +$2,375 3.5-12.9
Natural gas -$5,620 +$4,620 4.2
18
EVs HEVs NGVs
-80000
-60000
-40000
-20000
0
20000
40000
60000
58 65 23 23 25
WTP
(201
5$)
Study ID
Estimated WTP for Natural Gas: +/- 1 SD
High
Low
Central
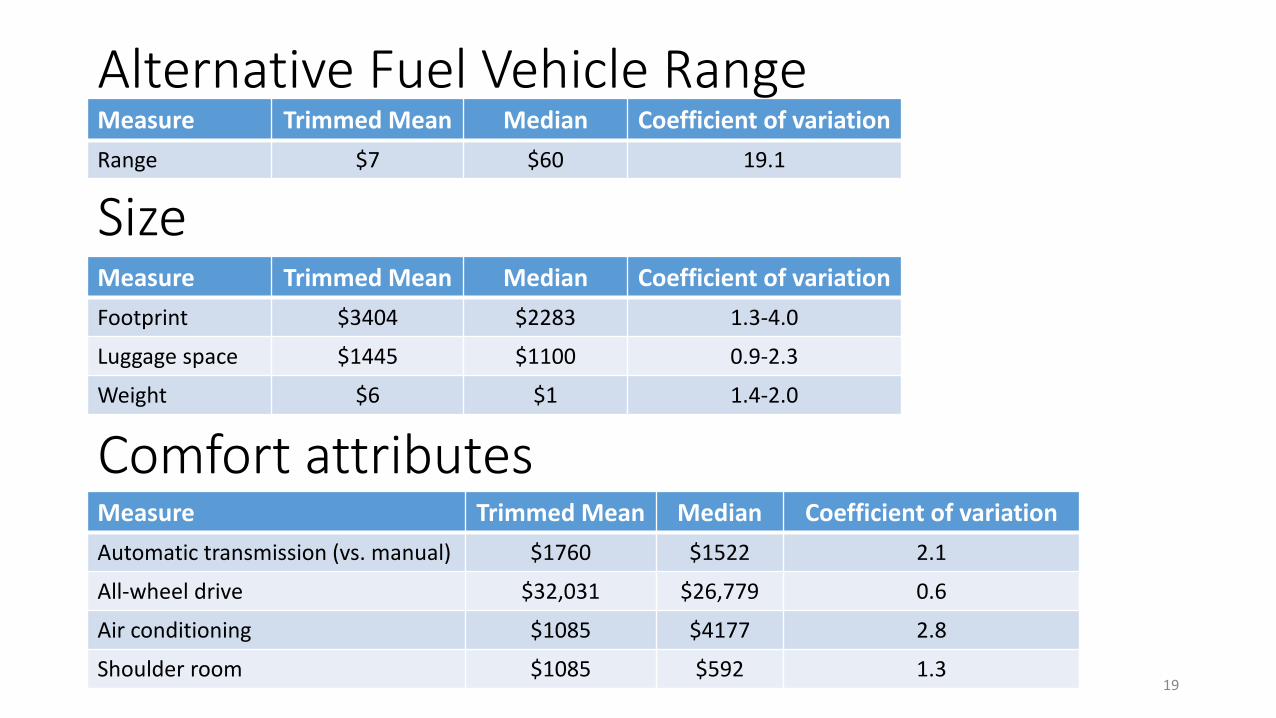
Alternative Fuel Vehicle RangeMeasure Trimmed Mean Median Coefficient of variationRange $7 $60 19.1
SizeMeasure Trimmed Mean Median Coefficient of variationFootprint $3404 $2283 1.3-4.0
Luggage space $1445 $1100 0.9-2.3
Weight $6 $1 1.4-2.0
Comfort attributesMeasure Trimmed Mean Median Coefficient of variationAutomatic transmission (vs. manual) $1760 $1522 2.1
All-wheel drive $32,031 $26,779 0.6
Air conditioning $1085 $4177 2.8
Shoulder room $1085 $592 1.319
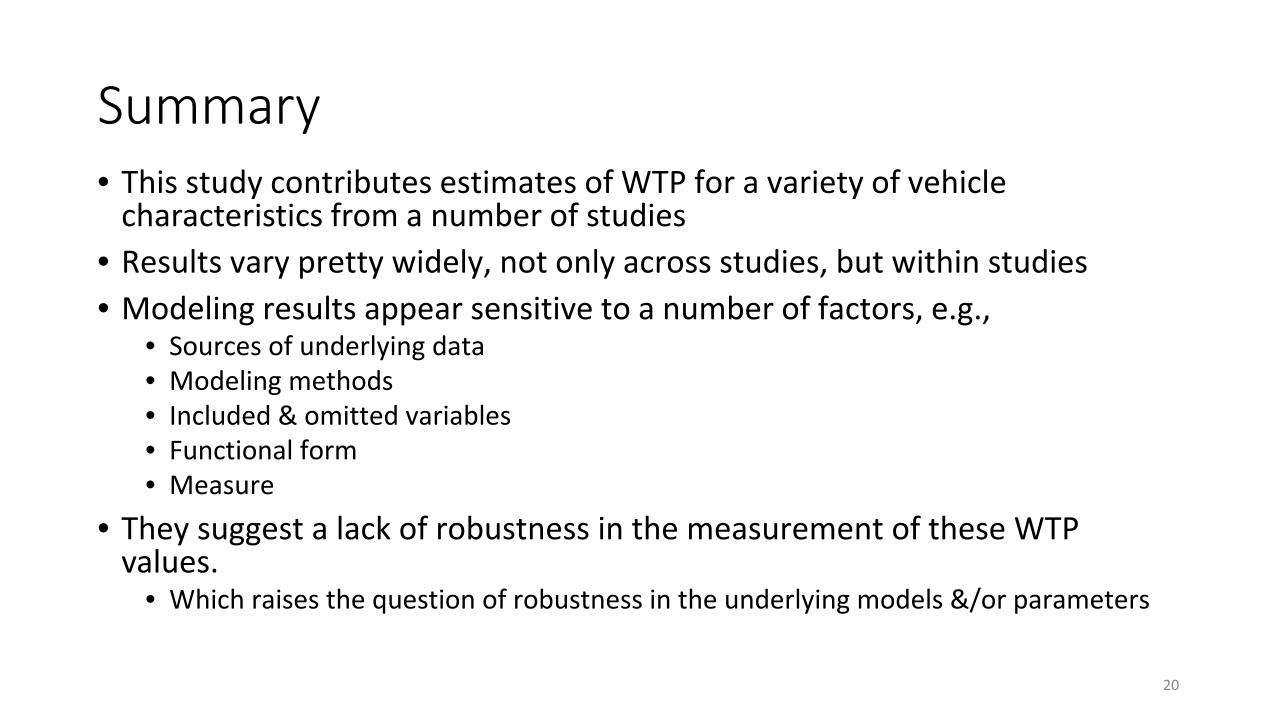
Summary• This study contributes estimates of WTP for a variety of vehicle
characteristics from a number of studies• Results vary pretty widely, not only across studies, but within studies• Modeling results appear sensitive to a number of factors, e.g.,
• Sources of underlying data• Modeling methods• Included & omitted variables• Functional form• Measure
• They suggest a lack of robustness in the measurement of these WTP values.
• Which raises the question of robustness in the underlying models &/or parameters
20
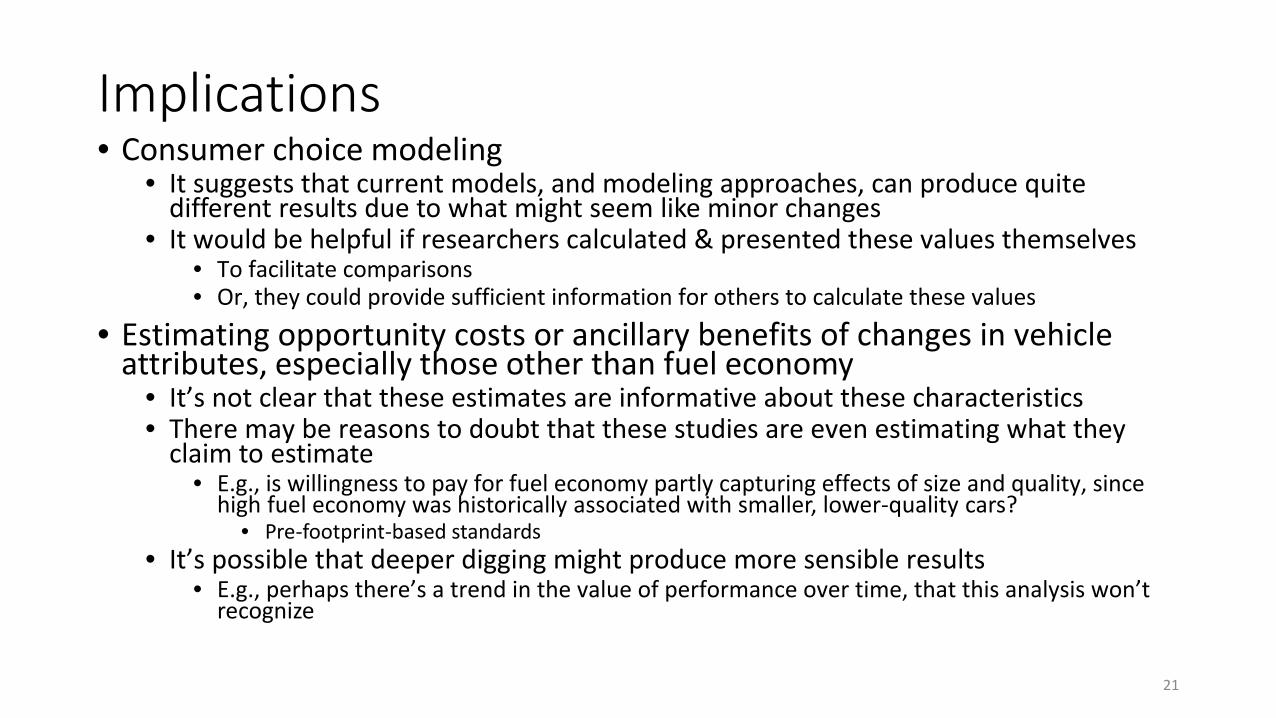
Implications• Consumer choice modeling
• It suggests that current models, and modeling approaches, can produce quite different results due to what might seem like minor changes
• It would be helpful if researchers calculated & presented these values themselves• To facilitate comparisons• Or, they could provide sufficient information for others to calculate these values
• Estimating opportunity costs or ancillary benefits of changes in vehicle attributes, especially those other than fuel economy
• It’s not clear that these estimates are informative about these characteristics• There may be reasons to doubt that these studies are even estimating what they
claim to estimate• E.g., is willingness to pay for fuel economy partly capturing effects of size and quality, since
high fuel economy was historically associated with smaller, lower-quality cars?• Pre-footprint-based standards
• It’s possible that deeper digging might produce more sensible results• E.g., perhaps there’s a trend in the value of performance over time, that this analysis won’t
recognize
21

Appendix
22
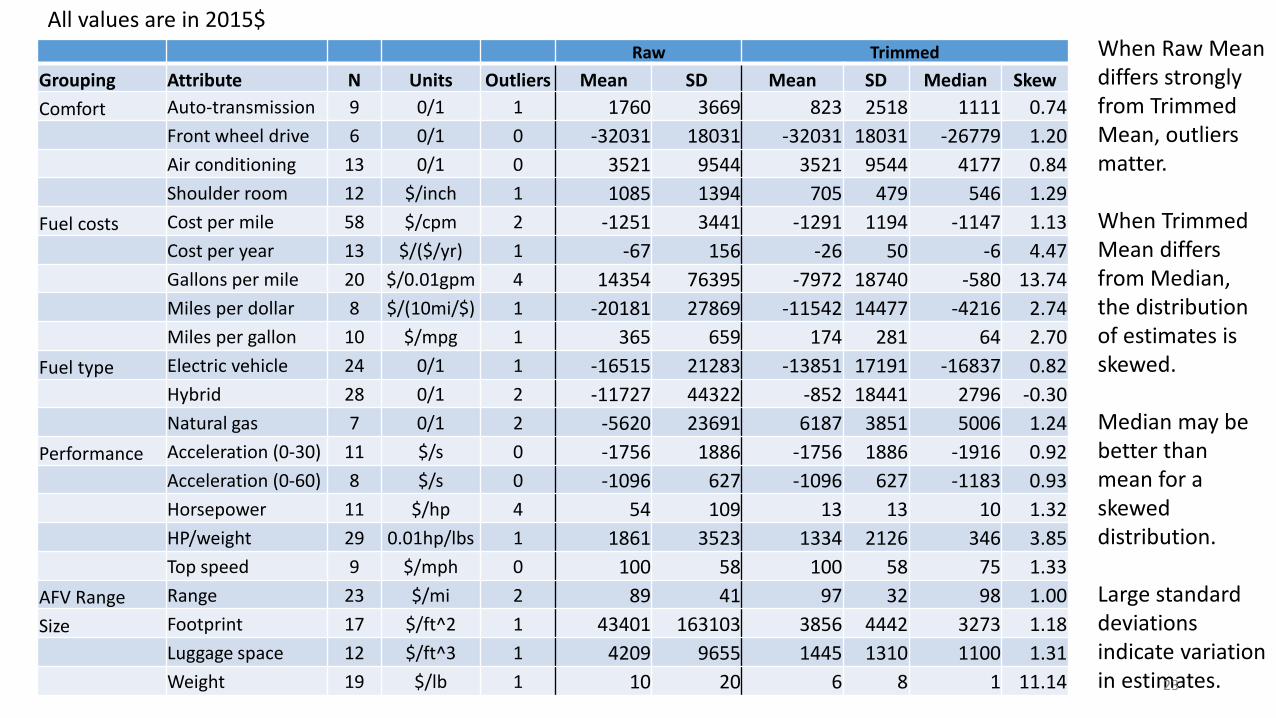
Raw TrimmedGrouping Attribute N Units Outliers Mean SD Mean SD Median SkewComfort Auto-transmission 9 0/1 1 1760 3669 823 2518 1111 0.74
Front wheel drive 6 0/1 0 -32031 18031 -32031 18031 -26779 1.20Air conditioning 13 0/1 0 3521 9544 3521 9544 4177 0.84Shoulder room 12 $/inch 1 1085 1394 705 479 546 1.29
Fuel costs Cost per mile 58 $/cpm 2 -1251 3441 -1291 1194 -1147 1.13Cost per year 13 $/($/yr) 1 -67 156 -26 50 -6 4.47Gallons per mile 20 $/0.01gpm 4 14354 76395 -7972 18740 -580 13.74Miles per dollar 8 $/(10mi/$) 1 -20181 27869 -11542 14477 -4216 2.74Miles per gallon 10 $/mpg 1 365 659 174 281 64 2.70
Fuel type Electric vehicle 24 0/1 1 -16515 21283 -13851 17191 -16837 0.82Hybrid 28 0/1 2 -11727 44322 -852 18441 2796 -0.30Natural gas 7 0/1 2 -5620 23691 6187 3851 5006 1.24
Performance Acceleration (0-30) 11 $/s 0 -1756 1886 -1756 1886 -1916 0.92Acceleration (0-60) 8 $/s 0 -1096 627 -1096 627 -1183 0.93Horsepower 11 $/hp 4 54 109 13 13 10 1.32HP/weight 29 0.01hp/lbs 1 1861 3523 1334 2126 346 3.85Top speed 9 $/mph 0 100 58 100 58 75 1.33
AFV Range Range 23 $/mi 2 89 41 97 32 98 1.00Size Footprint 17 $/ft^2 1 43401 163103 3856 4442 3273 1.18
Luggage space 12 $/ft^3 1 4209 9655 1445 1310 1100 1.31Weight 19 $/lb 1 10 20 6 8 1 11.14
When Raw Mean differs strongly from Trimmed Mean, outliers matter.
When Trimmed Mean differs from Median, the distribution of estimates is skewed.
Median may be better than mean for a skewed distribution.
Large standard deviations indicate variation in estimates.23
All values are in 2015$
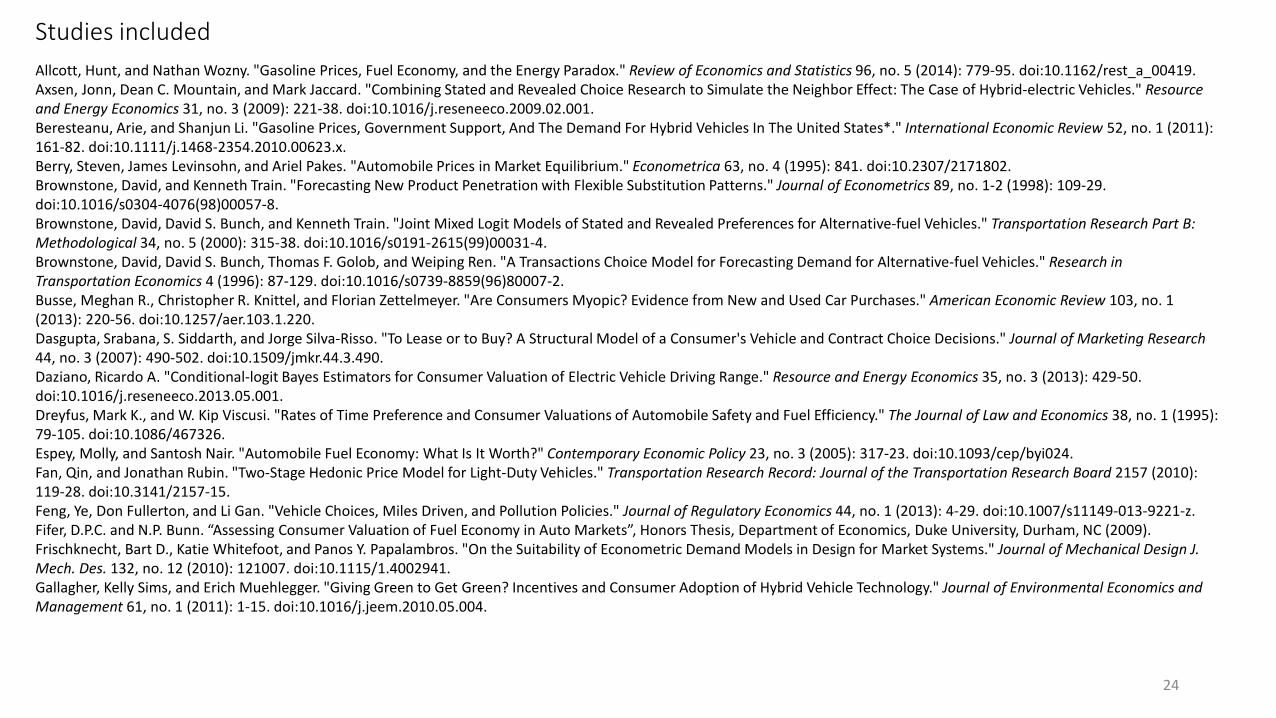
Studies includedAllcott, Hunt, and Nathan Wozny. "Gasoline Prices, Fuel Economy, and the Energy Paradox." Review of Economics and Statistics 96, no. 5 (2014): 779-95. doi:10.1162/rest_a_00419.Axsen, Jonn, Dean C. Mountain, and Mark Jaccard. "Combining Stated and Revealed Choice Research to Simulate the Neighbor Effect: The Case of Hybrid-electric Vehicles." Resource and Energy Economics 31, no. 3 (2009): 221-38. doi:10.1016/j.reseneeco.2009.02.001.Beresteanu, Arie, and Shanjun Li. "Gasoline Prices, Government Support, And The Demand For Hybrid Vehicles In The United States*." International Economic Review 52, no. 1 (2011): 161-82. doi:10.1111/j.1468-2354.2010.00623.x.Berry, Steven, James Levinsohn, and Ariel Pakes. "Automobile Prices in Market Equilibrium." Econometrica 63, no. 4 (1995): 841. doi:10.2307/2171802.Brownstone, David, and Kenneth Train. "Forecasting New Product Penetration with Flexible Substitution Patterns." Journal of Econometrics 89, no. 1-2 (1998): 109-29. doi:10.1016/s0304-4076(98)00057-8.Brownstone, David, David S. Bunch, and Kenneth Train. "Joint Mixed Logit Models of Stated and Revealed Preferences for Alternative-fuel Vehicles." Transportation Research Part B: Methodological 34, no. 5 (2000): 315-38. doi:10.1016/s0191-2615(99)00031-4.Brownstone, David, David S. Bunch, Thomas F. Golob, and Weiping Ren. "A Transactions Choice Model for Forecasting Demand for Alternative-fuel Vehicles." Research in Transportation Economics 4 (1996): 87-129. doi:10.1016/s0739-8859(96)80007-2. Busse, Meghan R., Christopher R. Knittel, and Florian Zettelmeyer. "Are Consumers Myopic? Evidence from New and Used Car Purchases." American Economic Review 103, no. 1 (2013): 220-56. doi:10.1257/aer.103.1.220.Dasgupta, Srabana, S. Siddarth, and Jorge Silva-Risso. "To Lease or to Buy? A Structural Model of a Consumer's Vehicle and Contract Choice Decisions." Journal of Marketing Research44, no. 3 (2007): 490-502. doi:10.1509/jmkr.44.3.490.Daziano, Ricardo A. "Conditional-logit Bayes Estimators for Consumer Valuation of Electric Vehicle Driving Range." Resource and Energy Economics 35, no. 3 (2013): 429-50. doi:10.1016/j.reseneeco.2013.05.001.Dreyfus, Mark K., and W. Kip Viscusi. "Rates of Time Preference and Consumer Valuations of Automobile Safety and Fuel Efficiency." The Journal of Law and Economics 38, no. 1 (1995): 79-105. doi:10.1086/467326.Espey, Molly, and Santosh Nair. "Automobile Fuel Economy: What Is It Worth?" Contemporary Economic Policy 23, no. 3 (2005): 317-23. doi:10.1093/cep/byi024.Fan, Qin, and Jonathan Rubin. "Two-Stage Hedonic Price Model for Light-Duty Vehicles." Transportation Research Record: Journal of the Transportation Research Board 2157 (2010): 119-28. doi:10.3141/2157-15.Feng, Ye, Don Fullerton, and Li Gan. "Vehicle Choices, Miles Driven, and Pollution Policies." Journal of Regulatory Economics 44, no. 1 (2013): 4-29. doi:10.1007/s11149-013-9221-z.Fifer, D.P.C. and N.P. Bunn. “Assessing Consumer Valuation of Fuel Economy in Auto Markets”, Honors Thesis, Department of Economics, Duke University, Durham, NC (2009).Frischknecht, Bart D., Katie Whitefoot, and Panos Y. Papalambros. "On the Suitability of Econometric Demand Models in Design for Market Systems." Journal of Mechanical Design J. Mech. Des. 132, no. 12 (2010): 121007. doi:10.1115/1.4002941.Gallagher, Kelly Sims, and Erich Muehlegger. "Giving Green to Get Green? Incentives and Consumer Adoption of Hybrid Vehicle Technology." Journal of Environmental Economics and Management 61, no. 1 (2011): 1-15. doi:10.1016/j.jeem.2010.05.004.
24
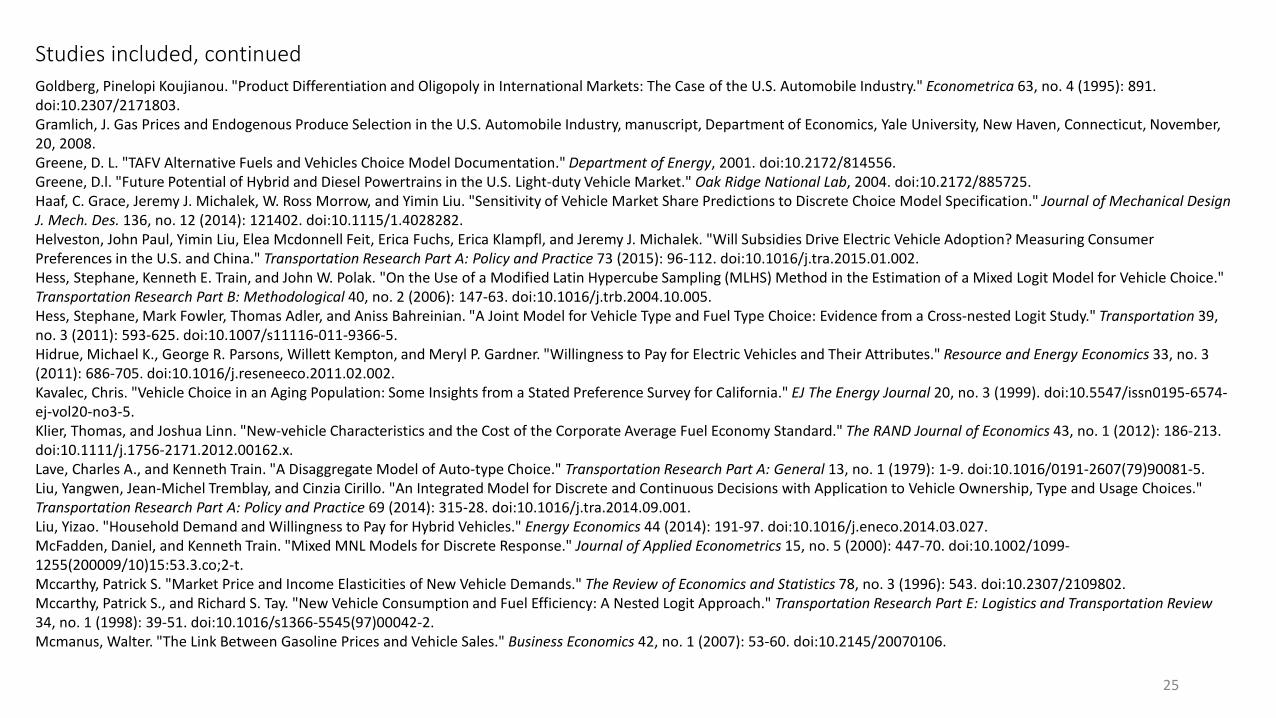
Studies included, continuedGoldberg, Pinelopi Koujianou. "Product Differentiation and Oligopoly in International Markets: The Case of the U.S. Automobile Industry." Econometrica 63, no. 4 (1995): 891. doi:10.2307/2171803.Gramlich, J. Gas Prices and Endogenous Produce Selection in the U.S. Automobile Industry, manuscript, Department of Economics, Yale University, New Haven, Connecticut, November, 20, 2008.Greene, D. L. "TAFV Alternative Fuels and Vehicles Choice Model Documentation." Department of Energy, 2001. doi:10.2172/814556.Greene, D.l. "Future Potential of Hybrid and Diesel Powertrains in the U.S. Light-duty Vehicle Market." Oak Ridge National Lab, 2004. doi:10.2172/885725.Haaf, C. Grace, Jeremy J. Michalek, W. Ross Morrow, and Yimin Liu. "Sensitivity of Vehicle Market Share Predictions to Discrete Choice Model Specification." Journal of Mechanical Design J. Mech. Des. 136, no. 12 (2014): 121402. doi:10.1115/1.4028282.Helveston, John Paul, Yimin Liu, Elea Mcdonnell Feit, Erica Fuchs, Erica Klampfl, and Jeremy J. Michalek. "Will Subsidies Drive Electric Vehicle Adoption? Measuring Consumer Preferences in the U.S. and China." Transportation Research Part A: Policy and Practice 73 (2015): 96-112. doi:10.1016/j.tra.2015.01.002.Hess, Stephane, Kenneth E. Train, and John W. Polak. "On the Use of a Modified Latin Hypercube Sampling (MLHS) Method in the Estimation of a Mixed Logit Model for Vehicle Choice."Transportation Research Part B: Methodological 40, no. 2 (2006): 147-63. doi:10.1016/j.trb.2004.10.005.Hess, Stephane, Mark Fowler, Thomas Adler, and Aniss Bahreinian. "A Joint Model for Vehicle Type and Fuel Type Choice: Evidence from a Cross-nested Logit Study." Transportation 39, no. 3 (2011): 593-625. doi:10.1007/s11116-011-9366-5.Hidrue, Michael K., George R. Parsons, Willett Kempton, and Meryl P. Gardner. "Willingness to Pay for Electric Vehicles and Their Attributes." Resource and Energy Economics 33, no. 3 (2011): 686-705. doi:10.1016/j.reseneeco.2011.02.002.Kavalec, Chris. "Vehicle Choice in an Aging Population: Some Insights from a Stated Preference Survey for California." EJ The Energy Journal 20, no. 3 (1999). doi:10.5547/issn0195-6574-ej-vol20-no3-5.Klier, Thomas, and Joshua Linn. "New-vehicle Characteristics and the Cost of the Corporate Average Fuel Economy Standard." The RAND Journal of Economics 43, no. 1 (2012): 186-213. doi:10.1111/j.1756-2171.2012.00162.x.Lave, Charles A., and Kenneth Train. "A Disaggregate Model of Auto-type Choice." Transportation Research Part A: General 13, no. 1 (1979): 1-9. doi:10.1016/0191-2607(79)90081-5.Liu, Yangwen, Jean-Michel Tremblay, and Cinzia Cirillo. "An Integrated Model for Discrete and Continuous Decisions with Application to Vehicle Ownership, Type and Usage Choices." Transportation Research Part A: Policy and Practice 69 (2014): 315-28. doi:10.1016/j.tra.2014.09.001.Liu, Yizao. "Household Demand and Willingness to Pay for Hybrid Vehicles." Energy Economics 44 (2014): 191-97. doi:10.1016/j.eneco.2014.03.027.McFadden, Daniel, and Kenneth Train. "Mixed MNL Models for Discrete Response." Journal of Applied Econometrics 15, no. 5 (2000): 447-70. doi:10.1002/1099-1255(200009/10)15:53.3.co;2-t.Mccarthy, Patrick S. "Market Price and Income Elasticities of New Vehicle Demands." The Review of Economics and Statistics 78, no. 3 (1996): 543. doi:10.2307/2109802.Mccarthy, Patrick S., and Richard S. Tay. "New Vehicle Consumption and Fuel Efficiency: A Nested Logit Approach." Transportation Research Part E: Logistics and Transportation Review34, no. 1 (1998): 39-51. doi:10.1016/s1366-5545(97)00042-2.Mcmanus, Walter. "The Link Between Gasoline Prices and Vehicle Sales." Business Economics 42, no. 1 (2007): 53-60. doi:10.2145/20070106.
25
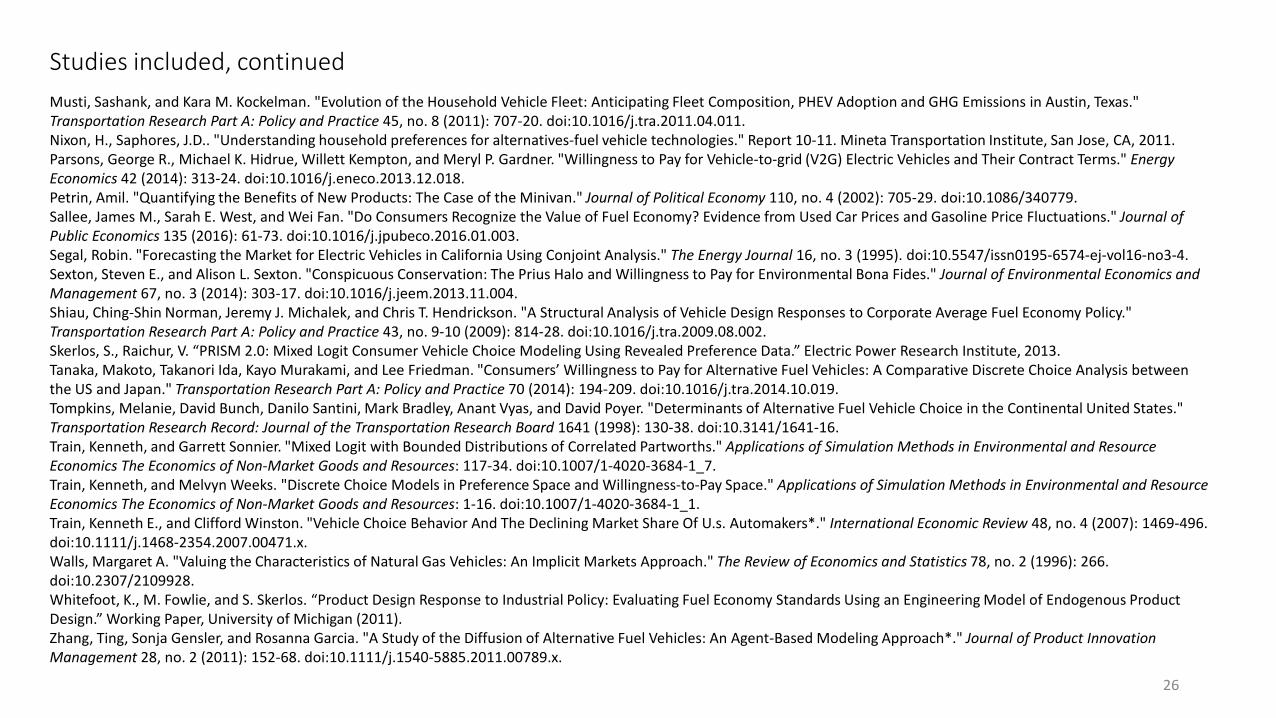
Studies included, continuedMusti, Sashank, and Kara M. Kockelman. "Evolution of the Household Vehicle Fleet: Anticipating Fleet Composition, PHEV Adoption and GHG Emissions in Austin, Texas." Transportation Research Part A: Policy and Practice 45, no. 8 (2011): 707-20. doi:10.1016/j.tra.2011.04.011.Nixon, H., Saphores, J.D.. "Understanding household preferences for alternatives-fuel vehicle technologies." Report 10-11. Mineta Transportation Institute, San Jose, CA, 2011.Parsons, George R., Michael K. Hidrue, Willett Kempton, and Meryl P. Gardner. "Willingness to Pay for Vehicle-to-grid (V2G) Electric Vehicles and Their Contract Terms." Energy Economics 42 (2014): 313-24. doi:10.1016/j.eneco.2013.12.018.Petrin, Amil. "Quantifying the Benefits of New Products: The Case of the Minivan." Journal of Political Economy 110, no. 4 (2002): 705-29. doi:10.1086/340779.Sallee, James M., Sarah E. West, and Wei Fan. "Do Consumers Recognize the Value of Fuel Economy? Evidence from Used Car Prices and Gasoline Price Fluctuations." Journal of Public Economics 135 (2016): 61-73. doi:10.1016/j.jpubeco.2016.01.003. Segal, Robin. "Forecasting the Market for Electric Vehicles in California Using Conjoint Analysis." The Energy Journal 16, no. 3 (1995). doi:10.5547/issn0195-6574-ej-vol16-no3-4.Sexton, Steven E., and Alison L. Sexton. "Conspicuous Conservation: The Prius Halo and Willingness to Pay for Environmental Bona Fides." Journal of Environmental Economics and Management 67, no. 3 (2014): 303-17. doi:10.1016/j.jeem.2013.11.004.Shiau, Ching-Shin Norman, Jeremy J. Michalek, and Chris T. Hendrickson. "A Structural Analysis of Vehicle Design Responses to Corporate Average Fuel Economy Policy." Transportation Research Part A: Policy and Practice 43, no. 9-10 (2009): 814-28. doi:10.1016/j.tra.2009.08.002.Skerlos, S., Raichur, V. “PRISM 2.0: Mixed Logit Consumer Vehicle Choice Modeling Using Revealed Preference Data.” Electric Power Research Institute, 2013. Tanaka, Makoto, Takanori Ida, Kayo Murakami, and Lee Friedman. "Consumers’ Willingness to Pay for Alternative Fuel Vehicles: A Comparative Discrete Choice Analysis between the US and Japan." Transportation Research Part A: Policy and Practice 70 (2014): 194-209. doi:10.1016/j.tra.2014.10.019.Tompkins, Melanie, David Bunch, Danilo Santini, Mark Bradley, Anant Vyas, and David Poyer. "Determinants of Alternative Fuel Vehicle Choice in the Continental United States." Transportation Research Record: Journal of the Transportation Research Board 1641 (1998): 130-38. doi:10.3141/1641-16.Train, Kenneth, and Garrett Sonnier. "Mixed Logit with Bounded Distributions of Correlated Partworths." Applications of Simulation Methods in Environmental and Resource Economics The Economics of Non-Market Goods and Resources: 117-34. doi:10.1007/1-4020-3684-1_7.Train, Kenneth, and Melvyn Weeks. "Discrete Choice Models in Preference Space and Willingness-to-Pay Space." Applications of Simulation Methods in Environmental and Resource Economics The Economics of Non-Market Goods and Resources: 1-16. doi:10.1007/1-4020-3684-1_1.Train, Kenneth E., and Clifford Winston. "Vehicle Choice Behavior And The Declining Market Share Of U.s. Automakers*." International Economic Review 48, no. 4 (2007): 1469-496. doi:10.1111/j.1468-2354.2007.00471.x.Walls, Margaret A. "Valuing the Characteristics of Natural Gas Vehicles: An Implicit Markets Approach." The Review of Economics and Statistics 78, no. 2 (1996): 266. doi:10.2307/2109928.Whitefoot, K., M. Fowlie, and S. Skerlos. “Product Design Response to Industrial Policy: Evaluating Fuel Economy Standards Using an Engineering Model of Endogenous Product Design.” Working Paper, University of Michigan (2011).Zhang, Ting, Sonja Gensler, and Rosanna Garcia. "A Study of the Diffusion of Alternative Fuel Vehicles: An Agent-Based Modeling Approach*." Journal of Product Innovation Management 28, no. 2 (2011): 152-68. doi:10.1111/j.1540-5885.2011.00789.x.
26