consumer buying behaviour in fashion retailing: · pdf file0 3 5 $ munich personal repec...
TRANSCRIPT
MPRAMunich Personal RePEc Archive
Consumer Buying behaviour in FashionRetailing: Empirical Evidencies
Susana Azevedo and Madalena Pereira and Joao Ferreira and
Vilma Pedroso
University of Beira Interior
3. November 2008
Online at http://mpra.ub.uni-muenchen.de/11908/MPRA Paper No. 11908, posted 3. December 2008 16:08 UTC

407
CONSUMER BUYING BEHAVIOUR IN FASHION RETAILING: EMPIRICAL EVIDENCES
Susana Garrido Azevedo Management and Economics Department
University of Beira Interior (UBI), Pólo IV - Edifício Ernesto Cruz, 6200-209 Covilhã, Portugal
Tel: +351275319600, Fax: +351275319601, e-mail:[email protected]
Madalena Pereira
Textiles Department University of Beira Interior, Pólo I - Rua Marquês d'Ávila e Bolama, 6201-001 Covilhã, Portugal
Tel: +351275319700, Fax: +351275319768, e-mail: [email protected]
João Ferreira Management and Economics Department
University of Beira Interior, Pólo IV - Edifício Ernesto Cruz, 6200-209 Covilhã, Portugal Tel: +351275319600, Fax: +351275319601,e-mail: [email protected]
Vilma Pedroso Master in Fashion Design
University of Beira Interior, Pólo I - Rua Marquês d'Ávila e Bolama, 6201-001 Covilhã, Portugal Tel: +351275319700, Fax: +351275319768,
e-mail: [email protected]
Abstract
Consumer behaviour research is the scientific study of the processes consumers use to select, secure, use and dispose of products and services that satisfy their needs. Firms can satisfy those needs only to the extent that they understand their customers. The main objective of this paper is to study the gender differences in consumer buying behaviour of a Portuguese population when they go shopping to buy apparel products. To attain this objective a survey was developed and administered across Portugal. The findings confirm the differences between women and men especially in terms of What, Where, When, and How they buy.
Keywords: Consumer buying behaviour, Apparel, Gender. JEL: M30, L81
1. Introduction The relation between dressing and the idea of individual expression is complex. It may be perceived in people’s daily life through recurrent use of the same clothing colours, brands, fashion tendencies etc. Many people use contrasts and colours that express feelings according to their state of mind. Thus, the products’ properties, like design, comfort, individuality, have a decisive role on apparel’s buying behaviour, which may vary depending on a set of factors, mainly on sex (Fischer and Arnold, 1994).
There is a widespread recognition that consumer behaviour is the key to contemporary marketing success. In this way, the field of consumer behaviour has been characterized by a diversity of viewpoints and based on an interdisciplinary science. In this context, the understanding of consumer behaviour could appeals to a set of different areas of knowledge, such as psychological, cultural social psychological, physio-pyschological, genetics anthropology.” The main objective of this paper is to study the gender differences in consumer buying behaviour of a Portuguese population when they go shopping to buy apparel products. To attain this objective a survey was developed and administered across Portugal. The findings confirm the differences between women and men especially in terms of What, Where, When, and How they buy.
The paper starts with the presentation of the relevant literature in the area of buying behavior and then the research hypothesis is described. After that the methodology followed to develop the study is presented with a special reference to the sample method, data collection and statistics. Next, the results are presented and discussed and finally the conclusions are drawn.
408
2. Consumer Behaviour approaches
Consumer behaviour research is the scientific study of the processes consumers use to select, secure, use and dispose of products and services that satisfy their needs. Knowledge of consumer behaviour directly affects marketing strategy (Anderson et al, 2005). This is because of the marketing concept, i. e., the idea that firms exist to satisfy customer needs (Winer, 2000). Firms can satisfy those needs only to the extent that they understand their customers. For this reason, marketing strategies must incorporate knowledge of consumer behaviour into every facet of a strategic marketing plan (Solomon, 2002). …The human behaviour is complex, replete with controversies and contradictions and comes as no surprise to marketing academicians as well as practioners. There is a widespread recognition that consumer behaviour is the key to contemporary marketing success (Hawkins et al., 2003). Consumer behaviour has been legitimized in marketing for it provides the conceptual framework and strategic thinking for carrying out successful segmentation of markets (Schiffman and Kanuk 2000). There have been a number of debates between positivistic and interpretive consumer researchers (Hudson and Ozanne 1988). In this way, the field of consumer behaviour has been characterized by diversity of viewpoints; as a result, the entire field now is based on an interdisciplinary science (Kassarjian 1995). The understanding of consumer behaviour appeals to a set of different areas of knowledge/factors: psychological, cultural social psychological, physio-pyschological, genetics anthropology. One of them is the psychology since consumer behaviour deals with emotions, beliefs and attitudes. Research on emotions within marketing has evolved three approaches: the categories approach, the dimensions approach and the cognitive appraisals approach (Watson and Spence, 2007). The categories approach groups emotions around exemplars and considers their different effects on consumption related behaviour. The dimensions approach uses the affective dimensions of valence and level of arousal to distinguish between emotions and the effects they have on consumer behaviour. the cognitive appraisals approach has used emotions’ underlying motivational and evaluative roots to explain their influences on consumption related behaviours. This approach supposes that underlying evaluations of a situation (e.g. its desirability, certainty, etc.) combine to elicit specific emotions. This approach may be used to explain how an extensive range of emotions, including those with similar valence and arousal levels, are elicited and how they lead to different behavioural responses. The cognitive approach has been considered relevant for understanding the emotional responses of consumers in the marketplace (Johnson and Stewart, 2005: 3). Bagozzi et al. (1999) propose that the cognitive appraisals approach offers a more complete explanation of consumers’ behavioural responses to emotions than other one. What is apparent from the new learning, however, is that we potentially miss those beliefs and attitudes held at the unconscious or implicit level that can be crucial to determining consumer behaviour. Also the memory that people hold on their consumer experiences will drive both aversion and preference towards products. Aversion behaviour is our avoidance of certain things (brands or marketing offers) made to us as consumers. The importance of the implicit memory in terms of its capacity to process and store information cannot be understated. The implicit memory registers vast amounts of input from our surrounding environment as we move through life. Millions of experiences that we have had throughout our entire lives are stored away in a particular part of our memory system and can be instantly accessed to help us develop an intuitive 'feeling' about what we should, or should not do. The critical issue, however, is that most of the associations that drive intuition reside in the unconscious part of our brain. They are brought into play automatically, and are not the subject of conscious awareness. We can't normally articulate the basis of our intuitions. So consumers often make brand choices intuitively, and cannot tell why they made that choice. Fishbein's (1967) attitudinal model has also been widely used in the marketing context (Lilien et al., 1992), and this paradigm provides researchers with a useful lens for examining the factors explaining consumer purchasing intention and adoption. According to this model, behaviour is predominantly determined by intention. Other factors like attitudes, subjective norms, and perceived behavioural control also are shown to be related to an appropriate set of salient behavioural, normative, and control beliefs about the behaviour. However, Fishbein's model stops at the adoption level and does not capture other important factors that explain and predict consumer continuance behaviour (repurchase). The expectation-confirmation model (Oliver, 1980), on the other hand, focuses on the post-purchase behaviour. It is a widely used model in the consumer behaviour literature, particularly in explaining consumer satisfaction and repeat purchase. Satisfaction is the central notion of this model, which is formed by the gap between expectation and perceived performance. The expectation-confirmation theory suggests that if the perceived performance meets one's expectation, confirmation is formed,
409
and consumers are satisfied. Bhattacherjee (2001) stated that satisfied users are more likely to continue purchasing the same products. As regards cultural it is the main external factors that shape human behavior. It represents living style, which came into being after adjustments to the environment, people, and things through generations. The effect of culture on people's life is so great that it will even affect the motives and choices when consuming or shopping (Chang, 2005). Otts (1989) defined culture as "All technologies, beliefs, knowledge and fruits that people share and transfer to next generations." Taylor (1958) believed that culture was everything that an individual learns in society. It is a combination of knowledge, beliefs, arts, morals, laws, customs, and any other capabilities and customs. Culture is one of the main factors to determine behavior. The two external factors (culture and physical environment) and two internal factors (physiological and psychological factors) interact and form the basic factors to determine human behaviour. Culture also includes three parts, namely culture, subculture, and social class. Culture is the most basic deciding factor of human desire and behaviour. Everyone is included in many smaller subculture groups, which provide a clearer sense of identification and social process. Basically, subculture can be divided into four types: nationality groups, religious groups, racial groups, and geographical regions. Many subcultures can form some important market segments, and provide the decision reference on product designs and marketing campaigns for marketing personnel to serve the demands of consumers (Jen, 1990). Through the interactions of the group, different people's experience and individual characteristics were combined. During the combination process, individuals would seek someone highly matched to himself in order to form a subgroup or small group together. Schein (1985) believed the subgroup could form a common history through a certain time development, by sharing experiences, attitudes, communication methods, and individual personalities, and, in doing so, give birth to subculture. The individual life style is affected by the interaction of internal factors such as value and personality characteristics, and external factors such as society and culture, and also reflects on daily life activities. According to the paradox of personality in marketing, we all have a personality, but we do not know how it is systematically related to our consumer behaviour (Albanese, 1989). Social psychology is another knowledge field that helps to understand consumer behaviour. The social psychology focus on the understanding of individuals behaviour in the presence of other individuals or groups. Concepts such as social perceptions, social influence, social rewards, peer pressure, social cues, social sanctions, etc. all shed light on the mysteries of consumer behaviour. Approaches to understanding consumer behaviour have emphasized external influences on consumption-related acts. The whole idea behind this reasoning is that consumer behaviour takes place within the context of groups and other individuals' presence which influences consumer's processing of information and decision making (Engel et al. 1968). Another area of knowledge that has been used to a better understanding of consumer behaviour is the physio-pyschological one. Physiological psychology is the study of the interaction of the body with the mind. It is the study of the extent to which behaviour is caused by physical and chemical phenomena in the body (Morris 1996). Kroeber-Riel (1980) pointed out that cognitive and psychological processes originate from physiological ones. This field holds many promises for explaining consumer behaviour. For instance, the hypothalamus is that center of the brain which mainly controls consumption (Zimbardo and Gerrig 1996). The chemical changes due to the use/eat of the first product results in a blood borne input to the brain to activate further consumption. Thus, the individual would order one more product to use/eat. Such a behaviour is explained based on the research findings on the functions of the hypothalamus and other related areas of the brain (Valenstein, et al., 1970; Zhang et al. 1994). Physio-psychology provides fascinating ways to help understand consumer behaviour without looking into the consumer's "black box" for hypothetically based variable explanations. To explain consumer behaviour further, new frontiers in science were introduced such as genetics and anthropology (Demirdjian, and Senguder, 2004). According to genetics approach our genes direct our consumption behaviour. Perhaps humans are all programmed to act in certain ways in their consumptive and consumer-related behaviour. Is the presence of certain genes that compel us to consume certain kind of products. Genetic science may very well come up with definite findings to explain consumer behaviour and thus we may strike a vein of truth in finding explanations and laws of consumer behaviour (Feder, 1977). Business anthropology and its implementation in consumer behaviour studies have demonstrated to the business world that anthropological approach as new perspective will bring a new era for the consumer science. The applied anthropologists will become the hottest candidates for business related research jobs given the fact that anthropological methods are becoming more widely acceptable in the business world in general and in consumer studies particular (Demirdjian and Senguder, 2004).
According to the literature and aimed at answering the research questions of this study (Which are the main differences in apparel consumer behaviour between women and men?) the subsequent hypothesis (H1) is formulated: “There are differences in consumer behaviour according to the sex”.
410
After testing this supposition, it follows a more detailed analysis of the main behaviour differences between men and women according to: (i) what (what one buys, what one values the most in clothing); (ii) how (alone or with someone, with whom one buys, by necessity or by impulse); (iii) where (stores with certain atmospheres) and; (iv) when (frequently or not, state of mind).
3. Method: Sample, Data Collection and statistics
Concerning this investigation’s unfolding, we chose the non random sampling technique, i. e., the population elements’ selection to form the sample depends, partly, on the researcher’s judgment. There are no known conjectures that a random element in the population may have a share in the sample (Mattar, 2001). Blended with this sampling technique, we also used the snowball sampling process. This is a kind of intentional sample among which the researcher chooses a starting group of individuals to whom he asks for names of other individuals belonging to the same population. In this way, the sample keeps growing like a snowball, while new individuals are suggested to the researcher (Rao, 2000). So, in this investigation we chose to send the questionnaire by e-mail to all the researcher’s mailing list contacts living in the country, and, later, to diffuse it using the snowball technique to successive contacts of the first responders and we got 221 answers. The questions in the questionnaire are mainly closed. We chose this kind of questions, because they have more inherent advantages, i. e., they assure comparable answers, for they vary little, offer to those who answer an acknowledgement task, they are easier to answer and also because they offer more easily examinable, reliable, and statistically treatable answers (Foddy, 2001).
Concerning the answers obtained from the questionnaires, they are measured according three kinds scales: ratio scale, Lickert scale and dichotomic scale. Yet, in order to get the answers more quickly, they were sent by e-mail. The questionnaires were sent and received by e-mail, and its answers exported to the SPSS 15.0 software, in order to get the statistical treatment. So that we could find answers for the question arisen, we used descriptive statistics and, to test the formulated hypothesis (H1), we used the t-student test1.
4. Results and Discussion
As for the characterization of the sample and, more precisely, in what concerns the profile of the clothing consumer to which this study is related, starting from his age, we see that he is distributed, in a very homogeneous way, by the three age ranks (18-25, 26-32 and ≥ 32 years), although it was evident a more significant prominence in the 18-35 years rank (36,1%). This homogeneity of the sample avoids problems of obliquity that would arise in the answers, that would happen if there were more preponderant ranks. As for the responders’ occupation, we realized that a significant percentage (27,6%) is formed by students, followed by independent workers (16,3%), and thirdly by assignment workers (13,1%). Concerning educational qualifications, we see that the sample’s great majority (61,5%) in this study is formed by people with a degree. The second group has secondary education (20,4%). As for the marital status, the responders of this study are mainly single and do not have children (52,5%). It is also interesting to notice that those who are married with or without children have the same percentage (16,3%). Finally, our sample also has a greater number of women (58,8%) than of men (41,2%), although this difference is not very expressive.
Women and Men have different buying behaviour when they go shopping?
When we try to find an answer to the investigation question arisen in this paper, firstly we will display the data concerning the hypothesis test and, then, the descriptive statistics that allow us to reinforce those results and better understand those differences. Thus, beginning with analyzing if there are indeed some behaviour differences between women and men when they go shopping, we see, through the observation of the results obtained by the hypothesis H1 test (there are differences in the consumer buying behaviour according to the gender) that men and women show different behaviours (Attachment 1). Particularly in what concerns the influence level of a set of factors about the behaviour of buying clothing, we see that they have different levels of influence depending if they are men or
1 The t-student test is used to analyze the difference in medium values, i. e., to analyze the differences in the consumer behavior according to his gender, used in the variables respecting the Lickert scale or the ratio scale.
411
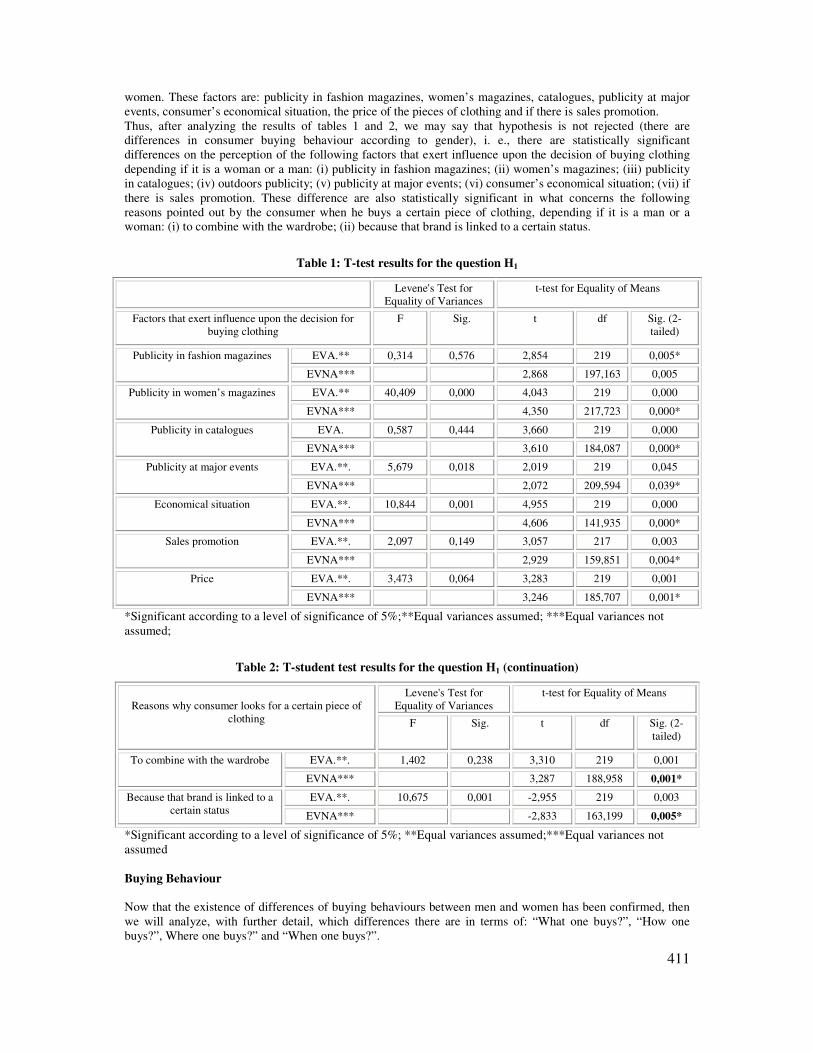
women. These factors are: publicity in fashion magazines, women’s magazines, catalogues, publicity at major events, consumer’s economical situation, the price of the pieces of clothing and if there is sales promotion. Thus, after analyzing the results of tables 1 and 2, we may say that hypothesis is not rejected (there are differences in consumer buying behaviour according to gender), i. e., there are statistically significant differences on the perception of the following factors that exert influence upon the decision of buying clothing depending if it is a woman or a man: (i) publicity in fashion magazines; (ii) women’s magazines; (iii) publicity in catalogues; (iv) outdoors publicity; (v) publicity at major events; (vi) consumer’s economical situation; (vii) if there is sales promotion. These difference are also statistically significant in what concerns the following reasons pointed out by the consumer when he buys a certain piece of clothing, depending if it is a man or a woman: (i) to combine with the wardrobe; (ii) because that brand is linked to a certain status.
Table 1: T-test results for the question H1
Levene's Test for Equality of Variances
t-test for Equality of Means
Factors that exert influence upon the decision for buying clothing
F Sig. t df Sig. (2-tailed)
EVA.** 0,314 0,576 2,854 219 0,005* Publicity in fashion magazines
EVNA*** 2,868 197,163 0,005
EVA.** 40,409 0,000 4,043 219 0,000 Publicity in women’s magazines
EVNA*** 4,350 217,723 0,000*
EVA. 0,587 0,444 3,660 219 0,000 Publicity in catalogues
EVNA*** 3,610 184,087 0,000*
EVA.**. 5,679 0,018 2,019 219 0,045 Publicity at major events
EVNA*** 2,072 209,594 0,039*
EVA.**. 10,844 0,001 4,955 219 0,000 Economical situation
EVNA*** 4,606 141,935 0,000*
EVA.**. 2,097 0,149 3,057 217 0,003 Sales promotion
EVNA*** 2,929 159,851 0,004*
EVA.**. 3,473 0,064 3,283 219 0,001 Price
EVNA*** 3,246 185,707 0,001*
*Significant according to a level of significance of 5%;**Equal variances assumed; ***Equal variances not assumed;
Table 2: T-student test results for the question H1 (continuation)
Levene's Test for Equality of Variances
t-test for Equality of Means Reasons why consumer looks for a certain piece of
clothing F Sig. t df Sig. (2-tailed)
EVA.**. 1,402 0,238 3,310 219 0,001 To combine with the wardrobe
EVNA*** 3,287 188,958 0,001*
EVA.**. 10,675 0,001 -2,955 219 0,003 Because that brand is linked to a certain status EVNA*** -2,833 163,199 0,005*
*Significant according to a level of significance of 5%; **Equal variances assumed;***Equal variances not assumed Buying Behaviour
Now that the existence of differences of buying behaviours between men and women has been confirmed, then we will analyze, with further detail, which differences there are in terms of: “What one buys?”, “How one buys?”, Where one buys?” and “When one buys?”.
412
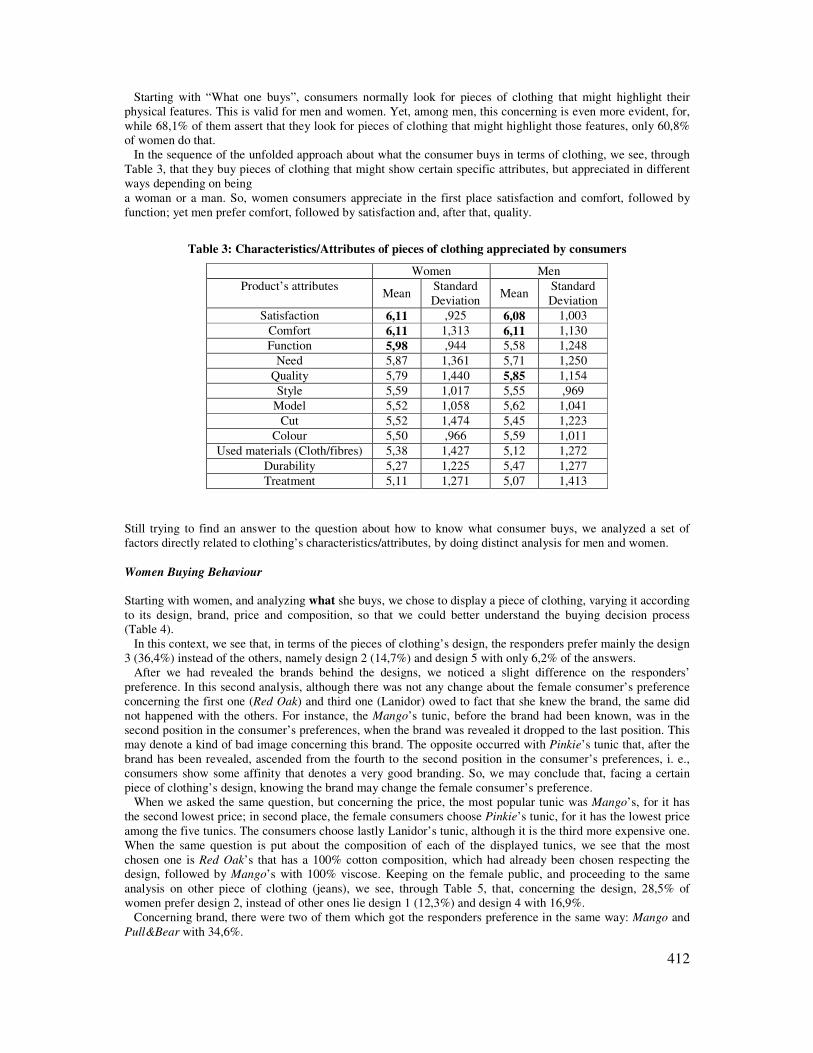
Starting with “What one buys”, consumers normally look for pieces of clothing that might highlight their physical features. This is valid for men and women. Yet, among men, this concerning is even more evident, for, while 68,1% of them assert that they look for pieces of clothing that might highlight those features, only 60,8% of women do that. In the sequence of the unfolded approach about what the consumer buys in terms of clothing, we see, through Table 3, that they buy pieces of clothing that might show certain specific attributes, but appreciated in different ways depending on being a woman or a man. So, women consumers appreciate in the first place satisfaction and comfort, followed by function; yet men prefer comfort, followed by satisfaction and, after that, quality.
Table 3: Characteristics/Attributes of pieces of clothing appreciated by consumers
Women Men Product’s attributes
Mean Standard Deviation
Mean Standard Deviation
Satisfaction 6,11 ,925 6,08 1,003 Comfort 6,11 1,313 6,11 1,130 Function 5,98 ,944 5,58 1,248
Need 5,87 1,361 5,71 1,250 Quality 5,79 1,440 5,85 1,154 Style 5,59 1,017 5,55 ,969
Model 5,52 1,058 5,62 1,041 Cut 5,52 1,474 5,45 1,223
Colour 5,50 ,966 5,59 1,011 Used materials (Cloth/fibres) 5,38 1,427 5,12 1,272
Durability 5,27 1,225 5,47 1,277 Treatment 5,11 1,271 5,07 1,413
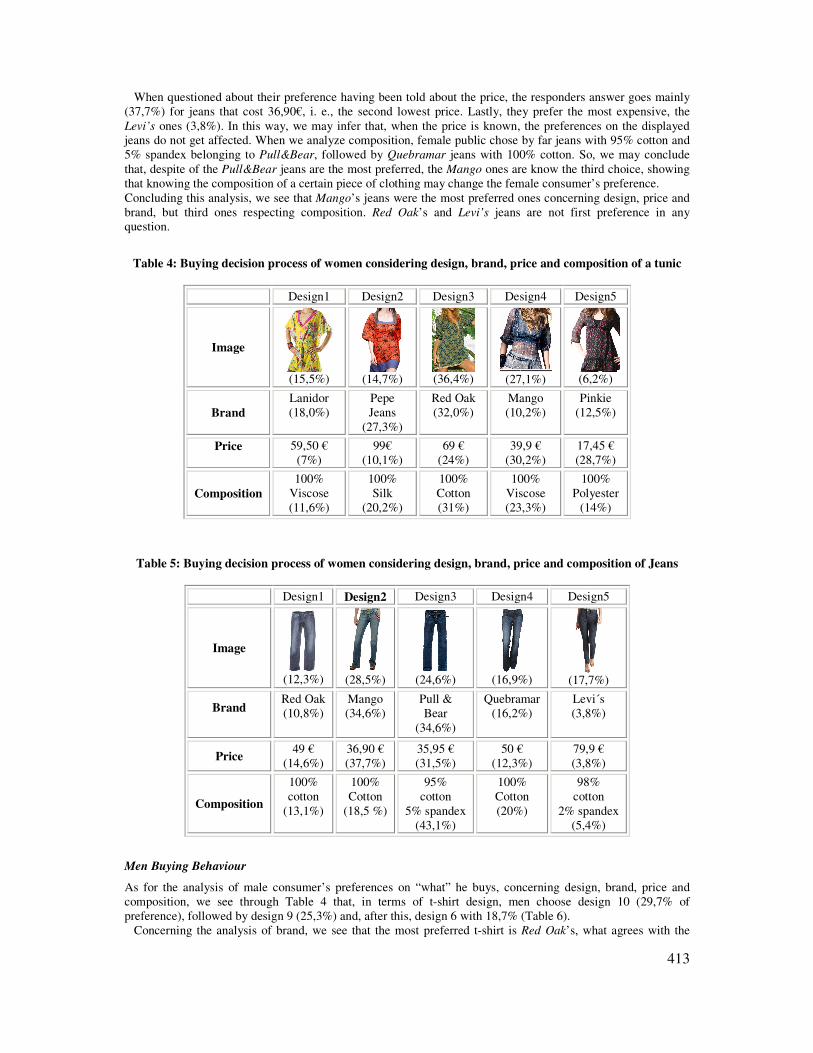
Still trying to find an answer to the question about how to know what consumer buys, we analyzed a set of factors directly related to clothing’s characteristics/attributes, by doing distinct analysis for men and women. Women Buying Behaviour Starting with women, and analyzing what she buys, we chose to display a piece of clothing, varying it according to its design, brand, price and composition, so that we could better understand the buying decision process (Table 4). In this context, we see that, in terms of the pieces of clothing’s design, the responders prefer mainly the design 3 (36,4%) instead of the others, namely design 2 (14,7%) and design 5 with only 6,2% of the answers. After we had revealed the brands behind the designs, we noticed a slight difference on the responders’ preference. In this second analysis, although there was not any change about the female consumer’s preference concerning the first one (Red Oak) and third one (Lanidor) owed to fact that she knew the brand, the same did not happened with the others. For instance, the Mango’s tunic, before the brand had been known, was in the second position in the consumer’s preferences, when the brand was revealed it dropped to the last position. This may denote a kind of bad image concerning this brand. The opposite occurred with Pinkie’s tunic that, after the brand has been revealed, ascended from the fourth to the second position in the consumer’s preferences, i. e., consumers show some affinity that denotes a very good branding. So, we may conclude that, facing a certain piece of clothing’s design, knowing the brand may change the female consumer’s preference. When we asked the same question, but concerning the price, the most popular tunic was Mango’s, for it has the second lowest price; in second place, the female consumers choose Pinkie’s tunic, for it has the lowest price among the five tunics. The consumers choose lastly Lanidor’s tunic, although it is the third more expensive one. When the same question is put about the composition of each of the displayed tunics, we see that the most chosen one is Red Oak’s that has a 100% cotton composition, which had already been chosen respecting the design, followed by Mango’s with 100% viscose. Keeping on the female public, and proceeding to the same analysis on other piece of clothing (jeans), we see, through Table 5, that, concerning the design, 28,5% of women prefer design 2, instead of other ones lie design 1 (12,3%) and design 4 with 16,9%. Concerning brand, there were two of them which got the responders preference in the same way: Mango and Pull&Bear with 34,6%.
413
When questioned about their preference having been told about the price, the responders answer goes mainly (37,7%) for jeans that cost 36,90€, i. e., the second lowest price. Lastly, they prefer the most expensive, the Levi’s ones (3,8%). In this way, we may infer that, when the price is known, the preferences on the displayed jeans do not get affected. When we analyze composition, female public chose by far jeans with 95% cotton and 5% spandex belonging to Pull&Bear, followed by Quebramar jeans with 100% cotton. So, we may conclude that, despite of the Pull&Bear jeans are the most preferred, the Mango ones are know the third choice, showing that knowing the composition of a certain piece of clothing may change the female consumer’s preference. Concluding this analysis, we see that Mango’s jeans were the most preferred ones concerning design, price and brand, but third ones respecting composition. Red Oak’s and Levi’s jeans are not first preference in any question.
Table 4: Buying decision process of women considering design, brand, price and composition of a tunic
Design1 Design2 Design3 Design4 Design5
Image
(15,5%)
(14,7%)
(36,4%)
(27,1%)
(6,2%)
Brand
Lanidor (18,0%)
Pepe Jeans
(27,3%)
Red Oak (32,0%)
Mango (10,2%)
Pinkie (12,5%)
Price 59,50 € (7%)
99€ (10,1%)
69 € (24%)
39,9 € (30,2%)
17,45 € (28,7%)
Composition
100% Viscose (11,6%)
100% Silk
(20,2%)
100% Cotton (31%)
100% Viscose (23,3%)
100% Polyester
(14%)
Table 5: Buying decision process of women considering design, brand, price and composition of Jeans
Design1 Design2 Design3 Design4 Design5
Image
(12,3%)
(28,5%)
(24,6%)
(16,9%)
(17,7%)
Brand
Red Oak (10,8%)
Mango (34,6%)
Pull & Bear
(34,6%)
Quebramar (16,2%)
Levi´s (3,8%)
Price 49 €
(14,6%) 36,90 € (37,7%)
35,95 € (31,5%)
50 € (12,3%)
79,9 € (3,8%)
Composition
100% cotton
(13,1%)
100% Cotton
(18,5 %)
95% cotton
5% spandex (43,1%)
100% Cotton (20%)
98% cotton
2% spandex (5,4%)
Men Buying Behaviour
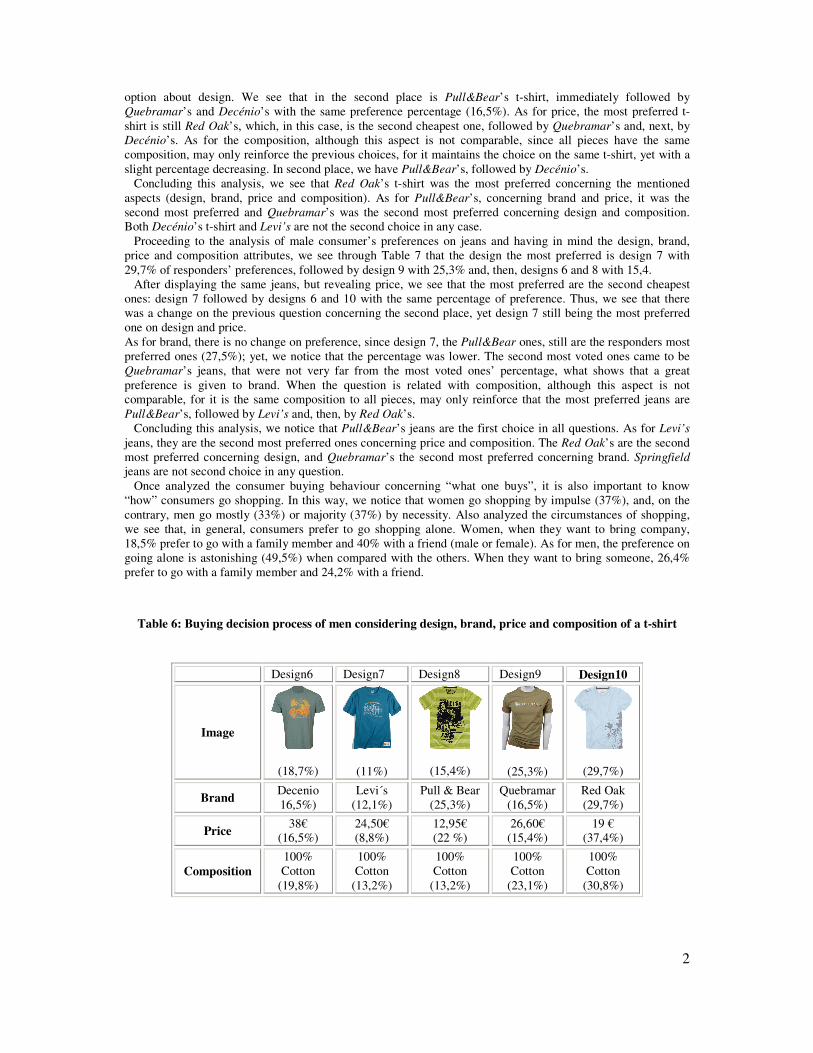
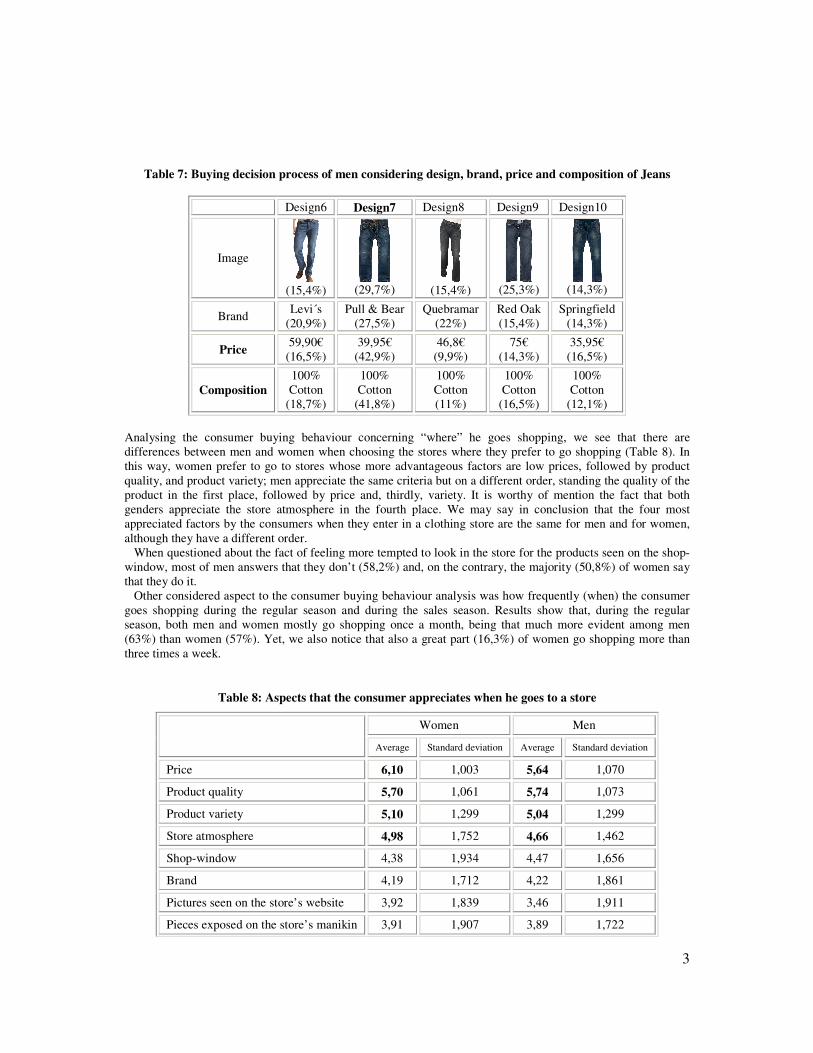
As for the analysis of male consumer’s preferences on “what” he buys, concerning design, brand, price and composition, we see through Table 4 that, in terms of t-shirt design, men choose design 10 (29,7% of preference), followed by design 9 (25,3%) and, after this, design 6 with 18,7% (Table 6). Concerning the analysis of brand, we see that the most preferred t-shirt is Red Oak’s, what agrees with the
2
option about design. We see that in the second place is Pull&Bear’s t-shirt, immediately followed by Quebramar’s and Decénio’s with the same preference percentage (16,5%). As for price, the most preferred t-shirt is still Red Oak’s, which, in this case, is the second cheapest one, followed by Quebramar’s and, next, by Decénio’s. As for the composition, although this aspect is not comparable, since all pieces have the same composition, may only reinforce the previous choices, for it maintains the choice on the same t-shirt, yet with a slight percentage decreasing. In second place, we have Pull&Bear’s, followed by Decénio’s. Concluding this analysis, we see that Red Oak’s t-shirt was the most preferred concerning the mentioned aspects (design, brand, price and composition). As for Pull&Bear’s, concerning brand and price, it was the second most preferred and Quebramar’s was the second most preferred concerning design and composition. Both Decénio’s t-shirt and Levi’s are not the second choice in any case. Proceeding to the analysis of male consumer’s preferences on jeans and having in mind the design, brand, price and composition attributes, we see through Table 7 that the design the most preferred is design 7 with 29,7% of responders’ preferences, followed by design 9 with 25,3% and, then, designs 6 and 8 with 15,4. After displaying the same jeans, but revealing price, we see that the most preferred are the second cheapest ones: design 7 followed by designs 6 and 10 with the same percentage of preference. Thus, we see that there was a change on the previous question concerning the second place, yet design 7 still being the most preferred one on design and price. As for brand, there is no change on preference, since design 7, the Pull&Bear ones, still are the responders most preferred ones (27,5%); yet, we notice that the percentage was lower. The second most voted ones came to be Quebramar’s jeans, that were not very far from the most voted ones’ percentage, what shows that a great preference is given to brand. When the question is related with composition, although this aspect is not comparable, for it is the same composition to all pieces, may only reinforce that the most preferred jeans are Pull&Bear’s, followed by Levi’s and, then, by Red Oak’s. Concluding this analysis, we notice that Pull&Bear’s jeans are the first choice in all questions. As for Levi’s
jeans, they are the second most preferred ones concerning price and composition. The Red Oak’s are the second most preferred concerning design, and Quebramar’s the second most preferred concerning brand. Springfield
jeans are not second choice in any question. Once analyzed the consumer buying behaviour concerning “what one buys”, it is also important to know “how” consumers go shopping. In this way, we notice that women go shopping by impulse (37%), and, on the contrary, men go mostly (33%) or majority (37%) by necessity. Also analyzed the circumstances of shopping, we see that, in general, consumers prefer to go shopping alone. Women, when they want to bring company, 18,5% prefer to go with a family member and 40% with a friend (male or female). As for men, the preference on going alone is astonishing (49,5%) when compared with the others. When they want to bring someone, 26,4% prefer to go with a family member and 24,2% with a friend.
Table 6: Buying decision process of men considering design, brand, price and composition of a t-shirt
Design6 Design7 Design8 Design9 Design10
Image
(18,7%)
(11%)
(15,4%)
(25,3%)
(29,7%)
Brand Decenio 16,5%)
Levi´s (12,1%)
Pull & Bear (25,3%)
Quebramar (16,5%)
Red Oak (29,7%)
Price 38€
(16,5%) 24,50€ (8,8%)
12,95€ (22 %)
26,60€ (15,4%)
19 € (37,4%)
Composition
100% Cotton
(19,8%)
100% Cotton
(13,2%)
100% Cotton
(13,2%)
100% Cotton
(23,1%)
100% Cotton
(30,8%)
3
Table 7: Buying decision process of men considering design, brand, price and composition of Jeans
Design6 Design7 Design8 Design9 Design10
Image
(15,4%)
(29,7%)
(15,4%)
(25,3%)
(14,3%)
Brand Levi´s
(20,9%) Pull & Bear
(27,5%) Quebramar
(22%) Red Oak (15,4%)
Springfield (14,3%)
Price 59,90€
(16,5%) 39,95€
(42,9%) 46,8€
(9,9%) 75€
(14,3%) 35,95€
(16,5%)
Composition
100% Cotton
(18,7%)
100% Cotton
(41,8%)
100% Cotton (11%)
100% Cotton
(16,5%)
100% Cotton
(12,1%)
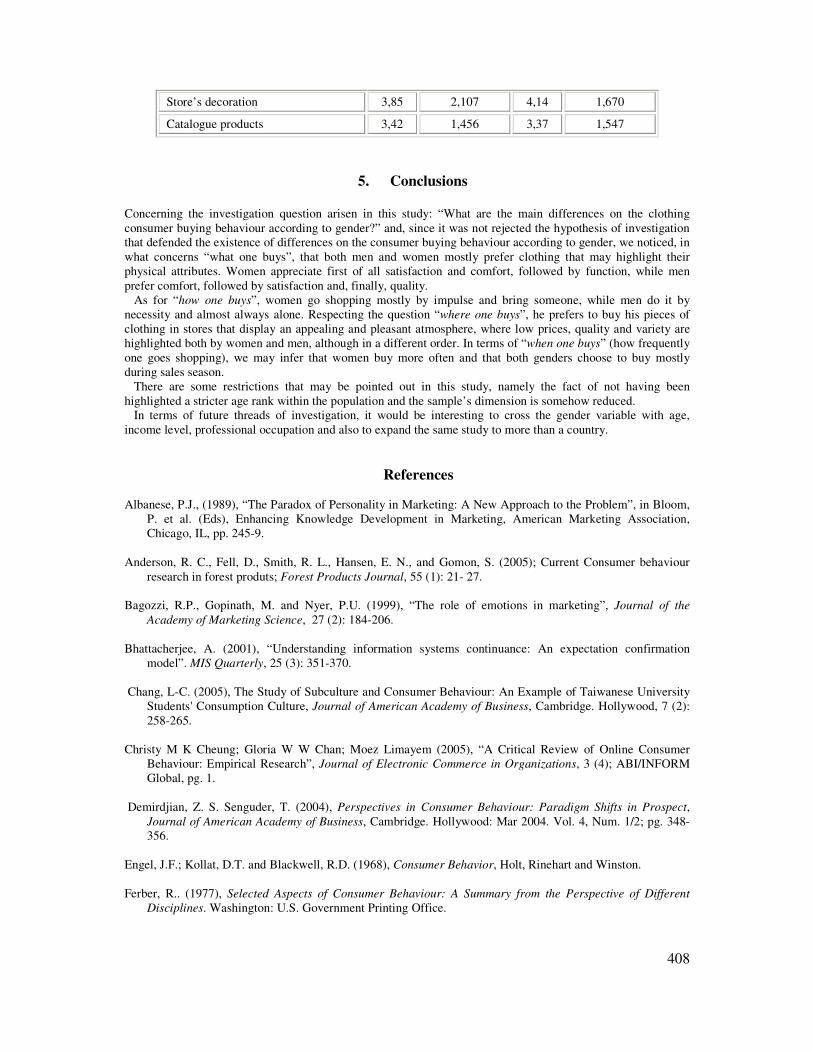
Analysing the consumer buying behaviour concerning “where” he goes shopping, we see that there are differences between men and women when choosing the stores where they prefer to go shopping (Table 8). In this way, women prefer to go to stores whose more advantageous factors are low prices, followed by product quality, and product variety; men appreciate the same criteria but on a different order, standing the quality of the product in the first place, followed by price and, thirdly, variety. It is worthy of mention the fact that both genders appreciate the store atmosphere in the fourth place. We may say in conclusion that the four most appreciated factors by the consumers when they enter in a clothing store are the same for men and for women, although they have a different order. When questioned about the fact of feeling more tempted to look in the store for the products seen on the shop-window, most of men answers that they don’t (58,2%) and, on the contrary, the majority (50,8%) of women say that they do it. Other considered aspect to the consumer buying behaviour analysis was how frequently (when) the consumer goes shopping during the regular season and during the sales season. Results show that, during the regular season, both men and women mostly go shopping once a month, being that much more evident among men (63%) than women (57%). Yet, we also notice that also a great part (16,3%) of women go shopping more than three times a week.
Table 8: Aspects that the consumer appreciates when he goes to a store
Women Men
Average Standard deviation Average Standard deviation
Price 6,10 1,003 5,64 1,070
Product quality 5,70 1,061 5,74 1,073
Product variety 5,10 1,299 5,04 1,299
Store atmosphere 4,98 1,752 4,66 1,462
Shop-window 4,38 1,934 4,47 1,656
Brand 4,19 1,712 4,22 1,861
Pictures seen on the store’s website 3,92 1,839 3,46 1,911
Pieces exposed on the store’s manikin 3,91 1,907 3,89 1,722
408
Store’s decoration 3,85 2,107 4,14 1,670
Catalogue products 3,42 1,456 3,37 1,547
5. Conclusions
Concerning the investigation question arisen in this study: “What are the main differences on the clothing consumer buying behaviour according to gender?” and, since it was not rejected the hypothesis of investigation that defended the existence of differences on the consumer buying behaviour according to gender, we noticed, in what concerns “what one buys”, that both men and women mostly prefer clothing that may highlight their physical attributes. Women appreciate first of all satisfaction and comfort, followed by function, while men prefer comfort, followed by satisfaction and, finally, quality. As for “how one buys”, women go shopping mostly by impulse and bring someone, while men do it by necessity and almost always alone. Respecting the question “where one buys”, he prefers to buy his pieces of clothing in stores that display an appealing and pleasant atmosphere, where low prices, quality and variety are highlighted both by women and men, although in a different order. In terms of “when one buys” (how frequently one goes shopping), we may infer that women buy more often and that both genders choose to buy mostly during sales season. There are some restrictions that may be pointed out in this study, namely the fact of not having been highlighted a stricter age rank within the population and the sample’s dimension is somehow reduced. In terms of future threads of investigation, it would be interesting to cross the gender variable with age, income level, professional occupation and also to expand the same study to more than a country.
References Albanese, P.J., (1989), “The Paradox of Personality in Marketing: A New Approach to the Problem”, in Bloom,
P. et al. (Eds), Enhancing Knowledge Development in Marketing, American Marketing Association, Chicago, IL, pp. 245-9.
Anderson, R. C., Fell, D., Smith, R. L., Hansen, E. N., and Gomon, S. (2005); Current Consumer behaviour
research in forest produts; Forest Products Journal, 55 (1): 21- 27. Bagozzi, R.P., Gopinath, M. and Nyer, P.U. (1999), “The role of emotions in marketing”, Journal of the
Academy of Marketing Science, 27 (2): 184-206. Bhattacherjee, A. (2001), “Understanding information systems continuance: An expectation confirmation
model”. MIS Quarterly, 25 (3): 351-370. Chang, L-C. (2005), The Study of Subculture and Consumer Behaviour: An Example of Taiwanese University
Students' Consumption Culture, Journal of American Academy of Business, Cambridge. Hollywood, 7 (2): 258-265.
Christy M K Cheung; Gloria W W Chan; Moez Limayem (2005), “A Critical Review of Online Consumer
Behaviour: Empirical Research”, Journal of Electronic Commerce in Organizations, 3 (4); ABI/INFORM Global, pg. 1.
Demirdjian, Z. S. Senguder, T. (2004), Perspectives in Consumer Behaviour: Paradigm Shifts in Prospect,
Journal of American Academy of Business, Cambridge. Hollywood: Mar 2004. Vol. 4, Num. 1/2; pg. 348-356.
Engel, J.F.; Kollat, D.T. and Blackwell, R.D. (1968), Consumer Behavior, Holt, Rinehart and Winston. Ferber, R.. (1977), Selected Aspects of Consumer Behaviour: A Summary from the Perspective of Different
Disciplines. Washington: U.S. Government Printing Office.
408
Fischer, E and Arnold, S, (1994), “Sex, gender identity, gender role attitudes, and consumer behavior”, Psychology & Marketing, 11 (2): 163-183.
Fishbein, M. (1967), “Attitude and prediction of behaviour”. In M. Fishbein (Ed.), Readings in attitude theory
and measurement (pp. 477-492). New York: John Wiley. Foddy, W (2001), Constructing questions for interviews and questionnaires: Theory and practice in social
Research, Cambrifge University Press. Hawkins, Del I., Best, R. and Coney, K. (2003), Consumer Behaviour: Building Marketing Strategy. Boston,
Massachusetts: Irwin McGraw-Hill, pp. 775. Hudson, L. A. and Ozanne, J. L. (1988). "Alternative Ways of seeking Knowledge in Consumer Reserch”
Journal of Consumer Research, 14 (4):508-521. Jen, Y. (1990), Culture and self: perspectives of easterners and westerners, first edition, Taipei, Yuen-Liu Press
Co., Ltd, translated from Massella, Anthony J. Johnson, A.R. and Stewart, D.W. (2005), “A reappraisal of the role of emotion in consumer behaviour:
traditional and contemporary approaches”, in Malhotra, N.K. (Ed.), Review of Marketing Research, Vol. 1, ME Sharpe, Armonk, NJ, pp. 3-33.
Kassarjian, H. H. (1995), "Some Recollections from a Quarter Century Ago," Advances in Consumer Research,
Volume XXIl, Frank R. Kardes and Mita Sujan, editors. Kroeber-Riel,Werner (1980), Konsumentenverhalten, second Edition. Vahlen, München, Germany. Leon, S. and Kanuk, L. (2000), Consumer Behaviour. Saddle River, New Jersey: Prentice Hall, pp. 672. Lilien, G.L., Philip, K., and Sridhar, M.K. (1992), Marketing Models. New Jersey: Prentice Hall. Mattar, F.N. (2001) Pesquisa de marketing, São Paulo, Atlas, 278-290. Morris, C. G. (1996), Psychology: An Introduction. Upper Saddle River, New Jersey: Prentice Hall, pp. 778. Oliver, R.L. (1980), “A cognitive model for the antecedents and consequences of satisfaction”, Journal of
Marketing Research, 17, 460-469. Otts. J. S. (1989), The organizational culture perspective, Chicago: Dorsey Press. Rao P. S(2000),. Sampling Methodologies Whith Applications, Chapman & Hall/CRC, New York. Schein, E. H. (1985). Organizational culture and leadership: A dynamic view. San Francisco, CA: Jossey-Bass. Schiffman, L.G. and Kanuk, L. L. (2000), Comportamento do Consumidor. 6ª Edição.Rio de Janeiro: Editora
LTC. Solomon, M. (2002), Consumer Behavior: Buying, Having. And Being. 5th ed. Prentice Hall. Upper Saddle
River, NJ. Taylor, E .B. (1958), Primitive culture, New York: Harper. Valenstein, E., V., Cox, and Kakolewski, J. (1970), "Reexamination of the Role of the Hypothalamus in
Motivation," Psychological Review, 77: 16-31. Watson, L. and Spence, M. T. (2007), “Causes and consequences of emotions on consumer behaviour A review
and integrative theory cognitive appraisal”, European Journal of Marketing, 41 (5): 587-511. Winer, R. S. (2000), Marketing Management, Prentice Hall, Upper Saddle River, NJ.
409
Zhang, Y., R. Proenca, M., Maffel, M., Barone, L. L. and Friedman, J. (1994), "Positional Cloning of the Mouse Obese Gene and Its Human Homologue," Nature, 372: 425-432.
Zimbardo, P. Gerrig, R.J. (1996), Psychology and Life. New York, N.Y.: Harper Collins College Publishers, pp.
712.
410
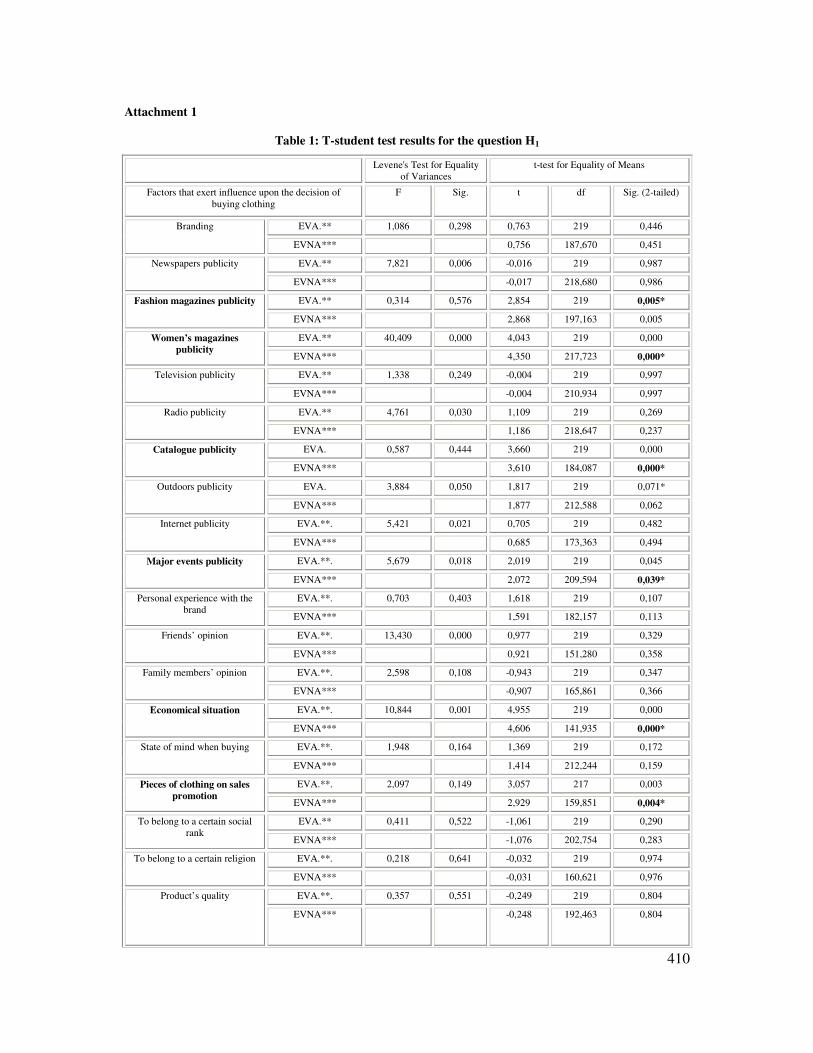
Attachment 1
Table 1: T-student test results for the question H1
Levene's Test for Equality of Variances
t-test for Equality of Means
Factors that exert influence upon the decision of buying clothing
F Sig. t df Sig. (2-tailed)
EVA.** 1,086 0,298 0,763 219 0,446 Branding
EVNA*** 0,756 187,670 0,451
EVA.** 7,821 0,006 -0,016 219 0,987 Newspapers publicity
EVNA*** -0,017 218,680 0,986
EVA.** 0,314 0,576 2,854 219 0,005* Fashion magazines publicity
EVNA*** 2,868 197,163 0,005
EVA.** 40,409 0,000 4,043 219 0,000 Women’s magazines
publicity EVNA*** 4,350 217,723 0,000*
EVA.** 1,338 0,249 -0,004 219 0,997 Television publicity
EVNA*** -0,004 210,934 0,997
EVA.** 4,761 0,030 1,109 219 0,269 Radio publicity
EVNA*** 1,186 218,647 0,237
EVA. 0,587 0,444 3,660 219 0,000 Catalogue publicity
EVNA*** 3,610 184,087 0,000*
EVA. 3,884 0,050 1,817 219 0,071* Outdoors publicity
EVNA*** 1,877 212,588 0,062
EVA.**. 5,421 0,021 0,705 219 0,482 Internet publicity
EVNA*** 0,685 173,363 0,494
EVA.**. 5,679 0,018 2,019 219 0,045 Major events publicity
EVNA*** 2,072 209,594 0,039*
EVA.**. 0,703 0,403 1,618 219 0,107 Personal experience with the brand
EVNA*** 1,591 182,157 0,113
EVA.**. 13,430 0,000 0,977 219 0,329 Friends’ opinion
EVNA*** 0,921 151,280 0,358
EVA.**. 2,598 0,108 -0,943 219 0,347 Family members’ opinion
EVNA*** -0,907 165,861 0,366
EVA.**. 10,844 0,001 4,955 219 0,000 Economical situation
EVNA*** 4,606 141,935 0,000*
EVA.**. 1,948 0,164 1,369 219 0,172 State of mind when buying
EVNA*** 1,414 212,244 0,159
EVA.**. 2,097 0,149 3,057 217 0,003 Pieces of clothing on sales
promotion EVNA*** 2,929 159,851 0,004*
EVA.** 0,411 0,522 -1,061 219 0,290 To belong to a certain social rank
EVNA*** -1,076 202,754 0,283
EVA.**. 0,218 0,641 -0,032 219 0,974 To belong to a certain religion
EVNA*** -0,031 160,621 0,976
EVA.**. 0,357 0,551 -0,249 219 0,804 Product’s quality
EVNA*** -0,248 192,463 0,804
411
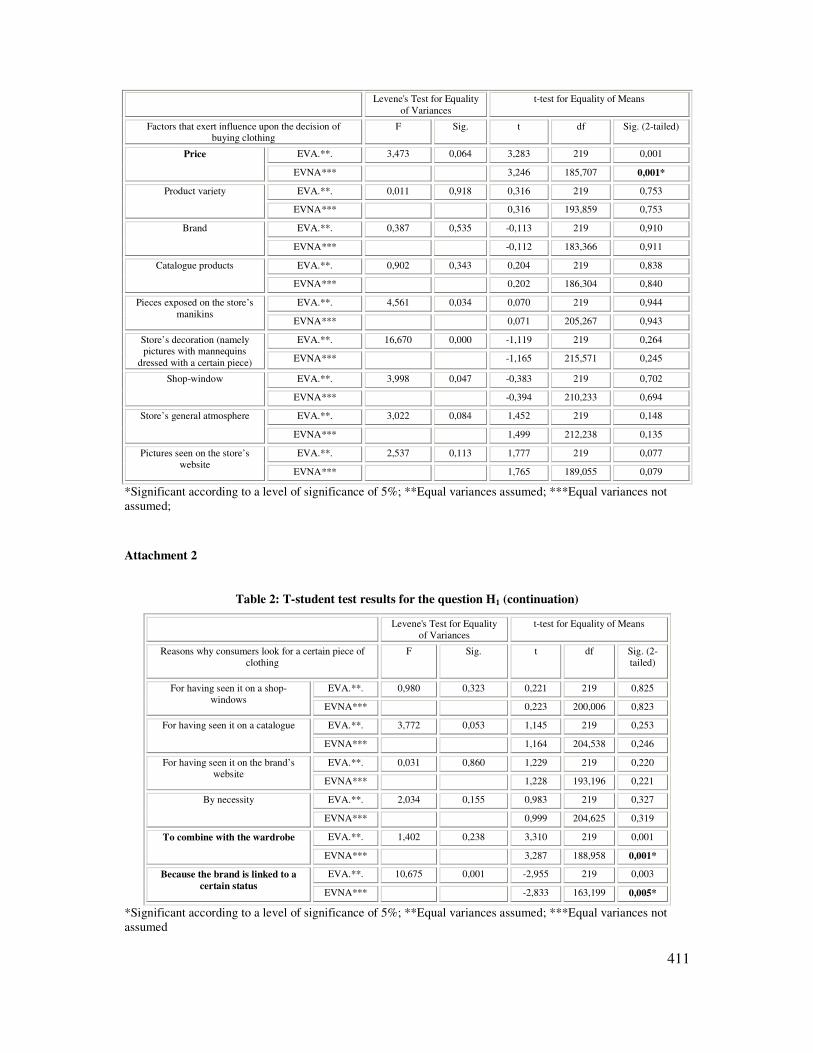
Levene's Test for Equality of Variances
t-test for Equality of Means
Factors that exert influence upon the decision of buying clothing
F Sig. t df Sig. (2-tailed)
EVA.**. 3,473 0,064 3,283 219 0,001 Price
EVNA*** 3,246 185,707 0,001*
EVA.**. 0,011 0,918 0,316 219 0,753 Product variety
EVNA*** 0,316 193,859 0,753
EVA.**. 0,387 0,535 -0,113 219 0,910 Brand
EVNA*** -0,112 183,366 0,911
EVA.**. 0,902 0,343 0,204 219 0,838 Catalogue products
EVNA*** 0,202 186,304 0,840
EVA.**. 4,561 0,034 0,070 219 0,944 Pieces exposed on the store’s manikins
EVNA*** 0,071 205,267 0,943
EVA.**. 16,670 0,000 -1,119 219 0,264 Store’s decoration (namely pictures with mannequins
dressed with a certain piece) EVNA*** -1,165 215,571 0,245
EVA.**. 3,998 0,047 -0,383 219 0,702 Shop-window
EVNA*** -0,394 210,233 0,694
EVA.**. 3,022 0,084 1,452 219 0,148 Store’s general atmosphere
EVNA*** 1,499 212,238 0,135
EVA.**. 2,537 0,113 1,777 219 0,077 Pictures seen on the store’s website
EVNA*** 1,765 189,055 0,079
*Significant according to a level of significance of 5%; **Equal variances assumed; ***Equal variances not assumed;
Attachment 2
Table 2: T-student test results for the question H1 (continuation)
Levene's Test for Equality of Variances
t-test for Equality of Means
Reasons why consumers look for a certain piece of clothing
F Sig. t df Sig. (2-tailed)
EVA.**. 0,980 0,323 0,221 219 0,825 For having seen it on a shop-windows
EVNA*** 0,223 200,006 0,823
EVA.**. 3,772 0,053 1,145 219 0,253 For having seen it on a catalogue
EVNA*** 1,164 204,538 0,246
EVA.**. 0,031 0,860 1,229 219 0,220 For having seen it on the brand’s website
EVNA*** 1,228 193,196 0,221
EVA.**. 2,034 0,155 0,983 219 0,327 By necessity
EVNA*** 0,999 204,625 0,319
EVA.**. 1,402 0,238 3,310 219 0,001 To combine with the wardrobe
EVNA*** 3,287 188,958 0,001*
EVA.**. 10,675 0,001 -2,955 219 0,003 Because the brand is linked to a
certain status EVNA*** -2,833 163,199 0,005*
*Significant according to a level of significance of 5%; **Equal variances assumed; ***Equal variances not assumed