construction and demolition waste recycling
DESCRIPTION
The project is based on the recycling of the rapidly increasing construction and demolition waste. Through this process we want to take a step ahead, the idea of stopping illegal sand mining, earth excavation and ultimately save our mother Earth from destruction. The cost of recycled sand and aggregates is lower than conventional aggregates and sand, resulting in reduction of overall construction cost. Our primary aim is to study in depth about the different properties of construction and demolition waste, perform various tests, so that the recycling processes can be designed accordingly for optimum efficiency. On the basis of these test results and projections we will get a rough estimation about the total quantity of recycled aggregate and recycled sand that can be obtained. Further with the help of the obtained recycled material we intend to make various products such as concrete, paver blocks, hollow blocks, kerbstone etc which will in turn be less costly as well. These recycled maTRANSCRIPT
IJIRST –International Journal for Innovative Research in Science & Technology| Volume 1 | Issue 7 | December 2014 ISSN (online): 2349-6010
All rights reserved by www.ijirst.org 266
Construction and Demolition Waste Recycling
Siddharth Patel Anup Pansuria
UG Student UG Student
Civil Engineering Civil Engineering
L.J. Institute of Engineering. & Technology L.J. Institute of Engineering. & Technology
Viral Shah Sahil Patel UG Student UG Student
Civil Engineering Civil Engineering
L.J. Institute of Engineering. & Technology L.J. Institute of Engineering. & Technology
Abstract
The project is based on the recycling of the rapidly increasing construction and demolition waste. Through this process we want
to take a step ahead, the idea of stopping illegal sand mining, earth excavation and ultimately save our mother Earth from
destruction. The cost of recycled sand and aggregates is lower than conventional aggregates and sand, resulting in reduction of
overall construction cost. Our primary aim is to study in depth about the different properties of construction and demolition
waste, perform various tests, so that the recycling processes can be designed accordingly for optimum efficiency. On the basis of
these test results and projections we will get a rough estimation about the total quantity of recycled aggregate and recycled sand
that can be obtained. Further with the help of the obtained recycled material we intend to make various products such as
concrete, paver blocks, hollow blocks, kerbstone etc which will in turn be less costly as well. These recycled materials and
products made from it are economical without any considerable change in the strength and durability aspect. Not only the cost
effectiveness but it will also be aesthetically pleasing.
Keywords: Construction, Demolition, Process Design, Recycling, Waste.
_______________________________________________________________________________________________________
I. INTRODUCTION
A. General[1][2][3][7][15][28]
Construction waste is bulky and heavy and is mostly unsuitable for disposal by incineration or composting. The growing
population in the country and requirement of land for other uses has reduced the availability of land for waste disposal. Re-
utilization or recycling is an important strategy for management of such waste.
Waste is generated at different stages of construction process. Waste during construction activity relates to excessive cement
mix or concrete left after work is over, rejection/ demolition caused due to change in design or wrong workmanship etc.
Estimated waste generation during construction is 40 to 60 Kg. per sq. m. Similarly, waste generation during renovation/
repair work is estimated to be 40 to 50 kg/sq.m. The highest contribution to waste generation is due to demolition of buildings.
Demolition of Pucca and Semi-Pucca buildings, on an average generates 500 & 300 kg/ sq.m. Of waste respectively.
Concrete appears in two forms in the waste. Structural elements of building have reinforced concrete, while foundations have
mass non-reinforced concrete. Excavations produce topsoil, clay, sand, and gravel. This may be either re-used as filler at the
same site after completion of excavation work or moved to another site.
Large quantum of bricks and masonry arise as waste during demolition. These are generally mixed with cement, mortar or
lime. Stone arises during excavations or by demolition of old buildings.
According to findings of survey, the most dominant reason for not adopting recycling of waste from Construction Industry is
"Not aware of the recycling techniques". While 70% of the respondent have cited this as one of the reasons, 30% of the
respondent have indicated that they are not even aware of recycling possibilities.
Concrete and masonry constitute more than 50% of waste generated by the Construction Industry. Recycling of this
waste by converting it to aggregate offer dual benefit of saving landfill space and reduction in extraction of natural raw
material for new construction activity.
Recycled aggregate can be used as general bulk fill, sub-base material in road construction, fills in drainage projects and for
making new concrete.
Construction and demolition waste is generated whenever any construction/demolition activity takes place, such as,
building roads, bridges, fly over, subway, remodelling etc. It consists mostly of inert and non-biodegradable material
such as concrete, plaster, metal, wood, plastics etc.
It constitutes about 10-20 % of the municipal solid waste (excluding large construction projects).
Out of 48 million tonnes of solid waste generated in India, C&D waste makes up 25% annually.
Construction and Demolition Waste Recycling (IJIRST/ Volume 1 / Issue 7 / 054)
All rights reserved by www.ijirst.org 267
Projections for building material requirement of the housing sector indicate a shortage of aggregates to the extent of
about 55,000 million m3. An additional 750 million m
3. Aggregates would be required for achieving the targets of the
road sector.
Retrievable items such as bricks, wood, metal, titles are recycled, the concrete and masonry waste, accounting for more
than 50% of the waste from construction and demolition activities, are not being currently recycled in India.
According to a study commissioned by Technology Information, Forecasting and Assessment Council (TIFAC), 70% of
the construction industry is not aware of recycling techniques.
Estimated waste generation during construction is 40 kg per m2 to 60 kg per m
2. Similarly, waste generation during
renovation and repair work is estimated to be 40 kg per m2 to 50 kg per m
2. The highest contribution to waste generation
comes from the demolition of buildings. Demolition of pucca (permanent) and semi-pucca buildings, on average
generates between 300kg per m2 and 500 kg per m
2 of waste, respectively.
The presence of C&D waste and other inert matters makes up almost one third of the total MSW on an average.
The Bureau of Indian Standards (BIS) and other codal provisions do not provide specifications for the use of recycled
products in construction activities.
The demolition of old buildings usually generates wastes such as brick, wood and steel. In India most of the old
buildings are mainly made up of good quality bricks. The foundation of the old buildings is of load bearing type where a
huge number of bricks were used. When an old building is demolished, almost all the materials are sold at reasonable
price.
This estimate only accounts for new construction. Demolition and renovation/repair-related waste of the older stock
generates additional waste. The waste produced per sq m of demolition is 10 times that generated during construction:
as per TIFAC, 300-500 kg of waste per sq m. If it is assumed that five per cent of the existing building stock gets
demolished and rebuilt completely annually, then about 288 MT more of C&D waste would have been generated in
2013 alone because of demolitions.
Thus, the total C&D waste generated in India just by buildings in one year — 2013 — amounts to a humungous 530
MT, 44 times higher than the official estimate. Imagine the scenario if the waste generated by infrastructure projects
such as roads and dams is added. Not surprisingly, in India, if C&D waste is quantified, it will be more than all the other
types of solid waste put together.
Where is all this C&D waste going? A lot of it is being used by land sharks to illegally fill up water bodies and wetlands
around urban centres for real estate development. The rest is just being dumped into rivers and open spaces.
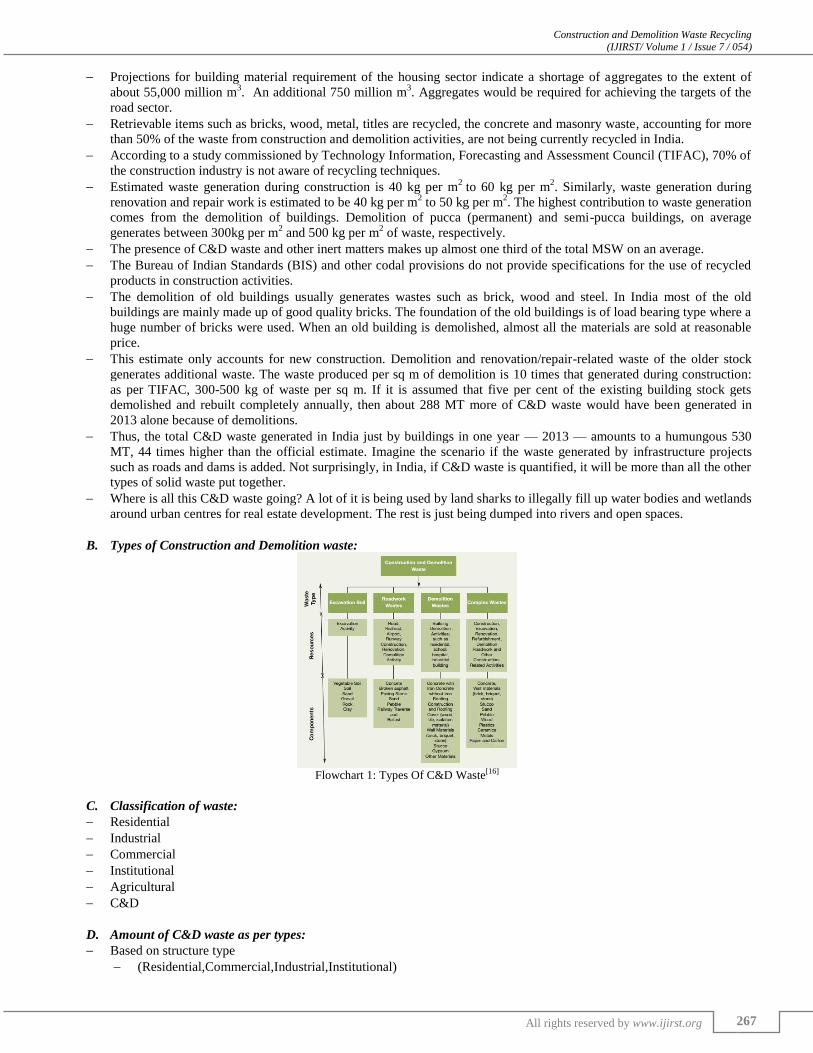
B. Types of Construction and Demolition waste:
Flowchart 1: Types Of C&D Waste[16]
C. Classification of waste:
Residential
Industrial
Commercial
Institutional
Agricultural
C&D
D. Amount of C&D waste as per types:
Based on structure type
(Residential,Commercial,Industrial,Institutional)
Construction and Demolition Waste Recycling (IJIRST/ Volume 1 / Issue 7 / 054)
All rights reserved by www.ijirst.org 268
Based on structure size
(Heavy,Med,Light)
Activity being performed
E. Various components of Construction and Demolition waste: Major Components Minor Components
Cement concrete
Bricks
Cement plaster
Steel (from RCC, door/window frames, roofing support,
railings of staircase etc.)
Rubble
Stone/Timber/wood (marble, granite, sand stone)
Conduits (iron, plastic)
Pipes (GI, iron, plastic)
Electrical fixtures (copper/aluminium wiring, wooden baton,
Bakelite/plastic switches, wire insulation)
Panels (wooden, laminated)
Others (glazed tiles, glass panes)
F. Collection of C&D Waste:
Collection of the C&DW can be done by the trucks having container of different sizes.
Size of the container depends upon the demolition area/part.
For handling very large volumes, front-end loaders in combination with sturdy tipper trucks may be used so that the
time taken for loading and unloading is kept to the minimum.
For small generators of construction debris, e.g., petty repair/maintenance job, there may be two options – (i) specific
places for such dumping by the local body and (ii) removal on payment basis.
In case of small towns where skips and tipping trailers are not available, manual loading and unloading should be
permitted.
In case of large towns where C&D waste generates in large amount, Zoning of the towns is necessary. By multiple
pickup points of C&D waste we can easily do collection of C&D waste in large cities.
Close co-ordination between the Sanitary Department, Municipal Engineering Department and Town Planning
Department is essential if there is no consolidated Solid Waste Management Department to take care of the construction
and demolition waste in addition to other municipal garbage.
G. Segregation of waste:
Segregation of C&D waste can be done by following methods:
(1) On Site
(2) Off Site
1) ON SITE:- Man-made Sorting , By use of JCB , By use of Cranes .
VEHICLE USED:- JCD, Cranes, Tractors, Trucks etc.
2) OFF SITE:- By use of Air Nozzle, By use of Sorting method.
VEHICLE USED:- Air nozzle, sorting machine, trucks, tractors etc.
Segregation of the C&D waste can be done by Chemical Mineralogical Appraisal and Mechanical Sorting.
This both methods are Off site methods.
Chemical Mineralogical Appraisal: 1)
It is based on Particle Size of waste
X-ray Fluorescence: It is used for composition of major elements.
X-ray Diffrectometry: It recognizes the constitute mineralogical phases.
Mechanical Sorting: 2)
Bar screening
Magnetic separation
Air classifier
Construction and Demolition Waste Recycling (IJIRST/ Volume 1 / Issue 7 / 054)
All rights reserved by www.ijirst.org 269
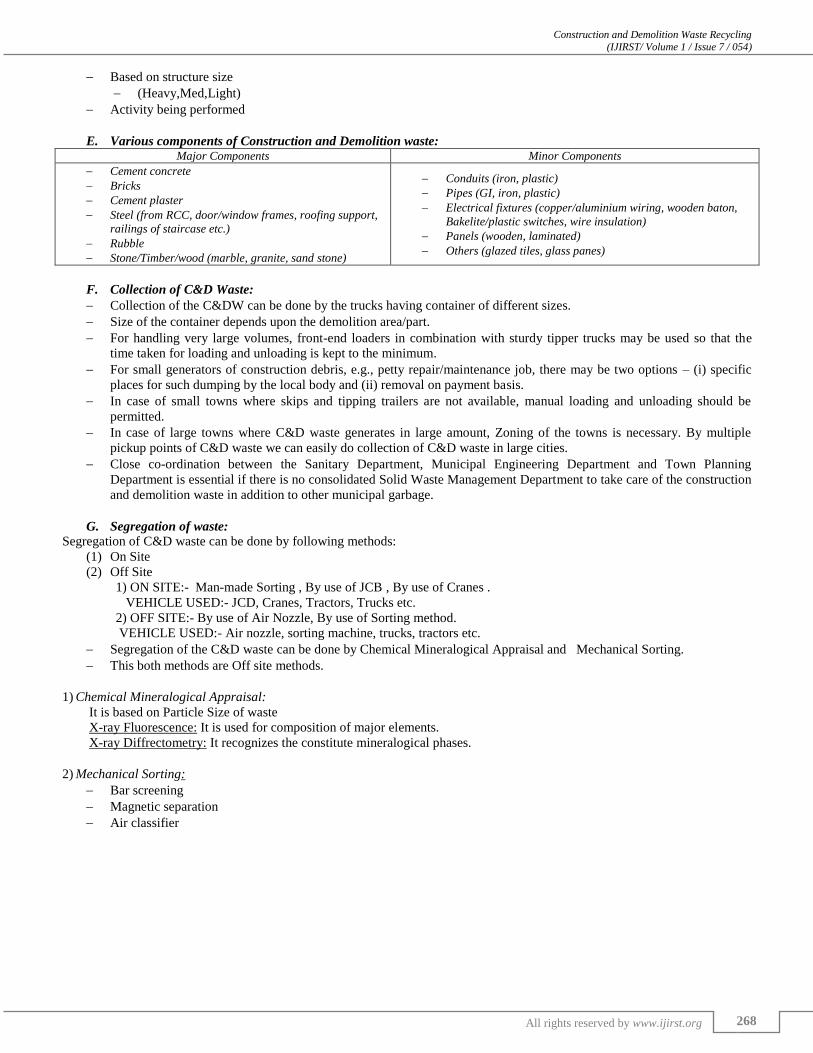
Fig. 1: Contributors of C&D Waste In A Project
Table - 1
The Quantity And Make Up of Construction And Demolition Waste Per Annum In India[28]
Constituent Quantity generated in Million tonnes per annum
Soil,Sand and Gravel 4.20 to 5.14
Bricks and Masonry 3.60 to 4.40
Concrete 2.40 to 3.67
Metals 0.60 to 0.73
Bitumen 025 to 0.30MT
Wood 0.25 to 0.30MT
Others 0.10 to 0.15MT
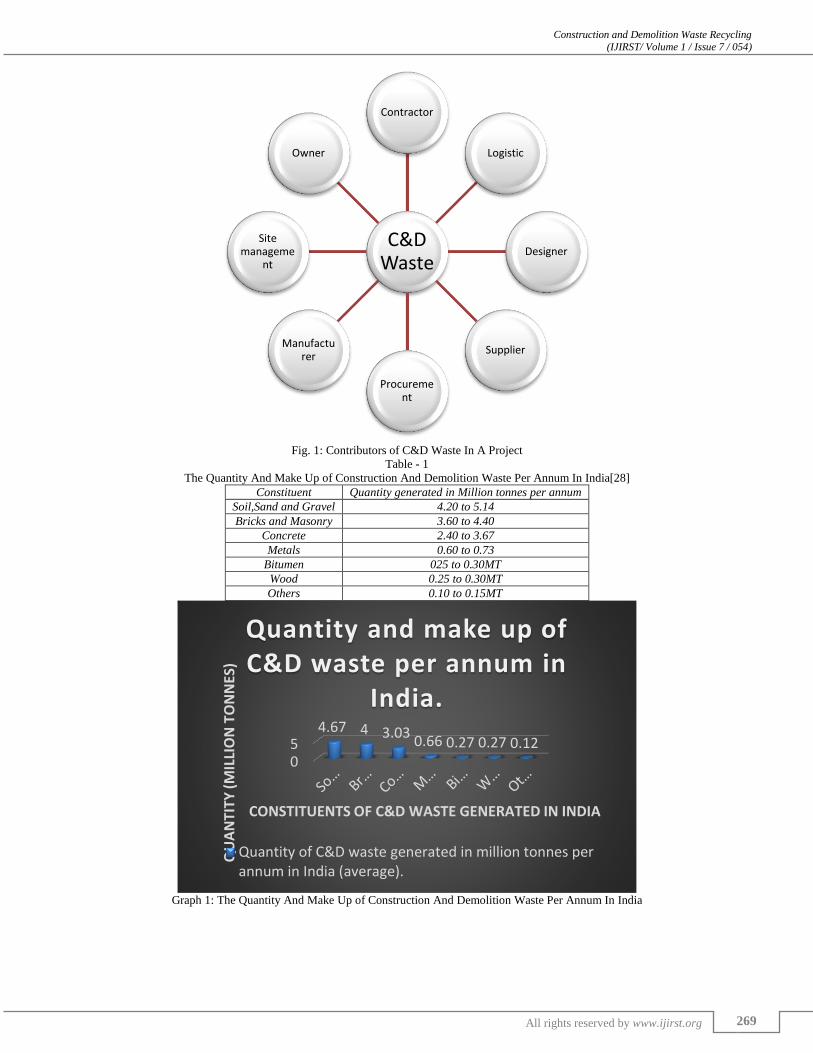
Graph 1: The Quantity And Make Up of Construction And Demolition Waste Per Annum In India
C&D Waste
Contractor
Logistic
Designer
Supplier
Procurement
Manufacturer
Site manageme
nt
Owner
05
4.67 4 3.03 0.66 0.27 0.27 0.12
QU
AN
TIT
Y (
MIL
LIO
N T
ON
NES
)
CONSTITUENTS OF C&D WASTE GENERATED IN INDIA
Quantity and make up of C&D waste per annum in
India.
Quantity of C&D waste generated in million tonnes perannum in India (average).
Construction and Demolition Waste Recycling (IJIRST/ Volume 1 / Issue 7 / 054)
All rights reserved by www.ijirst.org 270
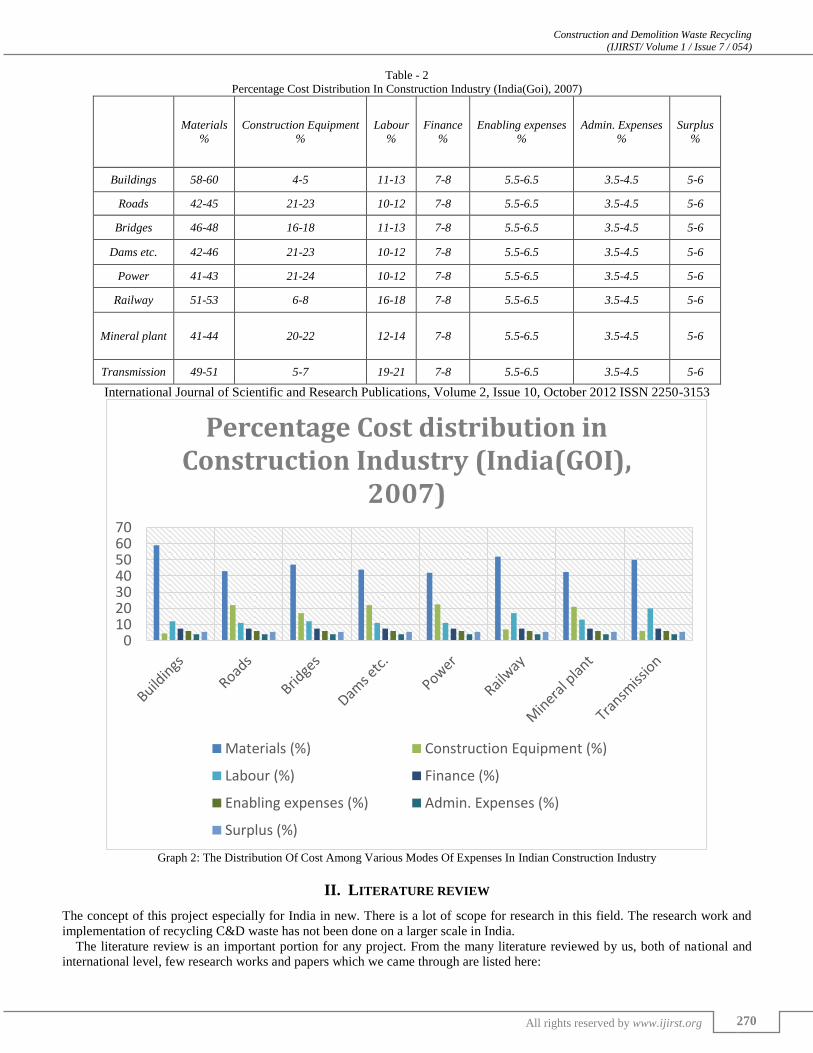
Table - 2
Percentage Cost Distribution In Construction Industry (India(Goi), 2007)
Materials
%
Construction Equipment
%
Labour
%
Finance
%
Enabling expenses
%
Admin. Expenses
%
Surplus
%
Buildings 58-60 4-5 11-13 7-8 5.5-6.5 3.5-4.5 5-6
Roads 42-45 21-23 10-12 7-8 5.5-6.5 3.5-4.5 5-6
Bridges 46-48 16-18 11-13 7-8 5.5-6.5 3.5-4.5 5-6
Dams etc. 42-46 21-23 10-12 7-8 5.5-6.5 3.5-4.5 5-6
Power 41-43 21-24 10-12 7-8 5.5-6.5 3.5-4.5 5-6
Railway 51-53 6-8 16-18 7-8 5.5-6.5 3.5-4.5 5-6
Mineral plant 41-44 20-22 12-14 7-8 5.5-6.5 3.5-4.5 5-6
Transmission 49-51 5-7 19-21 7-8 5.5-6.5 3.5-4.5 5-6
International Journal of Scientific and Research Publications, Volume 2, Issue 10, October 2012 ISSN 2250-3153
Graph 2: The Distribution Of Cost Among Various Modes Of Expenses In Indian Construction Industry
II. LITERATURE REVIEW
The concept of this project especially for India in new. There is a lot of scope for research in this field. The research work and
implementation of recycling C&D waste has not been done on a larger scale in India.
The literature review is an important portion for any project. From the many literature reviewed by us, both of national and
international level, few research works and papers which we came through are listed here:
010203040506070
Percentage Cost distribution in Construction Industry (India(GOI),
2007)
Materials (%) Construction Equipment (%)
Labour (%) Finance (%)
Enabling expenses (%) Admin. Expenses (%)
Surplus (%)
Construction and Demolition Waste Recycling (IJIRST/ Volume 1 / Issue 7 / 054)
All rights reserved by www.ijirst.org 271
On-Site Grinding of Residential Construction Debris:[19]
A.
The Indiana Grinder Pilot
ABSTRACT:
The objective of the pilot project documented in this report was to determine the feasibility of on-site grinding of clean wood,
drywall, and cardboard waste from new residential construction as an alternative to conventional landfilling. The evaluation
included the identification and assessment of the major technological, economic, and environmental factors associated with the
grinding technique. The pilot project was established near Indianapolis, Indiana and involved several organizations, including
residential builders and a waste management firm. Although it is not possible for a single case study to comprehensively address
all of the issues involved in on-site grinding, key results are presented below.
B. Construction and Demolition Waste recycling for sustainable growth and development :[20]
ABSTRACT
Construction and demolition ( C and D) waste is defined as the solid waste generated by the construction, remodeling,
renovation, repair, alteration or demolition of residential, commercial, government or institutional buildings, industrial,
commercial facilities and infrastructures such as roads, bridges, dams, tunnels, railways and airports. Construction and
demolition waste is considered as high volume, low risk. It is commonly understood that this waste can be considered a resource,
either for reuse in its original form or for recycling or energy recovery. Because of increasing waste production and public
concerns about the environment, it is desirable to recycle materials from building demolition. If suitably selected, ground,
cleaned and sieved in appropriate industrial crushing plants, these materials can be profitably used in concrete. Despite this, most
Construction and Demolition waste ends up in landfills. This paper highlights the composition of Construction and Demolition
waste, the need for its recycling and options that can be implemented for its efficient use in the field of concrete technology in
general. (Journal of Environmental Research And Development Vol. 2 No. 4, April-June 2008)
C. Construction and Demolition waste – An Overview of Construction Industry in India:[10]
ABSTRACT
India has established itself as one of the world’s fastest growing economies and this growth has brought with it a significant
boost in construction activities. With the rapid growth in construction activities, it is important to assess the amount of
construction and demolition waste being generated and analyze the practices needed to handle waste in order to propose a
sustainable construction approach. It has become essential to study C & D waste generation and handling to develop accurate
data and establish sustainable methods to manage construction waste. Reduce, Reuse and Recycle [3R’s] is highly useful in
handling of construction and demolition waste. It is estimated that the total solid waste generated in India is about 960 million
tonnes of which the construction waste alone is 14.5 million tonnes. Construction and Demolition waste in India during 2010 is
estimated as 24 million tonnes. If measures to minimize and handle the construction and demolition wastes are not developed
and efficiently adopted, it may have an impact on the environment. The paper provides an overview and statistics of construction
and demolition waste of the construction industry in India. The paper gives an overview of the current status as well as the future
potential for waste minimization, explores how waste management practices can be effectively implemented in construction
projects.
(International Journal of Chemical, Environmental & Biological Sciences (IJCEBS) Volume 1, Issue 4 (2013) ISSN 2320-
4079; EISSN 2320–4087)
D. Construction waste management in India:[22]
ABSTRACT
The management of construction waste is important today. The scarcity in the availability of aggregate for the production of
concrete is one of the important problems facing by the construction industry. Appropriate use of the construction waste is a
solution to the fast degradation of virgin raw materials in the construction industry. This paper enlightens the importance of
reduce, reuse and recycle (3R) concept for managing the construction waste in India. (American Journal of Engineering Research
(AJER) e-ISSN : 2320-0847 p-ISSN : 2320-0936 Volume-2 pp-06-09)
E. Recycling and Reuse of Construction and Demolition Waste for Sustainable Development:[10]
ABSTRACT:
As we are living in 21st century, new technologies are being invented in almost every sector to make human life fast and
easier. Beside this we are still finding the solutions to problems related to our environment, energy and natural resources.
Construction industry produces large amount of waste throughout the year. Most of the time construction and demolition waste
ends up in landfills disturbing environmental, economic and social life cycle. Construction and demolition waste is the waste
materials that are produced in the process of construction, renovation or demolition of residential or nonresidential structures.
Components of construction and demolition waste typically include concrete, asphalt, wood, metals, gypsum wallboard, roofing,
paper, plastic, drywall and glass.
Sustainable development is a development that meets the needs of the present without compromising the ability of future
generations to meet their own needs; and can be considered as one of the solution to solve construction and demolition waste
Construction and Demolition Waste Recycling (IJIRST/ Volume 1 / Issue 7 / 054)
All rights reserved by www.ijirst.org 272
problem. Sustainable development in construction will help a lot to reduce the problems related to environment and natural
resources as construction industry is a major user of world’s resources. Sustainable design, proper use and reuse of the
resources/construction materials will make construction industry more economical and green.
Concrete is the second most consumed material after water, so recycling of concrete can save construction costs also it will
help to keep environment healthy. Concrete collected from sites is put through crushing machine, usually uncontaminated
concrete i.e. free from wood, plastic, paper and other unwanted materials. Metals such as rebar are removed with the help of
magnets and other sorting devices.
In many countries like Japan, United States, United Kingdom various recycling techniques are being used and returning good
results. Process of recycling construction and demolition waste includes storage, sorting, collection, transportation, recycling and
disposing. Recycling methods used in japan are heating and rubbing methods, eccentric-shaft rotor method and Mechanical
grinding method.
Recycling of Construction and demolition waste has many benefits such as reduction in transportation cost, it keeps
environment clean and reduces natural resource exploitation. To promote recycling and reuse of waste, awareness about its
effects and benefits should be communicated with people, contractors, engineers and architects. More numbers of recycling
plants should be installed and allowing the use of recycled aggregate instead of natural aggregate for some purpose. In this paper
I am going to focus on different recycling techniques and reuse of construction and demolition waste. (OIDA International
Journal of Sustainable Development, Vol. 6, No. 7, pp. 83-92, 2013)
F. Economic Aspects of Construction Waste Materials in terms of cost savings: A case of Indian construction
Industry[23]
ABSTRACT
The excessive wastage of materials, improper management on site and low awareness of the need for waste reduction are
common in the local construction sites in India. Today, in most European countries, it is economically feasible to recycle up to
80–90% of the total amount of construction waste and most demolition and recycling technologies are generally easy to
implement and control (Lauritzen, 1998). Considering enormous increase in amount of waste generation owing to the growth in
construction industry can lead to wastage of materials which has its economic value. Currently, existence of regional and
national policies, laws and regulations governing reuse and recycle principles for C & D waste is minimal in India. Thus the
paper aims to focus on the economic feasibility of waste minimization of construction waste materials in terms of cost savings in
India. (International Journal of Scientific and Research Publications, Volume 2, Issue 10, October 2012 1 ISSN 2250-3153)
G. Use of Recycled Aggregate Concrete:[24]
ABSTRACT
Use of recycled aggregate in concrete can be useful for environmental protection. Recycled aggregates are the materials for
the future. The application of recycled aggregate has been started in a large number of construction projects of many European,
American, Russian and Asian countries. Many countries are giving infrastructural laws relaxation for increasing the use of
recycled aggregate. This paper reports the basic properties of recycled fine aggregate and recycled coarse aggregate & also
compares these properties with natural aggregates. Basic changes in all aggregate properties are determined and their effects on
concreting work are discussed at length. Similarly the properties of recycled aggregate concrete are also determined. Basic
concrete properties like compressive strength, flexural strength, workability etc. are explained here for different combinations of
recycled aggregate with natural aggregate. Codal guidelines of recycled aggregates concrete in various countries are stated here
with their effects, on concreting work. In general, present status of recycled aggregate in India along with its future need and its
successful utilization are discussed here. (IOSR Journal of Mechanical and Civil Engineering (IOSR-JMCE) ISSN: 2278-1684,
PP: 52-59)
H. Maximizing Reuse and Recycling of Construction Materials:[25]
ABSTRACT
The demolition of building structures produces significant amounts of materials that are for the most part landfilled. The total
Construction and Demolition (C&D) waste in U.S. was estimated to be 154 Million Metric Ton (MMT) in 2003. As its primary
purpose, deconstruction seeks to maintain the highest possible value for materials in existing buildings by dismantling buildings
in a manner that will allow the reuse or efficient recycling of the salvaged materials. This paper intends to provide an overview
of U.S. construction and demolition waste and includes sections on waste statistics, benchmark data, policies, and strategies to
maximize reuse and recycling.
I. Construction & Demolition Waste in India:[8]
ABSTRACT
With the advent of industrialization March there has been huge depletion of natural resources. The recycling of the
construction material to serve the ever increasing need for more cities ought to be sustainable.
Construction and Demolition Waste Recycling (IJIRST/ Volume 1 / Issue 7 / 054)
All rights reserved by www.ijirst.org 273
J. Waste quantification models for estimation of construction and demolition waste generation: A review[9]
ABSTRACT
Quantification is crucial for construction and demolition waste management. Accurate estimation can be satisfied by
developing waste quantification model that is applicable for regional or nation-wide C&D waste generation. This paper presents
a review on quantification models for C&D waste from literatures and how they correlate. Most studies combine the empirical
waste assessment data or waste generation factor obtained in the field with area of activity level extracted from national
statistical database from their respective countries, which provides annual data on sector activities. National or regional estimates
provide general figures and forecasts for annual C&D waste generation. Studies found that waste generation factor will differs
according to locations. Since volume and characteristic of waste are crucial for waste quantification, quantitative data record
from waste audit findings could benefit the authorities for the annual estimates. National C&D waste reduction plan should start
from well-established waste minimization plan at project sites. Copyright © 2012 Inderscience Enterprises Ltd.
(International Journal of Global Environmental Issues (10.1504/IJGENVI.2012.049378))
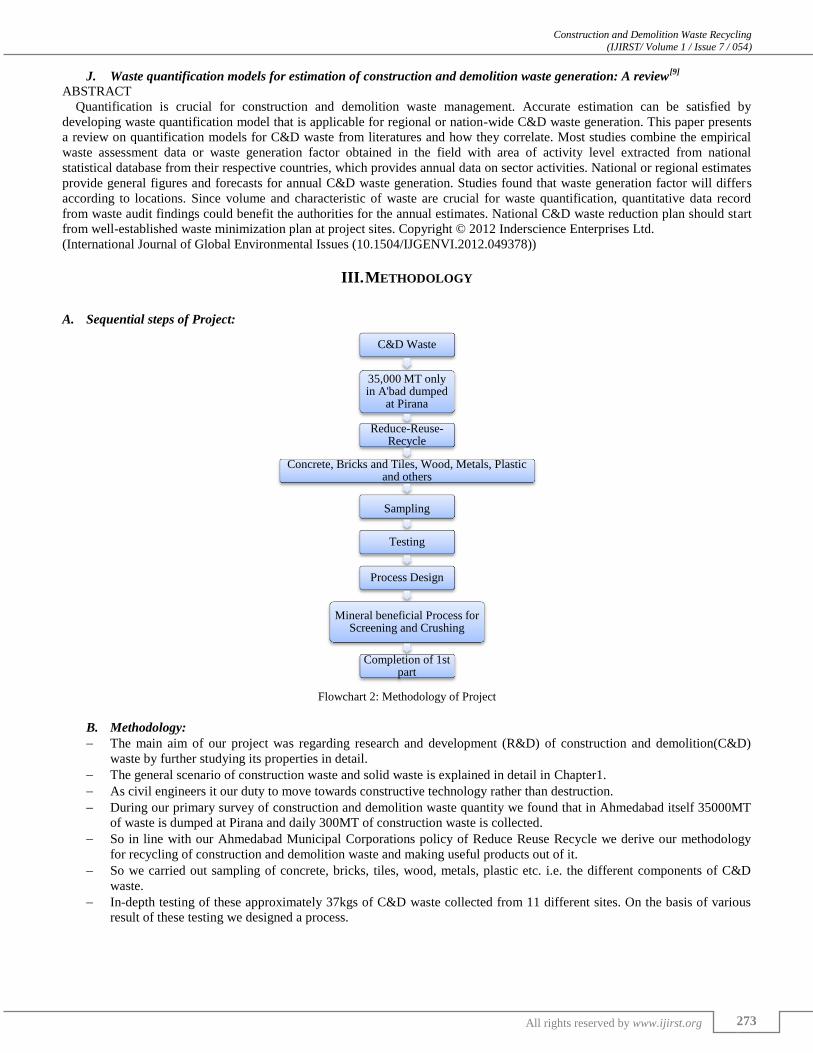
III. METHODOLOGY
A. Sequential steps of Project:
Flowchart 2: Methodology of Project
B. Methodology:
The main aim of our project was regarding research and development (R&D) of construction and demolition(C&D)
waste by further studying its properties in detail.
The general scenario of construction waste and solid waste is explained in detail in Chapter1.
As civil engineers it our duty to move towards constructive technology rather than destruction.
During our primary survey of construction and demolition waste quantity we found that in Ahmedabad itself 35000MT
of waste is dumped at Pirana and daily 300MT of construction waste is collected.
So in line with our Ahmedabad Municipal Corporations policy of Reduce Reuse Recycle we derive our methodology
for recycling of construction and demolition waste and making useful products out of it.
So we carried out sampling of concrete, bricks, tiles, wood, metals, plastic etc. i.e. the different components of C&D
waste.
In-depth testing of these approximately 37kgs of C&D waste collected from 11 different sites. On the basis of various
result of these testing we designed a process.
C&D Waste
35,000 MT only in A'bad dumped
at Pirana
Reduce-Reuse-Recycle
Concrete, Bricks and Tiles, Wood, Metals, Plastic and others
Sampling
Testing
Process Design
Mineral beneficial Process for Screening and Crushing
Completion of 1st part
Construction and Demolition Waste Recycling (IJIRST/ Volume 1 / Issue 7 / 054)
All rights reserved by www.ijirst.org 274
IV. DATA COLLECTION
A. Sampling
The very next thing on focus, after the general study of various aspects of construction and demolition waste at national and local
level was sampling. The basic meaning of sampling is to collect randomly the desired material from various points/location on
which one has to make study. Thus for carrying out any research work practically on any material, sampling is necessary.
In context to construction and demolition waste, in Ahmedabad city there are more than 15 sites solely assigned for dumping
of C&D waste. All these sites are assigned by Ahmedabad Municipal Corporation (AMC). Out of which 11 sites were selected
for carrying out sampling. Within the limits of AMC the whole city is divided into 6 zones. Thus the site selection for sampling
was done I such a way that all zones were covered. The sites which are on major locations of the city and the sites where good
amount of C&D waste is dumped were selected.
The below given list is about the sites from which samples of C&D waste were taken and further tests were conducted on it,
which is explained in the next chapter.
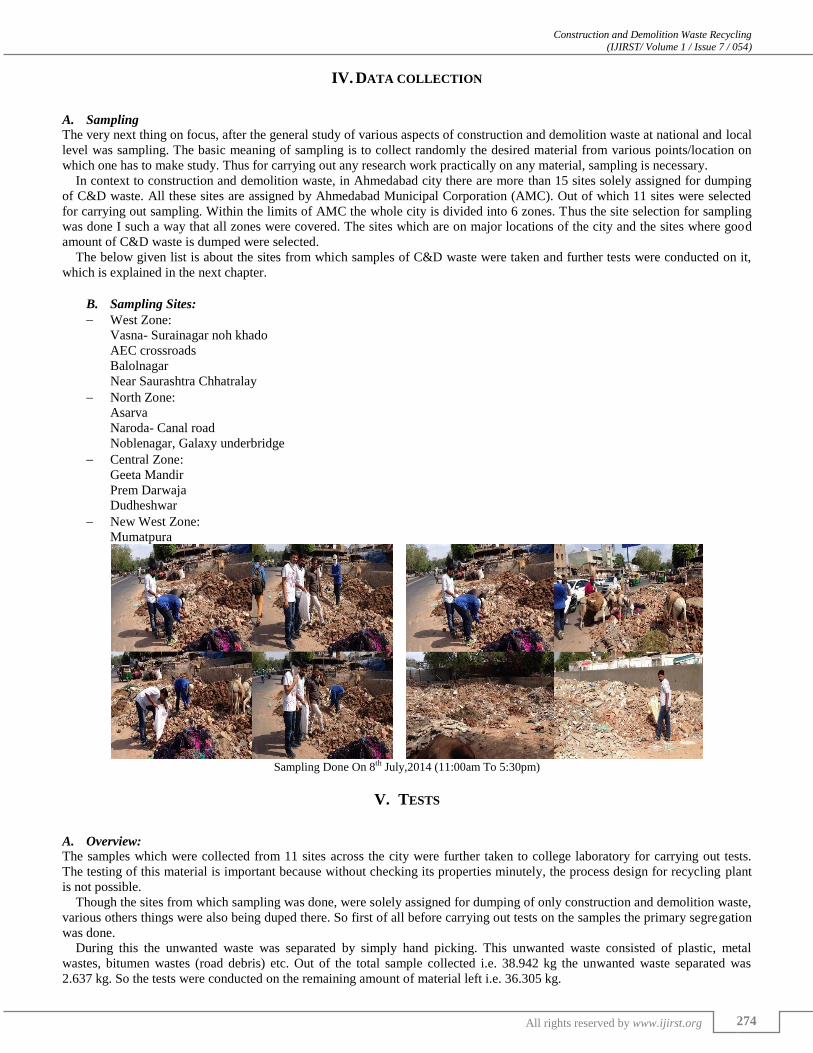
B. Sampling Sites:
West Zone:
Vasna- Surainagar noh khado
AEC crossroads
Balolnagar
Near Saurashtra Chhatralay
North Zone:
Asarva
Naroda- Canal road
Noblenagar, Galaxy underbridge
Central Zone:
Geeta Mandir
Prem Darwaja
Dudheshwar
New West Zone:
Mumatpura
Sampling Done On 8th July,2014 (11:00am To 5:30pm)
V. TESTS
Overview: A.
The samples which were collected from 11 sites across the city were further taken to college laboratory for carrying out tests.
The testing of this material is important because without checking its properties minutely, the process design for recycling plant
is not possible.
Though the sites from which sampling was done, were solely assigned for dumping of only construction and demolition waste,
various others things were also being duped there. So first of all before carrying out tests on the samples the primary segregation
was done.
During this the unwanted waste was separated by simply hand picking. This unwanted waste consisted of plastic, metal
wastes, bitumen wastes (road debris) etc. Out of the total sample collected i.e. 38.942 kg the unwanted waste separated was
2.637 kg. So the tests were conducted on the remaining amount of material left i.e. 36.305 kg.
Construction and Demolition Waste Recycling (IJIRST/ Volume 1 / Issue 7 / 054)
All rights reserved by www.ijirst.org 275
Whole of the testing process was carried out in laboratory (Civil Engineering department) of L.J. Institute of Engineering and
Technology
B. Tests conducted:
Sieve analysis (Particle size distribution)
Impact value test
Sieve Analysis Report[26]
1)
Sieve analysis is the most primary and basic test of civil engineering. It is commonly known as the gradation test. It is a basic
essential test for all aggregate technicians.
The sieve analysis determines the gradation (the distribution of aggregate particles, by size, within a given sample) in order to
determine compliance with design, production control requirements, and verification specifications. The gradation data may be
used to calculate relationships between various aggregate or aggregate blends, to check compliance with such blends, and to
predict trends during production by plotting gradation curves graphically, to name just a few uses. Used in conjunction with
other tests, the sieve analysis is a very good quality control and quality acceptance tool.
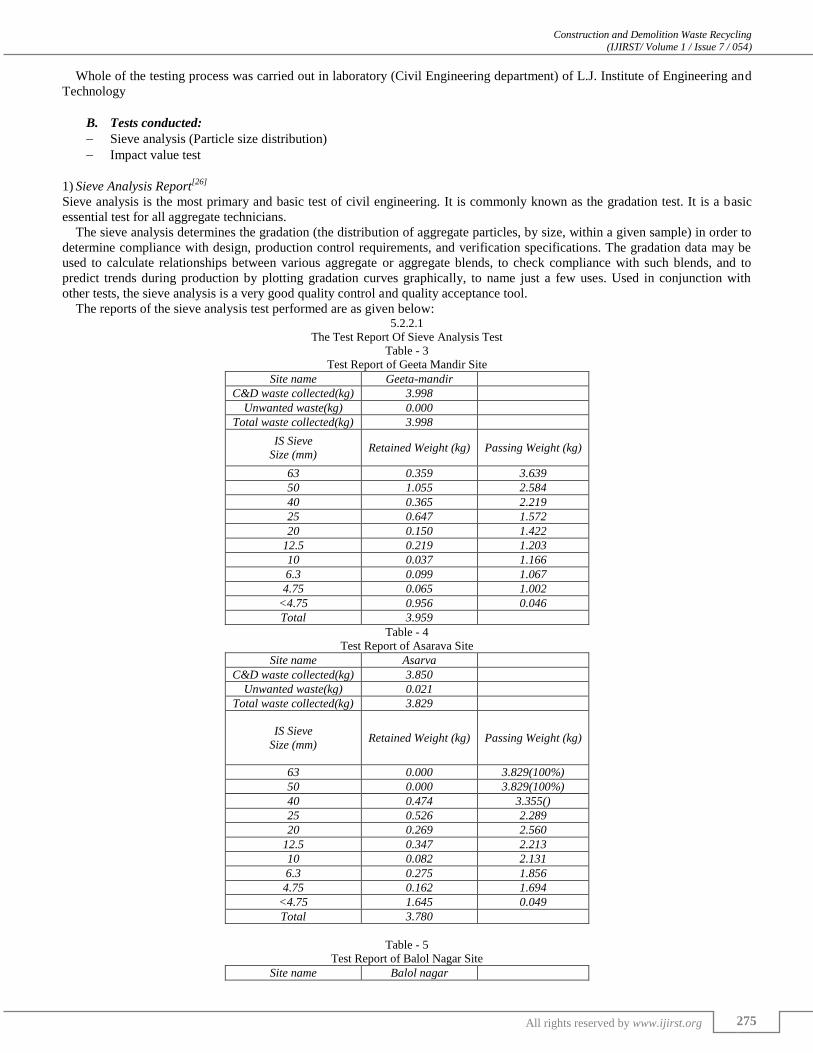
The reports of the sieve analysis test performed are as given below: 5.2.2.1
The Test Report Of Sieve Analysis Test
Table - 3
Test Report of Geeta Mandir Site
Site name Geeta-mandir
C&D waste collected(kg) 3.998
Unwanted waste(kg) 0.000
Total waste collected(kg) 3.998
IS Sieve
Size (mm) Retained Weight (kg) Passing Weight (kg)
63 0.359 3.639
50 1.055 2.584
40 0.365 2.219
25 0.647 1.572
20 0.150 1.422
12.5 0.219 1.203
10 0.037 1.166
6.3 0.099 1.067
4.75 0.065 1.002
<4.75 0.956 0.046
Total 3.959
Table - 4
Test Report of Asarava Site
Site name Asarva
C&D waste collected(kg) 3.850
Unwanted waste(kg) 0.021
Total waste collected(kg) 3.829
IS Sieve
Size (mm) Retained Weight (kg) Passing Weight (kg)
63 0.000 3.829(100%)
50 0.000 3.829(100%)
40 0.474 3.355()
25 0.526 2.289
20 0.269 2.560
12.5 0.347 2.213
10 0.082 2.131
6.3 0.275 1.856
4.75 0.162 1.694
<4.75 1.645 0.049
Total 3.780
Table - 5
Test Report of Balol Nagar Site
Site name Balol nagar
Construction and Demolition Waste Recycling (IJIRST/ Volume 1 / Issue 7 / 054)
All rights reserved by www.ijirst.org 276
C&D waste collected(kg) 3.944
Unwanted waste(kg) 0.000
Total waste collected(kg) 3.944
IS Sieve
Size (mm) Retained Weight (kg) Passing Weight (kg)
63 0 3.944
50 0.233 3.711
40 0.279 3.432
25 0.736 2.696
20 0.338 2.358
12.5 0.607 1.751
10 0.101 1.650
6.3 0.316 1.334
4.75 0.148 1.186
<4.75 1.096 0.090
Total 3.854
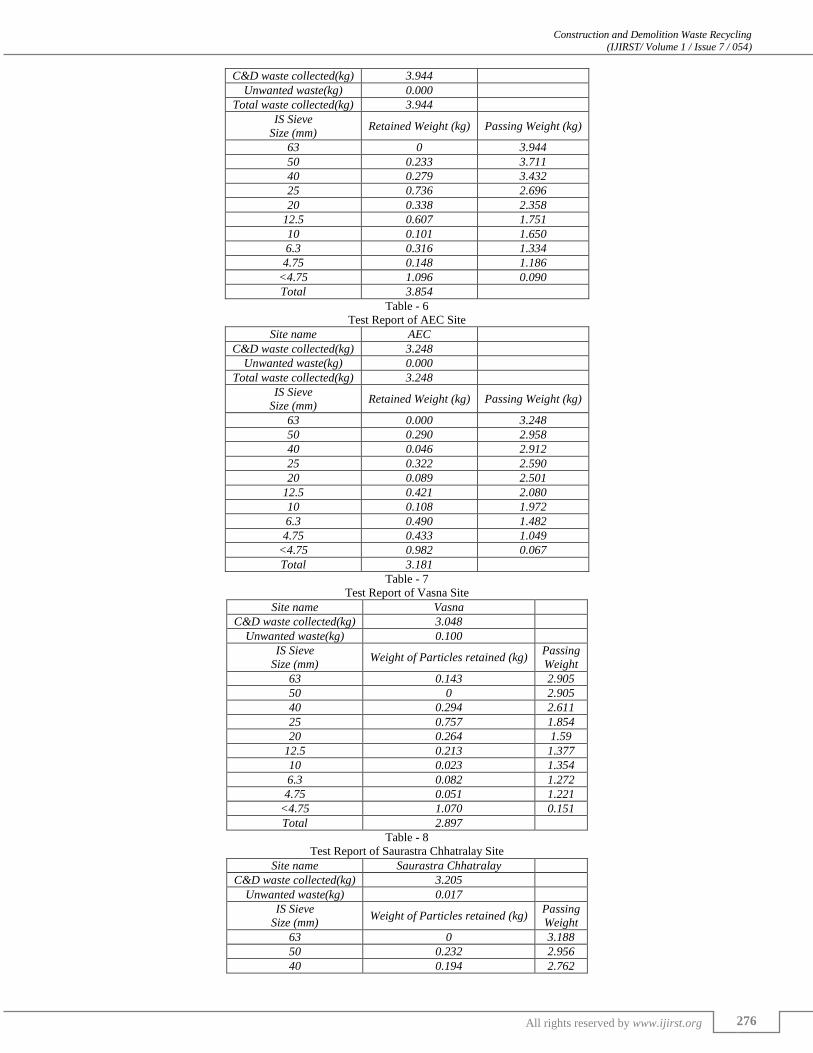
Table - 6
Test Report of AEC Site
Site name AEC
C&D waste collected(kg) 3.248
Unwanted waste(kg) 0.000
Total waste collected(kg) 3.248
IS Sieve
Size (mm) Retained Weight (kg) Passing Weight (kg)
63 0.000 3.248
50 0.290 2.958
40 0.046 2.912
25 0.322 2.590
20 0.089 2.501
12.5 0.421 2.080
10 0.108 1.972
6.3 0.490 1.482
4.75 0.433 1.049
<4.75 0.982 0.067
Total 3.181
Table - 7
Test Report of Vasna Site
Site name Vasna
C&D waste collected(kg) 3.048
Unwanted waste(kg) 0.100
IS Sieve
Size (mm) Weight of Particles retained (kg)
Passing
Weight
63 0.143 2.905
50 0 2.905
40 0.294 2.611
25 0.757 1.854
20 0.264 1.59
12.5 0.213 1.377
10 0.023 1.354
6.3 0.082 1.272
4.75 0.051 1.221
<4.75 1.070 0.151
Total 2.897
Table - 8
Test Report of Saurastra Chhatralay Site
Site name Saurastra Chhatralay
C&D waste collected(kg) 3.205
Unwanted waste(kg) 0.017
IS Sieve
Size (mm) Weight of Particles retained (kg)
Passing
Weight
63 0 3.188
50 0.232 2.956
40 0.194 2.762
Construction and Demolition Waste Recycling (IJIRST/ Volume 1 / Issue 7 / 054)
All rights reserved by www.ijirst.org 277
25 0.210 2.552
20 0.086 2.466
12.5 0.313 2.153
10 0.080 2.073
6.3 0.218 1.855
4.75 0.140 1.714
<4.75 1.612 0.102
Total 3.085
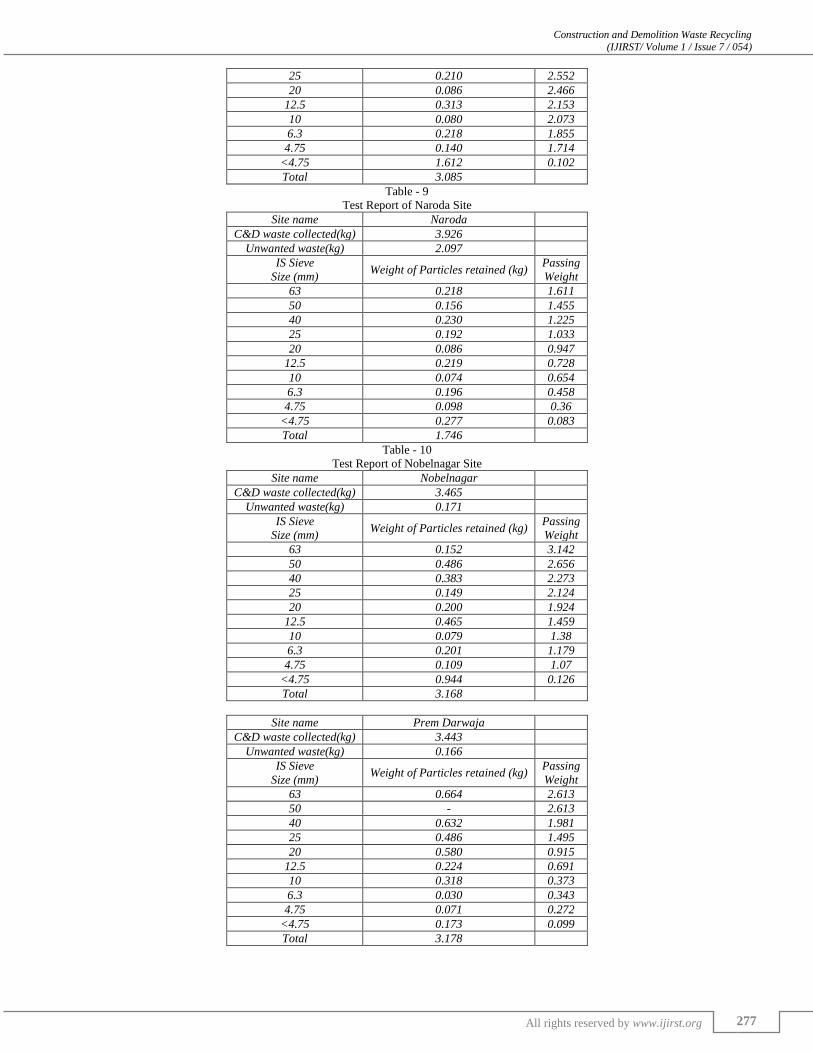
Table - 9
Test Report of Naroda Site
Site name Naroda
C&D waste collected(kg) 3.926
Unwanted waste(kg) 2.097
IS Sieve
Size (mm) Weight of Particles retained (kg)
Passing
Weight
63 0.218 1.611
50 0.156 1.455
40 0.230 1.225
25 0.192 1.033
20 0.086 0.947
12.5 0.219 0.728
10 0.074 0.654
6.3 0.196 0.458
4.75 0.098 0.36
<4.75 0.277 0.083
Total 1.746
Table - 10
Test Report of Nobelnagar Site
Site name Nobelnagar
C&D waste collected(kg) 3.465
Unwanted waste(kg) 0.171
IS Sieve
Size (mm) Weight of Particles retained (kg)
Passing
Weight
63 0.152 3.142
50 0.486 2.656
40 0.383 2.273
25 0.149 2.124
20 0.200 1.924
12.5 0.465 1.459
10 0.079 1.38
6.3 0.201 1.179
4.75 0.109 1.07
<4.75 0.944 0.126
Total 3.168
Site name Prem Darwaja
C&D waste collected(kg) 3.443
Unwanted waste(kg) 0.166
IS Sieve
Size (mm) Weight of Particles retained (kg)
Passing
Weight
63 0.664 2.613
50 - 2.613
40 0.632 1.981
25 0.486 1.495
20 0.580 0.915
12.5 0.224 0.691
10 0.318 0.373
6.3 0.030 0.343
4.75 0.071 0.272
<4.75 0.173 0.099
Total 3.178
Construction and Demolition Waste Recycling (IJIRST/ Volume 1 / Issue 7 / 054)
All rights reserved by www.ijirst.org 278
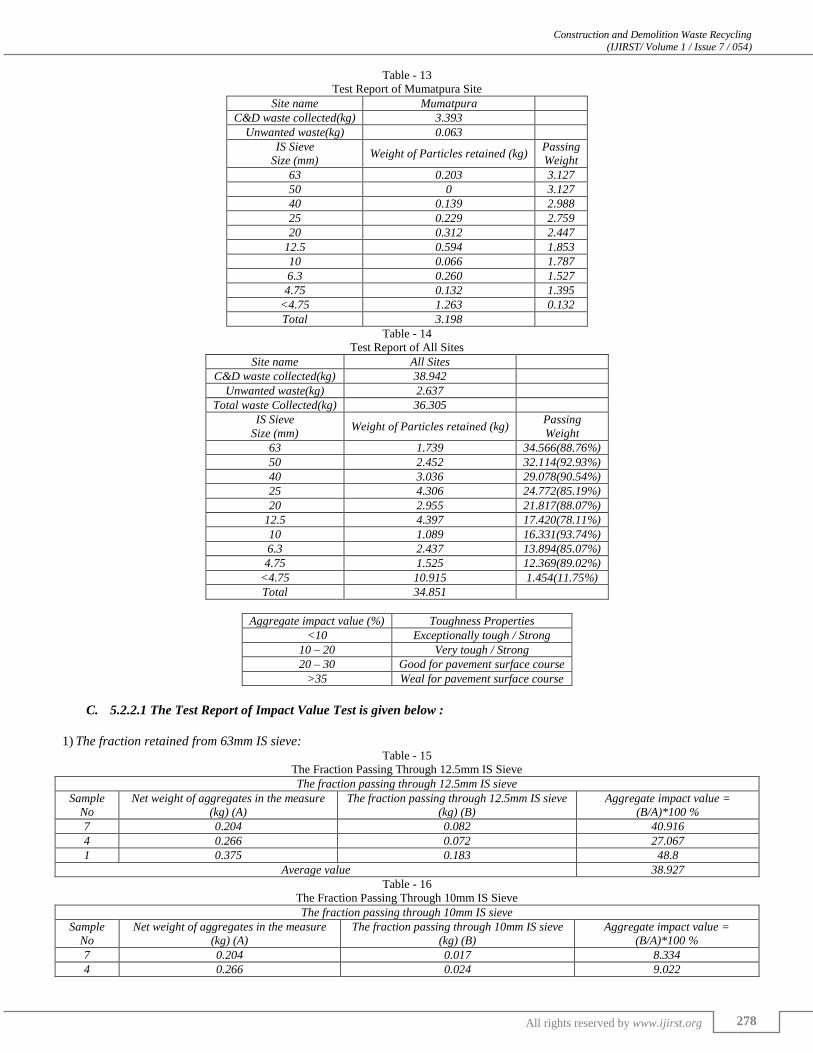
Table - 13
Test Report of Mumatpura Site
Site name Mumatpura
C&D waste collected(kg) 3.393
Unwanted waste(kg) 0.063
IS Sieve
Size (mm) Weight of Particles retained (kg)
Passing
Weight
63 0.203 3.127
50 0 3.127
40 0.139 2.988
25 0.229 2.759
20 0.312 2.447
12.5 0.594 1.853
10 0.066 1.787
6.3 0.260 1.527
4.75 0.132 1.395
<4.75 1.263 0.132
Total 3.198
Table - 14
Test Report of All Sites
Site name All Sites
C&D waste collected(kg) 38.942
Unwanted waste(kg) 2.637
Total waste Collected(kg) 36.305
IS Sieve
Size (mm) Weight of Particles retained (kg)
Passing
Weight
63 1.739 34.566(88.76%)
50 2.452 32.114(92.93%)
40 3.036 29.078(90.54%)
25 4.306 24.772(85.19%)
20 2.955 21.817(88.07%)
12.5 4.397 17.420(78.11%)
10 1.089 16.331(93.74%)
6.3 2.437 13.894(85.07%)
4.75 1.525 12.369(89.02%)
<4.75 10.915 1.454(11.75%)
Total 34.851
Aggregate impact value (%) Toughness Properties
<10 Exceptionally tough / Strong
10 – 20 Very tough / Strong
20 – 30 Good for pavement surface course
>35 Weal for pavement surface course
C. 5.2.2.1 The Test Report of Impact Value Test is given below :
The fraction retained from 63mm IS sieve: 1)Table - 15
The Fraction Passing Through 12.5mm IS Sieve
The fraction passing through 12.5mm IS sieve
Sample
No
Net weight of aggregates in the measure
(kg) (A)
The fraction passing through 12.5mm IS sieve
(kg) (B)
Aggregate impact value =
(B/A)*100 %
7 0.204 0.082 40.916
4 0.266 0.072 27.067
1 0.375 0.183 48.8
Average value 38.927
Table - 16
The Fraction Passing Through 10mm IS Sieve
The fraction passing through 10mm IS sieve
Sample
No
Net weight of aggregates in the measure
(kg) (A)
The fraction passing through 10mm IS sieve
(kg) (B)
Aggregate impact value =
(B/A)*100 %
7 0.204 0.017 8.334
4 0.266 0.024 9.022
Construction and Demolition Waste Recycling (IJIRST/ Volume 1 / Issue 7 / 054)
All rights reserved by www.ijirst.org 279
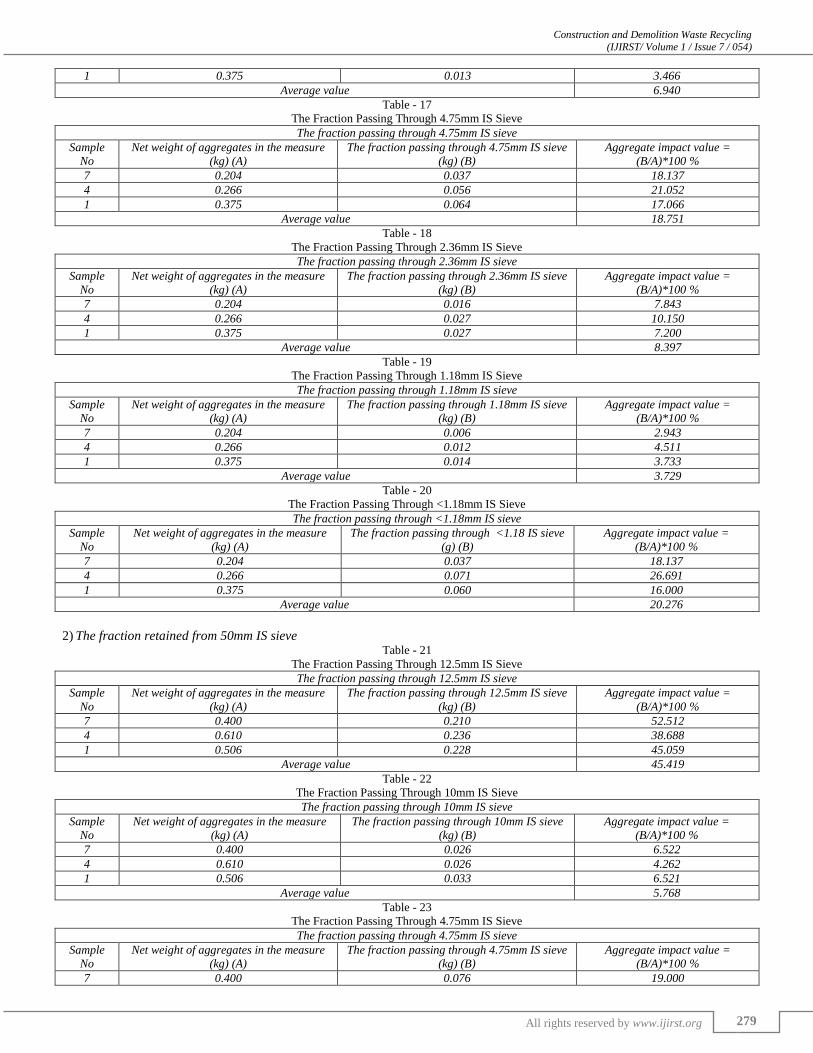
1 0.375 0.013 3.466
Average value 6.940
Table - 17
The Fraction Passing Through 4.75mm IS Sieve
The fraction passing through 4.75mm IS sieve
Sample
No
Net weight of aggregates in the measure
(kg) (A)
The fraction passing through 4.75mm IS sieve
(kg) (B)
Aggregate impact value =
(B/A)*100 %
7 0.204 0.037 18.137
4 0.266 0.056 21.052
1 0.375 0.064 17.066
Average value 18.751
Table - 18
The Fraction Passing Through 2.36mm IS Sieve
The fraction passing through 2.36mm IS sieve
Sample
No
Net weight of aggregates in the measure
(kg) (A)
The fraction passing through 2.36mm IS sieve
(kg) (B)
Aggregate impact value =
(B/A)*100 %
7 0.204 0.016 7.843
4 0.266 0.027 10.150
1 0.375 0.027 7.200
Average value 8.397
Table - 19
The Fraction Passing Through 1.18mm IS Sieve
The fraction passing through 1.18mm IS sieve
Sample
No
Net weight of aggregates in the measure
(kg) (A)
The fraction passing through 1.18mm IS sieve
(kg) (B)
Aggregate impact value =
(B/A)*100 %
7 0.204 0.006 2.943
4 0.266 0.012 4.511
1 0.375 0.014 3.733
Average value 3.729
Table - 20
The Fraction Passing Through <1.18mm IS Sieve
The fraction passing through <1.18mm IS sieve
Sample
No
Net weight of aggregates in the measure
(kg) (A)
The fraction passing through <1.18 IS sieve
(g) (B)
Aggregate impact value =
(B/A)*100 %
7 0.204 0.037 18.137
4 0.266 0.071 26.691
1 0.375 0.060 16.000
Average value 20.276
The fraction retained from 50mm IS sieve 2)Table - 21
The Fraction Passing Through 12.5mm IS Sieve
The fraction passing through 12.5mm IS sieve
Sample
No
Net weight of aggregates in the measure
(kg) (A)
The fraction passing through 12.5mm IS sieve
(kg) (B)
Aggregate impact value =
(B/A)*100 %
7 0.400 0.210 52.512
4 0.610 0.236 38.688
1 0.506 0.228 45.059
Average value 45.419
Table - 22
The Fraction Passing Through 10mm IS Sieve
The fraction passing through 10mm IS sieve
Sample
No
Net weight of aggregates in the measure
(kg) (A)
The fraction passing through 10mm IS sieve
(kg) (B)
Aggregate impact value =
(B/A)*100 %
7 0.400 0.026 6.522
4 0.610 0.026 4.262
1 0.506 0.033 6.521
Average value 5.768
Table - 23
The Fraction Passing Through 4.75mm IS Sieve
The fraction passing through 4.75mm IS sieve
Sample
No
Net weight of aggregates in the measure
(kg) (A)
The fraction passing through 4.75mm IS sieve
(kg) (B)
Aggregate impact value =
(B/A)*100 %
7 0.400 0.076 19.000
Construction and Demolition Waste Recycling (IJIRST/ Volume 1 / Issue 7 / 054)
All rights reserved by www.ijirst.org 280
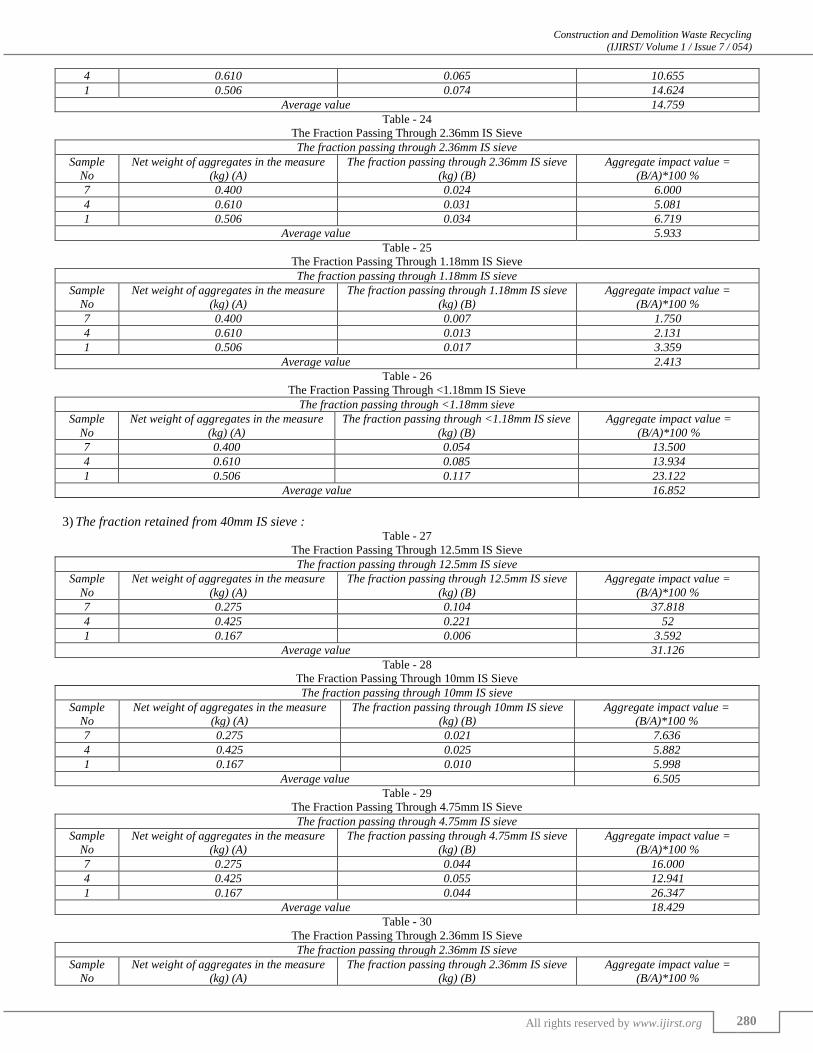
4 0.610 0.065 10.655
1 0.506 0.074 14.624
Average value 14.759
Table - 24
The Fraction Passing Through 2.36mm IS Sieve
The fraction passing through 2.36mm IS sieve
Sample
No
Net weight of aggregates in the measure
(kg) (A)
The fraction passing through 2.36mm IS sieve
(kg) (B)
Aggregate impact value =
(B/A)*100 %
7 0.400 0.024 6.000
4 0.610 0.031 5.081
1 0.506 0.034 6.719
Average value 5.933
Table - 25
The Fraction Passing Through 1.18mm IS Sieve
The fraction passing through 1.18mm IS sieve
Sample
No
Net weight of aggregates in the measure
(kg) (A)
The fraction passing through 1.18mm IS sieve
(kg) (B)
Aggregate impact value =
(B/A)*100 %
7 0.400 0.007 1.750
4 0.610 0.013 2.131
1 0.506 0.017 3.359
Average value 2.413
Table - 26
The Fraction Passing Through <1.18mm IS Sieve
The fraction passing through <1.18mm sieve
Sample
No
Net weight of aggregates in the measure
(kg) (A)
The fraction passing through <1.18mm IS sieve
(kg) (B)
Aggregate impact value =
(B/A)*100 %
7 0.400 0.054 13.500
4 0.610 0.085 13.934
1 0.506 0.117 23.122
Average value 16.852
The fraction retained from 40mm IS sieve : 3)Table - 27
The Fraction Passing Through 12.5mm IS Sieve
The fraction passing through 12.5mm IS sieve
Sample
No
Net weight of aggregates in the measure
(kg) (A)
The fraction passing through 12.5mm IS sieve
(kg) (B)
Aggregate impact value =
(B/A)*100 %
7 0.275 0.104 37.818
4 0.425 0.221 52
1 0.167 0.006 3.592
Average value 31.126
Table - 28
The Fraction Passing Through 10mm IS Sieve
The fraction passing through 10mm IS sieve
Sample
No
Net weight of aggregates in the measure
(kg) (A)
The fraction passing through 10mm IS sieve
(kg) (B)
Aggregate impact value =
(B/A)*100 %
7 0.275 0.021 7.636
4 0.425 0.025 5.882
1 0.167 0.010 5.998
Average value 6.505
Table - 29
The Fraction Passing Through 4.75mm IS Sieve
The fraction passing through 4.75mm IS sieve
Sample
No
Net weight of aggregates in the measure
(kg) (A)
The fraction passing through 4.75mm IS sieve
(kg) (B)
Aggregate impact value =
(B/A)*100 %
7 0.275 0.044 16.000
4 0.425 0.055 12.941
1 0.167 0.044 26.347
Average value 18.429
Table - 30
The Fraction Passing Through 2.36mm IS Sieve
The fraction passing through 2.36mm IS sieve
Sample
No
Net weight of aggregates in the measure
(kg) (A)
The fraction passing through 2.36mm IS sieve
(kg) (B)
Aggregate impact value =
(B/A)*100 %
Construction and Demolition Waste Recycling (IJIRST/ Volume 1 / Issue 7 / 054)
All rights reserved by www.ijirst.org 281
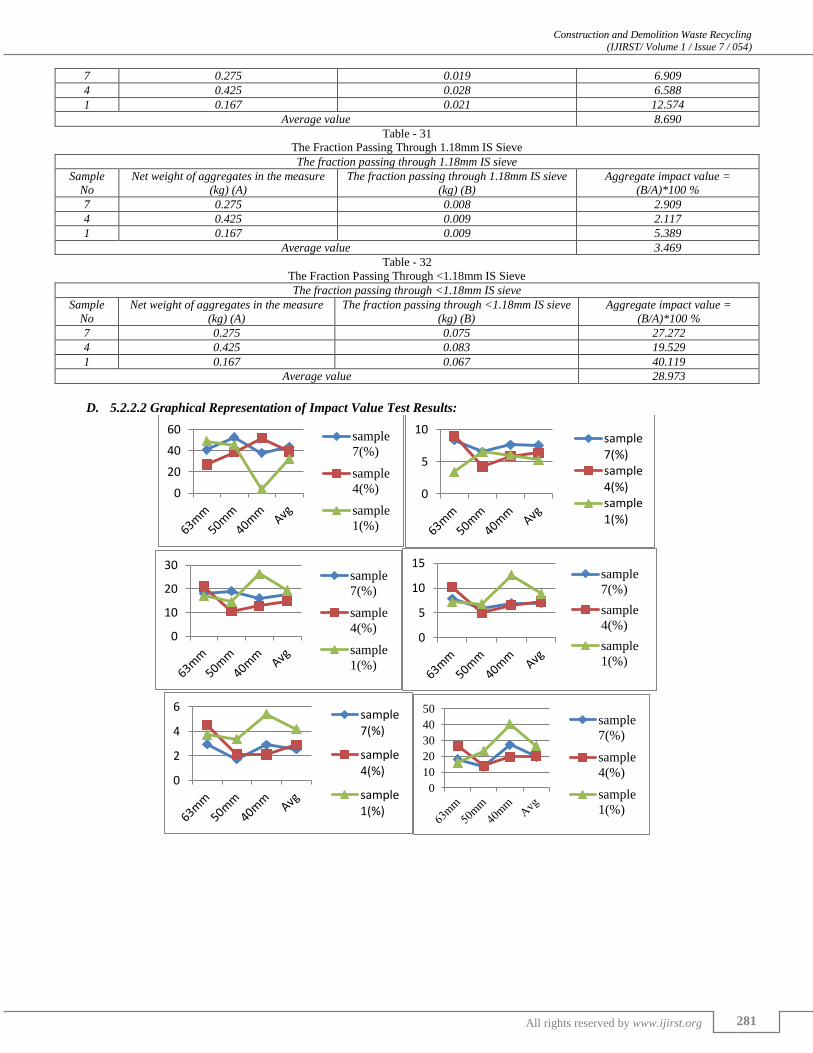
7 0.275 0.019 6.909
4 0.425 0.028 6.588
1 0.167 0.021 12.574
Average value 8.690
Table - 31
The Fraction Passing Through 1.18mm IS Sieve
The fraction passing through 1.18mm IS sieve
Sample
No
Net weight of aggregates in the measure
(kg) (A)
The fraction passing through 1.18mm IS sieve
(kg) (B)
Aggregate impact value =
(B/A)*100 %
7 0.275 0.008 2.909
4 0.425 0.009 2.117
1 0.167 0.009 5.389
Average value 3.469
Table - 32
The Fraction Passing Through <1.18mm IS Sieve
The fraction passing through <1.18mm IS sieve
Sample
No
Net weight of aggregates in the measure
(kg) (A)
The fraction passing through <1.18mm IS sieve
(kg) (B)
Aggregate impact value =
(B/A)*100 %
7 0.275 0.075 27.272
4 0.425 0.083 19.529
1 0.167 0.067 40.119
Average value 28.973
D. 5.2.2.2 Graphical Representation of Impact Value Test Results:
0
20
40
60sample
7(%)
sample
4(%)
sample
1(%)
0
5
10sample7(%)sample4(%)sample1(%)
0
10
20
30sample
7(%)
sample
4(%)
sample
1(%)
0
5
10
15sample
7(%)
sample
4(%)
sample
1(%)
0
2
4
6sample7(%)
sample4(%)
sample1(%)
0
10
20
30
40
50sample
7(%)
sample
4(%)
sample
1(%)
Construction and Demolition Waste Recycling (IJIRST/ Volume 1 / Issue 7 / 054)
All rights reserved by www.ijirst.org 282
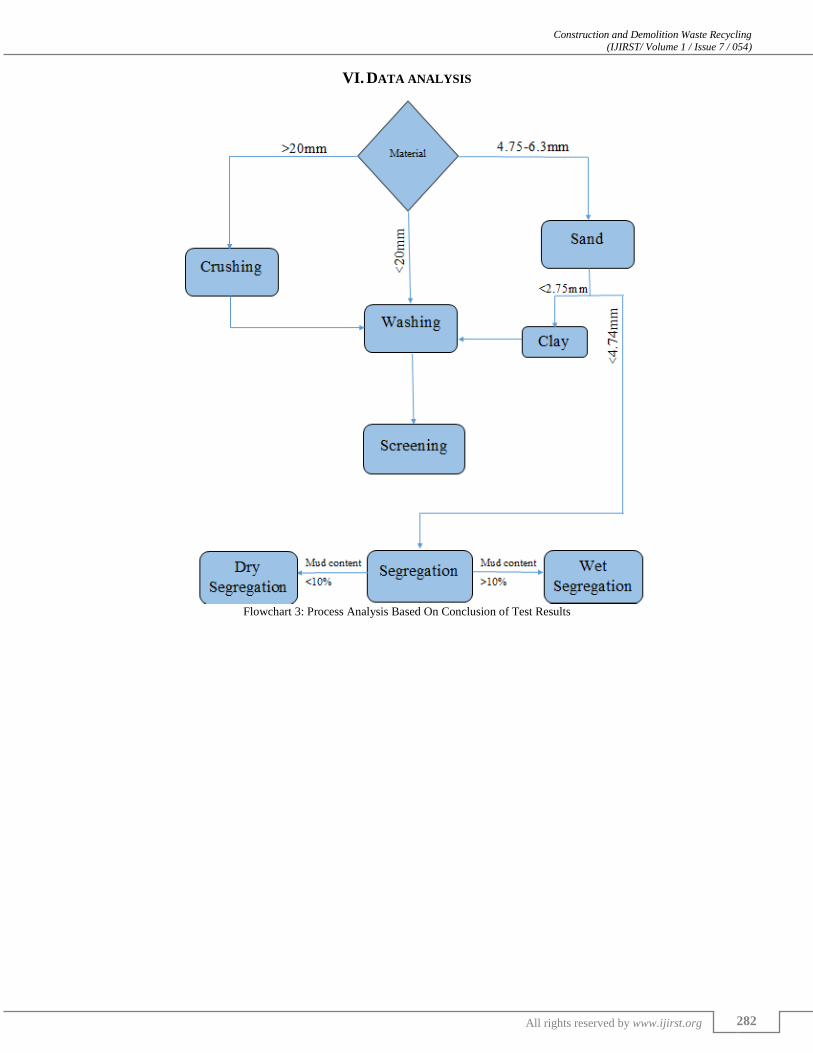
VI. DATA ANALYSIS
Flowchart 3: Process Analysis Based On Conclusion of Test Results
Construction and Demolition Waste Recycling (IJIRST/ Volume 1 / Issue 7 / 054)
All rights reserved by www.ijirst.org 283
A. Theoretical explanation of Test Results:
The total material left after testing is segregated as shown in above given flowchart into mainly three sections. The first section is
of material which is crushable i.e. particles greater than 20mm. Second section is directly sent for screening i.e. whose particle
size is between 6.3mm to 20mm.
Now the process of washing is conducted for the remaining portion of the total material left. This is mainly called as sand.
Construction and Demolition Waste Recycling (IJIRST/ Volume 1 / Issue 7 / 054)
All rights reserved by www.ijirst.org 284
Further, the particles whose size is less than 2.75mm is directly sent to washer and the remaining part is again segregated by
two methods namely: Wet segregation (mud content >10%) and Dry segregation (mud content <10%).
Now the crushed material is washed before undergoing screening.
At the end, after completion of each separate process, the screening and washing is done.
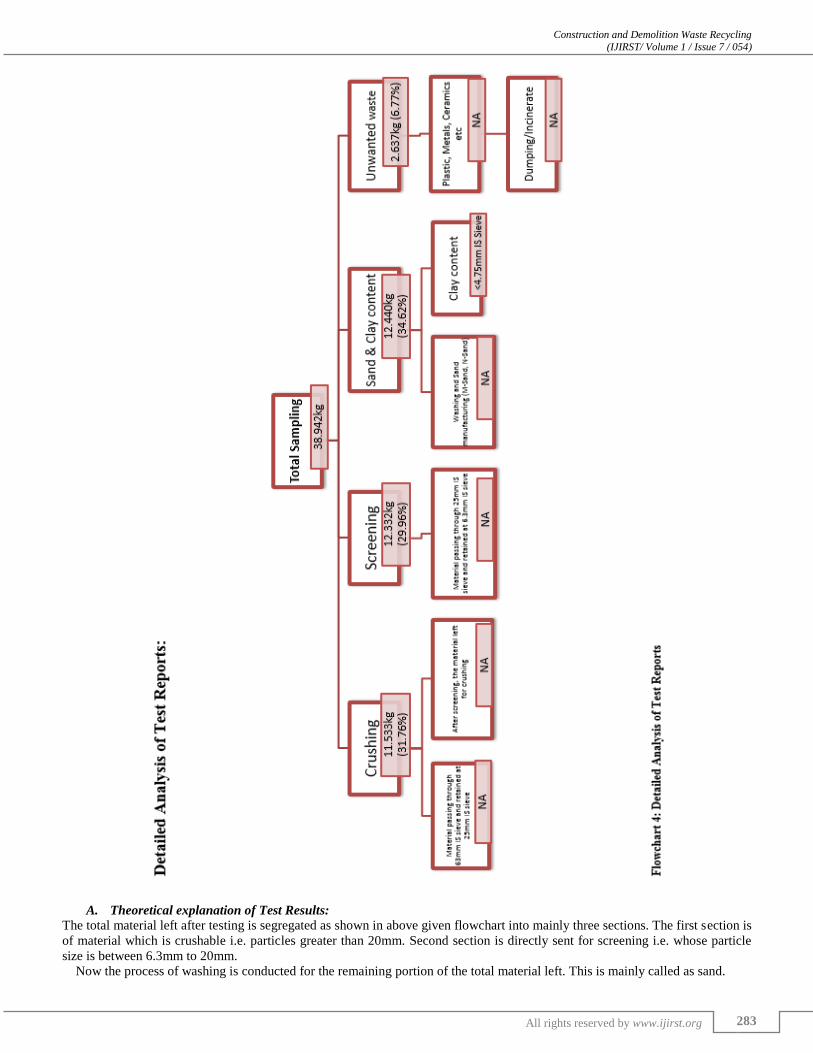
B. Theoretical explanation of detailed analysis :
We carried out total sampling of 38.942 kg of C and D waste collected from 11 different sites of Ahmedabad.
Various tests namely Crushing and screening were carried out on these samples.
Out of the total collected sample 2.673 kg of unwanted waste was recovered.
The sand and clay content was found to be 12.440 kg i.e. approx. 35 %.
The unwanted waste comprised of plastic, metals, ceramics, etc.
This unwanted waste cannot be recycled and has to be dumped or incinerated depending on the properties of the waste.
The sand and clay content can be recycled for washing and manufacturing of sand which can be further used in new construction.
Sieve analysis was also carried out of the crushed materials to determine its properties.
VII. CONCLUSION
A. Estimated weight of aggregates of various size and sand after crushing:
The conclusion of the particle size distribution is that, out of the total material tested (36.305kg), 40% is crushable. The different
size of aggregates which we got after crushing is shown in the table given below: Sieve Size 25-63mm
Total Weight 14.522kg
Aggregate Size Weight(kg)
6-8mm 4.356
10mm 2.904
20mm 2.178
<20mm (Crushable) 7.729
Dust 0.290
The remaining material other than crushable are fine aggregates and sand. The content of this from the total is 60%. The detail
classification of fine aggregates and sand is given as below. Sieve Size 4.75-20
Total Weight 21.783
Aggregate Size Weight(kg)
>6mm 4.243
Course Sand 4.247
Fine Sand 4.792
Dust 8.495
Construction and Demolition Waste Recycling (IJIRST/ Volume 1 / Issue 7 / 054)
All rights reserved by www.ijirst.org 285
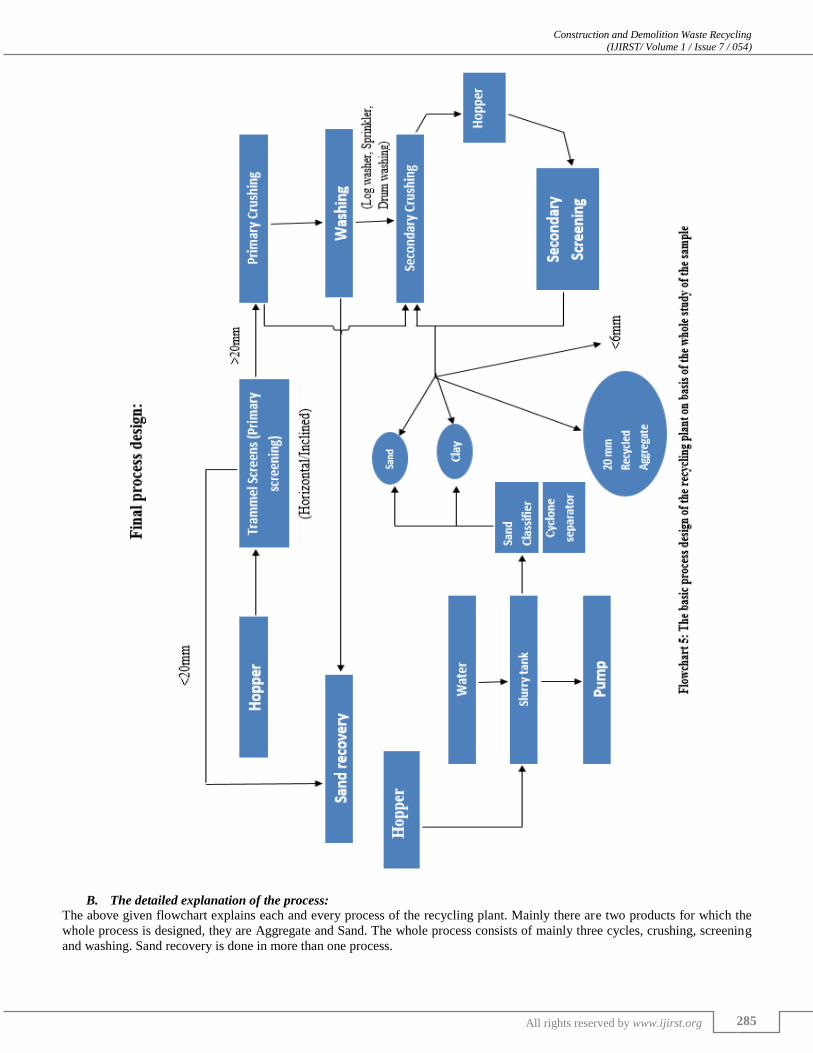
B. The detailed explanation of the process:
The above given flowchart explains each and every process of the recycling plant. Mainly there are two products for which the
whole process is designed, they are Aggregate and Sand. The whole process consists of mainly three cycles, crushing, screening
and washing. Sand recovery is done in more than one process.
Construction and Demolition Waste Recycling (IJIRST/ Volume 1 / Issue 7 / 054)
All rights reserved by www.ijirst.org 286
First of all the construction and demolition waste is sent for initial screening through hopper. This screen may be of many
types, for example horizontal and inclined. This screening is mainly done to segregate the large crushable materials which are
greater than 20mm while smaller than 20mm particles are directly send for sand recovery.
Now primary washing is done of the remaining material and further it is washed with the help of various kind of washers like
log washer, sprinkler, drum washer etc. After the completion of washing, the material is taken for secondary crushing. Now with
the help of conveyor belt the crushed material is sent for secondary screening through hopper.
This secondary screening is important part of the process because by doing so the material (C&D waste) is finally
differentiated into four products. These products are sand, clay and aggregates (recycled). The material which is still left is sent
again for crushing and the cycle is repeated.
The sand recovered in the initial sand recovery as shown in flowchart is collected in a hopper. It is then sent to slurry tank
where the material washed by pumping of water. Now with the help of sand clarifier and cyclone separator, the two products
sand and clay are separated respectively.
ACKNOWLEDGEMENT
We take this opportunity to express our profound gratitude and deep regards to our Prof. Chinmay Shah, Prof. Mayank Bhatt and
HOD(Civil Department) S.M.Zuned for their exemplary guidance, monitoring and constant encouragement throughout the
course of this thesis. The blessings, help and guidance given by their time shall carry us a long way in the journey of life on
which we are about to embark.Our thanks and appreciations also go to our colleagues in developing the project and people who
have willingly helped us out with their abilities.Apart from our college faculty and colleagues, we are also thankful to the
company AMDAVAD ENVIRO PROJECTS PVT LTD. Under which we are able to carry out this project. Special thanks to Mr.
Kaustuv Patnaik who is our external guide in project and Mr. Vinit Patel, Director of AEP.Under the guidance of them, we are
able to flourish our minds in more ‘GREENER WAY’.
REFERENCES
[1] www.urbanindia.nic.in
[2] www.waste-management-world.com
[3] www.ijsrp.org/research-paper-1012
[4] www.theconcreteproducer.com
[5] www.theconstructor.org
[6] http://www.umcasia.org/content.php?id=63
[7] http://www.academia.edu/7783133/Construction_and_Demolition_Waste_in_India
[8] http://www.academia.edu/7587148/Waste_quantification_models_for_estimation_of_construction_and_demolition_waste_generation_A_
review (International Journal of Global Environmental Issues (10.1504/IJGENVI.2012.049378))
[9] http://papers.ssrn.com/sol3/papers.cfm?abstract_id=2383436 (OIDA International Journal of Sustainable Development, Vol. 6, No. 7, pp.
83-92, 2013)
[10] http://www.ajer.org/papers/rase-2013/volume-2/B220130609.pdf - American Journal of Engineering Research (AJER) , e-ISSN : 2320-
0847 p-ISSN : 2320-0936, Volume-2 pp-06-09
[11] Technology Information, Forecasting and Assessment Council-Department of Science and Technology, Government of India
(http://www.tifac.org.in/index.php?option=com_content&view=article&id=710&Itemid=205)
[12] http://civilblog.org/2014/07/16/aggregate-impact-value-test-10-important-notes-to-remember/
[13] http://www.egovamc.com/Downloads/SWM/SWM_PRESENTATION.pdf
[14] http://www.gurgaonfirst.org/media/pdf.upload/Mr_C_R_Kharsan_AMC.pdf
[15] http://www.in.gov/indot/div/mt/aashto/testmethods/aashto_t27.pdf
[16] http://www.cseindia.org/userfiles/Construction-and%20-demolition-waste.pdf- Centre for Science and Environment
[17] FAS_CIFHandbookonConstructionDemolitionWasteManagement.pdf
[18] http://www.epa.gov/epawaste/conserve/imr/cdm/pubs/indiana.pdf
[19] Journal of Environmental Research And Development Vol. 2 No. 4, April-June 2008
[20] http://www.isaet.org/images/extraimages/D1013037.pdf (International Journal of Chemical, Environmental & Biological Sciences
(IJCEBS) Volume 1, Issue 4 (2013) ISSN 2320-4079; EISSN 2320–4087)
[21] http://www.ajer.org/papers/rase-2013/volume-2/B220130609.pdf (American Journal of Engineering Research (AJER) e-ISSN : 2320-
0847 p-ISSN : 2320-0936 Volume-2 pp-06-09)
[22] http://www.ijsrp.org/research-paper-1012/ijsrp-p1041.pdf (International Journal of Scientific and Research Publications, Volume 2, Issue
10, October 2012 1 ISSN 2250-3153)
[23] http://iosrjournals.org/iosr-jmce/papers/sicete%28civil%29-volume5/57.pdf (IOSR Journal of Mechanical and Civil Engineering (IOSR-
JMCE) ISSN: 2278-1684, PP: 52-59)
[24] http://ascpro0.ascweb.org/archives/cd/2012/paper/CPRT135002012.pdf
[25] Author: M.S. Shetty, Title: CONCRETE TECHNOLOGY, Year of Publication: 2011, Page no. 93, 114.
[26] International Journal of Scientific and Research Publications, Volume 2, Issue 10, October 2012 ISSN 2250-3153
[27] Technology Information, Forecasting and assessment Council, Dept. Science and Technology, Government of India. (Table: Quantity and
make up of C&D Waste)
[28] Business plan for Construction and Demolition waste Recycling plant, By DNP Infrastructures Private Limited