construct validity of e-rater® in scoring toefl® essays various writing experts to compose gre...
TRANSCRIPT

Construct Validity of e-rater® in Scoring TOEFL® Essays
May 2007 RR-07-21
ResearchReport
Yigal Attali
Research & Development

Construct Validity of e-rater® in Scoring TOEFL® Essays
Yigal Attali
ETS, Princeton, NJ
May 2007

As part of its educational and social mission and in fulfilling the organization's nonprofit charter
and bylaws, ETS has and continues to learn from and also to lead research that furthers
educational and measurement research to advance quality and equity in education and assessment
for all users of the organization's products and services.
ETS Research Reports provide preliminary and limited dissemination of ETS research prior to
publication. To obtain a PDF or a print copy of a report, please visit:
http://www.ets.org/research/contact.html
Copyright © 2007 by Educational Testing Service. All rights reserved.
E-RATER, ETS, the ETS logo, GRE, PRAXIS SERIES: PROFESSIONAL ASSESSMENTS FOR BEGINNING TEACHERS, and TOEFL are registered
trademarks of Educational Testing Service (ETS). PRAXIS SERIES is a trademark of ETS.

Abstract
This study examined the construct validity of the e-rater® automated essay scoring engine as an
alternative to human scoring in the context of TOEFL® essay writing. Analyses were based on a
sample of students who repeated the TOEFL within a short time period. Two e-rater scores were
investigated in this study, the first based on optimally predicting the human essay score and the
second based on equal weights for the different features of e-rater.
Within a multitrait-multimethod approach, the correlations and reliabilities of human and
e-rater scores were analyzed together with TOEFL subscores (structured writing, reading, and
listening) and with essay length. Possible biases between human and e-rater scores were
examined with respect to differences in performance across countries of origin and differences in
difficulty across prompts. Finally, a factor analysis was conducted on the e-rater features to
investigate the interpretability of their internal structure and determine which of the two e-rater
scores reflects this structure more closely.
Results showed that the e-rater score based on optimally predicting the human score
measures essentially the same construct as human-based essay scores with significantly higher
reliability and consequently higher correlations with related language scores. The equal-weights
e-rater score showed the same high reliability but significantly lower correlation with essay
length. It is also aligned with the 3-factor hierarchical (word use, grammar, and discourse)
structure that was discovered in the factor analysis. Both e-rater scores also successfully
replicate human score differences between countries and prompts.
Key words: Validity, automated essay scoring, e-rater
i

Introduction
As measures of writing skill, essay writing assessments are often favored over measures
that assess students’ knowledge of writing conventions (for example, through multiple-choice
tests), because they require students to produce a sample of writing and as such are more direct.
However, a drawback of essay writing assessments is that their evaluation requires a significant
and time-consuming effort. These difficulties have led to a growing interest in the application of
automated natural language processing techniques for the development of automated essay
scoring (AES) as an alternative to human scoring of essays.
As early as 1966, Page developed an AES system and showed that an automated rater is
virtually indistinguishable from human raters. In the 1990s, more systems were developed; the
most prominent systems are the Intelligent Essay Assessor (Landauer, Foltz, & Laham, 1998),
Intellimetric (Elliot, 2001), a new version of the Project Essay Grade (Page, 1994), and e-rater®
(Burstein, Kukich, Wolff, Lu, & Chodorow, 1998).
Despite these developments, skepticism and criticisms have accompanied AES over the
years, often related to the fact that the machine does not understand the written text. For
example, in a New York Times column, Scott (1999) remarked, “It has come to this. The essay,
the great literary art form that Montaigne conceived and Virginia Woolf carried on…has sunk to
a state where someone thinks it is a bright idea to ask a computer if an essay is any good.”
These remarks reflect a feeling that computer judgments should be rejected out of hand,
because a computer never will understand or appreciate an essay in the same way as a human.
These feelings notwithstanding, the trustworthiness of AES interpretation, or its construct
validity, should be established empirically. Two general types of evidence, convergent and
discriminant, are required to strengthen construct validity (Messick, 1989). These two kinds of
evidence protect against two general types of threat to interpretive meaning: construct
underrepresentation and construct-irrelevant variance (Messick).
In the context of AES, the threat of construct underrepresentation is exemplified by the
possibility that AES is influenced more by the writer’s grammar and mastery of writing
conventions and less by originality, personal voice, and graceful style. The importance of essay
length for essay scores represents the threat of construct-irrelevant influences on essay scores. A
strong relationship between essay length and human evaluations of essays has been found
repeatedly and interpreted as being possibly irrelevant and unwanted (Powers, 2005), although
1

this relationship may be a natural side effect of the need to provide supporting detail (Breland,
Bonner, & Kubota, 1995). Essay length is very easily measured automatically; thus, it is
important to show that automated scores do not amount to counting words.
The context of AES as an alternative method of scoring essays provides further
guidelines into the validation process. In this context, we may be more interested in possible
differences between the human and machine scoring methods than in the validation of AES
independently of human scoring. More formally, we are interested in identifying score variance
that is uniquely associated with one of the scoring methods—human or machine.
In this respect, we are less interested in content validation, the degree to which the
behaviors and processes exhibited in essay writing represent the domain of writing proficiency.
Although Messick (1989) argued that content considerations are part of construct validation, the
immediate concern of AES validation is as a new method of scoring an established task. This,
however, does not preclude the prospect of clarifying the construct through the efforts to validate
this new method of scoring. A word of clarification is in place, however. Essay writing can refer
to very different activities. Some writing assignments are heavily dependent on specific
background information, as in analyses of a novel, historical event, or scientific topic. Although
the quality of writing may be very important in the assessment of such assignments, for most of
them it is not their major purpose. The types of assignments that are of concern in this study are
less dependent on previous knowledge, and their major purpose is to assess writing quality (e.g.,
“Explain whether or not you think working while going to school is a good idea”).
Despite numerous evaluations of AES systems (Yang, Buckendahl, Jusziewicz, & Bhola,
2002), most of these studies have focused on the agreement between automated scores and
human-assigned scores on a single essay. In these studies, Page’s (1966) early findings were
generally replicated, showing that automated scores agree with human scores as much as human
scores agree between themselves (e.g., Burstein et al., 1998; Elliot, 2001; Landauer et al., 1998).
However, this type of evidence is not sufficient for validating AES, because agreement results
tell us little about what is measured by automated scores and thus do not contribute to construct
validation of AES. Automated scores may have high agreement with human scores and still
suffer from construct underrepresentation or construct-irrelevant variance.
2

Prior Research
One kind of validity evidence that goes beyond agreement with human scores is the
relationship between AES and other measures of the same or similar construct. These analyses
could serve as convergent evidence against the threat of construct underrepresentation. One such
measure is a multiple-choice test of writing (based on editing and error recognition tasks). This is
a relevant measure for validating essay scores because, like an essay test, the multiple-choice test
is also intended to measure writing skills, although indirectly through recognition tasks that
measure the knowledge of writing conventions. Only one study compared human and automated
essay scores’ relations with scores from such indirect writing tests. Petersen (1997) examined the
performance of the Project Essay Grade system (Page & Petersen, 1995) on essays written by
prospective teachers for a teacher certification program, the Praxis Series: Professional
Assessments for Beginning Teachers®. She found that the automated scores correlated .47 with
the multiple-choice writing subtest of the Praxis Series™, whereas the human essay scores
correlated .45 with the same scores.
Petersen (1997) also examined the relations of automated and human essay scores with
other subscores from the same general ability test. These measures are relevant for validation of
essay scores, especially when their purpose is to measure other aspects of language proficiency,
like reading. For the Praxis Series essays, she found that the correlations of the automated essay
scores with the reading and mathematics subscores were .39 and .30, respectively. The
corresponding correlations for the human essay scores were somewhat higher, .43 and .36. For
GRE® essays, the correlations of the automated scores with GRE verbal, quantitative, and
analytical scores were .26, .13, and .24, respectively. Again, the corresponding human essay
scores’ correlations were slightly higher: .33, .16, and .26.
Powers, Burstein, Chodorow, Fowles, and Kukich (2002a) examined the relationship of
GRE essay scores, both automated scores derived using an older version of e-rater and human
scores, to several nontest indicators of examinees’ writing skills. These included self-evaluations
of writing ability and various self-reported accomplishments in writing. These measures provide
important information on the validity of essay scores because they are related to real-world
achievements in writing. Results showed somewhat weaker correlations for automated scores
than for human scores with these indicators.
3
Finally, Attali and Burstein (2006) evaluated the true-score correlations between human
essay scores and e-rater Version 2 (V.2) scores in the context of K–12 writing. This kind of
validity evidence is important because it directly estimates the overlap in systematic variation of
human and automated essay scores. By examining multiple essay scores by the same students,
Attali and Burstein were able to estimate the alternate-form reliability of automated and human
scoring and to correct the raw correlations between scores across the different essays. They
found that e-rater scores had a higher reliability than a single human score (.59 vs. .51) and that
the true-score correlation between human and e-rater scores was very close to unity (.97).
The other kind of construct validity evidence examines the sensitivity of AES to attempts
to trick the system into awarding inaccurately high scores. These analyses could serve as
discriminant evidence against the threat of construct-irrelevant variance. Powers et al. (2002b)
invited various writing experts to compose GRE essays with the intention of tricking an automated
scoring system, e-rater, into awarding scores that were either higher or lower than deserved.
Awarding higher-than-deserved scores reflects the degree to which automated scoring is
influenced by extraneous features of examinees’ writing. In Powers et al. (2002b), 30 such essays
were written with varying success. Overall, the average e-rater score of these essays (on a 1–6
scale) was 4.2 (with an SD of 1.2), whereas the average human score was 2.9 (with an SD of 1.3).
Another study (Chodorow & Burstein, 2004) examined the sensitivity of automated
scores to another irrelevant factor, essay length, in the context of TOEFL essays written by
examinees from different countries of origin. Results showed that the partial correlations
between human and automated scores, after controlling for essay length, were higher for a later
version e-rater (e-rater01) than for an early version (e-rater99).
Chodorow and Burstein (2004) also examined possible biases in automated scores with
respect to different language groups. The existence of such biases again would show that the
automated scores might be influenced by extraneous features of the writing that characterize
some language groups but not others. The significance of the interaction between the rater effect
(human or automated) and the language group effect was studied. For e-rater99, 5 out of 7
prompts showed a significant interaction, whereas for e-rater01, only one such interaction was
found.
To summarize, only a handful of studies have examined construct validity questions with
respect to AES. The issues that these studies addressed, separately, were the relation between
4

essay scores, human and automated, with other test scores of interest or nontest indicators of
writing proficiency, the true-score correlation between human and automated scores, and the
sensitivity of automated scores to several extraneous factors. The purpose of this study was to
examine all of these issues in the context of a new version of the e-rater scoring engine (Attali &
Burstein, 2006) and to add to these issues other kinds of analyses that were made possible with e-
rater V.2. Obviously, no single study can address all construct validation issues, but the purpose
of this study was to provide a more comprehensive analysis of these issues.
e-rater V.2
e-rater V.2 (Attali & Burstein, 2006) differs from the previous version of e-rater and
from other systems in several important ways that contribute to its validity. The feature set used
for scoring is small, and all of the features are indicators of generally acknowledged dimensions
of good writing. Consequently, different scoring models use the same features. In addition, the
procedures for combining the features into an essay score are simple and can be based on expert
judgment. Finally, scoring procedures can be applied successfully to data from several essay
prompts of the same assessment. This means that a single scoring model can be developed for a
writing assessment, consistent with the human rubric that is usually the same for all assessment
prompts in the same mode of writing.
The feature set used with e-rater (and described in detail in Attali & Burstein, 2006)
includes measures of grammar, usage, mechanics, style, organization, development, vocabulary,
and word length. All these measures are related to the form and structure of the essay. In
addition, it is possible to use prompt-specific vocabulary usage measures. In order to produce an
essay score, the feature values should be combined. In e-rater V.2, this is accomplished by
standardizing the feature values, followed by calculating a weighted average of the standardized
feature values, and finally applying a linear transformation to achieve a desired scale (usually by
matching some human scoring standards). Standardization can be based on previous parameters
for the means and SDs of features. The weights can be based on multiple regression of the
features on a human-score criterion as well as on human expert judgments on the importance of
features (e.g., see Ben-Simon & Bennett, 2006). The simplicity of this process and the small and
standard feature set allow performing this process with just a few human-scored benchmark
essays on-the-fly (Attali, 2006).
5

The Present Study
In this study, e-rater was examined in the context of essays written for prompts used in
the computer-based TOEFL (not the new iBT TOEFL). These essays are written by nonnative
English speakers who take the TOEFL when applying for admission to U.S. colleges and
universities. Apart from the 30-minute essay section, the computer-based TOEFL test includes
multiple-choice tests of reading, listening, and structured writing.
In this section, a few general considerations of this study are reviewed, including the test-
retest analysis approach, the importance of feature weighting schemes, and the use of a single
generic scoring mode. This is followed by a general overview of the kinds of validation analyses
that were performed.
As in Attali and Burstein (2006), the approach taken in this study was to analyze the
relationship of essay scores with essay scores from other prompts. Relationships across different
prompts make more sense from an assessment perspective (where different forms use different
prompts); they allow the estimation of a more general type of reliability (alternate-form
reliability) and can serve as the basis for an estimation of the shared variance and true-score
correlation between human and machine scores.
This kind of validation also changes the usual perspective on human and machine scores.
In most studies of AES, the human scores are the ultimate criterion against which the machine
scores are evaluated. However, Bennett and Bejar (1998) urged against reliance on human
ratings as the sole criterion for judging the success of automated scoring. As they pointed out,
human raters are highly fallible, especially regarding human essay scoring. Using human ratings
to evaluate and refine automated scoring could produce a suboptimal result.
The most important aspect of automated scoring that previous studies have based on
human scoring is the selection and weighting of features. Both the identity of features and their
importance in automated scores are dependent on statistical procedures that optimize the
prediction of human scores from available automated features (see Shermis & Burstein, 2003).
Scoring models are also typically prompt specific, so the importance and even the identity of
features employed may vary widely across different prompts. This data-driven approach makes it
difficult to establish the meaning of automated scores. Consequently, there have been very few
attempts to document the importance of features in use. Burstein et al. (1998) reported on the
most commonly used features in scoring models, but apart from four features, the features
6

actually used varied greatly across scoring models. Landauer, Laham, and Foltz (2001)
suggested that the most important component in scoring models is content.
e-rater V.2, with its small and meaningful feature set, makes it possible to control what
Embretson (1983) called the construct representation (the meaning of scores based on internal
evidence) and nomothetic span (the meaning of scores based on relationships with external
variables). More specifically, e-rater V.2 enables controlling the meaning of scores by
manipulating the weights of the different dimensions of scoring (measured by the different
features). This could be done on the basis of internal evidence about the meaning of the
dimensions, their reliability, and the relations between them as well as on external evidence
about the performance of the different dimensions and e-rater as a whole.
In this study, an alternative weighting scheme that is not based on prediction of human
essay scores was evaluated and compared with the optimal human-prediction scheme (eHMN).
The alternative scheme chosen was an equal-weight scheme for the eight noncontent features
used in e-rater (eEQL). This scheme was selected for its simplicity and because it can be seen as
a base scheme, from which alternative schemes can be evaluated. It is also well-known that
equal-weights linear models can perform as well as optimal models under general conditions
(Wainer, 1976).
As was mentioned above, with e-rater V.2 it is possible to develop a single scoring
model that is applied on all prompts and essays of a particular program (program-level model),
as opposed to a prompt-specific model. This possibility is important in any large-scale
assessment application, but it is essential in the context of this study because it allows fixing the
construct representation of the automated scores.
The validation of the automated scores was pursued in three lines of analyses. The
correlational analyses, within a multitrait-multimethod approach, evaluated the two e-rater
scores, eHMN and eEQL, alongside the human scores as three alternative methods of scoring the
TOEFL essays. The correlations, reliabilities, and true-score correlations of human and e-rater
scores were analyzed together with TOEFL subscores (structured writing, reading, and listening)
and with essay length. The goals of this analysis were the following:
1. Compare the true-score correlations of eHMN and eEQL with the human scores. How
closely related are the human scores and eHMN, which are purposely developed to
resemble the human scores? How closely related are the human scores to eEQL?
7

2. Compare the reliability of the automated and human scores. If the human and
automated scores are closely related, reliability of the scoring methods is an important
factor in their use. Is eHMN more reliable than the human scores (single scores and
average of two scores), as Attali and Burstein (2006) found? Is eEQL less reliable
than eHMN?
3. Compare the correlations of essay scores with the related TOEFL language scores.
These correlations should be fairly high but lower than the correlations between the
essay scoring methods. We also should expect a certain rank order of these
correlations. As an indirect measure of writing proficiency, the structured writing
score should have the highest correlations. In addition, the reading scores should have
higher correlations than the listening scores. This is supported by the latest
developments in the broad ability theories of Carroll and Horn-Cattell (as cited in
McGrew, 1997), where reading and writing are classified together under a separate
reading/writing broad ability, whereas listening ability is included under the separate
crystallized intelligence ability.
4. Compare essay score correlations with essay length. Essay length is not a particularly
valid indicator of writing proficiency, but it is highly correlated with essay scores and
highly reliable. Are automated essay scores more correlated with essay length than
human essay scores? What is the correlation between essay length and the structured
writing score, a nonproductive writing test?
The second line of analyses investigated the existence of possible biases between human
and e-rater scores with respect to differences in performance across countries of origin and
differences in difficulty across prompts. There is an intimate connection between native language
characteristics and English acquisition, and since TOEFL examinees come from all over the
world, it is important to validate that alternative scoring methods rank-order examinees from
different countries in the same way. Potential country-of-origin biases of automated scores
compared to human scores can be seen as indications of differences in measured constructs or
measurement limitations of AES.
8

Another important factor that could be associated with bias between the human and
automated scores is prompt difficulty. This is a special concern with e-rater as it was employed
in this study, because only one scoring model was applied to all prompts.
The third line of inquiry constituted a factor analysis that was conducted on the e-rater
features to investigate the interpretability of their internal structure and to determine which of the
two e-rater scores reflects this structure more closely. Factor analysis methods constitute an
important construct validation instrument, because they allow us to see whether the empirically
identified factors correspond to theoretical distinctions about the construct. This kind of
validation has not been performed previously in the context of AES, for reasons discussed above.
The factor analysis also could shed light on the correspondence of feature weighting schemes to
the internal structure of the features.
Data Preparation
Almost 287,000 records of examinees who were tested in the first 8 months of 2005 were
examined to find repeaters. These records did not include examinees whose country of origin
was either unknown or the United States. Repeaters were identified by matching records with the
same name (first, middle, and last name), date of birth, country of origin, and first language. This
method is likely to identify some false positives, different students with the same name and date
of birth; however, there was no better way to identify repeaters. Of all records, 30% were
associated with repeater examinees (at least two tests). The average total scaled score for
repeater records was lower than for nonrepeaters, 206 (SD = 42) compared to 222 (SD = 46).
The goal in selecting repeater examinees for this study was to maximize the range of
countries of origin that would be analyzed. Towards this goal, a random sample of 250 repeaters
was selected from countries with at least 250 repeaters, and all repeaters were selected from
countries with 45–250 repeaters. For each repeater the first two tests were analyzed. This
resulted in a sample of two tests for each of 5,006 examinees from 31 countries. The average
number of days between the two test dates was 62 (SD = 42).
Two e-rater scores were computed for this study. The first score was based on optimal
weights derived from a regression analysis of the eight e-rater features on the human essay
score, labeled eHMN. The second was based on equal weights and labeled eEQL. The two scores
were based on a single program-level scoring model. These two models were developed by
9

randomly dividing the sample from each country into two sets, developing the model on each set
and cross-validating the models on the other set.
In the case of eHMN, modeling consisted of finding optimal weights based on multiple
regression of the e-rater features on the first human rating and then scaling the machine scores to
have the same mean and SD as the human scores. In the case of eEQL, modeling consisted of
standardizing the e-rater features in order to combine them using equal weights, and then scaling
the machine scores to have the same mean and SD as the human scores. This means that the only
information from the training essays that was used in developing eEQL was the overall mean and
SD of human scores. Table 1 shows the weights (expressed in percentages out of the total
weights) for the eHMN scores. The weights for eEQL were 12.5% for each feature. Table 1
shows that the organization and development scores were heavily weighted in eHMN, with about
6% weight for the other features.
Table 1
Relative Weights for the eHMN e-rater Score
Feature Weight
Grammar 6%
Usage 5%
Mechanics 8%
Style 5%
Organization 34%
Development 29%
Vocabulary 6%
Word length 6%
Note. Shown are averages across the two cross-validation sets.
The pairs of values differed by a maximum of 1%.
Note that no information about the specific prompt to which essays were written was
included in modeling. Overall, the 10,024 essays in this sample were written to more than 80
different prompts.
10

Results
The three types of analyses that were performed are presented separately. The first was
based on the intercorrelations between all measures across the different tests the examinees
completed. The second examined group differences in human and e-rater scores with respect to
different countries of origin and different prompts. The third examined the internal structure of
the e-rater features.
Correlational Analysis
Table 2 shows descriptive statistics for the different measures that were analyzed. Shown
are the two e-rater scores; the first, second, and average human scores; the three TOEFL
subscores; and essay length. Note that there were very small differences between the mean and
SD of the cross-validated e-rater scores and the single human rater scores.
Table 2
Descriptive Statistics for Different Measures
First test Second test
Measure M SD M SD
eHMN 3.75 0.92 3.95 0.87
eEQL 3.76 0.90 3.93 0.88
First human 3.74 0.88 3.96 0.90
Second human 3.72 0.87 3.95 0.90
Average human 3.73 0.81 3.96 0.83
Listening 18.89 5.07 20.29 4.92
Reading 19.62 4.27 20.57 4.33
Structured writing 19.22 4.62 20.61 4.53
Essay length 235.30 78.57 255.12 80.30
The reliabilities and intercorrelations between these different measures were computed
based on the alternate forms the students completed. For any two measures, two correlations
were computed across the different forms: the correlation between measure A on the first test
and measure B on the second test, and the correlation between measure A on the second test and
measure B on the first test. The averages of these two correlations are presented below the
11

diagonal in Table 3. The alternate-form reliabilities of each measure are based on the correlation
between the scores in the two forms and are shown on the diagonal of Table 3 (except for single
human raters, which are averaged across the two raters). Finally, the estimates of true-score
correlations are shown above the diagonal of Table 3 and are based on dividing the raw
correlations by the square root of the product of the measure reliabilities.
Table 3
Intercorrelations, Reliabilities, and True-Score Correlations
Score eHMN eEQL H SW R L EL
eHMN .71 .93 .97 .85 .52 .57 .86
eEQL .66 .70 .91 .91 .66 .60 .66
Humana (H) .60/.65 .56/.61 .54/.63 .89 .55 .65 .85
Structured writing
(SW) .64 .67 .58/.63 .78 .78 .71 .62
Reading (R) .39 .50 .36/.39 .62 .81 .66 .24
Listening (L) .43 .45 .43/.46 .57 .53 .81 .40
Essay length (EL) .61 .47 .53/.57 .46 .19 .30 .72
Note. True-score correlations above the diagonal, which is in bold. a The two human reliabilities refer to one rater and the average of two ratings.
The discussion below of the findings in Table 3 focuses on reliabilities of the different
scores, a comparison of the human and eHMN scores, and a comparison of eEQL and eHMN
scores. An inspection of the reliabilities in the table shows that the two e-rater reliabilities (.70-
.71) were significantly higher than the single human score reliability (.54) and even the double-
score reliability (.63, z = 5.95, p < .001). These results replicated even more strongly the findings
of Attali and Burstein (2006), who found in a K–12 sample of essays alternate-form reliabilities
of about .50, .60, and .60 for single human, double-human, and e-rater scoring, respectively. The
reason for these stronger results may be that the K–12 results were based on low-stakes and
nonstandardized conditions.
It is interesting that the two e-rater reliabilities were essentially the same. This means
that the nonoptimal weights, with respect to predicting human scores, did not have an effect on
12

the reliability of scores. Presumably, in the traditional narrow investigation of single-essay
agreement levels with human scores, eEQL scores would show lower agreement than eHMN.
However, in the larger perspective of alternate-form investigation, the reliability advantages of
eHMN disappeared. Finally, the reliability of essay length was even slightly higher than the e-
rater reliability, and the reliabilities of the three TOEFL subscores were around .8.
The comparison of the human and eHMN scores showed first that the true-score
correlation between them was very close to unity (.97). This again replicated exactly the results
of Attali and Burstein (2006). However, although the raw correlation of the human and eHMN
scores with the TOEFL scores were very close, because of the higher reliability of eHMN, its
true-score correlations with the TOEFL scores were somewhat lower.
A striking finding in Table 3 is the high true-score correlation between the human scores
and essay length (.85). The same correlation for eHMN replicated it almost exactly (.86). This
finding is significant because previous literature on AES often assumed that the high correlation
between AES scores and essay length is due to the specific features that are used for automated
scoring and not because human ratings are highly correlated with essay length.
At least with e-rater, and in light of the findings in Table 3, this assumption seems
questionable. This is because the true-score correlation of eEQL with essay length is 20 points
lower (.66) than the human or human-like e-rater scores. Moreover, the true-score correlation of
the structured writing scores with essay length was only slightly lower than for eEQL (.62). This
structured writing correlation can be regarded as a lower bound for correlations between
automated essay writing scores and essay length, because the structured writing scores are based
on multiple-choice questions and involve no actual writing. This means that the eEQL
correlation with essay length is about as low as it can get.
The difference in correlations of eHMN and eEQL with essay length also can be traced
back to the feature weights. The major difference between the two scores is the higher weight to
the two discourse features (organization and development). These features are more related to
essay length from both a statistical and substantial point of view.
Another interesting difference between eEQL and both eHMN and the human scores is
that eEQL shows an ordering of true-score correlations with the three TOEFL scores, whereby
structured writing > reading > listening instead of structured writing > listening > reading. The
structured writing test, as an indirect writing test, should be related more to direct writing scores
13

than to reading scores. The reading > listening relation is supported by the latest developments in
the broad ability theories of Carroll and Horn-Cattell (as cited in McGrew, 1997), where reading
and writing are classified together under a separate reading/writing broad ability, whereas
listening ability is included under the separate crystallized intelligence ability.
Group Differences
The purpose of these analyses was to determine to what extent the variability in average
human scores between students’ country of origin (and by extension, the country’s region) could
be explained by the average e-rater scores in these countries (and regions). In the event that e-
rater scores could not explain these differences, their validity as alternative essay scores would
be questioned, because that would suggest that human raters are sensitive to some characteristics
of writing unique to students from particular countries or regions in a way that is not captured in
e-rater processing of these essays. In a similar way, the ability of e-rater scores to explain
differences in average prompt difficulty (as measured by human scores) also was investigated.
These questions could be answered in the context of hierarchical linear models, because
essays are nested within countries (or prompts), and countries are nested within regions. We
started with a fully unconditional model of the outcome (the human essay score), where no
predictors were specified at any level. The purpose of this model was to estimate how variation
in the human scores was allocated across the three different levels (essay, country, and region).
Variance decomposition from this model is presented in the second column of Table 4. It
shows that human essay scores did differ somewhat across countries. The percentage of total
variance in human scores at the country level was 9.5%. On the other hand, there was almost no
variation between regions, and the effect was not significant.
Table 4
Variance Components and Decomposition of Random Effects for Country and Region
Random effect
3 levels
unconditional
2 levels
unconditional
Level-2 eHMN
covariate
Level-2 eEQL
covariate
Region (Level 3) 0.0031 (0.4%) - - -
Country (Level 2) 0.0758 (9.5%) 0.0780 (9.8%) 0.0036 (0.5%) 0.0098 (1.3%)
Essay (Level 1) 0.7219 0.7219 0.7218 0.7218
14

Because the region effect was not significant, the three-level unconditional model was
replaced with a simpler two-level model. Variance decomposition from this model is presented
in the third column of Table 4 and is very similar to the three-level model. The percentage of
total variance in human scores at the country level was 9.8%.
The unconditional model provided a baseline against which we could evaluate the effect
of including the average e-rater score (eHMN and eEQL) for each country as a Level 2
covariate. Conditional variance decompositions from these models are presented in the last two
columns of Table 4. The country-level variance component shrank considerably in both cases.
This means that the average e-rater scores explained most of the variation between countries in
human scores. Only about 1% of total conditional variance (.5% for eHMN and 1.3% for eEQL)
was left at the country level. We measured how much was explained by this covariate by
measuring the amount of reduction in country-level variation as (.0780 - .0036)/.0780, or 95%,
for eHMN, and (.0780 - .0098)/.0780, or 87%, for eEQL. That is, average e-rater scores
explained almost all variation in human scores between countries.
The results of a similar analysis for the prompt effect are presented in Table 5. They first
showed that almost no variation in human scores existed between prompts. Although the prompt
variance component in the unconditional model was significant, only .5% of the variance was
attributed to the prompt level. In conditioning on average e-rater scores, this variance component
became nonsignificant for both e-rater scores, but in this case average eEQL scores reduced
much less of the prompt variance than eHMN scores. The percentage of reduction in variance for
eHMN and eEQL was 89% and 31%, respectively.
Table 5
Variance Components and Decomposition of Random Effects for Prompt
Random effect Unconditional
eHMN
covariate eEQL covariate
Prompt (Level 2) 0.0044 (0.5%) 0.0005 (0.06%) 0.0030 (0.4%)
Essay (Level 1) 0.8016 0.8014 0.8016
15
Factor Analysis
The two e-rater scores that were used in this paper differ in their weighting scheme
primarily in the higher weights that are attached to the organization and development features
under the eHMN score. There was very little difference in reliabilities of the two scores; they
functioned in a similar way in terms of replicating average human scores in different countries
and prompts; and eEQL, with lower weights for the organization and development features, had
a much lower correlation with essay length. This could be seen as an advantage to eEQL from a
validity point of view.
The purpose of this analysis was to offer another kind of evidence on the appropriateness
of weighting schemes by analyzing the internal structure of the different features. To do that, a
factor analysis was conducted to discover which features in the set form coherent subsets that are
relatively independent of one another. The structure of these subsets (or factors) might suggest
which weighting scheme was supported by the data.
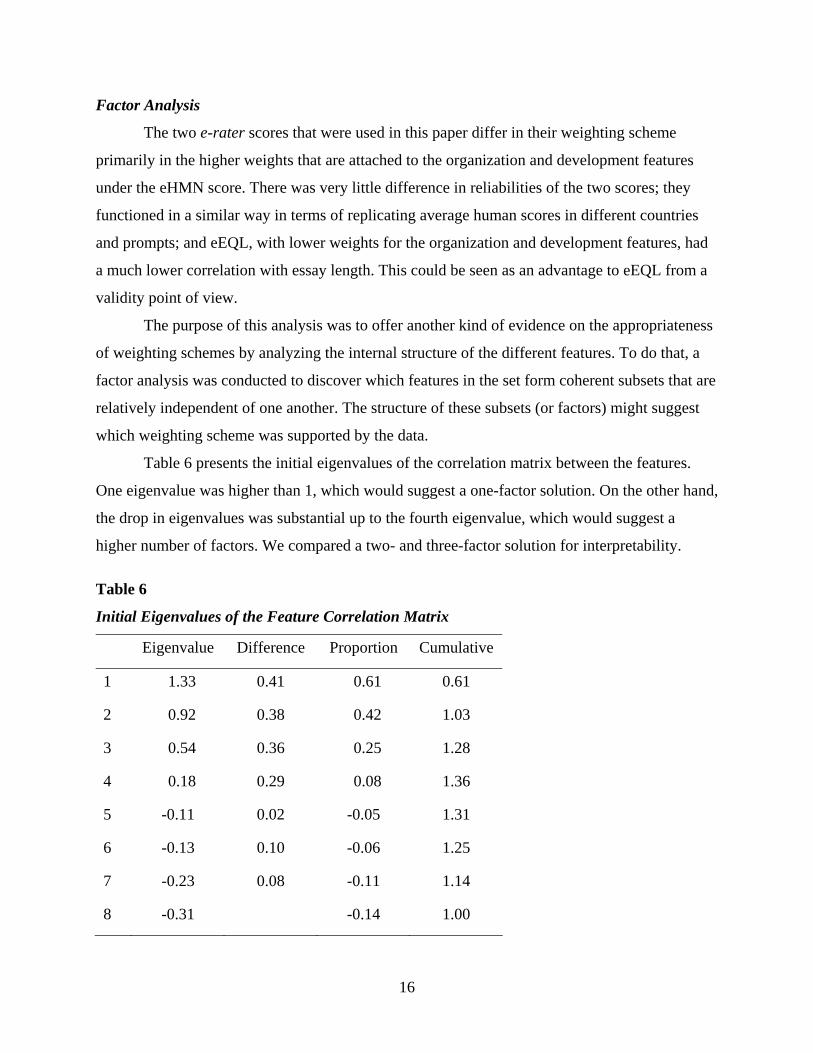
Table 6 presents the initial eigenvalues of the correlation matrix between the features.
One eigenvalue was higher than 1, which would suggest a one-factor solution. On the other hand,
the drop in eigenvalues was substantial up to the fourth eigenvalue, which would suggest a
higher number of factors. We compared a two- and three-factor solution for interpretability.
Table 6
Initial Eigenvalues of the Feature Correlation Matrix
Eigenvalue Difference Proportion Cumulative
1 1.33 0.41 0.61 0.61
2 0.92 0.38 0.42 1.03
3 0.54 0.36 0.25 1.28
4 0.18 0.29 0.08 1.36
5 -0.11 0.02 -0.05 1.31
6 -0.13 0.10 -0.06 1.25
7 -0.23 0.08 -0.11 1.14
8 -0.31 -0.14 1.00
16

It should be noted that in both solutions the communality of the development feature
exceeded 1. On the other hand, its communality under a one-factor solution was close to 0. This
problem was handled by setting the communality of the development feature to 1 (Heywood
option in SAS Factor).
Table 7 presents the oblique-rotated (Promax) factor pattern for the eight features for the
two solutions, together with the final communality estimates. The features are grouped by their
highest loadings on the different factors. Table 7 shows that the three-factors solution readily can
be interpreted as a discourse factor, a grammar factor, and a word usage factor, respectively.
Table 7 also shows that, for the three-factor solution, all features had quite low loadings on the
two factors on which they do not highly load. Moreover, the two-factor solution can be seen as a
reduced version of the three-factor solution, where the grammar and word use factors are merged
(similarly, the four-factor solution separated the word length feature from the word use factor
and into a separate factor, but apart from this left the structure intact).
Table 7
Factor Pattern After Promax Rotation and Final Communality Estimates for Two Solutions
3-factor solution 2-factor solution
Feature Factor 1 Factor 2 Factor 3
Final
comm. Factor 1 Factor 2
Final
comm.
Development 1.00 0.10 0.08 1.02 0.98 0.21 1.02
Organization -0.56 0.23 0.23 0.45 -0.62 0.38 0.50
Vocabulary -0.01 0.93 -0.03 0.84 -0.09 0.63 0.39
Word length -0.17 0.42 -0.15 0.19 -0.19 0.25 0.09
Style 0.12 0.37 0.11 0.19 0.07 0.46 0.22
Mechanics -0.08 -0.05 0.55 0.29 -0.10 0.32 0.11
Grammar -0.04 0.10 0.53 0.32 -0.08 0.47 0.22
Usage 0.05 -0.11 0.51 0.24 0.02 0.27 0.07
17

Nonetheless, a problem for the discourse factor is that the factor loading of the organization
feature on this factor was negative, although the e-rater weights for all features were positive. This
problem, in addition to the higher than 1 communality of the development feature, suggests
measurement problems with these two features that should be resolved in the future.
Finally, except for the style feature, the final communalities of all the grammar and word
use features were higher in the three-factor solution. These results suggest that the three-factor
solution should be preferred over the two-factor solution.
It is interesting that the correlations between the factors were low. Factor 1 was correlated
.01 and -.02 with Factors 2 and 3, respectively; and Factors 2 and 3 were correlated -.34.
The importance of each factor could be assessed by the proportion of variance it
explained. The amount of variance explained by Factors 1–3 after eliminating the other factors
(that is, based on the semipartial correlations of the features with the factors) was 1.37, 1.11, and
0.83, respectively. This translated into 41%, 34%, and 25% of the variance explained by the
three factors. This pattern of percentages could be interpreted as a compromise solution between
the eEQL and optimal-weights solutions used in this study. The amount of variance explained by
the discourse factor (41%) was higher than 33%; however, it was not as extreme as the combined
weights of the development and organization features in eHMN (63%).
An estimate of the internal consistency of the factor solution was obtained from the
squared multiple correlations of factor scores predicted from the observed feature scores. The
three squared multiple correlations in this solution were equal to 1.02, .86, and .60 for the three
factors, which means that the observed variables accounted for substantial variance in the factor
scores.
The factor analysis results suggest that a meaningful hierarchical structure underlies the
essay data. The three levels of linguistic analysis—word use, grammar, and discourse—are
approximately equal in importance, and each of the three levels of linguistic analysis is
adequately represented in the e-rater features.
Discussion
The goal of this study was to provide evidence about the construct validity of one
particular AES system, e-rater V.2, in the context of a large-scale assessment, the computer-
based TOEFL test. The correlational results show that the e-rater score designed to predict
18

human scores (eHMN) measures essentially the same construct as human-based essay scores
with significantly higher reliability and consequently higher correlations with related language
scores. The equal-weights e-rater score (eEQL) showed the same high reliability but
significantly lower correlation with essay length. The group-differences results show that both e-
rater scores also successfully replicate human score differences between countries of origin and
between prompts.
Finally, results also suggest that the eight e-rater features are naturally clustered in three
factors that are approximately equal in importance: (a) word use (the vocabulary, word length,
and style features), (b) grammar (the grammar, usage, and mechanics features), and (c) discourse
(the organization and development features). This suggests a hierarchical structure from a
linguistic perspective.
These results suggest three specific advantages for the use of eEQL over eHMN. The first
is a lower correlation with essay length, which is seen as a nonvalid indicator of essay quality.
The second is a better theoretically supported rank order of correlations with the reading and
listening scores. The third advantage is a better alignment with the natural internal structure of
the data.
From a measurement perspective, and in light of the factor analysis results, the difference
between eEQL and eHMN (as well as the human scores) seems to be that eEQL places a lower
weight on the discourse component. It is not clear which solution is preferable from a theoretical
perspective, but recognizing these differences to design the scoring according to such theoretical
considerations opens new possibilities in essay assessment. It should be noted that one possible
disadvantage of the use of eEQL together with human raters is a lower true-score correlation
between human and automated scores (.91 vs. .97 for eHMN).
Another implication of the results concerns the place of content in human and automated
essay assessment. There is a strong intuition among writing teachers that the content of the essay
is an important factor in its assessment (Ben-Simon & Bennett, 2006). This intuition is reflected
in the design of some AES systems (Landauer et al., 1998) and may guide some of the negative
opinions about AES, because the computer analysis cannot really understand what is said in the
essay. However, the results of this study present a different picture. First, an automated score that
is based solely on the form and structure of the essay has a true-score correlation of .97 with the
human scores. Second, the percent of variance in (human) essay scores that can be attributed to
19

differences in prompt difficulty is very small (0.5%). This suggests that factors that may cause
such differences in prompt difficulty, like the difficulty of the prompt itself, are not important.
In this study, several unusual decisions were made in the design of automated scores. The
use of a single scoring model across prompts has many advantages from a measurement
perspective, but the practical implications are also significant, since the automated scores can be
computed on new prompts without any need for training. Another decision concerns the use of
continuous automated scores instead of the usual rounded scores. This obviously is advantageous
from a measurement perspective and fits more closely the goals of a large-scale assessment to
produce continuous scale scores and combine them. It also reflects the shift in perspective about
automated scoring in this study, from a score dependent on human scores to an independent
score alongside the human scores.
This shift in perspective is most evident in the development of the eEQL score. The
implications of the use of eEQL were discussed throughout the paper, but it should be noted
again that this score was developed without any statistical optimization techniques. The only
information that was used in its computation was the distributions of the features in TOEFL
essays, and for scaling, the mean and SD of human scores. Nonetheless, this score exhibited
psychometric properties that were at least as good as the eHMN score.
20

References
Attali, Y., & Burstein, J. (2006). Automated essay scoring with e-rater V.2. Journal of
Technology, Learning, and Assessment, 4(3). Available from http://www.jtla.org
Attali, Y. (2006, April). On-the-fly automated essay scoring. Paper presented at the annual
meeting of the National Counsel on Measurement in Education, San Francisco.
Bennett, R. E., & Bejar, I. I. (1998).Validity and automated scoring: It’s not only the scoring.
Educational Measurement: Issues and Practice, 17(4), 9–17.
Ben-Simon, A., & Bennett, R. E. (2006, April). Toward theoretically meaningful automated
essay scoring. Paper presented at the annual meeting of the National Council of
Measurement in Education, San Francisco.
Breland, H. M., Bonner, M. W., & Kubota, M. Y. (1995). Factors in performance in brief,
impromptu essay examinations (College Board Rep. No. 95-04). New York: College
Entrance Examination Board.
Burstein, J. C., Kukich, K., Wolff, S., Lu, C., & Chodorow, M. (1998, April). Computer analysis
of essays. Paper presented at the annual meeting of the National Council of Measurement
in Education, San Diego, CA.
Chodorow, M., & Burstein, J. (2004). Beyond essay length: Evaluating e-rater's performance on
TOEFL essays (TOEFL Research Rep. No. RR-73). Princeton, NJ: ETS.
Elliot, S. M. (2001, April). IntelliMetric: From here to validity. Paper presented at the annual
meeting of the American Educational Research Association, Seattle, WA.
Embretson, S. E. (1983). Construct validity: Construct representation versus nomothetic span.
Psychological Bulletin, 93, 179–197.
Landauer, T. K., Foltz, P. W., & Laham, D. (1998). Introduction to latent semantic analysis.
Discourse Processes, 25, 259–284.
Landauer, T. K., Laham, D., & Foltz, P. W. (2001, February). The intelligent essay assessor:
Putting knowledge to the test. Paper presented at conference of the Association of Test
Publishers Computer-Based Testing: Emerging Technologies and Opportunities for
Diverse Applications, Tucson, AZ.
McGrew, K. S. (1997). Analysis of the major intelligence batteries according to a proposed
comprehensive Gf-Gc framework. In D. P. Flanagan, J. L. Genshaft, & P. L. Harrison
21

(Eds.), Contemporary intellectual assessment: Theories, tests, and issues (pp. 151–179).
New York: Guilford.
Messick, S. (1989). Validity. In R.L. Linn (Ed.), Educational measurement (3rd ed., pp. 13–
103). New York: Macmillan.
Page, E. B. (1966). The imminence of grading essays by computer. Phi Delta Kappan, 48, 238–
243.
Page, E. B. (1994). Computer grading of student prose, using modern concepts and software.
Journal of Experimental Education, 62, 127–142.
Page, E. B., & Petersen, N. S. (1995). The computer moves into essay grading: Updating the
ancient test. Phi Delta Kappan, 76, 561–565.
Petersen, N. S. (1997, March). Automated scoring of writing essays: Can such scores be valid?
Paper presented at the annual meeting of the National Council of Measurement in
Education, Chicago.
Powers, D. E. (2005). “Wordiness”: A selective review of its influence, and suggestions for
investigating its relevance in tests requiring extended written responses (ETS Research
Memorandum No. RM-04-08). Princeton, NJ: ETS.
Powers, D. E., Burstein, J. C., Chodorow, M., Fowles, M. E., & Kukich, K. (2002a). Comparing
the validity of automated and human scoring of essays. Journal of Educational
Computing Research, 26, 407–425.
Powers, D. E., Burstein, J. C., Chodorow, M., Fowles, M. E., & Kukich, K. (2002b). Stumping e-
rater: Challenging the validity of automated essay scoring. Computers in Human
Behavior, 18, 103–134.
Scott, J. (1999, January 31). Looking for the tidy mind, alas. The New York Times.
Shermis, M. D., & Burstein, J. (2003). Automated essay scoring: A cross-disciplinary
perspective. Mahwah, NJ: Lawrence Erlbaum Associates.
Wainer, H. (1976). Estimating coefficients in linear models: It don’t make no nevermind.
Psychological Bulletin, 83, 213–217.
Yang, Y., Buckendahl, C. W., Jusziewicz, P. J., & Bhola, D. S. (2002). A review of strategies for
validating computer-automated scoring. Applied Measurement in Education, 15, 391–
412.
22