constitutions and economic development: evidence from the ...anon-ftp.iza.org/dp6754.pdf ·...
TRANSCRIPT
DI
SC
US
SI
ON
P
AP
ER
S
ER
IE
S
Forschungsinstitut zur Zukunft der ArbeitInstitute for the Study of Labor
Constitutions and Economic Development:Evidence from the American Indian Nations
IZA DP No. 6754
July 2012
Randall AkeeMiriam JorgensenUwe Sunde
Constitutions and Economic Development: Evidence from the American Indian Nations
Randall Akee Tufts University
and IZA
Miriam Jorgensen University of Arizona
Uwe Sunde
University of St. Gallen, SEW-HSG, IZA and CEPR
Discussion Paper No. 6754 July 2012
IZA
P.O. Box 7240 53072 Bonn
Germany
Phone: +49-228-3894-0 Fax: +49-228-3894-180
E-mail: [email protected]
Any opinions expressed here are those of the author(s) and not those of IZA. Research published in this series may include views on policy, but the institute itself takes no institutional policy positions. The Institute for the Study of Labor (IZA) in Bonn is a local and virtual international research center and a place of communication between science, politics and business. IZA is an independent nonprofit organization supported by Deutsche Post Foundation. The center is associated with the University of Bonn and offers a stimulating research environment through its international network, workshops and conferences, data service, project support, research visits and doctoral program. IZA engages in (i) original and internationally competitive research in all fields of labor economics, (ii) development of policy concepts, and (iii) dissemination of research results and concepts to the interested public. IZA Discussion Papers often represent preliminary work and are circulated to encourage discussion. Citation of such a paper should account for its provisional character. A revised version may be available directly from the author.

IZA Discussion Paper No. 6754 July 2012
ABSTRACT
Constitutions and Economic Development: Evidence from the American Indian Nations*
This paper presents an empirical examination of economic and institutional development. Utilizing a novel data set on American Indian tribal nations, we investigate how constitutional design affects economic development, while holding the broader legal and political environment fixed. Instrumental variables regressions, using the party of the US President at the time of the initial adoption of tribal constitutions as an instrument for constitutional design, indicate that parliamentary systems (versus presidential) have a strong positive effect on economic development, while ordinary least squares regressions of current economic outcomes on parliamentary systems of government show no effects. Robustness checks suggest that the results are not explained by differences in other institutions or geographic characteristics. Additional results provide some suggestive evidence that the effects may operate through channels that are typically associated with parliamentary systems, such as larger public employment, and more equitable income distribution. JEL Classification: D72, N12, O11, O43, P16 Keywords: economic development, constitutional design, political economy Corresponding author: Randall Akee Tufts University Department of Economics 8 Upper Campus Road, Braker 114B Medford, MA 02155 USA E-mail: [email protected]
* We acknowledge Tufts University Faculty Research Awards Committee Funding (October 2009) which provided funding for data collection on this project and the Center for Labor Economics, UC Berkeley. We would like to thank Mevlude Akbulut-Yuksel, Jenny Aker, Ernesto Dal Bo, Lukas Buchheim, Carl-Johan Dalgaard, Rajeev Dehejia, Bruce Duthu, Lakshmi Iyer, Joseph Kalt, Peter Kuhn, Emilia Simeonova, James Snyder, Enrico Spolaore, Rudi Stracke, Lowell Taylor, Thomas Vischer, Romain Wacziarg, Mutlu Yuksel, Jeffrey Zabel and Larissa Zierow for helpful comments and discussions as well as seminar participants at the University of Southern California, UC Santa Cruz, the College of Willilam and Mary, Lewis and Clark Law School and PERC Workshop, University of Hawaii, and the Center for Global Development. We would like to thank Rezwan Khan, Jarrod Smith, Mark Adams, Jaehee Choi and Conor Carney for excellent research assistance. Additionally, David Selden and James Bryant at the National Indian Law Library were incredibly helpful in providing access to materials invaluable for this research. Any errors, omissions or oversights are our own.
1 Introduction
The importance of political institutions for economic development is one of the most intensely researched
areas in economics and political science of the recent years. A particularly intense debate concerns the causal
effect of constitutional design on economic performance. Are the features of constitutions, such as the form
of state, a relevant determinant of economic development? And how severe is reverse causality from economic
development to the design of constitutions?
This paper contributes to this literature by providing novel evidence for the effects of particular aspects of
constitutional design, namely the form of state in terms of the accountability of the executive to the electorate,
on economic performance. By isolating the causal effects of constitutions on economic performance, we also
provide indirect evidence for the reverse channel of causality in terms of endogenous adoption of particular
constitutions. The analysis is based on a newly assembled data set of American Indian tribal constitutions
for 70 American Indian tribes with democratic governments and written constitutions. We have coded the
information contained in these documents such as whether the executive is directly elected or indirectly elected
as well as the year of the adoption of the first modern constitution and the years in which amendments occurred.
All of these documents span the entirety of the 20th century. We merge this data with information on economic
development indicators for the American Indian tribes in 1900, 1990, and 2005-2009 from the US Census and
investigate the effect of political institutions on economic performance.
The structure of the data resembles the typical structure of the empirical work on the long-run effects of
institutions, but has important additional features. First, since American Indian Nations are subject to the
same broader institutional framework of the United States, the data provide the unique possibility of holding
the broader legal and political environment fixed. This alleviates many of the issues that affect the cross-country
panel data common in this literature. Second, while the broader legal and political environments are held
constant within the US federal framework, these American Indian Nations exhibit substantial heterogeneity
in constitutional features. Third, the data contain an element of exogenous variation that can be exploited
for identification purposes since, for some tribes, the choice of the constitutional details was heavily influenced
by the US Federal government. These constitutional details were determined without regard to the economic
conditions in the particular tribes at the time of constitutional adoption. We propose the use of the party
of the US President at the time of adoption of the American Indian constitution as a plausible instrumental
variable. This instrument is unrelated to future economic outcomes but is directly related to the types of
political institutions initially adopted; the executive branch of the US Federal government historically had
a large amount of influence over American Indian constitutions. In later sections of this paper, we describe
at length the rationale for this instrument and discuss why the instrument plausibly satisfies the exclusion
restriction. We are thus able to replicate the typical identification strategy in the literature, and estimate
the effects of constitutional design (and political institutions) on economic performance of American Indian
2
Nations in modern times.
Our results suggest that there is indeed a bi-directional causal relationship between constitutional details
and economic performance when comparing the results from OLS regressions and from IV estimates that exploit
exogenous variation in constitutional details. In OLS regressions, we find no effects of political institutions
on economic development between 1990 and 2005-2009. These results are likely to be subject to endogeneity
bias, however. Results from instrumental variables estimations indicate that political institutions do affect
economic growth. In particular, tribes with indirectly elected chief executives (i.e., a parliamentary form of
government) have significantly faster growth in per capita incomes, labor force participation rates, and college
education, as well as significantly lower unemployment growth over the 1990 to 2005-2009 period.
Additional results demonstrate the robustness of our findings and provide evidence for the channels through
which the effects work. The results are robust to additional controls for economic development such as the
year of the adoption of the initial constitution, the distance to the nearest city, and regional controls. We
also find that the existence of other political institutions, such as having an independent judiciary, staggered
elections, or the size of the tribal council do not affect our results. Finally, accounting for the presence of
casino operations on the tribal reservations does not reduce the size of the coefficient on an indirectly elected
chief executive. Placebo estimates suggest that the results are not driven by a non-random selection of tribes
as tribes do not differ in observable characteristics prior to the adoption of the first constitution.
The form of state is a central constitutional feature that affects economic development through several
channels. Parliamentary systems are likely to exhibit larger government expenditures, more employment in
the public sector, as well as higher degrees of redistribution, but also a larger potential for nepotism, inefficient
use of public resources, and corruption (see, e.g., Persson, Roland and Tabellini, 1997, or Alt and Lassen,
2007). As potential channels for the effect of constitutional design, we investigate the role of governmental
employment and redistribution. In line with the predictions from the political economy literature, we find
evidence that tribes with a parliamentary form of government exhibit larger states in terms of employment
in the public sector. We also find evidence for a reduction in poverty in addition to the effect on mean
incomes, consistent with the prediction of more redistribution and equality in parliamentary systems. These
results suggest that the observed economic improvements are driven by increased government employment and
business opportunities for tribal governments with initial parliamentary institutions.
Our paper contributes to the literature on the effects of political institutions for public policies and eco-
nomic development. Persson and Tabellini (2003, 2004) estimated the effect of different forms of state and
electoral rules on central government expenditures, redistribution, and debt using cross-country panel data
and find lower levels of central government expenditures and redistribution in presidential systems. While
these findings have been criticized with regards to the potential endogeneity of constitutions to economic per-
formance (Acemoglu 2005), Persson and Tabellini (2006) found evidence for the form of government affecting
the economic performance of newly democratized countries using panel regressions. More recently, Coate and
3
Knight (2011) investigate the effect of government form on public spending at the community level and find
evidence that public spending is lower in governments with directly elected executive (mayor-council form of
government) than under indirectly elected (council-manager) governments. Their theoretical results also sug-
gest, however, that depending on the preferences distribution either system can be preferable to the electorate.
Rather than looking at fiscal policy outcomes as these works, our study focuses on development outcomes.
More importantly, our data allows us to rule out potential endogeneity and estimate the causal effect of con-
stitutional design on development by applying an identification strategy based on the random assignment of
constitutional design through the influence of the US Federal government.
Our investigation complements earlier studies on the effects of institutions on development, including
studies by Acemoglu, Johnson, and Robinson (2001), Iyer (2011), or Acemoglu et al. (2012). In contrast to
these studies, we observe the institutions at their initial adoption as well as contemporaneously. This study
also contributes to another important strand of the literature that focuses on the determinants of political
institutions, and the persistence of institutions over time, pioneered by Acemoglu and Robinson (2000, 2001,
2006). This literature suggests that political institutions are shaped by self-interests of different groups of
society as well as by constraints on the possibility of political rulers to commit to certain policies. Institutions
emerge endogenously and do not necessarily reflect the institutional design that would lead to efficient economic
outcomes, but rather reflect distributional conflicts and inequality in de facto political power. The case of
American Indian Nations provides a suitable laboratory to study the effects of institutions on development
because of the availability of exogenous influences that shape the initial constitutional design and that can be
exploited to shed new light on the causal role of institutions for development, as well as on potential endogeneity
in constitutional design. Our paper also adds to the growing literature on the effect of political institutions
on economic development and the provision of public goods in developing countries. There is evidence that
increases in electoral accountability significantly reduces politician corruption. In Brazil, Ferraz and Finan
(2008, 2009) find that electoral rules which increase accountability (the possibility of re-election) results in
reduced corrupt behavior. They also find that voters respond to evidence (published audit reports of mayoral
budgets) about politician behavior and punish more corrupt incumbents at election time. Finally, our paper
also adds to a small, but important, literature on the effect of contemporaneous constitutional characteristics
on economic development for American Indians. We contribute to the literature pioneered by Cornell and Kalt
(1995a, 1995b, 2000) by adding information of the initial types of constitutions adopted and their implications
for subsequent development.
The remainder of the paper proceeds as follows. The next section provides some background information
on American Indian Tribal nations and discusses the data and sample construction. Section 3 presents the
empirical strategy, and Section 4 presents the main empirical results, the results from robustness checks, and
additional results regarding the channel through which the effect operates. Section 5 concludes.
4
2 Data on Constitutions of American Indian Nations
2.1 Historical Background
American Indian Nations are a third form of government recognized in the US Constitution along with the US
Federal and State governments (Duthu, 2008). Indeed, the US Constitution treated many of the American In-
dian Nations as foreign nations at least at the time of the establishment of the United States. Over the past two
centuries, the US Supreme Court has ruled that American Indian nations are a separate form of government
from that of US states, but they have been put under the US federal government’s authority and are now classi-
fied as “domestic dependent nations” (Wilkins, 2002). Today there are over 560 federally recognized American
Indian tribal nations including Alaska Natives. These nations have a direct government-to-government rela-
tionship with the United States. There are numerous non-federally recognized tribal governments, but we do
not consider these tribal governments in our current analysis.
By 1871, the US unilaterally ceased making treaties with American Indian nations (Duthu, 2008). This
marks a turning point in the US relationship with American Indian tribes; the tribes were treated as domestic
entities and not the foreign, independent entities of the past. These changes were driven in part by the
settlement of much of the continental United States as well as the increased military power of the US. In 1887,
the General Allotment Act was created to privatize and develop American Indian lands. The purpose was to
transform the American Indians into farmers and small business owners with access to private property and
capital. Previously, the American Indian land had been held communally by the entire tribe and was inalienable
as well as tax-exempt given the sovereign status of American Indian tribes. The land privatization was a
complete failure and reduced the amount of land under American Indian control in 1887 from approximately
138 million acres to about 48 million acres in the early 20th century through coerced land sales, foreclosures
and delinquent tax payments (Newton et al, 2005). No corresponding improvement in economic or social
conditions for the American Indian land owners was visible; in fact, Hacker and Haines (2005) have shown
that child mortality increased significantly for households that received allotted lands. Additionally, the US
Supreme Court ruled in the 1903 court case Lone Wolf v. Hitchcock that the US Congress has plenary power
over American Indian lands (Duthu, 2008). While the US Constitution discusses American Indian tribes in two
places, neither grants Congress plenary power over the tribes (Deloria and Wilkins, 1999). This new Supreme
Court interpretation allowed Congress to unilaterally suspend any and all treaty promises without review or
redress by American Indian tribes.
American Indians are US citizens and may also be tribal citizens of federally or non-federally recognized
tribes (Wilkins, 2006). Federal income tax laws apply to individuals residing on the reservation, but the tribal
government itself may be exempt from state and other local jurisdictional laws and taxation (Wilkins, 2002;
p. 14). The American Indian nation itself has sovereign immunity and has the ability to establish its own
taxation and laws that are not expressly forbidden by the US Congress. This relationship between the US
5
government and American Indian tribal nations is based on historical treaties and political relationships during
the age of expansion and westward settlement in the US. Preceding the establishment of the US constitution,
several American Indian nations had clearly established constitutions and rules of governance, for example
the so-called Five Civilized Tribes (Deloria & Lytle, 1983). In this work, we examine the promulgation and
adoption of modern constitutions in American Indian nations after the age of US westward expansion and the
establishment of reservation based American Indian Nations at the beginning of the 20th century.
Overall the history of American Indians in the United States has been one of poverty and substantial
underdevelopment. Lands under American Indian control in the continental United States amounts to ap-
proximately fifty six million acres or about 4 percent of all US lands (Wilkins, 2002). Recently there has been
some improvement in economic conditions; real per capita income has increased by 33% between 1990 and
2000 for American Indians residing on reservations. Additionally, family poverty rates have fallen about 10
percentage points between 1990 and 2000 (48% to 37% for tribes without casino operations and 36% to 27%
for tribes with casino operations), see Kalt and Taylor (2005). Our research aims to investigate the political
determinants of these improvements in economic outcomes.
2.2 American Indian Constitutions
The history of American Indian constitutional change provides a very interesting case for studying the impact
of political institutions on economic development. The composition and nature of the initial constitutions
adopted by most American Indian tribes was not necessarily of their own doing. The Bureau of Indian Affairs
played a very important role in the design of many of these tribal constitutions. Templates of the important
clauses and sections of constitutions were distributed to tribes via the Bureau of Indian Affairs (Wilkins, 2006;
Cohen, 2006). The starting point of most American Indian tribal constitutions was not from pre-existing
governance systems, but a US-inspired version. These imposed, and to the American Indian nations somewhat
foreign, political institutions did not necessarily reflect traditional or moral tribal values and led to high
levels of political turmoil and corruption in tribal government activities (Cornell and Kalt, 2000). Due to the
perceived illegitimacy of some of these government types, tribal governments have faced a range of problems
such as political instability, government closure and attacks on government officials (Lemont, 2006; p 3). While
a few American Indian tribes had constitutions in the 1800’s, many of these tribes were forcefully relocated
by the US Federal government and resulted in a disruption of these pre-existing governments (Wilkins, 2002).
Consequently, new constitutions were adopted in the early 20th century to reflect the new geographic, political
and economic conditions for these American Indian tribal nations. Several changes occurred at the end of the
19th and beginning of the 20th centuries with regard to the US Federal government’s relationship and dealings
with American Indian tribes. After the conclusion of the US Civil War, the US Federal government moved the
Bureau of Indian Affairs from the War Department to the new Department of the Interior signaling a change
in the threat level associated with American Indian tribes (Wilkins, 2002).
6
2.3 Data Sources
For this study, we collected American Indian constitutions and their amendments for over 70 American Indian
nations. The empirical analysis is based on American Indian governments that have democratic forms of
government, a written constitution, and a population of more than 750 citizens. One criterion for selecting
these American Indian nations was that they had to have a sufficiently large population for political engage-
ment. There are over 560 federally recognized American Indian and Alaska Native nations in the US. A large
proportion of the federally recognized tribes have tribal populations that number only a few hundred people.
Therefore, we restricted our analysis to the large tribes with at least 750 members. The smaller tribal nations
were omitted for several reasons. The first is that generally the smaller tribes have less resources and operate
on a more informal basis; family and clan relationships tend to dominate in these particular tribes. Second,
many of these smaller tribes do not have a formal, written constitution. In fact, in the current analysis we
omit all tribes with unwritten legal and political codes. This necessarily eliminates tribes such as the Navajo
Nation which operate on an unwritten, traditional code of governance. We have also omitted the theocracies
and corporate governance structures.1
We compiled the constitutional documents from publicly available sources and locations. The National
Indian Law Library, which is part of the Native American Rights Fund, has an extensive collection of con-
stitutions online. Additionally, the University of Oklahoma law library also provides a large collection of
American Indian constitutions. We found amendments to the constitutions by direct contact with the tribes,
their websites and various inter-library loans from individual law libraries across the country. Finally, we
examined constitutions at the Bureau of Indian Affairs in Washington, DC where a number (but not all) of
the constitutions are archived.
In total, the data are based on approximately 450 different files or documentation regarding the constitution
or the amendments. We coded the initial political institutions contained in the constitutions and recorded
the changes made to these constitutions as well as the year in which they were made. For the purpose of
the present study we focus on a central element of the tribal nation’s political institution - whether the chief
executive is elected indirectly or directly. The data also contain information about other political institutions
such as staggered terms and an independent judiciary.
We merge the constitutions and amendment data with census data from the 1900 US Census at the tribal
government level. This data is available from the Minnesota Population Center IPUMS website and represents
a 20% sample of American Indians by the US Census Bureau. The data contains characteristics of the
reservations prior to the adoption of their modern constitutions. The variables, while somewhat limited and
1The theocratic tribal governments, primarily the Pueblo tribes of the US Southwest, were treated differently due to their
long-standing government to government relationships with Spain and Mexico, see Spicer (1962). On the other hand, Alaska
Native Villages are often quite small and operate under a corporate governance structure as described in the Alaska Native Claims
Settlement Act of 1971.
7
not perfectly comparable to recent data from the US Census, are nevertheless useful as control variables for the
regressions that follow. As outcome variables, we use data from more recent waves of the US Census (1990 and
2005-2009 American Community Survey).2 In particular, we have selected four variables that reflect economic
development on American Indian reservations: per capita income, percent in the labor force, unemployment
rate and percent of the population with a post-high school education (tertiary) or more. The variables are
indicative of economic conditions on American Indian reservations.
2.4 Descriptive Statistics
In Table 1 we present the means and characteristics of our sample data. Panel A of Table 1 provides information
on the main outcome variables of interest in our analysis for the year 1990. Average per capita incomein 1990
is approximately $5,160 ( in 1990 dollars) which is significantly lower than the US average of $19,374 (Kalt and
Taylor, 2005). American Indian reservations on average are much less developed than the rest of the United
States. For instance, the percentage of adults in the labor force on reservations in 1990 is 57% and has a
minimum amount of just 36%. The unemployment rate is a useful measure of the economic conditions on the
reservation. Individual American Indians, of course, have the option to work off of the reservation; we view
this as a proxy for economic activity on and around the American Indian reservation. In 1990 the average rate
of unemployment was approximately 23% with ranges as low as 4% and as high as 44%.
On average, 24% of adults aged 25 and older on the American Indian reservations have a post-secondary
education. We include this measure of human capital in order to identify an additional dimension of economic
development on the reservations. There is quite a large range of values across the different tribes with respect
to this variable; there is a range of 10-40% across the reservations in our sample. To account for differences
in population size and land area, we also constructed a population density variable from information about
the number of people living on Indian lands in 1990 and the square miles of Indian lands in 1990. This logged
variable ranges in value from -2.12 to 5.45 with an average log population per square mile of 1.49.
In panel B, the data from the American Community Survey 2005-2009 for American Indian reservations is
provided. We have deflated the per capita income to 1990 prices and find that there has been a pronounced
increase in real per capita income to $8,400. In general, there has been an improvement in all of the four
variables as compared to the 1990 levels. Labor force participation has increased, unemployment has decreased
and the percent of adults with a post-secondary education has increased on average to 43%.
Panel C of Table 1 provides the variables from the 1900 US Census for the American Indian reservations.
While the data for this time period is limited, there are several useful variables that provide some indication of
2Unfortunately, the US Census Bureau did not collect separate data for American Indian reservations for most of the 20th
century; the census geography captures modern reservations starting in the 1990 census. Therefore, we are unable to examine
economic outcomes earlier than 1990. Also, the characteristics of the population are now collected annually in the American
Community Survey (ACS) and are presented only as 5 year averages for communities with less than 20,000 individuals. Therefore,
we use the 2005-2009 ACS data for our current economic outcomes on American Indian reservations.
8
the levels of economic development on each reservation prior to the adoption of the initial modern constitutions.
In 1900 the average age is approximately 26 years; the population is highly skewed towards the young which is
characteristic of developing countries. The male-female ratio is roughly equal on average across the different
reservations in 1900. Approximately 40% of the adults on the reservations were married in 1900. The percent
of adults in the labor force in 1900 is approximately 20% on average. The labor force variable does not include
self-employed farmers, which may explain this relatively low labor force participation rate. Approximately
17% of the population of an average reservation is literate in 1900. The literacy variable is a useful proxy
for education and general skill levels of the population. Again there is tremendous heterogeneity across tribes
with some tribes reporting no literate individuals and other tribes with literacy rates of almost 50%.
While we do not have a direct measure of individual incomes in the 1900 census,3 we do have a measure of
occupations. Conveniently, there is an index of occupations which are ranked according to their wages contained
in the data. This occupation-income index measure is an imperfect measure of income on the American Indian
reservations in 1900 but it is the best available data. We took a simple average of all employed people on
the reservation and the mean value is 5.6, the minimum and maximum values are 0 to 13.7. We view this
occupational index measure as an ordinal measure of average income on the reservations.
The 1900 US Census contains an interesting variable which is not present in current census data - the
percent of intermarriage between American Indians and non-Indians. While this is a somewhat unusual
variable it does provide a proxy measure for the degree of intermixing between the American Indian tribe and
the surrounding non-Indian community. Additionally, we view this variable as a measure of social integration
across the two groups. While our research is primarily concerned with the effect of political institutions on
economic development, this variable allows us to control for potential differences in ethnic heterogeneity across
the different American Indian tribes. The average percent of white blood in our sample of reservations is 9%.
There is a lot of heterogeneity with certain tribes having no intermixing and a few outliers that have over 40%
white blood in 1900.
The next set of variables indicate the geographic location of the tribal reservation in five different census
regions in the lower US. There are no Eastern American Indian tribes included in this data. As mentioned
previously, we have restricted our analysis to the larger, federally recognized American Indian tribes with
written constitutions and this necessarily excludes the Eastern tribes.
Panel D of Table 1 provides information about the tribal constitutions and their amendments. The average
tribe adopted the first constitution in 1943.4 Around 76% of tribes adopted their first constitution under a
Democratic US Federal administration. At the time of the initial adoption of the constitution, approximately
57% of the tribes had an indirectly elected chief executive, where the tribal council decides from among its
3The US Census Bureau began asking individual income information only starting with the 1940 US Census.4Only one tribe adopted the initial constitution after 1990, namely in 1994. Dropping this tribe from the sample does not affect
the empirical results.
9
own members who will be the chief executive. By 1990 that percentage had decreased to 30%.5
3 Empirical Framework
This section discusses the identification problem as well as different empirical strategies to identify the effect
of political institutions on economic performance.
3.1 The Estimation Problem
The goal of this paper is to investigate the potential effect of constitutional design on economic development.
The typical framework used in the literature to estimate this effect is given by
Yi = βI0i + γXi + ε0i :, (1)
where Yi denotes the growth in one of four separate measures of outcomes on reservation i over the time
period 1990 to 2005-2009. These outcome variables include per capita income, unemployment level, percent
of adults with high school education or more, and percent in the labor force. The vector X includes controls
for characteristics of the reservation in 1900, that is, prior to the adoption of the first modern constitutions.
In particular, the vector contains the following characteristics of the reservation: average age, share women,
marital status, labor force participation rates, measure of intermarriage, occupational-income index measure,
and literacy rates. Additionally, X includes controls for reservation characteristics in 1990 such as log per
capita income. This accounts for observable differences in economic development as well as for convergence.6
Institutions I are measured as binary indicators of whether or not the initial constitution of tribe i calls for the
chief executive to be indirectly elected (I0i = 1), where t = 0 represents the time when the initial constitution
is adopted. The indicator is zero (I0i = 0) when the chief executive is directly elected. In light of the political
economy literature, an indirectly elected executive represents a parliamentary system, while a directly elected
executive represents a presidential system. Differences in the way the executive is elected reflect differences
in the accountability of the executive, and therefore an institutional environment that differs in terms of its
conduciveness for economic development (see, also the findings from the cross-country literature, e.g., Persson
and Tabellini, 2003, 2004). The coefficient of interest is β.
5An example for a tribe that changed the constitutional details of the election of the executive is the Apache tribe of the
Mescalero Reservation in New Mexico. In their first constitution, which was approved on March 25, 1936, the Apaches on the
Mescalero Reservation had a business committee elected. The president as well as other functions were then elected by the business
committee. These procedures were subsequently reformed, and the new constitution approved on January 12, 1965, stipulated
that the tribal president be elected in general elections. Also the organization of government changed along with this reform.6Various combinations of different 1990 control variables do not significantly affect the observed results. Therefore, we use the
log per capita income measure as the primary 1990 control variable in our preferred specifcation. See also the robustness results
in Section 4.3
10
In principle, the data also contain information for the constitutions at later points in time. Assuming that
β is a deep and stable parameter, an alternative estimation could therefore exploit this information at time
t = 1, e.g. in 1990 before our outcomes are measured, and estimate
Yi = βI1i + γXi + ε1i : . (2)
Without additional assumptions, it is not obvious that β is actually identified in these estimation frame-
works, because reverse causality problems might bias the estimates. For instance, the adoption of a particular
constitutional design might be endogenous to the economic development prospects of a particular tribe (such
that I0 is correlated with ε0), or constitutions may change endogenously over time (such that I1 might be
correlated with ε1).
3.2 Identification using Initial Assignment of Institutions
To account for the potential endogeneity problem, we employ an instrumental variables approach that exploits
historical conditions in order to identify the effect of constitutional design on economic growth. This is possible
due to the peculiarities of the political liberalization process that American Indian tribes underwent in the
late 19th and early 20th Century.
US Presidential Party and the Adoption of American Indian Constitutions. As the 19th century
drew to a close the political and legal landscape changed dramatically for American Indian tribes. Previous
models of informal governance were not effective in dealing with the reduction in land holdings and rights.
The US Federal government reduced the standing of tribal nations to domestic-dependent nations and there
began an erosion of rights and protections such as the loss of autonomy and treaty rights. In order to deal
more effectively with the US Federal government and the US states, American Indian tribes began to establish
centralized governments. Tribes adopted their preferred constitution based on very local and specific conditions
and experiences.
In order to establish and adopt formal constitutions, many American Indian tribes sought help and assis-
tance from the Bureau of Indian Affairs (BIA). The BIA operates under the Secretary of the Interior and is
appointed by the US President. Congress authorizes the budget of the Bureau of Indian Affairs as noted in the
US Constitution and supported by numerous US Supreme Court rulings (Duthu, 2008; Deloria and Wilkins,
1999). Specifically, the Bureau of Indian Affairs responded to requests for assistance in drafting constitutions.
Elmer (2006) provides an example for the 1930s where the BIA was tasked with responding to requests for
drafting constitutions; the Bureau was not empowered to seek out tribes itself. While there may have been no
explicit directive, there appears to have been at least indirect influence in terms of political institutions.
Once a constitution was proposed or considered, the Bureau of Indian Affairs exerted influence and pressure
on the kinds of political institutions that could be adopted. The instrumental variable for parliamentary versus
11
presidential systems is based on the fact that the nature and type of constitution adopted by American Indian
nations has been heavily influenced the Bureau of Indian Affairs, which is subordinate to the Secretary of the
Interior of the US Federal Government. The approval and influence of constitution-type is therefore related
to the political position of the respective US Presidential administration.
First, under Democratic leadership in the Bureau of Indian Affairs, Felix Cohen, in the 1930s, drafted a
document for the writing of tribal constitutions with numerous suggestions. This memo provided extensive
information on the clauses and contents of a constitution. Additionally, the document provided a model
constitution in the appendix. For the purposes of this paper it is useful in that the model only contained a
single type of institution for the election of chief executives - an indirectly elected or parliamentary-type system
(Cohen, 2006; Wilkins, 2006; Deloria and Lytle, 1983). Beyond this influence, the Bureau of Indian Affairs
had approval power over the nature of the American Indian tribal constitutions. The hypothesis motivating
our instrumentation strategy is that under Democratic US Presidents there was a systematic tendency to
favor the adoption of the parliamentary type chief executive, while under Republican US Presidents there
was a tendency to favor the adoption of the direct election of the chief executive, i.e., a presidential form of
government. One reason for the difference is that there might be a difference of opinions according to political
party on the idea of assimilation and appropriate political institutions. Theodore Roosevelt, a generation
earlier and a Republican US President, saw the new American Indian programs such as allotment as a useful
tool to dismember American Indian tribes and to transform them into American ideals. The imposition of
a presidential system of government was one method of assimilating the American Indian tribes into the US
model of governing. On the other hand, the Democrats and their administration paid more attention to the
pre-existing social and political structures. Existing political institutions for American Indians resembled a
more communal approach to decision-making and power sharing which is closer to a parliamentary type of
government (Champagne, 2006).
An Instrumental Variables Approach. In the following, we exploit these peculiarities by using the party
of the US President at the time of the American Indian tribes’ adoption of their initial constitution as an
instrument for the constitutional design. Consequently, our first stage regression when considering initial
institutions in terms of I0 as in (1) is given by
I0i = λZi + µXi + u0i :, (3)
while the corresponding first stage for an outcome equation with current institutions I1, as in (2), is
I1i = λZi + µXi + u1i : . (4)
We use an indicator variable for our instrument, Z, that takes the value of 1 if the party of the US
12

President at the time of the initial adoption of the American Indian constitution was Democrat and 0 if it
was Republican. The outcome variable, I, is a binary indicator that takes value 1 if the respective political
institution is characterized by indirectly elected executives, and 0 if not. The first stage regression is given
by a linear probability model. Provided that for political and ideological reasons Democratic Presidential
administrations were more favorable to indirect democratic structures than Republican administrations as was
discussed above, the instrument is expected to be positively related to whether the political party of the US
President at the time of adoption was a Democrat.7
Constitutional amendments occurred later during 20th century in some tribes when considerable power and
authority was restored to American Indian tribes to make decisions about their own political structures. The
period, since the mid-1960s onwards is known as the era of Indian Self-Determination. Therefore, we should
view these constitutional amendments as being primarily driven by tribal preferences and less influenced by
officials from the Bureau of Indian Affairs in this later period. It is an open-question as to what exactly deter-
mines these constitutional amendments. There is a clear case to be made for the endogeneity of constitutional
changes and economic performance, but uncovering the determinants of these changes ins beyond the scope of
this paper.
The maintained assumptions for identification of the effect are that the instrumental variable, Z, is not
related to the error term in the respective outcome equation (1) or (2) above. There is no evidence that
American Indian tribes were making their decisions about whether to adopt a formal constitution based on
the political party of the US President or the executive branch appointees. Instead, the historical evidence
suggests that the primary motivation for adopting a formal constitution was based on individual reservation-
based conditions and was divorced from conditions in Washington, D.C. Additionally, there is no evidence
that tribes attempted to game the system and wait for a different US President and a change in political
appointees in the executive branch; empirically, there are no large numbers of constitutional adoptions after
an election when the party of the US President changes. It is also useful to note that the party of the US
President at the time of adoption of the constitution should have no differential (if at all) effect on the funding
of American Indian tribal nations in the future; funding for American Indian tribal nations is appropriated by
the US Congress and has no relationship to prior US Presidential administrations. In fact, funding for large
programs such as education and health care provision are often tied to simple formulas based on population
size (see, for instance, United States General Accounting Office, p. 6, 2003).
In Table 2 we compare the tribal characteristics from the 1900 US Census for the tribes that adopted a con-
stitution under a Republican or Democratic US Presidential administration. The numbers suggest that there is
little or no difference in American Indian tribes which adopted constitutions under Democratic or Republican
7We find no evidence for tribes predominantly adopting new constitutions immediately after or immediately before a change in
the US President from one party to the other, or presidential elections. For instance, only 2 tribes adopt a constitution within 2
years of the change in political party; dropping these observations do not change our results.
13

US Presidents. Based on 1900 observable characteristics we do not find that on average there is a statistically
significant difference across the two tribal groups. When comparing the means of the 1900 characteristics
between the two types of tribes, we find that none of the characteristics are statistically significant. The only
variable with a statistically significant difference at the 10% level is total white blood, suggesting that tribes
that have adopted a constitution under a Republican presidential administration tend to have slightly higher
levels of white blood in 1900. This difference, while marginally statistically significant, is about 5 percentage
points on average and hence not large in absolute terms, such that, for both types of reservations, the popula-
tion is still fairly homogenous with a high degree of American Indian blood in 1900. Overall, the descriptives
show that tribes were very similar in terms of demographic composition and labor force participation. Most
importantly, the two types of tribes do not differ along the other economically meaningful variables such as
the occupational-income index score, literacy rates and labor force participation rates.
4 Empirical Results
This section presents the main results of our empirical investigation of the role of different election rules for
the chief executive on changes in economic development variables between 1990 and 2005-2009. We focus on
four outcome variables that are available in the US Census data: per capita income, percent in labor force,
unemployment rate and percent with post-high school education. We selected these variables as they are useful
indicators of economic development in different dimensions on the reservations at the time. Throughout, we
estimate linear models and use the characteristics of the tribe in 1900 as explanatory variables reflecting the
term X. We present results for the different estimation frameworks discussed above: OLS, as well as 2SLS
estimates using the party of the US President at the time of their constitutional adoption as the instrument
for institutions at constitutional adoption, I0, or after subsequent amendments by 1990, I1.
4.1 Constitutional Design and Economic Performance: OLS Results
Table 3 presents the results of OLS regressions of economic development in terms of changes in the economic
development variables between 1990 and 2005-2009 as dependent variable on constitutional design variables
and controls. Columns (1)-(4) present results for specification (1) with constitutional design when constitu-
tions where adopted, while Columns (5)-(8) present results for the specification (2) with political institutions
measured in 1990. The estimated coefficients for constitutional design in terms of indirectly elected executive
are small in magnitude and statistically insignificant for all cases. The results suggest that neither initial
nor current political institutions have a significant effect on the change in economic development variables.
These findings are likely to be biased because of endogeneity problems, however. The bias might arise due to
endogeneity in the sense that systematic but unobserved cross-tribal differences determine institutional design
as well as economic performance. In addition, the estimates of specification (2) might also be affected by
14
endogenous changes in the institutions after the initial adoption of a constitution in response to economic
performance ex interim. For instance, the coefficient on directly elected chief executive is likely to be different
in specifications (1) and (2) as tribes amend their constitutions in response to political conflicts among the
tribe members, or in order to attain better economic performance. This might contribute additional variance
that biases the estimates and renders the returns associated with a particular type of political institution
statistically insignificant. Taken together, the results from ordinary least squares regressions suggest that
political institutions have little effect on changes in economic development between 1990 and 2005-2009.
4.2 Constitutional Design and Economic Performance: 2SLS Results
To account for the potential endogeneity bias that affects these estimates, we proceed by presenting results that
exploit exogenous variation in constitutional design using our instrumentation approach. The specification of
the outcome equation is again as in (1) or (2), respectively, but the effect of institutions I is estimated using
the the party of the US President at the time of adoption of the first constitution as instrument.
Table 4 presents reduced form estimates of economic development over the period 1990-2005/9 regressed
on the binary instrument of whether the US president was a Democrat at the time of the initial adoption of
the respective tribal constitution. The results suggest that tribes that adopted their initial constitution under
a Democrat federal administration exhibit significantly faster income growth, as well as a faster increase in
labor force participation, a slower increase in unemployment rates and an increase in the percent of adults
on the reservation with post-secondary education, compared to tribes that adopted their initial constitutions
under a Republican federal administration.
Table 5 presents the results from 2SLS regressions. Column (I.1) contains the first stage estimates of the
instrumented variable as in (3) – constitutional design in terms of indirectly elected executive at the time of the
initial adoption of the constitution – regressed on the instrument of whether the US President was Democrat
at the time of the initial tribal constitution adoption, plus controls. The instrument has a statistically highly
significant effect on the constitutional design at initial adoption, indicating that, as expected, tribes that
adopted their initial constitution under a Democrat president were more likely to have executives elected
indirectly. The F-Statistic for this instrument is 14.79, indicating that the first stage relation is reasonably
strong. Columns (1)-(4) present estimates for outcome equations on the second stage. The results largely
confirm the results of the reduced form estimates. Constitutional design has significant effects on economic
performance. Tribes with constitutions that stipulate indirectly elected executives have faster income growth
over the period 1990-2005/9, exhibit faster growth of the labor force, a faster drop in unemployment, and
an increase in people with post-secondary education on the reservation. All these results hold conditional on
the level of development in 1990, as proxied by income per capita. The log difference in income per capita is
about 0.36 larger for tribes with indirectly elected executives. This is approximately half of the difference in
mean income provided in Table 1 between 1990 and 2005-2009, and corresponds to annual growth in income
15
per capita being about 2.5 percent faster on average. The labor force grows by about half a percentage point
faster each year; and unemployment shrinks by about half a percentage point faster per year. The percent of
adults older than 25 that have post-secondary education increases by about 4% over this time period.
The second part of Table 5 presents the corresponding results when adopting specification (2) and esti-
mating the effects of constitutional details by instrumenting institutions as of 1990, at the beginning of the
period in which outcomes are measured, as in (4). In light of the fact that tribes might have changed their
constitutions between the initial adoption and 1990, potentially in response to economic performance or for
other political economy reasons, it is to be expected that the instrument is weaker in this specification than
for constitutions at adoption.
Column (I.2) presents the respective first stage estimates, which confirm this conjecture. The coefficient
estimate of the instrument on the first stage is smaller and statistically less significant. Although there is a
positive and significant effect of having a Democrat administration for the US President on the probability
that a tribe has an indirectly elected chief executive in 1990, the F-Statistic for this instrument is only
6.75. Columns (5)-(8) present results for the outcomes in terms of economic development variables between
1990 and 2005-2009 on the second stage. Throughout, the results confirm the previous results in Columns
(1)-(4). Having a constitution stipulating indirectly elected executives in 1990, instrumented by having a
Democratic Federal administration at the initial adoption results, has a positive effect on income growth
and labor force participation, implies a faster reduction in unemployment, and an increase in post-secondary
educated individuals on the reservation. In terms of magnitude, all estimates obtained with specification (2)
imply larger effects on the second stage. This could be due to a problem of a weaker performance of the
instrument on the first stage. Alternatively, it is possible that current institutions have a stronger effect on
outcomes than initial institutions, which might have changed subsequently and hence do not reflect the actual
institutional setting at the beginning of the observation period of outcomes. The emerging picture is therefore
consistent with initial institutions, I0, rather than contemporaneous institutions, I1, being more strongly
affected by the instrument (having a stronger influence on political institution decisions at the moment of
adoption), but having a weaker effect on current outcomes as compared to current institutions.
To conclude, for tribes that comply with the assignment of political institutions at the time of adoption as
determined by the party of the US President, we find that those with an indirectly elected chief executive have
better economic performance in terms of a larger growth in per capita income, a faster increase in labor force
participation, a faster reduction in unemployment and an increase in the percent of adults on the reservation
with post-secondary education.
4.3 Robustness
This section presents several robustness checks in order to investigate whether other potential mechanisms are
responsible for the observed outcomes. The respective tables are found in the Appendix.
16
4.3.1 Years Since Constitutional Adoption and Distance to Nearest Large City
The results so far were obtained under the premise that the federal administration at the adoption of the
initial tribal constitution is a valid instrument for constitutional design in terms of the form of government
stipulated by the constitutional article on whether executives are elected directly or indirectly. The validity of
this instruments hinges on two critical assumptions. First, the federal administration must not reflect other
unobserved heterogeneity in tribal characteristics that are related with outcomes. This could be the case,
for example, if there is a time trend in the adoption of a constitution, such that tribes that adopt their first
constitution early on are systematically different from tribes that adopt their constitutions later, i.e., if the
years since adoption of a constitution affect the efficacy and efficiency of tribal governments. If the timing of
the adoption correlates with the party of the US President, this would render the exclusion restriction invalid
and the identification flawed. A potential way to account for this confound is to control directly for the time
elapsed since the initial adoption of a constitution.
Second, there might be other characteristics that are unrelated to the timing of the adoption, but that
have to do with geographic features that are not accounted for by the region controls.8 For instance, the
development potential of a tribal community in terms of income, but in particular labor market performance,
might be crucially affected by the possibility to commute off of the tribal reservation for work. To account for
this possibility, one would have to control for the distance to the nearest city.
Table 6 presents 2SLS estimation results for the specification of the outcome equation as in (1) that include
the years since the constitution was initially adopted, as well as the distance to the nearest city (in miles)
as additional controls.9 The results are qualitatively unaffected and quantitatively very similar compared to
the previous results. Years since initial adoption has a significant effect on the probability of observing an
indirectly elected executive in the initial constitution, but the instrument remains strong and significant in
predicting constitutional design. In addition, there is no effect of years since initial adoption on any of the
outcomes on the second stage. Distance to the nearest city leaves the first stage unaffected.
4.3.2 Additional Controls for Development as of 1990
Table 7 presents the results of a similar analysis to the one above, except that the specification includes
additional control variables in terms of the levels of the respective outcome variable as of 1990. These specifi-
cations are equivalent to estimates with the level of the respective outcome variable in 2005/9 as the dependent
8An additional characteristic of this analysis is that all of the tribes examined here are federally-recognized by the US Federal
government and hence are eligible for the exact same types and amounts of federal programs. There is no differential treatment
by the US Federal government and the Bureau of Indian Affairs. There are other state-recognized and non-recognized indigenous
peoples in the US that are not included in this analysis for the specific reason that they would face very different economic and
social opportunities.9In this and the following robustness checks, we restrict attention to specification (1) due to its better first stage performance.
All results are qualitatively similar for estimates of specification (2).
17
variable, and therefore correspond to the usual specification used in empirical studies of the fundamental de-
terminants of development (see, e.g., Spolaore and Wacziarg, 2012). As in the previous Table, columns (1)-(4)
contain second stage results for specification (1) for the outcome equation, while columns (5)-(8) contain re-
sults for specification (2). The performance of the respective first stages (not shown) is similar to before, with
F-statistics in the range between 13 and 14 for the specifications in columns (1)-(4), and smaller values in the
range between 5 and 8 for the various first stages for outcomes in columns (5)-(8). The results on the second
stage are quite similar for log percapita income and percent in the labor force to those found previously when
only the log per capita in 1990 had been included as additional control variable. However, the coefficients in the
unemployment and post-secondary education regressions are smaller in magnitude and statistical significance
than in the previous tables.
Table 8 shows the results of estimates of specification (1) with an even more extensive set of controls for
development in 1990 in all dimensions. In this table we include all of the 1990 level variables simultaneously
in each regression model instead of individually as in Table 7. The results again confirm the previous findings.
The F-statistic for the first stage in this model is 15.55. We find robust positive effects of indirect elect
executives on income and labor force participation in the second stage results. There is also a negative
effect on unemployment and on the percent with a high school diploma, but these effects are not statistically
significant.
4.3.3 Different Institutions and Casinos
A further potential confounder for the results obtained so far is that constitutions might differ along several
dimensions other than whether the executive is elected indirectly or directly. Potentially, other institutions con-
tained within the tribal constitutions may be responsible for the observed differences in economic performance,
while these additional institutions are themselves highly correlated with whether a tribe has a parliamentary or
presidential system of government. In order to account for these potential confounders, we include additional
political institutions as right hand side control variables and investigate how this affects the results for the
main outcome, changes in log per capita income. Table 9 presents results for second stage estimates using
extended specifications with controls for other components of the constitutions. In particular, the estimates
account for whether an independent judiciary exists or not, whether elections are staggered, for the length
of an election term, whether a council is directly elected or not, and for the size of the tribal council. The
results are robust to the inclusion of these additional variables, whereas none of the individual variables attain
statistical significance, except for whether the tribal council is directly elected. Even in this particular case, the
coefficient on the indirectly elected chief executive remains large in magnitude and statistical significance.10
10We also attempted to instrument the different alternative types of institutions using the party of the US President at the time of
the adoption of the constitution. The instrument is not strong for any of the potential variables such as the existence of a judiciary,
term length, whether the council members elections are staggered, and the initial size of the tribal council. Overall, the instrument
18
An additional explanation for the observed differences in economic performance across the two types of
tribes may be the presence of a casino. In fact, one might suspect that the presence of a casino alone is
responsible for the improved economic performance. The results in Table 9 suggest that the inclusion of
whether a tribe operates a casino or not as a control variable does not significantly affect the main coefficient
of interest. This is consistent with the fact that there is a diversity of tribally-owned enterprises on American
Indian reservations. Casino operations are important, but they do not account for all of the economic activity
on reservations. Overall, the results therefore confirm the earlier findings that the constitutional design in
terms of a parliamentary or presidential type of government has a significant effect on economic performance.
4.3.4 Placebo Effects
Finally, we conducted a series of placebo instrumental variables regressions, the results of which can be found
in Table 10 in the Appendix. In these regressions, we take the initial values of our control variables from
the 1900 census as outcome variables. The six outcome variables are log population density per square mile,
percent married on the reservation in 1900, percent in the labor force in 1900, average percent non-Indian on
reservation in 1900, occupational-income score in 1900 and percent literate in 1900. For each of these variables,
the first column instruments for having an indirectly elected chief executive at the time of adoption of the
initial constitution. None of the coefficients are statistically significant. The second column for each variable
instruments for having an indirectly elected chief executive in their current constitution. Once again none of
the coefficients are statistically significant.
4.4 Predictions from Political Economy: Potential Channels
The findings presented so far suggest that constitutional design has a robust causal effect on economic devel-
opment. In particular, constitutions stipulating indirect elections of the executive that resemble parliamentary
forms of government appear to have a better economic performance than constitutions with directly elected
executives in terms of the growth of average per capita income, labor force participation rates, post-secondary
educated individuals and a reduction in unemployment rates on these reservations. These effects are not ex-
plained by other characteristics such as years since adoption, distance to the nearest city, or casino operations,
nor through other facets of the political institutions (such as the existence of an independent judiciary or stag-
gered terms), nor by a systematic selection of tribes given the results of the placebo estimates. Nevertheless,
the results so far leave open through which channels the form of government might operate to affect economic
performance.
In this section, we explore several potential mechanisms that may be responsible for the observed differences
is only valid for predicting the method of electing the chief executive in the originally adopted constitutions. Empirically, we
also note that most of these institutions are added in later years as constitutional amendments and may be endogenous variables
themselves.
19
in growth rates across the two different types of institutions. The political economy literature makes several
predictions about the economic consequences of these different forms of state (see, e.g., Persson and Tabellini,
2000, 2003).
A first assertion is that parliamentary systems tend to have expansionary bureaucracies and larger ex-
penditures. Hence, one immediate candidate for a potential channel is the share of public employment in
tribal reservations, given that employment tends to be a primary concern on American Indian reservations. In
our particular environment, we find indeed that the expansion of government employment (primarily tribal-
government as federal employment - Bureau of Indian Affairs employees - had been steadily decreasing over
time on reservations) as a likely candidate for explaining the improvement in economic conditions for Amer-
ican Indian populations residing on reservations.11 Table 11 presents results for the change in the share of
government employment (as proportion of the adult population on the reservation) over the course of the 1990
to 2005-09 time period as dependent variable. Column (1) presents the results for the second stage of 2SLS
estimates when controlling for the employment composition in 1990. The results document that there is growth
in government employment over this time period for tribes that were initially assigned parliamentary systems.
In fact, there was a dramatic increase in business opportunities and the ability to operate existing government
programs such as education and housing services (Wilkins, 2002, p. 89). A similar analysis with respect to
employment in the private sector does not reveal an accompanying improvement in business employment.
It appears that the observed increase in per capita income and labor force participation between 1990 and
2005-2009 comes primarily from an increase in government employment. For American Indian reservations,
this has meant an expansion of tribally-owned businesses.
We assert that this evidence suggests that the primary role for improved economic performance on Amer-
ican Indian reservations in this time period is due to improved employment prospects. Previously, economic
opportunities on reservations had been quite sparse. New industries, in addition to casino and gaming oper-
ations, have sprung up on many American Indian reservations in the past twenty five years such as mining,
energy production, timber, tourism and recreation, agriculture, hunting and fishing tourism, arts and crafts
based industries. Our findings, therefore, are consistent with a story where the most effective tribal govern-
ments expand their business operations and increase employment among tribal members. Compared to the
average tribe with a presidential system, there is more government employment and, ultimately, the rate of
growth is higher and more sustained for tribes with an initial parliamentary system.
A second assertion from the literature on comparative political economy is that parliamentary systems tend
to have higher redistribution. Due to the lack of direct information about redistribution, we try to investigate
this assertion by considering the change in poverty. In particular, we construct a proxy of poverty: the share of
all households on reservations with an income below the contemporaneous median household income in the US
11See U.S. Commission on Civil Rights (2003, page 11, Figure 1.2) which shows the decrease in per capita expenditures for
Native Americans by the US Federal government relative to the US population as a whole over the past three decades.
20
as a whole. The result, shown in column (3) of Table 11, suggests that poverty declined faster in tribes with
indirectly elected executives at the time of adoption of their constitutions.12 This corroborates the impression
that incomes went up in the entire distribution, and in particular at or below the median, rather than only on
average.
Taken together, the results suggest that the parliamentary system is likely responsible for the observed
improvement in economic conditions. In the emerging democracies on tribal lands, with uncertain conditions
and preferences and a poorly-developed private business sector, it appears that a parliamentary system in-
creased the government-owned enterprises and was more likely to improve the economic conditions through
job creation. The situation on American Indian reservations has generally improved over the course of the
past forty years as a result of a reduction in US Federal government control, better economic opportunities in
terms of leasing and development of natural resources.
5 Concluding Remarks
This research has used a novel panel data set of political institutions of American Indian tribal nations over
the 20th century. We examine the effect existing political institutions on economic development for individual
American Indian tribal nations. The American Indian context is particularly useful for focusing on political
institutions in several respects: the larger legal, political and economic environment is held constant as they
are located within the United States. In our analysis, we find that contemporaneous political institutions
have no effect on economic performance in an ordinary least squares regression framework. When using an
instrumentation strategy for political institutions that exploits the type of federal administration during the
adoption of the initial constitutions, we find significant positive causal effects of parliamentary systems on
economic performance. These results are robust to the inclusion of geographic and institutional controls, to
the inclusion of other potential constitutional features such as the existence of an independent judiciary or
staggering the tribal council election terms, as well as to casino operations. Results of placebo exercises do
not indicate that there is systematic selection of tribes into particular constitutional types once accounting
for the instrumentation using the party of the US federal administration at the time of adoption of the first
constitution. The results also suggest differences in policy, in particular in public employment, as a potential
channel through which constitutional features affect outcomes.
Overall, our results provide a first analysis of the causal effect of political institutions and accountability on
levels of economic development while holding constant a number of other important determinants of economic
12It is worth noting that the reduction of poverty is not due to a reduction in the overall poverty in the US as a whole, given
that poverty levels in the US in terms of the population below the poverty threshold actually went up. Also, very similar results
obtain when poverty is measured by the fraction of households with household income below 15,000 USD (deflated to 1990 prices),
which indicates a relative as well as absolute reduction in poverty in tribes with indirectly elected executives relative to directly
elected executives.
21

security and legal structure. While our analysis focuses on a very specific set of governments, our findings
may have wider implications by suggesting the importance for studying the mechanisms behind the economic
effects of constitutional design.
22
References
Acemoglu, D. (2005): “Constitutions, Politics, and Economics: A Review Essay on Persson and Tabellini’s
The Econonmic Effects of Constitutions,” Journal of Economic Literature, 43(4), 1025–1048.
Acemoglu, D., D. Cantoni, S. Johnson, and J. Robinson (2012): “The Consequences of Radical Reform:
The French Revolution,” American Economic Review, forthcoming.
Acemoglu, D., S. Johnson, and J. Robinson (2001): “The Colonial Origins of Comparative Development:
An Empirical Investigation,” American Economic Review, 91(5), 1369–1401.
Acemoglu, D., and J. Robinson (2000): “Why Did the West Extend the Franchise? Democracy, Inequality,
and Growth in Historical Perspective,” Quarterly Journal of Economics, 115(4), 1167–99.
(2001): “A Theory of Political Transitions,” American Economic Review, 91(4), 938–63.
(2006): Economic Origins of Dictatorship and Democracy. Cambridge University Press, Cambridge.
Alt, J. E., and D. D. Lassen (2008): “Political and Judicial Checks on Corruption: Evidence from American
State Governments,” Economics and Politics, 20, 33–61.
Champagne, D. (2006): “Remaking Tribal Constitutions: Meeting the Challenges of Tradition, Colonialism,
and Globalization,” in American Indian Constitutional Reform and the Rebuilding of Native Nations, ed.
by E. D. Lemont.
Coate, S., and B. Knight (2011): “Government Form and Public Spending: Theory and Evidence from US
Municipalities,” American Economic Journal: Economic Policy, 3(3), 82–112.
Cohen, F. S. (2006): On the drafting of tribal constitutions. University of Oklahoma Press, Norman, OK.
Cornell, S. E., and J. P. Kalt (1995a): “Cultural Evoulution and Constitutional Public Choice: Institu-
tional Diversity and Economic Performance on American Indian Reservations,” John F. Kennedy School of
Government Faculty Research Working Paper Series.
(1995b): “Where Does Economic Development Really Come From? Constitutional Rule Among the
Contemporary Sioux and Apache,” Economic Inquiry, 33(3), 402–426.
(2000): “Where’s the Glue: Institutional Bases of American Indian Economic Development,” Journal
of Socio-Economics, 29, 443–470.
Deloria, V. J., and C. M. Lytle (1983): American Indians, American Justice. University of Texas Press,
Austin, TX.
23
Deloria, V. J., and D. E. Wilkins (1999): Tribes, Treaties, and Constitutional Tribulations. University of
Texas Press, Austin, TX.
Duthu, N. B. (2008): American Indians and the Law. Penguin, New York, NY.
Elmer, R. (2006): “The Indian Reorganization Act and Indian Self-Government,” in American Indian Con-
stitutional Reform and the Rebuilding of Native Nations, ed. by E. D. Lemont.
Ferraz, C., and F. Finan (2008): “Motivating Politicians: The Impacts of Monetary Incentives on Quality
and Performance,” IZA Discussion Paper, 3411.
(2009): “Electoral Accountability and Corruption: Evidence from the Audits of Local Governments,”
NBER Working Paper, 14397.
Hacker, D. J., and M. R. Haines (2005): “American Indian Mortality in the Late Nineteenth Century: The
Impact of Federal Assimilation Policies on a Vulnerable Population,” Annales De Demographie Historique,
2, 17–45.
Iyer, L. (2011): “Direct Versus Indirect Colonial Rule in India: Long-Term Consequences,” Review of Eco-
nomics and Statistics, 92(4), 693–713.
Kalt, J., and J. Taylor (2005): “American Indians on Reservations:A Databook of Socioeconomic Change
Between 1990 and 2000 Censuses,” Harvard Project on American Indian Economic Development Working
Paper.
Lemont, E. D. (2006): American Indian Constitutional Reform and the Rebuilding of Native Nations. Uni-
versity of Texas Press, Austin, TX.
Newton, N. J., and et al. (2005): Cohen’s Handbook of Federal Indian Law. Lexis Nexis, Mathew Bender,
Newark, NJ.
Persson, T., G. Roland, and G. Tabellini (1997): “Separation of Powers and Political Accountability,”
Quarterly Journal of Economics, 112(2), 310–327.
Persson, T., and G. Tabellini (2000): Political Economics: Explaining Economic Policy. MIT Press,
Cambridge, Massachusetts.
(2003): The Economic Effect of Constitutions. MIT Press, Cambridge, Massachusetts.
(2004): “Constitutional Rules and Fiscal Policy Outcomes,” American Economic Review, 94(1),
25–45.
(2006): “Democracy and Development: The Devil in the Details,” American Economic Review, 96(2),
319–324.
24
Spicer, E. H. (1962): Cycles of Conquest: The Impact of Spain, Mexico, and the United States on the Indians
of the Southwest, 1533-1960. University of Arizona Press, Tucson.
Spolaore, E., and R. Wacziarg (2012): “How Deep are the Roots of Economic Development,” NBER
Working Paper, 18130.
United States General Accounting Office (2003): “Bureau of Indian Affairs Schools: Expenditures in
Selected Schools Are Comparable to Similar Public Schools, but Data Are Insufficient to Judge Adequacy
of Funding and Formulas,” Report to Congressional Committees, GAO-03-955.
U.S. Commission on Civil Rights (2003): A Quiet Crisis: Federal Funding and Unmet Needs in Indian
Country.
Wilkins, D. E. (2002): American Indian Politics and the American Political System. Rowman & Littlefield
Publishers, New York, NY.
(2006): “Seasons of Change: Of Reforms, Melees, and Revolutions in Indian Country,” .
25
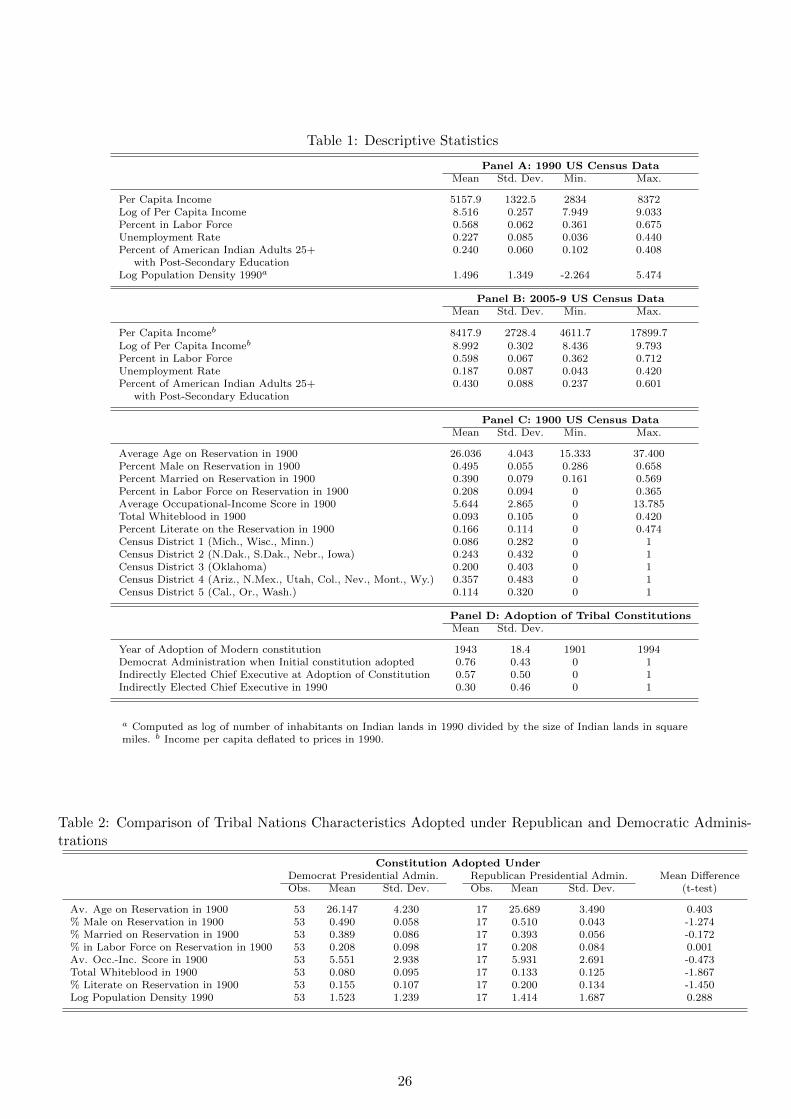
Table 1: Descriptive Statistics
Panel A: 1990 US Census DataMean Std. Dev. Min. Max.
Per Capita Income 5157.9 1322.5 2834 8372Log of Per Capita Income 8.516 0.257 7.949 9.033Percent in Labor Force 0.568 0.062 0.361 0.675Unemployment Rate 0.227 0.085 0.036 0.440Percent of American Indian Adults 25+ 0.240 0.060 0.102 0.408
with Post-Secondary EducationLog Population Density 1990a 1.496 1.349 -2.264 5.474
Panel B: 2005-9 US Census DataMean Std. Dev. Min. Max.
Per Capita Incomeb 8417.9 2728.4 4611.7 17899.7Log of Per Capita Incomeb 8.992 0.302 8.436 9.793Percent in Labor Force 0.598 0.067 0.362 0.712Unemployment Rate 0.187 0.087 0.043 0.420Percent of American Indian Adults 25+ 0.430 0.088 0.237 0.601
with Post-Secondary Education
Panel C: 1900 US Census DataMean Std. Dev. Min. Max.
Average Age on Reservation in 1900 26.036 4.043 15.333 37.400Percent Male on Reservation in 1900 0.495 0.055 0.286 0.658Percent Married on Reservation in 1900 0.390 0.079 0.161 0.569Percent in Labor Force on Reservation in 1900 0.208 0.094 0 0.365Average Occupational-Income Score in 1900 5.644 2.865 0 13.785Total Whiteblood in 1900 0.093 0.105 0 0.420Percent Literate on the Reservation in 1900 0.166 0.114 0 0.474Census District 1 (Mich., Wisc., Minn.) 0.086 0.282 0 1Census District 2 (N.Dak., S.Dak., Nebr., Iowa) 0.243 0.432 0 1Census District 3 (Oklahoma) 0.200 0.403 0 1Census District 4 (Ariz., N.Mex., Utah, Col., Nev., Mont., Wy.) 0.357 0.483 0 1Census District 5 (Cal., Or., Wash.) 0.114 0.320 0 1
Panel D: Adoption of Tribal ConstitutionsMean Std. Dev.
Year of Adoption of Modern constitution 1943 18.4 1901 1994Democrat Administration when Initial constitution adopted 0.76 0.43 0 1Indirectly Elected Chief Executive at Adoption of Constitution 0.57 0.50 0 1Indirectly Elected Chief Executive in 1990 0.30 0.46 0 1
a Computed as log of number of inhabitants on Indian lands in 1990 divided by the size of Indian lands in squaremiles. b Income per capita deflated to prices in 1990.
Table 2: Comparison of Tribal Nations Characteristics Adopted under Republican and Democratic Adminis-trations
Constitution Adopted UnderDemocrat Presidential Admin. Republican Presidential Admin. Mean DifferenceObs. Mean Std. Dev. Obs. Mean Std. Dev. (t-test)
Av. Age on Reservation in 1900 53 26.147 4.230 17 25.689 3.490 0.403% Male on Reservation in 1900 53 0.490 0.058 17 0.510 0.043 -1.274% Married on Reservation in 1900 53 0.389 0.086 17 0.393 0.056 -0.172% in Labor Force on Reservation in 1900 53 0.208 0.098 17 0.208 0.084 0.001Av. Occ.-Inc. Score in 1900 53 5.551 2.938 17 5.931 2.691 -0.473Total Whiteblood in 1900 53 0.080 0.095 17 0.133 0.125 -1.867% Literate on Reservation in 1900 53 0.155 0.107 17 0.200 0.134 -1.450Log Population Density 1990 53 1.523 1.239 17 1.414 1.687 0.288
26
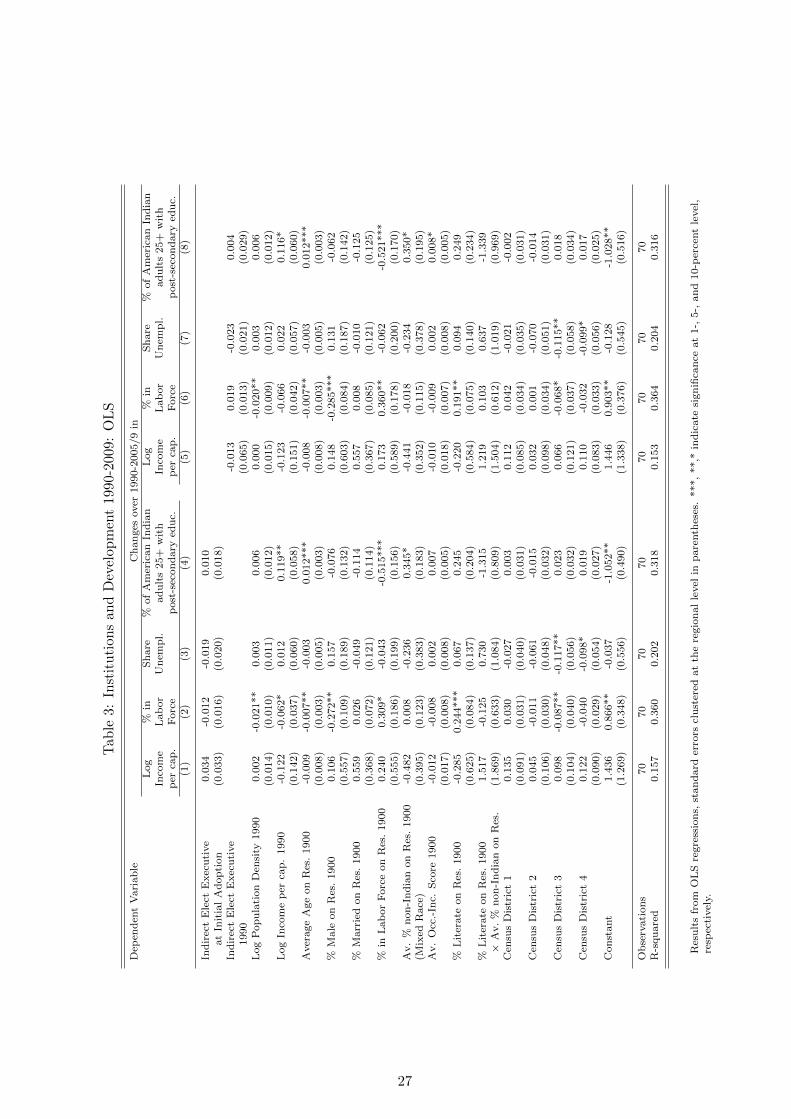
Tab
le3:
Inst
itu
tion
san
dD
evel
opm
ent
1990
-200
9:O
LS
Dep
end
ent
Vari
ab
leC
han
ges
over
1990-2
005/9
inL
og
%in
Sh
are
%of
Am
eric
an
Ind
ian
Log
%in
Sh
are
%of
Am
eric
an
Ind
ian
Inco
me
Lab
or
Un
emp
l.ad
ult
s25+
wit
hIn
com
eL
ab
or
Un
emp
l.ad
ult
s25+
wit
hp
erca
p.
Forc
ep
ost
-sec
on
dary
edu
c.p
erca
p.
Forc
ep
ost
-sec
on
dary
edu
c.(1
)(2
)(3
)(4
)(5
)(6
)(7
)(8
)
Ind
irec
tE
lect
Exec
uti
ve
0.0
34
-0.0
12
-0.0
19
0.0
10
at
Init
ial
Ad
op
tion
(0.0
33)
(0.0
16)
(0.0
20)
(0.0
18)
Ind
irec
tE
lect
Exec
uti
ve
-0.0
13
0.0
19
-0.0
23
0.0
04
1990
(0.0
65)
(0.0
13)
(0.0
21)
(0.0
29)
Log
Pop
ula
tion
Den
sity
1990
0.0
02
-0.0
21**
0.0
03
0.0
06
0.0
00
-0.0
20**
0.0
03
0.0
06
(0.0
14)
(0.0
10)
(0.0
11)
(0.0
12)
(0.0
15)
(0.0
09)
(0.0
12)
(0.0
12)
Log
Inco
me
per
cap
.1990
-0.1
22
-0.0
62*
0.0
12
0.1
19**
-0.1
23
-0.0
66
0.0
22
0.1
16*
(0.1
42)
(0.0
37)
(0.0
60)
(0.0
58)
(0.1
51)
(0.0
42)
(0.0
57)
(0.0
60)
Aver
age
Age
on
Res
.1900
-0.0
09
-0.0
07**
-0.0
03
0.0
12***
-0.0
08
-0.0
07**
-0.0
03
0.0
12***
(0.0
08)
(0.0
03)
(0.0
05)
(0.0
03)
(0.0
08)
(0.0
03)
(0.0
05)
(0.0
03)
%M
ale
on
Res
.1900
0.1
06
-0.2
72**
0.1
57
-0.0
76
0.1
48
-0.2
85***
0.1
31
-0.0
62
(0.5
57)
(0.1
09)
(0.1
89)
(0.1
32)
(0.6
03)
(0.0
84)
(0.1
87)
(0.1
42)
%M
arr
ied
on
Res
.1900
0.5
59
0.0
26
-0.0
49
-0.1
14
0.5
57
0.0
08
-0.0
10
-0.1
25
(0.3
68)
(0.0
72)
(0.1
21)
(0.1
14)
(0.3
67)
(0.0
85)
(0.1
21)
(0.1
25)
%in
Lab
or
Forc
eon
Res
.1900
0.2
40
0.3
09*
-0.0
43
-0.5
15***
0.1
73
0.3
60**
-0.0
62
-0.5
21***
(0.5
55)
(0.1
86)
(0.1
99)
(0.1
56)
(0.5
89)
(0.1
78)
(0.2
00)
(0.1
70)
Av.
%n
on
-In
dia
non
Res
.1900
-0.4
82
0.0
08
-0.2
36
0.3
45*
-0.4
41
-0.0
18
-0.2
34
0.3
50*
(Mix
edR
ace
)(0
.395)
(0.1
23)
(0.3
83)
(0.1
83)
(0.3
52)
(0.1
15)
(0.3
78)
(0.1
95)
Av.
Occ
.-In
c.S
core
1900
-0.0
12
-0.0
08
0.0
02
0.0
07
-0.0
10
-0.0
09
0.0
02
0.0
08*
(0.0
17)
(0.0
08)
(0.0
08)
(0.0
05)
(0.0
18)
(0.0
07)
(0.0
08)
(0.0
05)
%L
iter
ate
on
Res
.1900
-0.2
85
0.2
44***
0.0
67
0.2
45
-0.2
20
0.1
91**
0.0
94
0.2
49
(0.6
25)
(0.0
84)
(0.1
37)
(0.2
04)
(0.5
84)
(0.0
75)
(0.1
40)
(0.2
34)
%L
iter
ate
on
Res
.1900
1.5
17
-0.1
25
0.7
30
-1.3
15
1.2
19
0.1
03
0.6
37
-1.3
39
×A
v.
%n
on
-In
dia
non
Res
.(1
.869)
(0.6
33)
(1.0
84)
(0.8
09)
(1.5
04)
(0.6
12)
(1.0
19)
(0.9
69)
Cen
sus
Dis
tric
t1
0.1
35
0.0
30
-0.0
27
0.0
03
0.1
12
0.0
42
-0.0
21
-0.0
02
(0.0
91)
(0.0
31)
(0.0
40)
(0.0
31)
(0.0
85)
(0.0
34)
(0.0
35)
(0.0
31)
Cen
sus
Dis
tric
t2
0.0
45
-0.0
11
-0.0
61
-0.0
15
0.0
32
0.0
01
-0.0
70
-0.0
14
(0.1
06)
(0.0
30)
(0.0
48)
(0.0
32)
(0.0
98)
(0.0
34)
(0.0
51)
(0.0
31)
Cen
sus
Dis
tric
t3
0.0
98
-0.0
87**
-0.1
17**
0.0
23
0.0
66
-0.0
68*
-0.1
15**
0.0
18
(0.1
04)
(0.0
40)
(0.0
56)
(0.0
32)
(0.1
21)
(0.0
37)
(0.0
58)
(0.0
34)
Cen
sus
Dis
tric
t4
0.1
22
-0.0
40
-0.0
98*
0.0
19
0.1
10
-0.0
32
-0.0
99*
0.0
17
(0.0
90)
(0.0
29)
(0.0
54)
(0.0
27)
(0.0
83)
(0.0
33)
(0.0
56)
(0.0
25)
Con
stant
1.4
36
0.8
66**
-0.0
37
-1.0
52**
1.4
46
0.9
03**
-0.1
28
-1.0
28**
(1.2
69)
(0.3
48)
(0.5
56)
(0.4
90)
(1.3
38)
(0.3
76)
(0.5
45)
(0.5
16)
Ob
serv
ati
on
s70
70
70
70
70
70
70
70
R-s
qu
are
d0.1
57
0.3
60
0.2
02
0.3
18
0.1
53
0.3
64
0.2
04
0.3
16
Res
ult
sfr
om
OL
Sre
gre
ssio
ns,
stan
dard
erro
rscl
ust
ered
at
the
regio
nal
level
inp
are
nth
eses
.***,
**,*
ind
icate
sign
ifica
nce
at
1-,
5-,
an
d10-p
erce
nt
level
,re
spec
tivel
y.
27
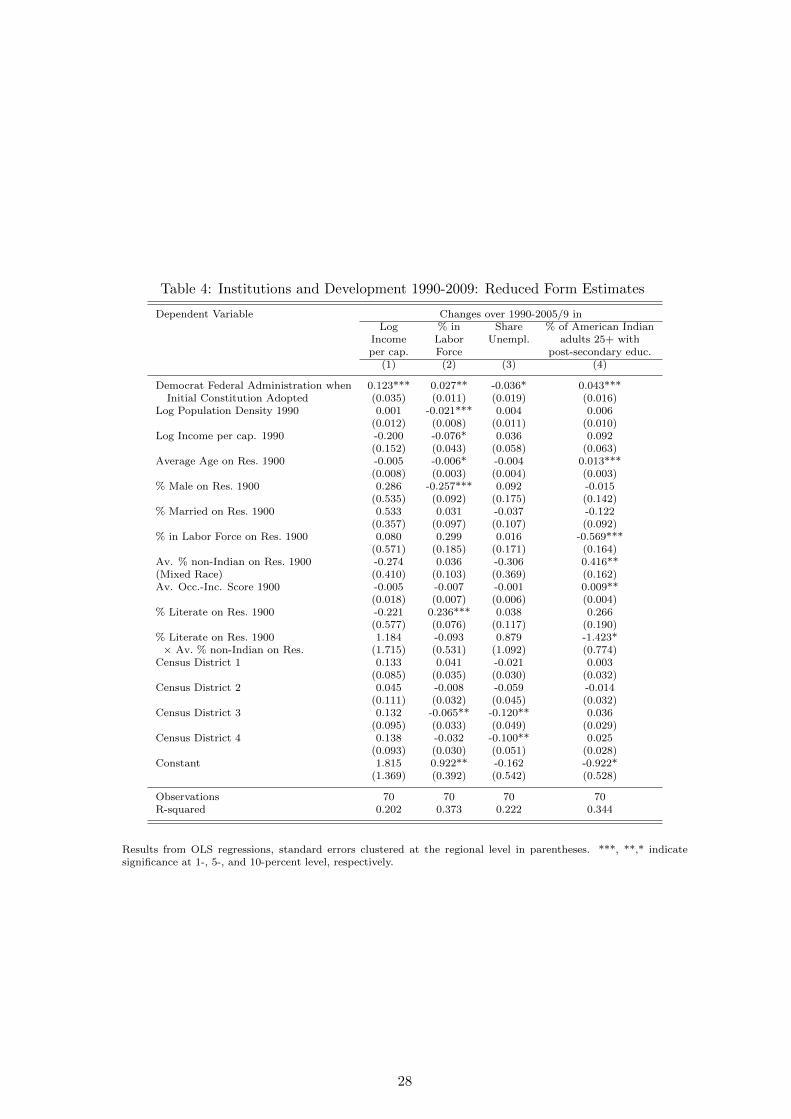
Table 4: Institutions and Development 1990-2009: Reduced Form Estimates
Dependent Variable Changes over 1990-2005/9 inLog % in Share % of American Indian
Income Labor Unempl. adults 25+ withper cap. Force post-secondary educ.
(1) (2) (3) (4)
Democrat Federal Administration when 0.123*** 0.027** -0.036* 0.043***Initial Constitution Adopted (0.035) (0.011) (0.019) (0.016)
Log Population Density 1990 0.001 -0.021*** 0.004 0.006(0.012) (0.008) (0.011) (0.010)
Log Income per cap. 1990 -0.200 -0.076* 0.036 0.092(0.152) (0.043) (0.058) (0.063)
Average Age on Res. 1900 -0.005 -0.006* -0.004 0.013***(0.008) (0.003) (0.004) (0.003)
% Male on Res. 1900 0.286 -0.257*** 0.092 -0.015(0.535) (0.092) (0.175) (0.142)
% Married on Res. 1900 0.533 0.031 -0.037 -0.122(0.357) (0.097) (0.107) (0.092)
% in Labor Force on Res. 1900 0.080 0.299 0.016 -0.569***(0.571) (0.185) (0.171) (0.164)
Av. % non-Indian on Res. 1900 -0.274 0.036 -0.306 0.416**(Mixed Race) (0.410) (0.103) (0.369) (0.162)Av. Occ.-Inc. Score 1900 -0.005 -0.007 -0.001 0.009**
(0.018) (0.007) (0.006) (0.004)% Literate on Res. 1900 -0.221 0.236*** 0.038 0.266
(0.577) (0.076) (0.117) (0.190)% Literate on Res. 1900 1.184 -0.093 0.879 -1.423*× Av. % non-Indian on Res. (1.715) (0.531) (1.092) (0.774)
Census District 1 0.133 0.041 -0.021 0.003(0.085) (0.035) (0.030) (0.032)
Census District 2 0.045 -0.008 -0.059 -0.014(0.111) (0.032) (0.045) (0.032)
Census District 3 0.132 -0.065** -0.120** 0.036(0.095) (0.033) (0.049) (0.029)
Census District 4 0.138 -0.032 -0.100** 0.025(0.093) (0.030) (0.051) (0.028)
Constant 1.815 0.922** -0.162 -0.922*(1.369) (0.392) (0.542) (0.528)
Observations 70 70 70 70R-squared 0.202 0.373 0.222 0.344
Results from OLS regressions, standard errors clustered at the regional level in parentheses. ***, **,* indicatesignificance at 1-, 5-, and 10-percent level, respectively.
28
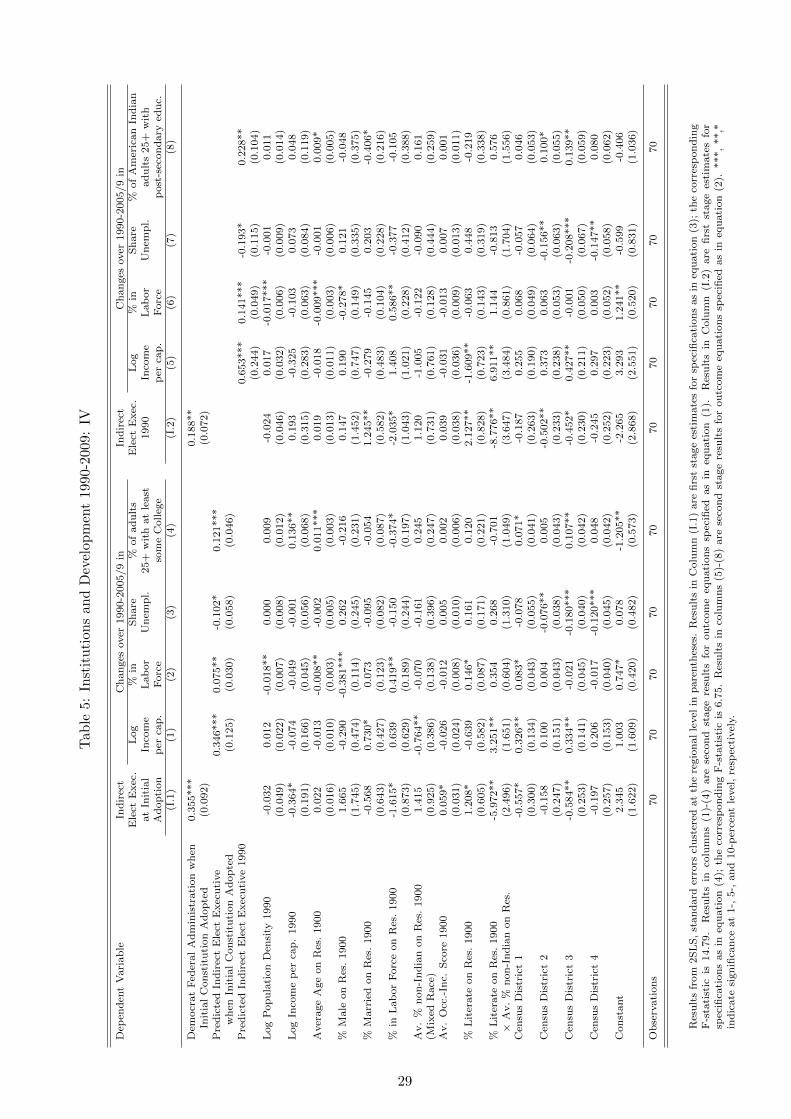
Tab
le5:
Inst
itu
tion
san
dD
evel
opm
ent
1990
-200
9:IV
Dep
end
ent
Vari
ab
leIn
dir
ect
Ch
an
ges
over
1990-2
005/9
inIn
dir
ect
Ch
an
ges
over
1990-2
005/9
inE
lect
Exec
.L
og
%in
Sh
are
%of
ad
ult
sE
lect
Exec
.L
og
%in
Sh
are
%of
Am
eric
an
Ind
ian
at
Init
ial
Inco
me
Lab
or
Un
emp
l.25+
wit
hat
least
1990
Inco
me
Lab
or
Un
emp
l.ad
ult
s25+
wit
hA
dop
tion
per
cap
.F
orc
eso
me
Colleg
ep
erca
p.
Forc
ep
ost
-sec
on
dary
edu
c.(I
.1)
(1)
(2)
(3)
(4)
(I.2
)(5
)(6
)(7
)(8
)
Dem
ocr
at
Fed
eral
Ad
min
istr
ati
on
wh
en0.3
55***
0.1
88**
Init
ial
Con
stit
uti
on
Ad
op
ted
(0.0
92)
(0.0
72)
Pre
dic
ted
Ind
irec
tE
lect
Exec
uti
ve
0.3
46***
0.0
75**
-0.1
02*
0.1
21***
wh
enIn
itia
lC
on
stit
uti
on
Ad
op
ted
(0.1
25)
(0.0
30)
(0.0
58)
(0.0
46)
Pre
dic
ted
Ind
irec
tE
lect
Exec
uti
ve
1990
0.6
53***
0.1
41***
-0.1
93*
0.2
28**
(0.2
44)
(0.0
49)
(0.1
15)
(0.1
04)
Log
Pop
ula
tion
Den
sity
1990
-0.0
32
0.0
12
-0.0
18**
0.0
00
0.0
09
-0.0
24
0.0
17
-0.0
17***
-0.0
01
0.0
11
(0.0
49)
(0.0
22)
(0.0
07)
(0.0
08)
(0.0
12)
(0.0
46)
(0.0
32)
(0.0
06)
(0.0
09)
(0.0
14)
Log
Inco
me
per
cap
.1990
-0.3
64*
-0.0
74
-0.0
49
-0.0
01
0.1
36**
0.1
93
-0.3
25
-0.1
03
0.0
73
0.0
48
(0.1
91)
(0.1
66)
(0.0
45)
(0.0
56)
(0.0
68)
(0.3
15)
(0.2
83)
(0.0
63)
(0.0
84)
(0.1
19)
Aver
age
Age
on
Res
.1900
0.0
22
-0.0
13
-0.0
08**
-0.0
02
0.0
11***
0.0
19
-0.0
18
-0.0
09***
-0.0
01
0.0
09*
(0.0
16)
(0.0
10)
(0.0
03)
(0.0
05)
(0.0
03)
(0.0
13)
(0.0
11)
(0.0
03)
(0.0
06)
(0.0
05)
%M
ale
on
Res
.1900
1.6
65
-0.2
90
-0.3
81***
0.2
62
-0.2
16
0.1
47
0.1
90
-0.2
78*
0.1
21
-0.0
48
(1.7
45)
(0.4
74)
(0.1
14)
(0.2
45)
(0.2
31)
(1.4
52)
(0.7
47)
(0.1
49)
(0.3
35)
(0.3
75)
%M
arr
ied
on
Res
.1900
-0.5
68
0.7
30*
0.0
73
-0.0
95
-0.0
54
1.2
45**
-0.2
79
-0.1
45
0.2
03
-0.4
06*
(0.6
43)
(0.4
27)
(0.1
23)
(0.0
82)
(0.0
87)
(0.5
82)
(0.4
83)
(0.1
04)
(0.2
28)
(0.2
16)
%in
Lab
or
Forc
eon
Res
.1900
-1.6
15*
0.6
39
0.4
19**
-0.1
50
-0.3
74*
-2.0
35*
1.4
08
0.5
86**
-0.3
77
-0.1
05
(0.8
73)
(0.6
29)
(0.1
89)
(0.2
44)
(0.1
97)
(1.0
43)
(1.0
21)
(0.2
28)
(0.4
12)
(0.3
88)
Av.
%n
on
-In
dia
non
Res
.1900
1.4
15
-0.7
64**
-0.0
70
-0.1
61
0.2
45
1.1
20
-1.0
05
-0.1
22
-0.0
90
0.1
61
(Mix
edR
ace
)(0
.925)
(0.3
86)
(0.1
38)
(0.3
96)
(0.2
47)
(0.7
31)
(0.7
61)
(0.1
28)
(0.4
44)
(0.2
59)
Av.
Occ
.-In
c.S
core
1900
0.0
59*
-0.0
26
-0.0
12
0.0
05
0.0
02
0.0
39
-0.0
31
-0.0
13
0.0
07
0.0
01
(0.0
31)
(0.0
24)
(0.0
08)
(0.0
10)
(0.0
06)
(0.0
38)
(0.0
36)
(0.0
09)
(0.0
13)
(0.0
11)
%L
iter
ate
on
Res
.1900
1.2
08*
-0.6
39
0.1
46*
0.1
61
0.1
20
2.1
27**
-1.6
09**
-0.0
63
0.4
48
-0.2
19
(0.6
05)
(0.5
82)
(0.0
87)
(0.1
71)
(0.2
21)
(0.8
28)
(0.7
23)
(0.1
43)
(0.3
19)
(0.3
38)
%L
iter
ate
on
Res
.1900
-5.9
72**
3.2
51**
0.3
54
0.2
68
-0.7
01
-8.7
76**
6.9
11**
1.1
44
-0.8
13
0.5
76
×A
v.
%n
on
-In
dia
non
Res
.(2
.496)
(1.6
51)
(0.6
04)
(1.3
10)
(1.0
49)
(3.6
47)
(3.4
84)
(0.8
61)
(1.7
04)
(1.5
56)
Cen
sus
Dis
tric
t1
-0.5
57*
0.3
26**
0.0
83*
-0.0
78
0.0
71*
-0.1
87
0.2
55
0.0
68
-0.0
57
0.0
46
(0.3
00)
(0.1
34)
(0.0
43)
(0.0
55)
(0.0
41)
(0.2
63)
(0.1
90)
(0.0
49)
(0.0
64)
(0.0
53)
Cen
sus
Dis
tric
t2
-0.1
58
0.1
00
0.0
04
-0.0
76**
0.0
05
-0.5
02**
0.3
73
0.0
63
-0.1
56**
0.1
00*
(0.2
47)
(0.1
51)
(0.0
43)
(0.0
38)
(0.0
43)
(0.2
33)
(0.2
38)
(0.0
53)
(0.0
63)
(0.0
55)
Cen
sus
Dis
tric
t3
-0.5
84**
0.3
34**
-0.0
21
-0.1
80***
0.1
07**
-0.4
52*
0.4
27**
-0.0
01
-0.2
08***
0.1
39**
(0.2
53)
(0.1
41)
(0.0
45)
(0.0
40)
(0.0
42)
(0.2
30)
(0.2
11)
(0.0
50)
(0.0
67)
(0.0
59)
Cen
sus
Dis
tric
t4
-0.1
97
0.2
06
-0.0
17
-0.1
20***
0.0
48
-0.2
45
0.2
97
0.0
03
-0.1
47**
0.0
80
(0.2
57)
(0.1
53)
(0.0
40)
(0.0
45)
(0.0
42)
(0.2
52)
(0.2
23)
(0.0
52)
(0.0
58)
(0.0
62)
Con
stant
2.3
45
1.0
03
0.7
47*
0.0
78
-1.2
05**
-2.2
65
3.2
93
1.2
41**
-0.5
99
-0.4
06
(1.6
22)
(1.6
09)
(0.4
20)
(0.4
82)
(0.5
73)
(2.8
68)
(2.5
51)
(0.5
20)
(0.8
31)
(1.0
36)
Ob
serv
ati
on
s70
70
70
70
70
70
70
70
70
70
Res
ult
sfr
om
2SL
S,
stan
dard
erro
rscl
ust
ered
at
the
regio
nal
level
inp
are
nth
eses
.R
esu
lts
inC
olu
mn
(I.1
)are
firs
tst
age
esti
mate
sfo
rsp
ecifi
cati
on
sas
ineq
uati
on
(3);
the
corr
esp
on
din
gF
-sta
tist
icis
14.7
9.
Res
ult
sin
colu
mn
s(1
)-(4
)are
seco
nd
stage
resu
lts
for
ou
tcom
eeq
uati
on
ssp
ecifi
edas
ineq
uati
on
(1).
Res
ult
sin
Colu
mn
(I.2
)are
firs
tst
age
esti
mate
sfo
rsp
ecifi
cati
on
sas
ineq
uati
on
(4);
the
corr
esp
on
din
gF
-sta
tist
icis
6.7
5.
Res
ult
sin
colu
mn
s(5
)-(8
)are
seco
nd
stage
resu
lts
for
ou
tcom
eeq
uati
on
ssp
ecifi
edas
ineq
uati
on
(2).
***,
**,*
ind
icate
sign
ifica
nce
at
1-,
5-,
an
d10-p
erce
nt
level
,re
spec
tivel
y.
29

Appendix: Additional Tables
30
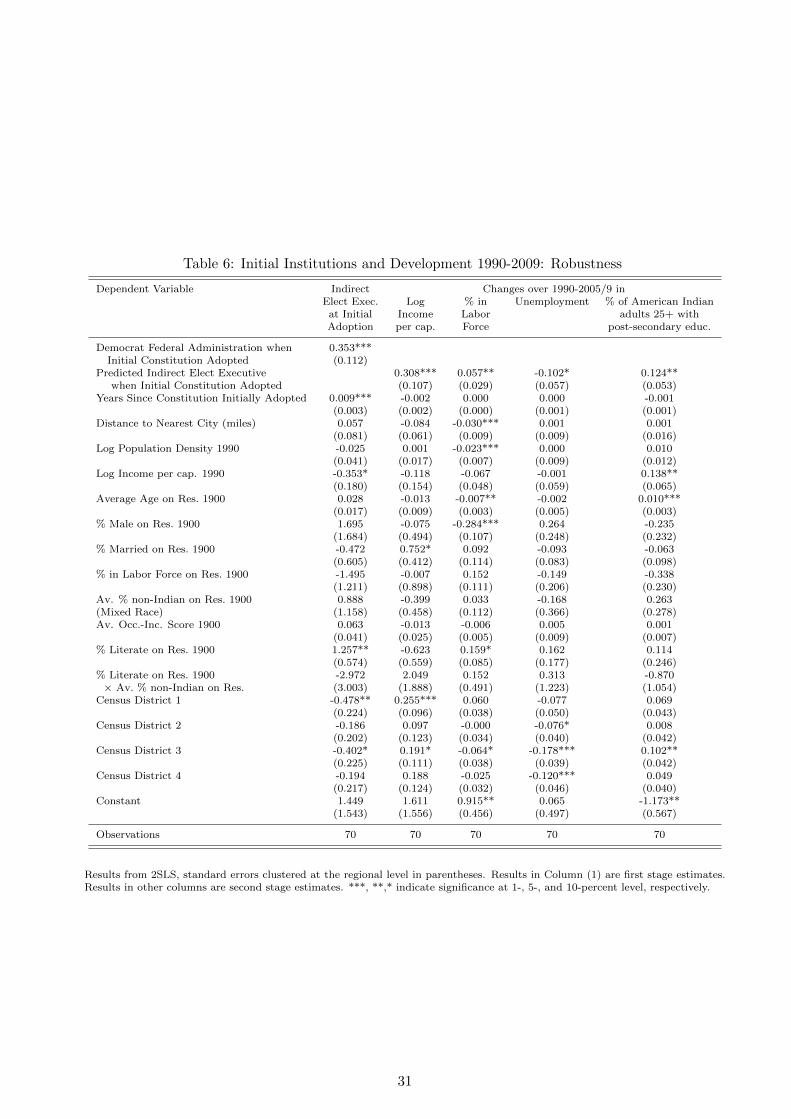
Table 6: Initial Institutions and Development 1990-2009: Robustness
Dependent Variable Indirect Changes over 1990-2005/9 inElect Exec. Log % in Unemployment % of American Indianat Initial Income Labor adults 25+ withAdoption per cap. Force post-secondary educ.
Democrat Federal Administration when 0.353***Initial Constitution Adopted (0.112)
Predicted Indirect Elect Executive 0.308*** 0.057** -0.102* 0.124**when Initial Constitution Adopted (0.107) (0.029) (0.057) (0.053)
Years Since Constitution Initially Adopted 0.009*** -0.002 0.000 0.000 -0.001(0.003) (0.002) (0.000) (0.001) (0.001)
Distance to Nearest City (miles) 0.057 -0.084 -0.030*** 0.001 0.001(0.081) (0.061) (0.009) (0.009) (0.016)
Log Population Density 1990 -0.025 0.001 -0.023*** 0.000 0.010(0.041) (0.017) (0.007) (0.009) (0.012)
Log Income per cap. 1990 -0.353* -0.118 -0.067 -0.001 0.138**(0.180) (0.154) (0.048) (0.059) (0.065)
Average Age on Res. 1900 0.028 -0.013 -0.007** -0.002 0.010***(0.017) (0.009) (0.003) (0.005) (0.003)
% Male on Res. 1900 1.695 -0.075 -0.284*** 0.264 -0.235(1.684) (0.494) (0.107) (0.248) (0.232)
% Married on Res. 1900 -0.472 0.752* 0.092 -0.093 -0.063(0.605) (0.412) (0.114) (0.083) (0.098)
% in Labor Force on Res. 1900 -1.495 -0.007 0.152 -0.149 -0.338(1.211) (0.898) (0.111) (0.206) (0.230)
Av. % non-Indian on Res. 1900 0.888 -0.399 0.033 -0.168 0.263(Mixed Race) (1.158) (0.458) (0.112) (0.366) (0.278)Av. Occ.-Inc. Score 1900 0.063 -0.013 -0.006 0.005 0.001
(0.041) (0.025) (0.005) (0.009) (0.007)% Literate on Res. 1900 1.257** -0.623 0.159* 0.162 0.114
(0.574) (0.559) (0.085) (0.177) (0.246)% Literate on Res. 1900 -2.972 2.049 0.152 0.313 -0.870× Av. % non-Indian on Res. (3.003) (1.888) (0.491) (1.223) (1.054)
Census District 1 -0.478** 0.255*** 0.060 -0.077 0.069(0.224) (0.096) (0.038) (0.050) (0.043)
Census District 2 -0.186 0.097 -0.000 -0.076* 0.008(0.202) (0.123) (0.034) (0.040) (0.042)
Census District 3 -0.402* 0.191* -0.064* -0.178*** 0.102**(0.225) (0.111) (0.038) (0.039) (0.042)
Census District 4 -0.194 0.188 -0.025 -0.120*** 0.049(0.217) (0.124) (0.032) (0.046) (0.040)
Constant 1.449 1.611 0.915** 0.065 -1.173**(1.543) (1.556) (0.456) (0.497) (0.567)
Observations 70 70 70 70 70
Results from 2SLS, standard errors clustered at the regional level in parentheses. Results in Column (1) are first stage estimates.Results in other columns are second stage estimates. ***, **,* indicate significance at 1-, 5-, and 10-percent level, respectively.
31
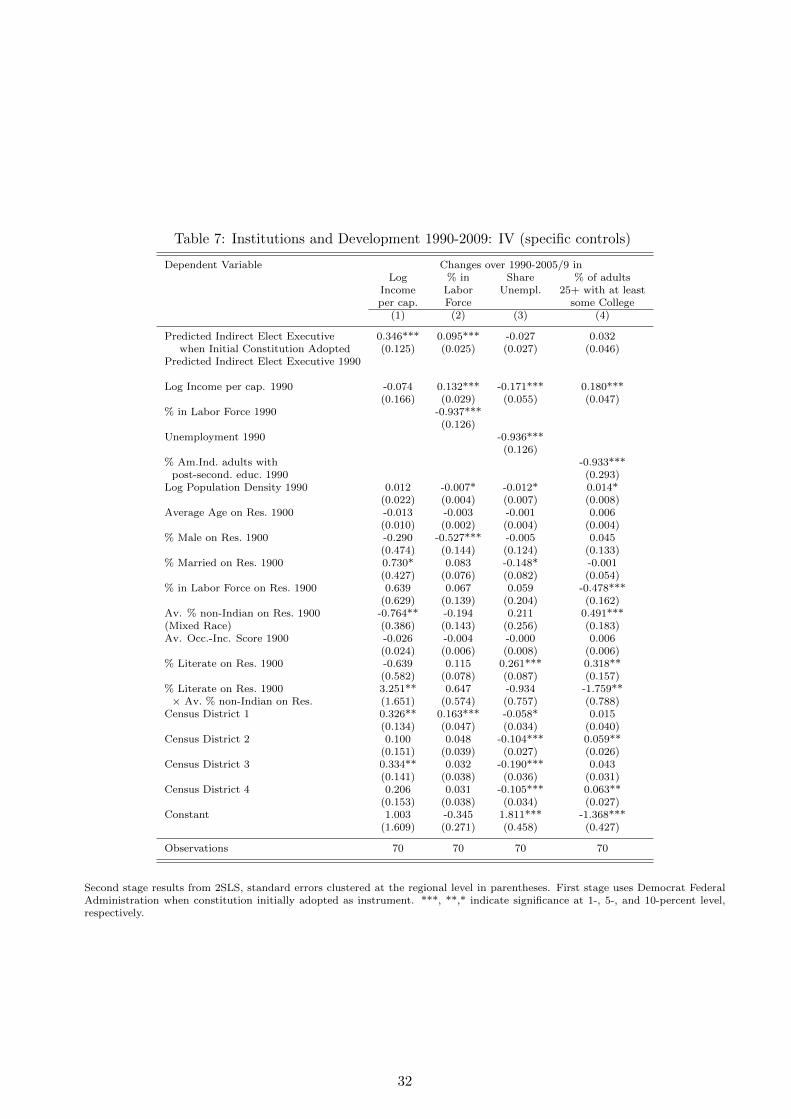
Table 7: Institutions and Development 1990-2009: IV (specific controls)
Dependent Variable Changes over 1990-2005/9 inLog % in Share % of adults
Income Labor Unempl. 25+ with at leastper cap. Force some College
(1) (2) (3) (4)
Predicted Indirect Elect Executive 0.346*** 0.095*** -0.027 0.032when Initial Constitution Adopted (0.125) (0.025) (0.027) (0.046)
Predicted Indirect Elect Executive 1990
Log Income per cap. 1990 -0.074 0.132*** -0.171*** 0.180***(0.166) (0.029) (0.055) (0.047)
% in Labor Force 1990 -0.937***(0.126)
Unemployment 1990 -0.936***(0.126)
% Am.Ind. adults with -0.933***post-second. educ. 1990 (0.293)
Log Population Density 1990 0.012 -0.007* -0.012* 0.014*(0.022) (0.004) (0.007) (0.008)
Average Age on Res. 1900 -0.013 -0.003 -0.001 0.006(0.010) (0.002) (0.004) (0.004)
% Male on Res. 1900 -0.290 -0.527*** -0.005 0.045(0.474) (0.144) (0.124) (0.133)
% Married on Res. 1900 0.730* 0.083 -0.148* -0.001(0.427) (0.076) (0.082) (0.054)
% in Labor Force on Res. 1900 0.639 0.067 0.059 -0.478***(0.629) (0.139) (0.204) (0.162)
Av. % non-Indian on Res. 1900 -0.764** -0.194 0.211 0.491***(Mixed Race) (0.386) (0.143) (0.256) (0.183)Av. Occ.-Inc. Score 1900 -0.026 -0.004 -0.000 0.006
(0.024) (0.006) (0.008) (0.006)% Literate on Res. 1900 -0.639 0.115 0.261*** 0.318**
(0.582) (0.078) (0.087) (0.157)% Literate on Res. 1900 3.251** 0.647 -0.934 -1.759**× Av. % non-Indian on Res. (1.651) (0.574) (0.757) (0.788)
Census District 1 0.326** 0.163*** -0.058* 0.015(0.134) (0.047) (0.034) (0.040)
Census District 2 0.100 0.048 -0.104*** 0.059**(0.151) (0.039) (0.027) (0.026)
Census District 3 0.334** 0.032 -0.190*** 0.043(0.141) (0.038) (0.036) (0.031)
Census District 4 0.206 0.031 -0.105*** 0.063**(0.153) (0.038) (0.034) (0.027)
Constant 1.003 -0.345 1.811*** -1.368***(1.609) (0.271) (0.458) (0.427)
Observations 70 70 70 70
Second stage results from 2SLS, standard errors clustered at the regional level in parentheses. First stage uses Democrat FederalAdministration when constitution initially adopted as instrument. ***, **,* indicate significance at 1-, 5-, and 10-percent level,respectively.
32
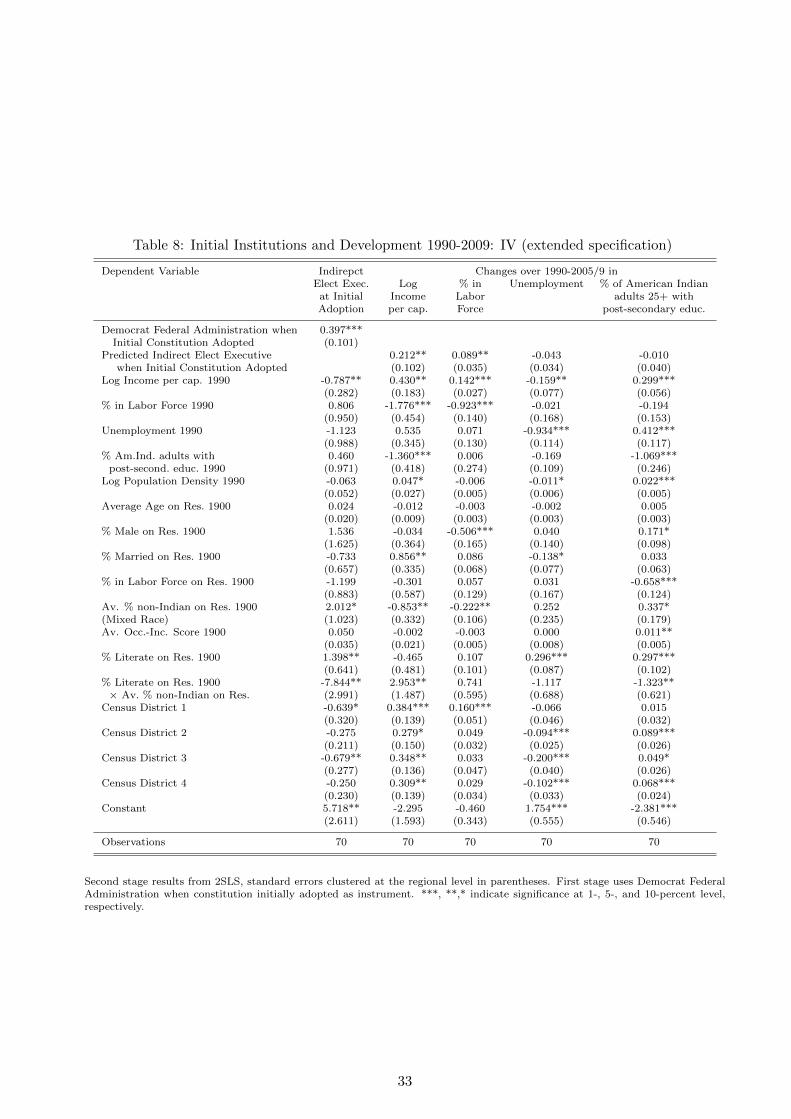
Table 8: Initial Institutions and Development 1990-2009: IV (extended specification)
Dependent Variable Indirepct Changes over 1990-2005/9 inElect Exec. Log % in Unemployment % of American Indianat Initial Income Labor adults 25+ withAdoption per cap. Force post-secondary educ.
Democrat Federal Administration when 0.397***Initial Constitution Adopted (0.101)
Predicted Indirect Elect Executive 0.212** 0.089** -0.043 -0.010when Initial Constitution Adopted (0.102) (0.035) (0.034) (0.040)
Log Income per cap. 1990 -0.787** 0.430** 0.142*** -0.159** 0.299***(0.282) (0.183) (0.027) (0.077) (0.056)
% in Labor Force 1990 0.806 -1.776*** -0.923*** -0.021 -0.194(0.950) (0.454) (0.140) (0.168) (0.153)
Unemployment 1990 -1.123 0.535 0.071 -0.934*** 0.412***(0.988) (0.345) (0.130) (0.114) (0.117)
% Am.Ind. adults with 0.460 -1.360*** 0.006 -0.169 -1.069***post-second. educ. 1990 (0.971) (0.418) (0.274) (0.109) (0.246)
Log Population Density 1990 -0.063 0.047* -0.006 -0.011* 0.022***(0.052) (0.027) (0.005) (0.006) (0.005)
Average Age on Res. 1900 0.024 -0.012 -0.003 -0.002 0.005(0.020) (0.009) (0.003) (0.003) (0.003)
% Male on Res. 1900 1.536 -0.034 -0.506*** 0.040 0.171*(1.625) (0.364) (0.165) (0.140) (0.098)
% Married on Res. 1900 -0.733 0.856** 0.086 -0.138* 0.033(0.657) (0.335) (0.068) (0.077) (0.063)
% in Labor Force on Res. 1900 -1.199 -0.301 0.057 0.031 -0.658***(0.883) (0.587) (0.129) (0.167) (0.124)
Av. % non-Indian on Res. 1900 2.012* -0.853** -0.222** 0.252 0.337*(Mixed Race) (1.023) (0.332) (0.106) (0.235) (0.179)Av. Occ.-Inc. Score 1900 0.050 -0.002 -0.003 0.000 0.011**
(0.035) (0.021) (0.005) (0.008) (0.005)% Literate on Res. 1900 1.398** -0.465 0.107 0.296*** 0.297***
(0.641) (0.481) (0.101) (0.087) (0.102)% Literate on Res. 1900 -7.844** 2.953** 0.741 -1.117 -1.323**× Av. % non-Indian on Res. (2.991) (1.487) (0.595) (0.688) (0.621)
Census District 1 -0.639* 0.384*** 0.160*** -0.066 0.015(0.320) (0.139) (0.051) (0.046) (0.032)
Census District 2 -0.275 0.279* 0.049 -0.094*** 0.089***(0.211) (0.150) (0.032) (0.025) (0.026)
Census District 3 -0.679** 0.348** 0.033 -0.200*** 0.049*(0.277) (0.136) (0.047) (0.040) (0.026)
Census District 4 -0.250 0.309** 0.029 -0.102*** 0.068***(0.230) (0.139) (0.034) (0.033) (0.024)
Constant 5.718** -2.295 -0.460 1.754*** -2.381***(2.611) (1.593) (0.343) (0.555) (0.546)
Observations 70 70 70 70 70
Second stage results from 2SLS, standard errors clustered at the regional level in parentheses. First stage uses Democrat FederalAdministration when constitution initially adopted as instrument. ***, **,* indicate significance at 1-, 5-, and 10-percent level,respectively.
33

Table 9: Initial Institutions and Development 1990-2009: IV Results Controlling for Other ConstitutionalDetails
Dependent Variable Change in log Income per capita 1990-2005/9
Predicted Indirect Elect Executive 0.430** 0.408* 0.403** 0.350** 0.383** 0.321** 0.603*when Initial Constitution Adopted (0.198) (0.212) (0.193) (0.141) (0.189) (0.125) (0.314)
Judiciary Exists? 0.164 0.271(0.116) (0.167)
Staggered Election Terms? -0.040 -0.110(0.067) (0.077)
Term Length -0.001 -0.003(0.001) (0.003)
Council Directly Elected? 0.238** 0.330*(0.106) (0.179)
Tribal Council Size -0.001 0.002(0.001) (0.003)
Operates a Casino? -0.012 0.036(0.052) (0.095)
Observations 70 68 68 68 68 70 68
Second stage results from 2SLS regressions, standard errors clustered at the regional level in parentheses. All specifications includethe standard control variables as in Table 3, but coefficients are not shown for reasons of space. First stages correspond toappropriately modified specifications of (3). ***, **,* indicate significance at 1-, 5-, and 10-percent level, respectively.
34
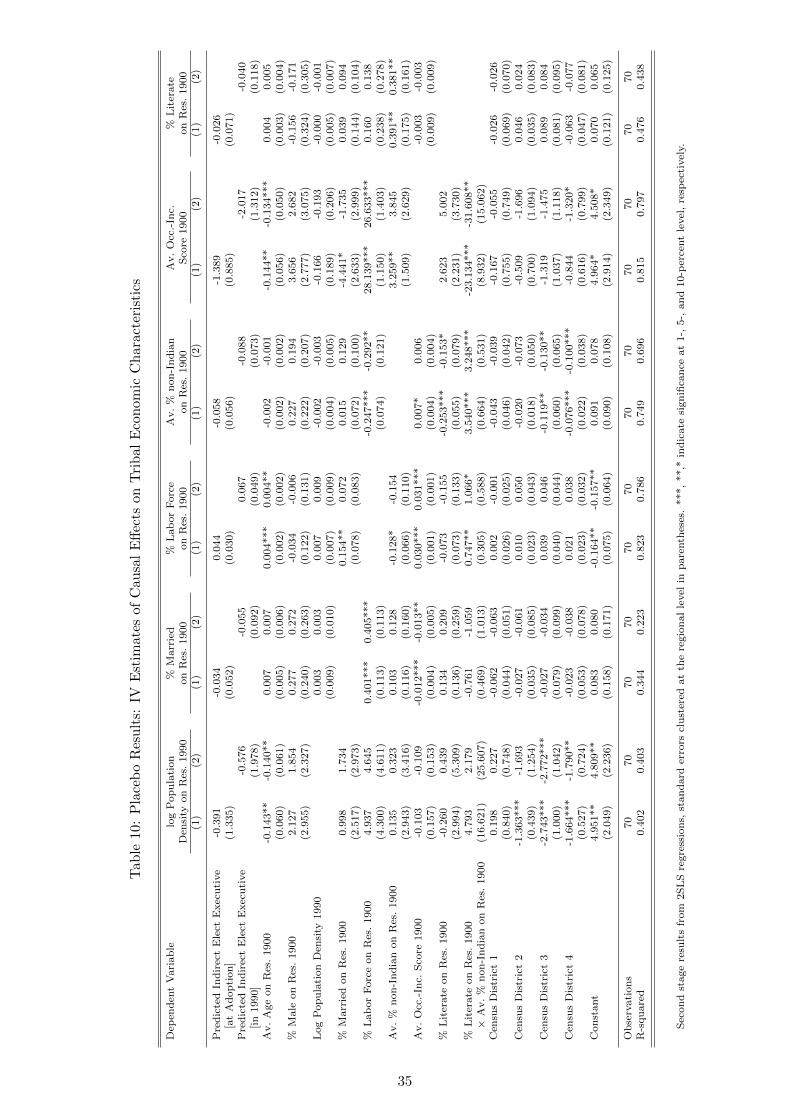
Tab
le10:
Pla
ceb
oR
esu
lts:
IVE
stim
ates
ofC
ausa
lE
ffec
tson
Tri
bal
Eco
nom
icC
har
acte
rist
ics
Dep
end
ent
Vari
ab
lelo
gP
op
ula
tion
%M
arr
ied
%L
ab
or
Forc
eA
v.
%n
on
-In
dia
nA
v.
Occ
.-In
c.%
Lit
erate
Den
sity
on
Res
.1990
on
Res
.1900
on
Res
.1900
on
Res
.1900
Sco
re1900
on
Res
.1900
(1)
(2)
(1)
(2)
(1)
(2)
(1)
(2)
(1)
(2)
(1)
(2)
Pre
dic
ted
Ind
irec
tE
lect
Exec
uti
ve
-0.3
91
-0.0
34
0.0
44
-0.0
58
-1.3
89
-0.0
26
[at
Ad
op
tion
](1
.335)
(0.0
52)
(0.0
30)
(0.0
56)
(0.8
85)
(0.0
71)
Pre
dic
ted
Ind
irec
tE
lect
Exec
uti
ve
-0.5
76
-0.0
55
0.0
67
-0.0
88
-2.0
17
-0.0
40
[in
1990]
(1.9
78)
(0.0
92)
(0.0
49)
(0.0
73)
(1.3
12)
(0.1
18)
Av.
Age
on
Res
.1900
-0.1
43**
-0.1
40**
0.0
07
0.0
07
0.0
04***
0.0
04**
-0.0
02
-0.0
01
-0.1
44**
-0.1
34***
0.0
04
0.0
05
(0.0
60)
(0.0
61)
(0.0
05)
(0.0
06)
(0.0
02)
(0.0
02)
(0.0
02)
(0.0
02)
(0.0
56)
(0.0
50)
(0.0
03)
(0.0
04)
%M
ale
on
Res
.1900
2.1
27
1.8
54
0.2
77
0.2
72
-0.0
34
-0.0
06
0.2
27
0.1
94
3.6
56
2.6
82
-0.1
56
-0.1
71
(2.9
55)
(2.3
27)
(0.2
40)
(0.2
63)
(0.1
22)
(0.1
31)
(0.2
22)
(0.2
07)
(2.7
77)
(3.0
75)
(0.3
24)
(0.3
05)
Log
Pop
ula
tion
Den
sity
1990
0.0
03
0.0
03
0.0
07
0.0
09
-0.0
02
-0.0
03
-0.1
66
-0.1
93
-0.0
00
-0.0
01
(0.0
09)
(0.0
10)
(0.0
07)
(0.0
09)
(0.0
04)
(0.0
05)
(0.1
89)
(0.2
06)
(0.0
05)
(0.0
07)
%M
arr
ied
on
Res
.1900
0.9
98
1.7
34
0.1
54**
0.0
72
0.0
15
0.1
29
-4.4
41*
-1.7
35
0.0
39
0.0
94
(2.5
17)
(2.9
73)
(0.0
78)
(0.0
83)
(0.0
72)
(0.1
00)
(2.6
33)
(2.9
99)
(0.1
44)
(0.1
04)
%L
ab
or
Forc
eon
Res
.1900
4.9
37
4.6
45
0.4
01***
0.4
05***
-0.2
47***
-0.2
92**
28.1
39***
26.6
33***
0.1
60
0.1
38
(4.3
00)
(4.6
11)
(0.1
13)
(0.1
13)
(0.0
74)
(0.1
21)
(1.1
50)
(1.4
03)
(0.2
38)
(0.2
78)
Av.
%n
on
-In
dia
non
Res
.1900
0.1
35
0.3
23
0.1
03
0.1
28
-0.1
28*
-0.1
54
3.2
59**
3.8
45
0.3
91**
0.3
81**
(2.9
43)
(3.4
16)
(0.1
16)
(0.1
60)
(0.0
66)
(0.1
10)
(1.5
09)
(2.6
29)
(0.1
75)
(0.1
61)
Av.
Occ
.-In
c.S
core
1900
-0.1
03
-0.1
09
-0.0
12***
-0.0
13**
0.0
30***
0.0
31***
0.0
07*
0.0
06
-0.0
03
-0.0
03
(0.1
57)
(0.1
53)
(0.0
04)
(0.0
05)
(0.0
01)
(0.0
01)
(0.0
04)
(0.0
04)
(0.0
09)
(0.0
09)
%L
iter
ate
on
Res
.1900
-0.2
60
0.4
39
0.1
34
0.2
09
-0.0
73
-0.1
55
-0.2
53***
-0.1
53*
2.6
23
5.0
02
(2.9
94)
(5.3
09)
(0.1
36)
(0.2
59)
(0.0
73)
(0.1
33)
(0.0
55)
(0.0
79)
(2.2
31)
(3.7
30)
%L
iter
ate
on
Res
.1900
4.7
93
2.1
79
-0.7
61
-1.0
59
0.7
47**
1.0
66*
3.5
40***
3.2
48***
-23.1
34***
-31.6
08**
×A
v.
%n
on
-In
dia
non
Res
.1900
(16.6
21)
(25.6
07)
(0.4
69)
(1.0
13)
(0.3
05)
(0.5
88)
(0.6
64)
(0.5
31)
(8.9
32)
(15.0
62)
Cen
sus
Dis
tric
t1
0.1
98
0.2
27
-0.0
62
-0.0
63
0.0
02
-0.0
01
-0.0
43
-0.0
39
-0.1
67
-0.0
55
-0.0
26
-0.0
26
(0.8
40)
(0.7
48)
(0.0
44)
(0.0
51)
(0.0
26)
(0.0
25)
(0.0
46)
(0.0
42)
(0.7
55)
(0.7
49)
(0.0
69)
(0.0
70)
Cen
sus
Dis
tric
t2
-1.3
63***
-1.6
93
-0.0
27
-0.0
61
0.0
10
0.0
50
-0.0
20
-0.0
73
-0.5
09
-1.6
96
0.0
46
0.0
24
(0.4
39)
(1.2
54)
(0.0
35)
(0.0
85)
(0.0
23)
(0.0
43)
(0.0
18)
(0.0
50)
(0.7
00)
(1.0
94)
(0.0
35)
(0.0
83)
Cen
sus
Dis
tric
t3
-2.7
43***
-2.7
72***
-0.0
27
-0.0
34
0.0
39
0.0
46
-0.1
19**
-0.1
30**
-1.3
19
-1.4
75
0.0
89
0.0
84
(1.0
00)
(1.0
42)
(0.0
79)
(0.0
99)
(0.0
40)
(0.0
44)
(0.0
60)
(0.0
65)
(1.0
37)
(1.1
18)
(0.0
81)
(0.0
95)
Cen
sus
Dis
tric
t4
-1.6
64***
-1.7
90**
-0.0
23
-0.0
38
0.0
21
0.0
38
-0.0
76***
-0.1
00***
-0.8
44
-1.3
20*
-0.0
63
-0.0
77
(0.5
27)
(0.7
24)
(0.0
53)
(0.0
78)
(0.0
23)
(0.0
32)
(0.0
22)
(0.0
38)
(0.6
16)
(0.7
99)
(0.0
47)
(0.0
81)
Con
stant
4.9
51**
4.8
09**
0.0
83
0.0
80
-0.1
64**
-0.1
57**
0.0
91
0.0
78
4.9
64*
4.5
08*
0.0
70
0.0
65
(2.0
49)
(2.2
36)
(0.1
58)
(0.1
71)
(0.0
75)
(0.0
64)
(0.0
90)
(0.1
08)
(2.9
14)
(2.3
49)
(0.1
21)
(0.1
25)
Ob
serv
ati
on
s70
70
70
70
70
70
70
70
70
70
70
70
R-s
qu
are
d0.4
02
0.4
03
0.3
44
0.2
23
0.8
23
0.7
86
0.7
49
0.6
96
0.8
15
0.7
97
0.4
76
0.4
38
Sec
on
dst
age
resu
lts
from
2S
LS
regre
ssio
ns,
stan
dard
erro
rscl
ust
ered
at
the
regio
nal
level
inp
are
nth
eses
.***,
**,*
ind
icate
sign
ifica
nce
at
1-,
5-,
an
d10-p
erce
nt
level
,re
spec
tivel
y.
35
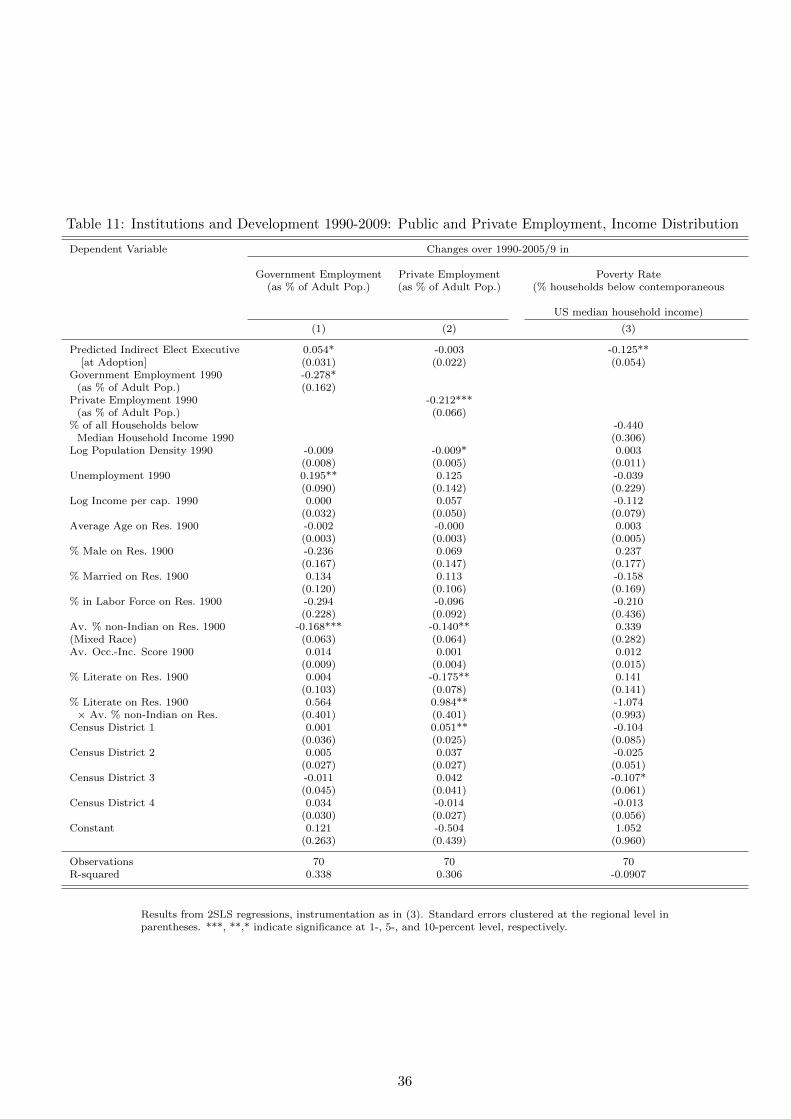
Table 11: Institutions and Development 1990-2009: Public and Private Employment, Income Distribution
Dependent Variable Changes over 1990-2005/9 in
Government Employment Private Employment Poverty Rate(as % of Adult Pop.) (as % of Adult Pop.) (% households below contemporaneous
US median household income)
(1) (2) (3)
Predicted Indirect Elect Executive 0.054* -0.003 -0.125**[at Adoption] (0.031) (0.022) (0.054)
Government Employment 1990 -0.278*(as % of Adult Pop.) (0.162)
Private Employment 1990 -0.212***(as % of Adult Pop.) (0.066)
% of all Households below -0.440Median Household Income 1990 (0.306)
Log Population Density 1990 -0.009 -0.009* 0.003(0.008) (0.005) (0.011)
Unemployment 1990 0.195** 0.125 -0.039(0.090) (0.142) (0.229)
Log Income per cap. 1990 0.000 0.057 -0.112(0.032) (0.050) (0.079)
Average Age on Res. 1900 -0.002 -0.000 0.003(0.003) (0.003) (0.005)
% Male on Res. 1900 -0.236 0.069 0.237(0.167) (0.147) (0.177)
% Married on Res. 1900 0.134 0.113 -0.158(0.120) (0.106) (0.169)
% in Labor Force on Res. 1900 -0.294 -0.096 -0.210(0.228) (0.092) (0.436)
Av. % non-Indian on Res. 1900 -0.168*** -0.140** 0.339(Mixed Race) (0.063) (0.064) (0.282)Av. Occ.-Inc. Score 1900 0.014 0.001 0.012
(0.009) (0.004) (0.015)% Literate on Res. 1900 0.004 -0.175** 0.141
(0.103) (0.078) (0.141)% Literate on Res. 1900 0.564 0.984** -1.074× Av. % non-Indian on Res. (0.401) (0.401) (0.993)
Census District 1 0.001 0.051** -0.104(0.036) (0.025) (0.085)
Census District 2 0.005 0.037 -0.025(0.027) (0.027) (0.051)
Census District 3 -0.011 0.042 -0.107*(0.045) (0.041) (0.061)
Census District 4 0.034 -0.014 -0.013(0.030) (0.027) (0.056)
Constant 0.121 -0.504 1.052(0.263) (0.439) (0.960)
Observations 70 70 70R-squared 0.338 0.306 -0.0907
Results from 2SLS regressions, instrumentation as in (3). Standard errors clustered at the regional level inparentheses. ***, **,* indicate significance at 1-, 5-, and 10-percent level, respectively.
36