considerations for chemical flooding - uw · p –oil recovery e d ... fluid flow...
TRANSCRIPT

Considerations for Chemical Flooding
Malcolm J. Pitts
Wyoming EOR CO2 ConferenceCasper, Wyoming
July 15th and 16th

WHY EOR?
Significant oil in discovered reservoirs
• Typically ~70% of OOIP remains in
reservoir when abandonded
EOR is technical innovation
• Economically unlocks oil that would
otherwise not be recovered
EOR is needed to supply current and
future oil demand
2
Source: J. Pet. Technology (March 2015)

MODERN OIL FIELD ECONOMICS
Source: Citi Investment Research and Analysis (Oil in 2012)
Cost curve for oil projects to come on stream by 2020
Upper limit of chemical EOR
3

Global CEOR potential estimated to be ~750 billion barrels
4
CHEMICAL EOR
• Significant potential in all regions of the world
• Chemical EOR accounts for ~2% of the worlds EOR production
(OGJ EOR Survey, April 2010)

OOIPEEEN VIADp
Np – Oil Recovery
ED – Pore to Pore (Unit) Displacement Efficiency (Capillary Mechanism – How well does injected fluid move oil)
EA – Areal Displacement Efficiency(Mobility Control Mechanism)
EVI – Vertical Displacement Efficiency(Mobility Control Mechanism, Conformance Technologies)
OOIP – Original Oil in Place
Volumetric Sweep Efficiency
5
OIL RECOVERY EQUATION

6
PORE TO PORE DISPLACEMENT EFFICIENCY (ED)
SOi – Initial Oil Saturation
SOr – Residual Oil Saturation
SOi = 0.77
SOr = 0.3
ED = 0.61

areatotal
agentdisplacingbycontactedareaEA
7
AREAL DISPLACEMENT EFFICIENCY (EA)

areationalseccrossverticaltotal
agentdisplacingbycontactedareationalseccrossverticalEVI
8
VERTICAL DISPLACEMENT EFFICIENCY (EVI)
Higher Permeability
Lower Permeability

ED = Unit Displacement Efficiencyrepresents the pore to pore displacement efficiency
microscopic displacement efficiency
ED improved by surfactant and alkali
EV = Volumetric Sweep Efficiencymacroscopic displacement efficiency
EV improved by polymer
A
S
P
9
OIL RECOVERY EQUATION

10
CHEMICAL EOR FIELD APPLICATION
Chemical EOR Produces 10-20% incremental original oil in place
Implemented in Stages1. ASP stage – mobilizes oil creating an oil bank
2. Polymer stage – pushes oil bank to producer
3. Water stage – final push to finish the project
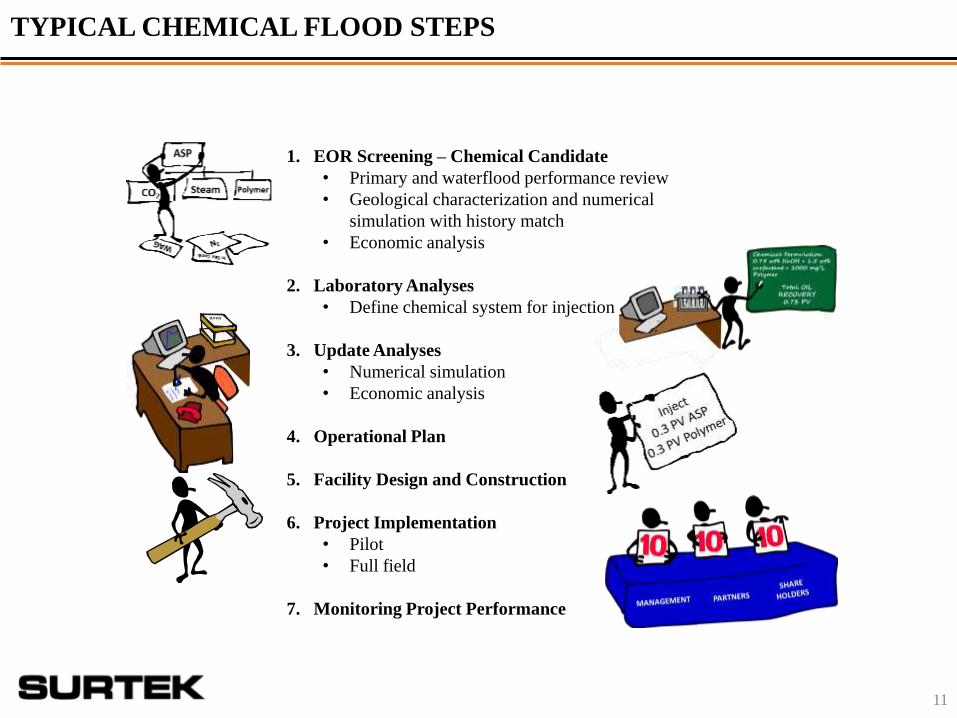
1. EOR Screening – Chemical Candidate
• Primary and waterflood performance review
• Geological characterization and numerical
simulation with history match
• Economic analysis
2. Laboratory Analyses
• Define chemical system for injection
3. Update Analyses
• Numerical simulation
• Economic analysis
4. Operational Plan
5. Facility Design and Construction
6. Project Implementation
• Pilot
• Full field
7. Monitoring Project Performance
11
TYPICAL CHEMICAL FLOOD STEPS

12
EOR SCREENING
Main Screening objective: Prevent adverse project selection
• Identify red flags that should stop the project now
Main parts to screening a chemical EOR project
Reservoir Review
• Reservoir properties
• Field location and logistics
• Calculate floodable pore volume
Recovery + Economic Estimation
• Estimate potential recoveries based on analogous fields
• Estimate capital investments
• Estimate economic recoveries

1. Good Waterflood Performance (candidate)
2. Permeability > 25 mD
3. Permeability Variation
4. Sufficient Target Oil Saturation
• Distribution of Oil Saturation
5. Water for Dissolving Chemicals
• Chemical Analysis
6. Crude Oil Viscosity < 5000 cP
7. Mobility Ratio
8. Temperature < 250°F
9. Impact of Bottom Water Drive
10.Sufficient Injection Capacity
• 1 PV < 20 yrs (Or additional wells needed)
13
BASIC RESERVOIR SCREENING
CHEMICAL FLOOD SCREENING CRITERIA

OOIPEEEN VIADp
Np – Oil Recovery
ED – Pore to Pore (Unit) Displacement Efficiency (Capillary Mechanism – How well does injected fluid move oil)
EA – Areal Displacement Efficiency(Mobility Control Mechanism)
EVI – Vertical Displacement Efficiency(Mobility Control Mechanism, Conformance Technologies)
OOIP – Original Oil in Place
Volumetric Sweep Efficiency
14
OIL RECOVERY EQUATION

IFT
• Capillary Pressure
• Viscous Forces (function of Capillary Pressure)
r
1-
r
1 2 P - P = P
21
ww 21
KL
P
15
CAPILLARY NUMBER MECHANISM

16
CAPILLARY NUMBER MECHANISM

Figure 2-1 Interfacial Tension vs. pH at Constant Ionic Strength
Alkaline Agents used in Chemical EOR
• Sodium carbonate (Na2CO3, soda ash)
• Sodium hydroxide (NaOH, caustic soda)
• Potassium hydroxide (KOH, pot ash)
• Sodium metaborate (NaBO2*4H2O)
• Tri-sodium phosphate (Na3PO4)
IFT is mostly dependent
on pH and ionic strength
Cheap
Expensive
17
ALKALINE AGENTS
1000
171

Main Function of Surfactant:
• Reduce interfacial tension
Surfactant:
• “Surface Active Agent”
• Reduces the interfacial tension between oil and water
18
SURFACTANTS

19
ALKALI IFT REDUCTION

20
ALKALI-SURFACTANT IFT REDUCTION
42 API
22 API
0.0 0.5 1.0 1.5 2.0 2.5
Alkali Concentration (wt%)
0.001
0.010
0.100
1.000
10.000
Inte
rfacia
l T
en
sio
n (
mN
/m)
solid - NaOH plus Surfactant
dashed - Na2CO
3+ Surfactant

Alkali
• Reduce Interfacial Tension
• reacts with oil to form surfactants
• Change Chemistry of Rock
• alters rock chemistry, changing rock wettability to more water wet
• alters rock chemistry, reducing polymer and surfactant adsorption
• Enhance Utility of Other Chemicals
• adjusts pH and salinity
• reduces polymer size allowing entry into small pores
• protects polymer from divalent cations in the reservoir
• allows polyacrylamide polymers to flood higher temperature
• stabilizes polyacrylamide to H2S catalyzed oxidative degradation
• Acts as a Mild Biocide
Surfactant
• reduces oil-water interfacial tension
Alkali + Surfactant
• synergistic interfacial tension reduction
21
ALKALI AND SURFACTANT

OOIPEEEN VIADp Need to understand
• Mobility Ratio
• Fractional Flow
Np – Oil Recovery
ED – Pore to Pore (Unit) Displacement Efficiency
EA – Areal Displacement Efficiency(Mobility Control Mechanism)
EVI – Vertical Displacement Efficiency(Mobility Control Mechanism)
OOIP – Original Oil in Place
Volumetric Sweep Efficiency
22
OIL RECOVERY EQUATION

Mobility Ratio – Measure of the efficiency by which a fluid can displace oil
phasedisplacedofMobility
phasedisplacingofMobilityRatioMobility
oro
wrw
K
KRatioMobility
/
/
Always evaluate kro
at conditions ahead
of front
Evaluate krw at
conditions behind
front
23
MOBILITY RATIO
Kr based on different saturations

Unfavorable Mobility Ratio > 1
Favorable Mobility Ratio < 1
24
OIL DISPLACEMENT IN 5-SPOT
Injector
Producer
Oil
Water
Injector
Producer
Oil
Water

0.0
0.1
0.2
0.3
0.4
0.5
0.6
0.7
0.8
0.9
1.0
0.0 0.1 0.2 0.3 0.4 0.5 0.6 0.7 0.8 0.9 1.0water saturation
rela
tive p
erm
krw
kro
wateroil
oilwater
k
kfw
1
1
Sw Krw Kro Fw
0.210 0.000 1.000 0.000
0.231 0.001 0.880 0.066
0.252 0.003 0.768 0.246
0.273 0.006 0.666 0.458
0.293 0.010 0.572 0.636
0.314 0.016 0.487 0.762
0.335 0.023 0.410 0.846
0.355 0.032 0.341 0.900
0.376 0.041 0.279 0.935
0.397 0.052 0.224 0.958
0.417 0.064 0.177 0.973
0.438 0.078 0.136 0.982
0.459 0.093 0.101 0.989
0.480 0.109 0.072 0.993
0.500 0.126 0.049 0.996
0.521 0.145 0.031 0.998
0.542 0.165 0.018 0.999
0.562 0.186 0.009 1.000
0.583 0.209 0.003 1.000
0.604 0.233 0.001 1.000
0.625 0.258 0.000 1.000
Fractional flow of water (Fw):
• The flow rate of water divided by the total flow rate
• A function of krw, kro, µw, µo, γw, γo and dip
Simplified Version
25
FRACTIONAL FLOW
Kr based on same saturations

0.0
0.1
0.2
0.3
0.4
0.5
0.6
0.7
0.8
0.9
1.0
0.0 0.1 0.2 0.3 0.4 0.5 0.6 0.7 0.8 0.9 1.0
water saturation
fractional flow
of
wate
r
MR = 25
MR = 2.5
MR = 0.5
Waterflood volumes for 3 MR's
0
20
40
60
80
100
120
140
160
180
200
0 10 20 30 40 50 60
Oil Recovery, %OOIP
PV
wate
r in
jecte
d
MR = 25
MR = 2.5
MR = 0.25
wro
orw
K
KRatioMobility
*
*
wateroil
oilwater
k
kfw
1
1
26
MOBILITY RATIO AND FRACTIONAL FLOW
Different Path to same ED

OOIPEEEN VIADp Need to understand
• Reservoir
Characteristics
Np – Oil Recovery
ED – Pore to Pore (Unit) Displacement Efficiency
EA – Areal Displacement Efficiency(Mobility Control Mechanism)
EVI – Vertical Displacement Efficiency(Mobility Control Mechanism, Conformance Technologies)
OOIP – Original Oil in Place
27
OIL RECOVERY EQUATION

• Gels – Used to Divert or Eliminate Flow
• simple fracture problems
• fracture network conformance problems
• matrix conformance problems without cross flow
• matrix conformance problems with cross flow
• Key objectives:
- Target vertical sweep efficiency
- Selective injection
- Plug problem zones
28
POLYMER GELS
Application of conformance polymer gels is case specific
and not applicable for all fields

Laboratory Program is Process Dependant
29
DEVELOPING CHEMICAL FORMULATION
Surfactant, Alkali and Water properties
Fluid – Fluid Evaluation
Viable ProcessViable Process
Mechanistic Coreflood Evaluation
Oil Recovery Coreflood Evaluation
Polymer Properties
Viable ProcessViable Process
Quit
UnstableUnstable
No incremental recoveryNo incremental recoverySimulation
IncompatibilityIncompatibility
Economic OilEconomic Oil
Phase 3Phase 2Phase 1

30
OIL RECOVERY COREFLOOD RECOVERY
Gel Development in Appropriate Water
Laboratory Evaluation to Prove Concept using Reservoir Fluids and Core

What is Reservoir Simulation?
• A numerical model of the reservoir
- Correct physics of fluid flow
- Allows for heterogeneous property distribution
- Combination of several methods of analysis
Geologeical Model
Matrial Balance
Fluid Flow Mechanics/Performance
• Allows forecasts/sensitivity analysis of reservoir performance
- Reservoir management
- Process design
- Strategic development planning
- Testing of alternative development options
- Recovery prediction
- Testing of uncertain reservoir parameter
31
NUMERICAL SIMULATION

2. History Matching I – Field Performance
3. History Matching II – Lab/Coreflood Performance 4. Forecasting & Scenario Analyses
32
4 STAGES OF CHEMICAL EOR SIMULATION
1. Geologic/Reservoir Understanding
Geo-model
Well Logs
Seismic
Core Studies
Fluid Analysis
Flow Characteristics
Well Data
PTA
Etc...

History Match Prediction
ASP
Decrease
in Water
Increase in
Oil
Decrease in
Total
Liquids
33
CHEMICAL FLOOD PRODUCTION PROFILE

General Reservoir location identifies:
• Approximate transportation costs
• Facility size constraints
• Additional potential concerns
Laboratory studies identify:
• Water treatment requirements
• Actual chemicals needed
• Chemical costs per volume of each chemical
Simulation (or through other reservoir evaluation methods) identify:
• Approximate volume of chemicals needed
• Production profile for chemical flood profile
• Approximate size of facility needed
• Additional well activity (work over/new drill/conversions)
Objective of Chemical Floods
• Maximize NPV of the project
• Increase Reserves 34
CHEMICAL EOR ECONOMICS

CEOR Economics are better earlier in the life of the project
• Too early is subject to additional risk
- Establish injection/communication between wells
If volume of A + B = A + C, Which option is preferred? better economics?
35
PROJECT ECONOMICS

36
EARLY EOR IMPLEMENTATION
Wyoming, USA
Timing of Minnelusa Chemical Floods
• Cambridge – Secondary flood
• Tanner – Waterflood to 40% oil cut
• Mellott Ranch – 35 year waterflood to 5% oil cut
$2.95 / bbl
$4.49 / bbl
$19.06* / bbl
* premature stoppage of chemical injection

37
SCREENING
DESIGN
IMPLEMENT
• Laboratory Design
• Numerical Simulation, Economics and Field Design
• Facilities Design
• Facilities Construction Oversight
• Operations Planning and Quality Control
• Monitoring Project Performance
• Reservoir Selection and Optimization
STEPS TO FIELD IMPLEMENTATION
Field implementation is a process and depends on successful completion of previous steps

Purpose
• Prepare water for chemical EOR
• Insure alkali, surfactant, and polymer are mixed according
to design specifications
• Insure solution has correct physical characteristics
38
CHEMICAL INJECTION FACILITIES

39
CRESCENT POINT – INSTOW (CANADA) ASP
• Polymer Slicing Unit - polymer
mixing
• Strong Acid ion exchange water
softening
• Oil removal from water
Induced gas flotation – field gas
Walnut shell filter polishing
• Polymer mother solution mixed with
surfactant solution
Static mixer
• Alkali mixed with surfactant-polymer
Static mixer
25 micron filtration

40
INSTOW – ASP FLOOD
Instow:
Saskatchewan, Canada
SPE 155541
ASP area = 50,000 MBBL PV
Mobility Ratio = 6
Permeability = 200 md
Temperature 120oF
Oil API Gravity = 22o
Oil Viscosity = 24 cp
Water beginning August 1959
Alkaline-Surfactant-Polymer flooding beginning
October 2007
0.50 wt% NaOH plus 0.07 wt% ORS-43F plus
1200 mg/l Flopaam 3230S

41
INSTOW – CEOR SCREENING
Highlight of screening:
• Favorable conditions for chemical
EOR
• Excellent analogue fields with lab
studies (Dollard) and field
application (Rapdan)
• Skip small scale pilot
SPE 155541
42
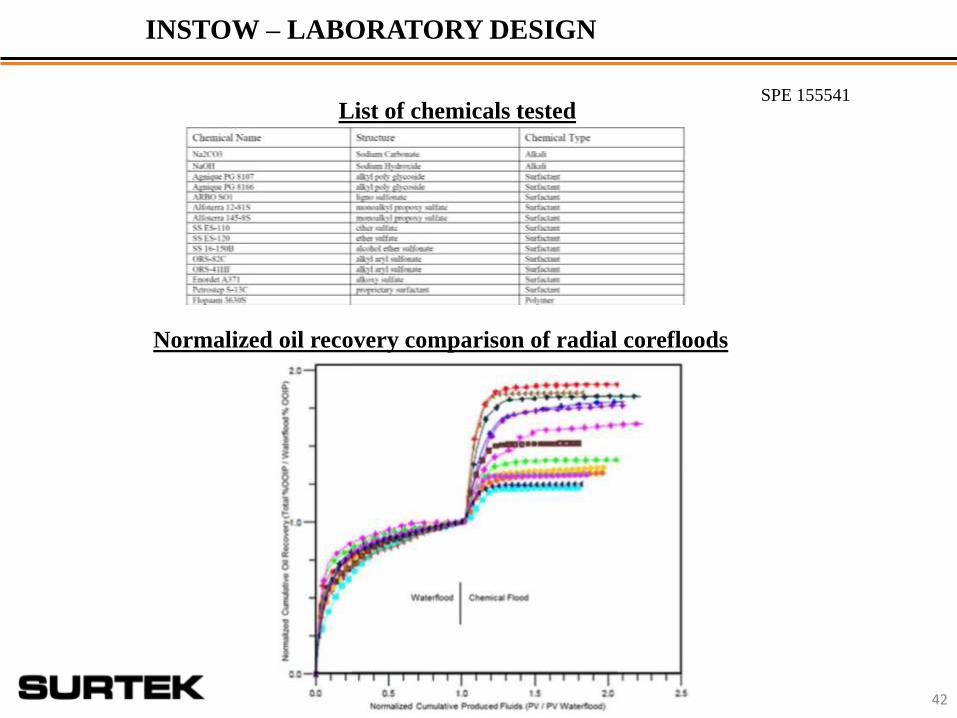
INSTOW – LABORATORY DESIGN
List of chemicals tested
Normalized oil recovery comparison of radial corefloods
SPE 155541

43
INSTOW – LABORATORY DESIGN SIMULATION
SPE 155541

44
INSTOW – HISTORY MATCH
SPE 155541

45
INSTOW – ASP DEVELOPMENT
Calibrated model used to identify:
• Infill wells
• Conversion wells
• Production profile
• Incremental production
SPE 155541

46
LABORATORY

1
10
100
Pse
ud
oR
es
ista
nce
Fa
cto
r(r
ati
o,
10/2
9/2
00
7b
as
e)
Inje
cte
dS
olu
tio
nV
isc
os
ity
fro
mQ
ua
lity
Co
ntr
ol
(cp
)In
jec
ted
So
luti
on
Sc
ree
nF
ac
tor
fro
mQ
uali
tyC
on
tro
l
10
100
1,000
Da
ily
Wa
ter
Inje
cti
on
(bb
l/d
ay
)In
jecti
on
Pre
ssu
re(p
si)
Pseudo Resistance Factor
Fluid Injection Rate
Surface Injection Pressure
Injected Solution Viscosity (cp)
Injected Solution Screen Factor)
So
ften
ed
Inje
cti
onW
ater
Na
2CO
3N
a 2C
O3
-E
OR
209
5
Na 2
CO
3-
EO
R2
095
-Flo
pa
am34
30S
Flo
paa
m3
430
S
Sta
rtW
ate
rF
lus
h
Nowata FRG 702I
Design RF
Target
Injected Solution
Viscosity
Target
Injected Solution
Screen Factor
47
MONITORING PERFORMANCE

Instow 50,000,000 bbl Pilot, Phase 1
48
Oil cut increase from 3% to 11%
Oil rate increase 136%
Mid 1970’s
rates
INSTOW – ASP FLOOD

49
Oil cut increase from 3.3% to 50%Oil rate increase 1,029%
Oil cut increase from 2.7% to 32%Oil rate increase 676%
Oil cut increase from 1.7% to 40%Oil rate increase 600%
INSTOW – ASP FLOOD

50
INSTOW – SIMULATION COMPARISON
SPE 155541

51
INSTOW – ASP FLOOD ISSUES
Injection
• Injectivity loss due permeability reduction, solution viscosity
• Approximately a 40% loss of injectivity
• NaOH pump corrosion
• Injection distribution system
• Alkali destroyed anhydride expoy
• Replace injection distribution system
Production
• No scale production
• Monitor produced fluids pH
• Polymer production
• Adsorption on fire tubes
• Water spray on fire tubes
• Replace fire tubes
• Gas flotation essentially useless
• Shear pump used to reduce viscosity of produced polymer solution
• SAC softener – issues working as the water TDS increased from flood

What happened?
Hole
52
CRESCENT POINT – INSTOW ASP FLOOD

53
WARNER – ASP FLOOD ISSUES
Injection
• Injectivity loss due to scale formation, reduced produced water,
facilities issues related to scale production Approximately a 25% loss of injectivity
Production
• Polymer adsorption on fire tubes – reduced life Water spray bars
Replace fire tubes
• Breakable emulsion with production chemicals
• Shear pump used to reduce viscosity of
produced polymer solution
• Pressure build up in areas of field from changes
inj/pro ratios
• Silicate scale production Attempt to solve with chemicals, reasonable success
o Chemical inhibitors varied with flood progression
– 12 inhibitors
Loss of productivity
Re-drill some wells
Monitor flood production (monthly basis)
o pH, produced water analysis, well head steel
coupon
Pipeline pigging program

54
MINNELUSA – ASP FLOODS
Minnelusa Formation:
Wyoming, USA
Timing of Minnelusa Chemical Floods
• Cambridge – Secondary flood
• Tanner – Waterflood to 40% oil cut
• Mellott Ranch – 35 year waterflood to 5% oil cut

55
CAMBRIDGE – ASP FLOOD
Cambridge:
Wyoming, USA
ASP area = 5,684 MBBL
PV
Mobility Ratio = 2.2 to 5.8
Permeability = 845 md
Oil API Gravity = 20o
Oil Viscosity = 31 cp
ASP Flood began 1993

56
CAMBRIDGE ASP INJECTION PLANT
Na2CO3 Storage
SurfactantStorage
Alkali and Surfactant mixing and filtration
Polymer Storage and Mixing

Cambridge Alkaline-Surfactant-Polymer Injection Plant (1,500 bbl/day plant)
57
CAMBRIDGE FIELD: ASP
58
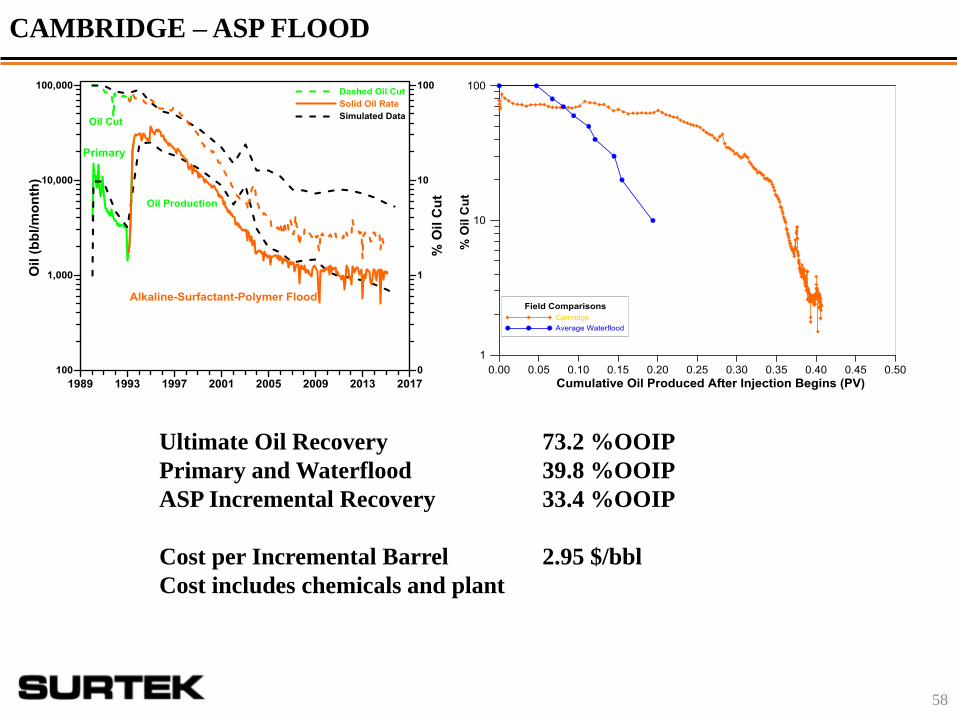
Ultimate Oil Recovery 73.2 %OOIP
Primary and Waterflood 39.8 %OOIP
ASP Incremental Recovery 33.4 %OOIP
Cost per Incremental Barrel 2.95 $/bbl
Cost includes chemicals and plant
CAMBRIDGE – ASP FLOOD

Implementation must be complemented by constant performance monitoring to obtain the desired results
59
MONITORING PERFORMANCE
Polymer Production – Oil Cut
Mobility ControlCambridge
Ion and Chemical
Production
• Good mobility control suggested by
produced polymer coincident with oil bank
• Carbonate production indicator of
neutralization of NaOH injected, calibration
of adsorption isotherm in model
• No Ca production, little scale potential
• Polymer
increases
coincident with
decline in Ca and
Mg good
mobility control
• Carbonate
increases behind
polymer
suggesting
chromatographic
separation

60
TANNER – ASP FLOOD
Tanner:
Wyoming, USA
ASP area = 2,528 MBBL PV
Mobility Ratio = 3.2
Permeability = 200 md
Temperature 175oF
Oil API Gravity = 21o
Oil Viscosity = 11 cp
Waterflood beginning November 1997
Alkaline-Surfactant-Polymer flooding beginning March 2000
1991 1993 1995 1997 1999 2001 2003 2005 2007 2009 2011
1
10
100
% O
il C
ut
1,000
10,000
100,000
Mo
nth
ly O
il P
rod
ucti
on
(b
bls
)
Primary
Waterflood
Alkaline-Surfactant-PolymerFlood
Oil Cut
Oil Production
CalculatedContinuedWaterfloodOil Cut
61
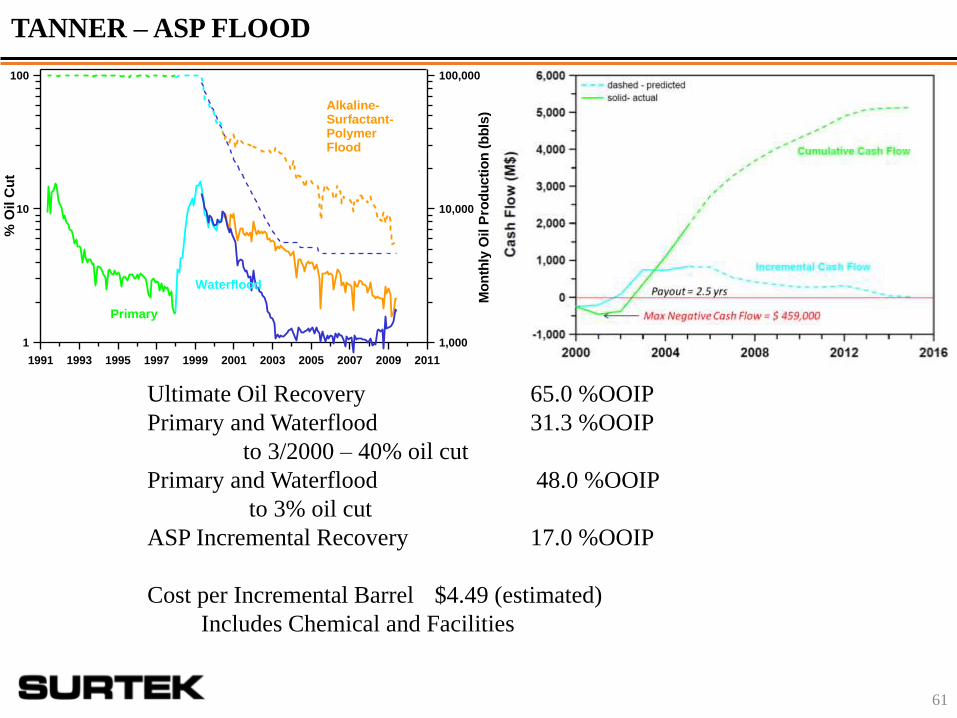
Ultimate Oil Recovery 65.0 %OOIP
Primary and Waterflood 31.3 %OOIP
to 3/2000 – 40% oil cut
Primary and Waterflood 48.0 %OOIP
to 3% oil cut
ASP Incremental Recovery 17.0 %OOIP
Cost per Incremental Barrel $4.49 (estimated)
Includes Chemical and Facilities
TANNER – ASP FLOOD

62
MELLOTT RANCH – ASP FLOOD
Mellott Ranch:
Wyoming, USA
ASP area = 12,200 MBBL PV
Mobility Ratio = 7.6
Permeability = 640 md
Temperature 133oF
Oil API Gravity = 21o
Oil Viscosity = 23 cp
Waterflood beginning December 1965
Alkaline-Surfactant-Polymer flooding beginning August 2000

63
1990 1993 1996 1999 2002 2005 2008 2011
1.0
10.0
100.0
% O
il C
ut
1,000
10,000
100,000
Mon
thly
Oil
an
d W
ate
r P
rod
uct
ion
(b
bls
)
Oil Cut
Oil
Water
Injection
ASP Injection Starts August 2000
Polymer Injection Starts June 2004
Water FlushStarts April 2006
Mellott Ranch Northeast Sand, Northern Wells
34-02, 41-11, and 11-12H Producing
21-11 and 32-1 Injecting

64
RAPDAN – POLYMER FLOOD
Rapdan: Saskatchewan, Canada
Formation Upper ShaunavonDepth 4,590 ftTemperature 131oFPore volume 28,688 MbblOriginal Oil in Place 18,590 MSTBThickness 30 ftAverage Porosity 18%Average Permeability 116 mdReservoir Water Salinity 6,000 mg/LOil API Gravity 23o
Oil Viscosity 10 cpWater Viscosity 0.52 cpMobility Ratio 4.5

65
RAPDAN POLYMER STORAGE AND MIXING

Pore volume 28,688 Mbbl
Original oil in place 18,590 MSTB
Est. primary and waterflood recovery 31.3% OOIP
Est. Ultimate total oil recovery 46.2% OOIP
Polymer flood incremental oil recovery 14.9% OOIP
Final oil saturation 0.349 PV
Chemical cost per incremental barrel of oil $2.05
66
RAPDAN – POLYMER FLOOD
Waterflood Polymer FloodPrimary
Oil Production
Oil Cut
1955 1965 1975 1985 1995 2005
10
100
1,000
10,000
Da
ily
Oil
Pro
du
cti
on
a
nd
Mo
nth
ly S
olu
tio
n I
nje
cti
on
(bb
ls)
0.1
1.0
10.0
100.0
% O
il C
ut
Injection
WaterfloodPolymer Flood
Oil Production
Oil Cut
0 250,000 500,000 750,000 1,000,000 1,250,000 1,500,000
Cumulative Oil, bbl
100
1,000
10,000
Da
ily
Oil
Pro
du
cti
on
(bb
ls)
1.0
10.0
100.0
%O
ilC
ut
Oil Rate
Oil Cut

67
POWNALL RANCH – LOW TENSION FLOOD
Pownall Ranch
Wyoming, USA
Formation Minnelusa B
Depth 7,350 ft
Temperature 170oF
Thickness 7 ft
Pore Volume 4 MMBBL
Average Permeability 22 mD
Porosity 30.7%
Oil API Gravity 26o
Oil Viscosity 8.2 cp
Water Viscosity 0.45 cp
Mobility Ratio 1.3
Timetable
• Primary production: Jan 1976
• Waterflood: Jan 1984
• Alkaline-Surfactant: Feb 1996 – Nov 1996
• Water: Nov 1996+
Injected Solution
• 1.25 wt% NaOH
• 0.2 wt% active Petrostep B-100

68
BIG HORN BASIN – MARCIT POLYMER
Big Horn Basin:
Wyoming, USA
Brine – 5400 mg/LTDS, 640 mg/L hardness, 100 mg/L H2S
Formation Lithology Perm(mD) Thickness(ft) Temp(oF) Spacing
Embar/ carbonate 180-350 20-35 105-140 10-20
Phosporia
Madison carbonate 150-300 120-190 110 20
Tensleep sandstone 30-180 35-85 110-140 10-20

Treatment Summary total wells injection wells production wells
Number Treatments 29 17 12
Incremental Oil (bbls) 3,720,000 3,650,000 63,000
Ave Incr per Treatment (bbls) 128,000 215,000 5,300
Ave Cost per Treatment $44,300 $45,200 $43,100
Ave Cost per bbl $0.34 $0.21 $8.21
% Total Recovery 100 98.3 1.7
69
BIG HORN BASIN – MARCIT POLYMER

Polymer gels can be effective when applied properly
70
POLYMER GELS

Observations for Chemical Flood Application
• A chemical flood will not over come geology.
• If a reservoir can be successfully and efficiently waterflooded,
a well designed chemical system can produce an
incremental oil volume of 10 to 20% of the original oil in place.
• Chemical processes can be economically applied at any stage
in an oil field’s life. Economics are maximized if a project
is implemented during it’s waterflood life.
• Chemical concentrations and slug size are critical.
If concentrations are too low, no incremental oil will be
recovered. If too high, economics will suffer.

Observations for Chemical Flood Application
• Mobility control essential for a successful chemical flood.
If not enough polymer is injected, displaced oil bypassed
and is not recovered.
• Injection of a polymer of too high a molecular weight for the
reservoir being flooded will reduce the affected reservoir size.
• Reservoir rock is probably the most important factor
in the design of a chemical system.
• Low interfacial tensions are required but will not assure
success. Many low interfacial tension systems recovered
no extra oil in laboratory corefloods and field applications.
Chemical systems designed on interfacial tension alone
have a high probability of failure in the field.

What Makes A Successful Flood?
• reservoir engineering and geology
• laboratory evaluation
• numerical simulation
• facilities design
• careful field operations
• monitoring flood performance

• Chemical EOR is field proven technology
• Operators must do their homework to be successful
• CEOR is both technologically and economically successful
• Attention to detail in all phases is critical to succeed
• Planning and implementing a CEOR project is time intensive and
requires a long term view
• Have a “sponsor”
74
CLOSING REMARKS