connections and activity suggestions - naturewatch · connections and activity suggestions...
TRANSCRIPT

49
Connections and Activity Suggestions
Mathematics
The PlantWatch program engages students as active participants in the collection and
analysis of scientifi c data. It provides an opportunity for students to practice using their
observation skills and to make accurate records, as well as to report fi ndings in a scientifi c
manner. Scientists must be able to portray their information in graphs that are easy for
others to understand. The skills listed below all involve mathematics and are transferrable
to other fi elds of study.
SKILLS USED IN PLANTWATCH:
measuring temperature
addition
subtraction
division
graphing
calculating averages
linear measurement
data management
latitude and longitude calculations
Mathematics
Connections and Activity Suggestions
51
Growing Degree Summation (GDS)
Activity 1
After being exposed to a certain amount of heat, a spring wildfl ower will bloom. The concept of growing degree summation (GDS) provides a way to add up how much warmth, or how many heat units, a plant has been exposed to as winter changes to spring and temperatures increase. Some people refer to these units as “growing degree-days.” Although growth in Canada’s wild plants probably begins as soon as temperatures are above zero, we will use 5°C as a base temperature (the minimum temperature at which growth starts)4. This temperature is the standard used in agriculture.
overview
SKILLS
Addition, division, graphing, use of Centigrade temperature scale
MATERIALS
daily newspaper with temperature records, if available
graph paper
calculator (optional)
FOCUS
How much heat does it take for plants to begin to bloom?
SUGGESTED CONNECTIONS:
Key Activity 2, Predicting Seasonal Occurrences (page 11)
Key Activity 4, Reporting to the Class (page 17)
Key Activity 6, Looking Back (page 23)
Science Activity 2, Weather (page 33)
PREPARATION
Review this activity (Mathematics Activity 1, Growing Degree Summation, page 51)
PROCEDURE
1. Calculate the growing degree summation (GDS) for a spring day. This can be done using temperatures published in a local newspaper, and some simple math. Graph average daily temperatures to see how temperatures fl uctuate over a short period of time (i.e. week, month). See Background Information.
2. Calculate the accumulated GDS for the fi rst bloom of your observed plants. Use your daily GDS calculations from #1 above, to determine accumulated GDS.
See Background Information.
BACKGROUND INFORMATION
How to calculate GDS for a spring day
In your area, determine in which spring month the daily high temperatures generally start to go above 10°C. Start your daily calculations on the fi rst of that month.
4 Note: The calculation is done using Centigrade degrees.
CONNECTIONS AND ACTIVITY SUGGESTIONS
52
If you are observing plants in a city, the daily high and low temperatures are generally published in daily newspapers. Use the confi rmed temperatures listed for the previous day.
Determine the daily average (mean) temperature in a location by adding the daytime high (usually occurs in day) and the daytime low temperature (occurs at night) and dividing by 2. Then subtract 5 degrees to determine the GDS (heat units) for that day. If the weather was cool and the average temperature was less than 5°C, then that day had no GDS and does not count in your GDS calculations. (Do not add a negative GDS in your calculations; simply count these as zero GDS.)
Example
High or maximum temperature 15°C
Low or minimum temperature 3°C
Average temperature 15°C + 3°C = 18°C ÷ 2 = 9°C
Degree summation above 5°C 9°C- 5°C = 4 GDS on this date
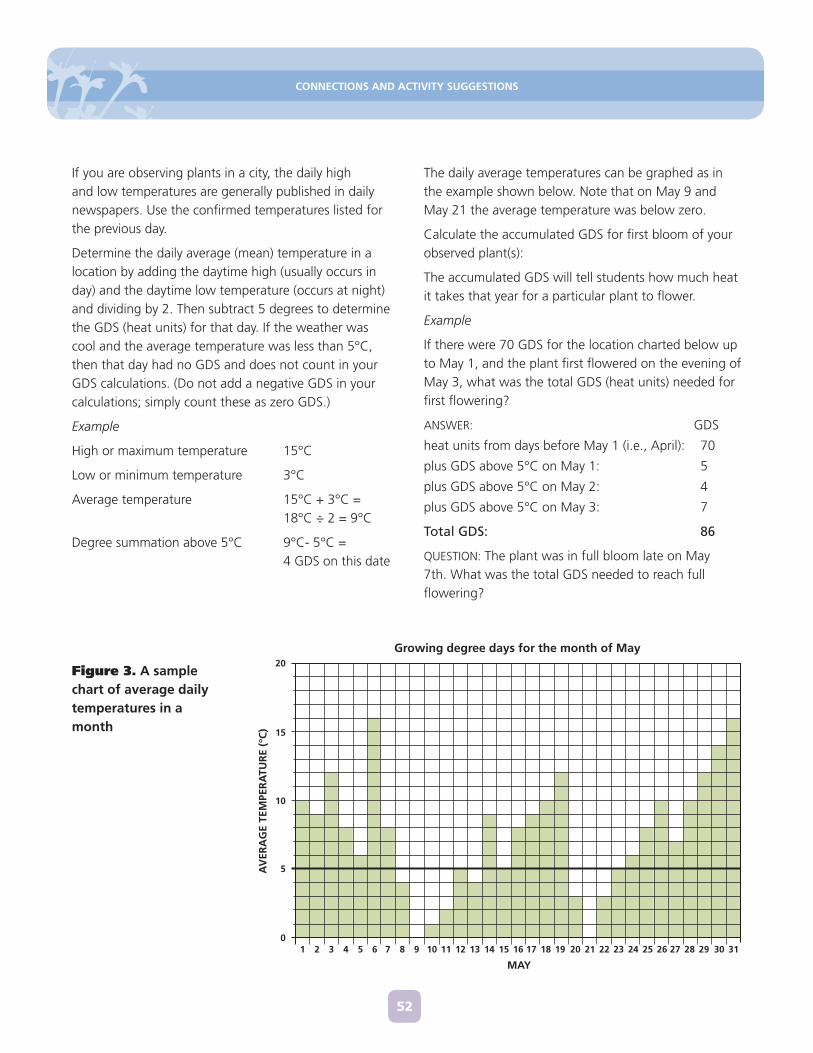
The daily average temperatures can be graphed as in the example shown below. Note that on May 9 and May 21 the average temperature was below zero.
Calculate the accumulated GDS for fi rst bloom of your observed plant(s):
The accumulated GDS will tell students how much heat it takes that year for a particular plant to fl ower.
Example
If there were 70 GDS for the location charted below up to May 1, and the plant fi rst fl owered on the evening of May 3, what was the total GDS (heat units) needed for fi rst fl owering?
ANSWER: GDS
heat units from days before May 1 (i.e., April): 70
plus GDS above 5°C on May 1: 5
plus GDS above 5°C on May 2: 4
plus GDS above 5°C on May 3: 7
Total GDS: 86
QUESTION: The plant was in full bloom late on May 7th. What was the total GDS needed to reach full fl owering?
Figure 3. A sample chart of average daily temperatures in a month
Growing degree days for the month of May20
15
10
5
01 11 214 14 247 17 272 12 225 15 258 18 283 13 236 16 269 19 2910 20 30 31
MAY
AV
ERA
GE
TEM
PER
ATU
RE
(°C
)
Connections and Activity Suggestions
53
CalculatingAverages
Activity 2
To get a good idea of this year’s bloom times in your area, it is best to observe several plants of your selected species. Bloom times vary between individual plants, and it is most accurate to report an average or mean of these fl owering dates. In this exercise you can create a Julian calendar and use the Julian dates to easily average your dates. Report this average to PlantWatch!
overview
SKILLS
Addition, Division
MATERIALS
Paper/pencils or computer with a spreadsheet program
PREPARATION:
Review the Background Information for this activity.
FOCUS
What is the average fl owering date for your PlantWatch species?
SUGGESTED CONNECTIONS
Key Activity 6, Looking Back (page 23)
Science Activity 2, Weather (page 33)
Mathematics Activity 3, Graphing and Mapping (page 55)
PROCEDURE
1. Calculate an average fi rst fl owering date for plants that all fl owered during one month.
2. Calculate the average date of a fl owering stage (for example, fi rst fl owering) for plants, using a Julian calendar.
3. Report your calculations when you send PlantWatch your results! When reporting bloom dates, students should put the average date of the same plant species under the Comments section on the Observation form (e.g., “The average date of fl owering for our fi ve lilacs was May 31.”)
BACKGROUND INFORMATION
Calculate an average fl owering date…
1. For plants that all fl ower during one month
If the observed plants all fl ower during one month, your students can fi nd an average using the days of the month. For example, supposing there are fi ve “fi rst fl owering” dates in May. The calculation is done as follows:
May (15+16+16+17+19) / 5 = 16.6.
This number is rounded off and May 17 is reported as the average fi rst fl owering date.
2. Using a Julian calendar
To easily calculate the average date of a fl owering stage (for example, fi rst fl owering) for plants, the Julian calendar is often used.
Have your students create their own Julian calendar for this year.

CONNECTIONS AND ACTIVITY SUGGESTIONS
54
In the Julian calendar, each day of the year has a number, starting as follows:
January 1 = Julian day 1
February 1 = day 32
March 1 = day 60
December 31 = day 365
This way of calculating dates is very useful when the dates to be averaged span two months.
For example, April 29, May 2 and May 3 converted to Julian dates make averaging a simple mathematical problem. In a leap year (e.g. 2004, 2008, 2012), when we have an extra day, February 29, you need to alter the calendar so that March 1= day 61, and so on, up to December 31= day 366.
Determine the Julian day for each of your plants’ fi rst fl owering date that you recorded. Find the average of these numbers by adding them together and dividing by the number of dates added.
Refer back to your Julian calendar to determine the month and day of this average Julian date.
Example: If the class observed fi ve common purple lilacs in the year 2000 (a leap year), with fi rst fl owering dates of May 28, 30 and 31, and June 2, then the Julian day calculation would be as follows:
May 28 = Julian day 149
May 30 = Julian day 151
May 31 = Julian day 152
June 2 = Julian day 154
June 2 = Julian day 154
Total of Julian dates: (149 + 151 + 152 + 154 + 154) = 760 divided by 5 days = day 152.
Therefore, May 31 is the average fi rst fl owering date for these fi ve common purple lilac shrubs.
Connections and Activity Suggestions
55
Graphingand Mapping
Activity 3
Use your own data or PlantWatch data posted on the Internet to produce graphs and maps of temperatures and bloom dates. Interpret graphs of bloom data from Nova Scotia, Canada and Sucany, Slovakia.
overview
SKILLS
• Data management (students fi nd PlantWatch and weather data on the web, and organize and map data)
• Graphing (students interpret provided graphs, or graphs and maps on the web)
MATERIALS
graph paper or computer, Internet acces
PREPARATION
Review this activity and Mathematics Activity 1.
FOCUS
How to create, read and interpret graphs.
SUGGESTED CONNECTIONS:
Key Activity 4, Reporting to the Class (page 17)
Science Activity 2: Weather (page 33)
Mathematics Activity 1: Growing Degree Summation(page 51)
PROCEDURE
1. Make your own graphs and maps (see page 56)
2. Interpret graphs (see page 57)
3. Read graphs (see page 58)
CONNECTIONS AND ACTIVITY SUGGESTIONS
56
MAKE YOUR OWN GRAPHS AND MAPS
A. Growing degree summation — See Mathematics Activity 1 (page 51) which includes graphing average daily temperatures.
B. Flowering dates — For each PlantWatch species that your students observed create a graph with calendar date and Julian date (see Mathematics Activity 2, page 53) on the x axis and plant number on the y axis. You can graph both fi rst and full bloom on the same graph by using different symbols.
C. Temperatures — Chart the daily high and low temperatures and calculate the mean temperature.
D. Use data on the PlantWatch website — Have students look up the PlantWatch website (www.plantwatch.ca). Log on under “Submit Observations” To download data click on the purple fl oppy disk icon on the top right hand side of the screen. Select a province or territory. The data table lists location, species name, stage (fi rst or mid bloom, or leafi ng), date, notes, etc.
Have your students do the following exercises:
Exercise (i) — Select a plant species, and a growth stage (e.g. fi rst, or mid bloom) and using the location information, plot the most recent year’s observations as dots on a map.
Exercise (ii) — Using the archived data from previous years, map all available data for your selected plant for your area, making a separate map for each year. Make a prediction of bloom times for next spring.
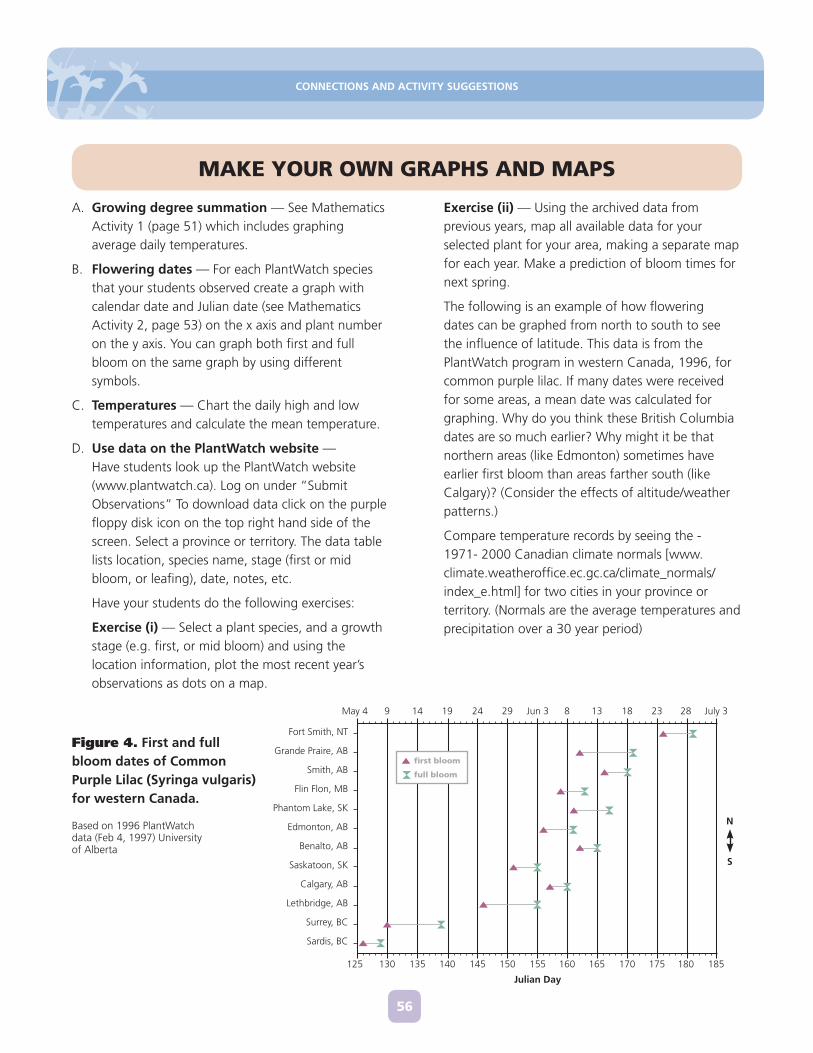
The following is an example of how fl owering dates can be graphed from north to south to see the infl uence of latitude. This data is from the PlantWatch program in western Canada, 1996, for common purple lilac. If many dates were received for some areas, a mean date was calculated for graphing. Why do you think these British Columbia dates are so much earlier? Why might it be that northern areas (like Edmonton) sometimes have earlier fi rst bloom than areas farther south (like Calgary)? (Consider the effects of altitude/weather patterns.)
Compare temperature records by seeing the - 1971- 2000 Canadian climate normals [www.climate.weatheroffi ce.ec.gc.ca/climate_normals/index_e.html] for two cities in your province or territory. (Normals are the average temperatures and precipitation over a 30 year period)
Figure 4. First and full bloom dates of Common Purple Lilac (Syringa vulgaris) for western Canada.
Based on 1996 PlantWatch data (Feb 4, 1997) University of Alberta
May 4 9 14 19 24 29 Jun 3 8 13 18 23 28 July 3
125 130 135 140 145 150 155 160 165 170 175 180 185
Fort Smith, NT
Grande Praire, AB
Smith, AB
Flin Flon, MB
Phantom Lake, SK
Edmonton, AB
Benalto, AB
Saskatoon, SK
Calgary, AB
Lethbridge, AB
Surrey, BC
Sardis, BC
Julian Day
N
S
fi rst bloom
full bloom
CONNECTIONS AND ACTIVITY SUGGESTIONS
57
INTERPRET GRAPHS
Nova Scotia student phenology reports, 1910-1923 (an Internet activity)
The Nova Scotia Museum of Natural History has posted a fascinating database of phenology information from eastern Canada in the fi rst quarter of this century. Alexander H. MacKay was secretary for the Botanical Club of Canada, as well as superintendent of Education for Nova Scotia. He coordinated a phenology survey for that province from 1891-1927. Students and teachers recorded the dates when the fl owers of many native and cultivated plants were fi rst seen and becoming common. Many of the plants that were surveyed in this early Nova Scotia study are now also used by PlantWatch!
Find the website: https://thousandeyes.ca/english_en/graphing.php for the following exercises.
Exercise (i)
• Under “Time series” select Trembling Aspen (Populus tremuloides). Select the county “Annapolis”. Select the belt: “Low inlands”. Click “Show me”. Scroll over the top left hand corner of the graph image. A pop up will allow you to save or print the image or, right click on the image and click “Save picture as” and select where you would like to save the image to your computer.
- Change the subject to Common purple lilac (Syringa vulgaris). Follow the instructions to save or print the image.
- Repeat for Indian Pear (Amelanchier spp.), which is the Nova Scotia name for saskatoon or serviceberry.
• Use the graphs to answer the following question:
Which graphs show more variability in fl owering time reported within a single year (ie which shows the most large blue bars)?
ANSWER: Trembling aspen has the least years of data, and the largest bars (most variability between minimum and maximum fl owering dates reported that year). In some cases the error bars are small because there is only one site for that date. Lilac dates have short and large error bars. Indian pear has very short bars
demonstrating a small amount of variability in fi rst bloom dates from the various schools participating in the survey.
Exercise (ii)
This exercise shows users “fi rst bloom” for key PlantWatch species.
• Go back to https://thousandeyes.ca/english_en/graphing.php
• Under “Interspecies plots”, select “Indian pear” as Subject 1. Select “Dandelion” as Subject 2. Select “Lunenburg” as the county, and press “Show me”.
• Change the belt to “Coast”. It is important the belt is listed as “Coast”. The default is “Low Inlands” and will show a different graph.
Use the graph to answer the following questions.
A. Which graphs shows more variability in fl owering time (the difference between the earliest and latest fl owering date recorded) between different years, Indian pear or dandelion?
ANSWER: The Julian Day of fi rst fl owering for Indian pear ranges from Julian Day 121 in 1901 to 144 in 1917 (23 days difference), whereas dandelion ranges from 108 in 1914 to 135 in 1923, (27 days difference). Therefore, the dandelion shows more variability in fl owering time between years than the wild pear.
B. Which of these 2 species blooms earliest? (ANSWER; dandelion) Is the trend similar between years for the 2 species? (ANSWER; yes, their lines follow each other).
For which year is the trend very different between these 2 species? (ANSWER; from 1916 to 1917, dandelion bloom earlier in 1917, but Indian pear later) Knowing that plants bloom in response to how warm the weather is, what weather event might have happened in 1917, after dandelion bloomed and before Indian pear bloomed? (ANSWER; snowstorm or cold snap)
CONNECTIONS AND ACTIVITY SUGGESTIONS
58
READING A GRAPH
Lilac fl owering dates in Slovakia
Flowering in shrubs and trees occurs in response to the air temperatures at the height of their branches. Many countries in Europe have a long history of recording the timing of plant development, with several centuries of data. The following graph of lilac fl owering times and temperature was kindly provided by Dr. Olga Braslavska, former phenologist for the Slovak Hydrometeorological Institute. (In Canada, we have several phenology data sets going back to the 1890s.)
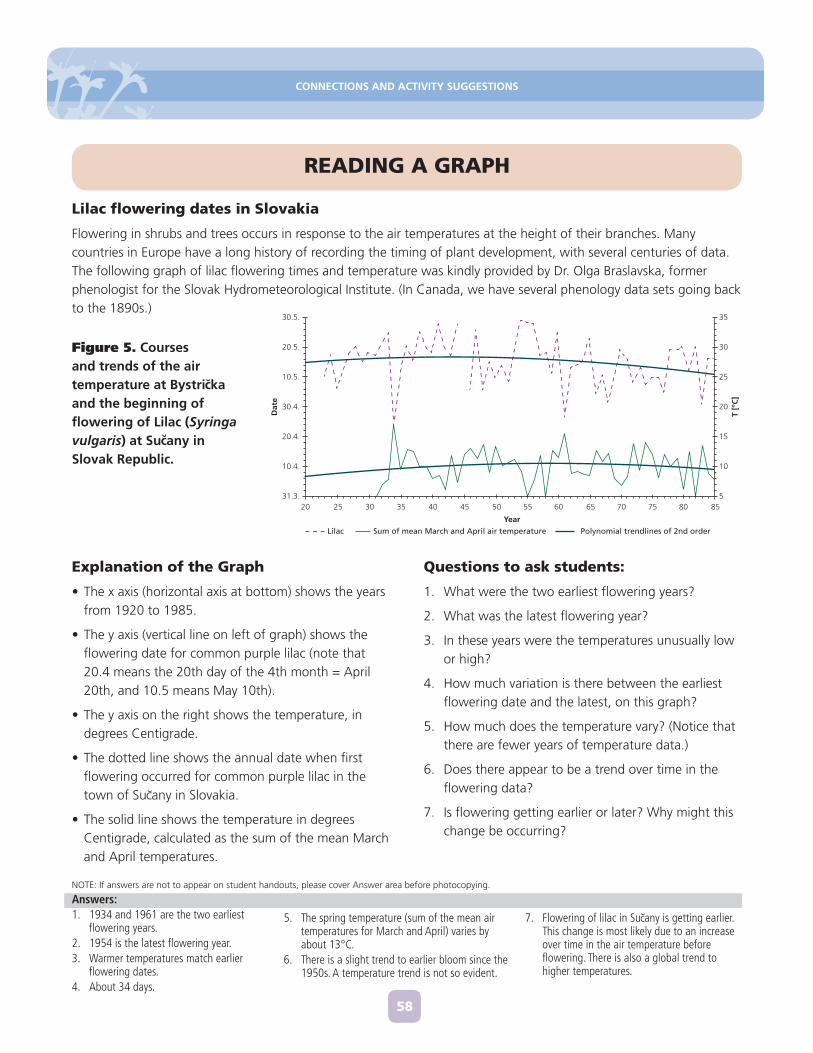
Figure 5. Courses and trends of the air temperature at Bystri kaand the beginning of fl owering of Lilac (Syringa vulgaris) at Su any in Slovak Republic.
Explanation of the Graph
• The x axis (horizontal axis at bottom) shows the years from 1920 to 1985.
• The y axis (vertical line on left of graph) shows the fl owering date for common purple lilac (note that 20.4 means the 20th day of the 4th month = April 20th, and 10.5 means May 10th).
• The y axis on the right shows the temperature, in degrees Centigrade.
• The dotted line shows the annual date when fi rst fl owering occurred for common purple lilac in the town of Su any in Slovakia.
• The solid line shows the temperature in degrees Centigrade, calculated as the sum of the mean March and April temperatures.
Questions to ask students:
1. What were the two earliest fl owering years?
2. What was the latest fl owering year?
3. In these years were the temperatures unusually low or high?
4. How much variation is there between the earliest fl owering date and the latest, on this graph?
5. How much does the temperature vary? (Notice that there are fewer years of temperature data.)
6. Does there appear to be a trend over time in the fl owering data?
7. Is fl owering getting earlier or later? Why might this change be occurring?
Answers:1. 1934 and 1961 are the two earliest
fl owering years.2. 1954 is the latest fl owering year.3. Warmer temperatures match earlier
fl owering dates.4. About 34 days.
NOTE: If answers are not to appear on student handouts, please cover Answer area before photocopying.
5. The spring temperature (sum of the mean air temperatures for March and April) varies by about 13°C.
6. There is a slight trend to earlier bloom since the 1950s. A temperature trend is not so evident.
7. Flowering of lilac in Su any is getting earlier. This change is most likely due to an increase over time in the air temperature before fl owering. There is also a global trend to higher temperatures.
30.5.
20.5.
10.5.
30.4.
20.4.
10.4.
31.3.
35
30
25
20
15
10
5
T [º
C]
Dat
e
YearLilac Sum of mean March and April air temperature Polynomial trendlines of 2nd order
20 4525 50 7030 55 7535 60 8040 65 85
Connections and Activity Suggestions
59
Latitude and Longitude: How to Calgulate our Global Address
Activity 4
In order to use your students’ fl owering dates, PlantWatch research scientists need to know the location of all the PlantWatch plants in latitude and longitude. If all the plants are within 100 m and 50 m elevation of one another, one location can be reported for all your students’ observations. Using a GPS (Global Positioning System) instrument to determine the location of the plants is a quick method of getting a location.
The following introductory exercise will help your students use a map to determine the precise location of their plants and convert their location in degrees and minutes to decimal form, the form most useful to PlantWatch scientists. This straightforward exercise, which takes 15-30 minutes to complete, is an excellent way to introduce the concepts of latitude and longitude to your students.
overview
SKILLS
Addition, division, using decimals, fi nding points on a map using grid co-ordinates, identifi ying latitude and longitude
MATERIALS
Photocopies of the fi gure and tables from this activity for your class.
Detailed map of your PlantWatch area with both latitude and longitude and degrees and minutes (see ‘Finding the Latitude and Longitude of a Particular Place’ in this activity for more details on maps and where to get them).
Access to a website where students can double check their locations. (See ‘To Check Calculations’ in this activity for more details).
PREPARATION
Review this activity.
Order maps if necessary.
FOCUS
What is the global address of your observed plants?
SUGGESTED CONNECTIONS
Key Activity 3, Locating and Tagging the Plants(page 13)
Key Activity 4, Reporting to the Class (page 17)
Key Activity 6, Looking Back (page 23)
Mathematics Activity 3, Graphing and Mapping (page 55)
Social Studies Activity 1, Geography and People (page 69)
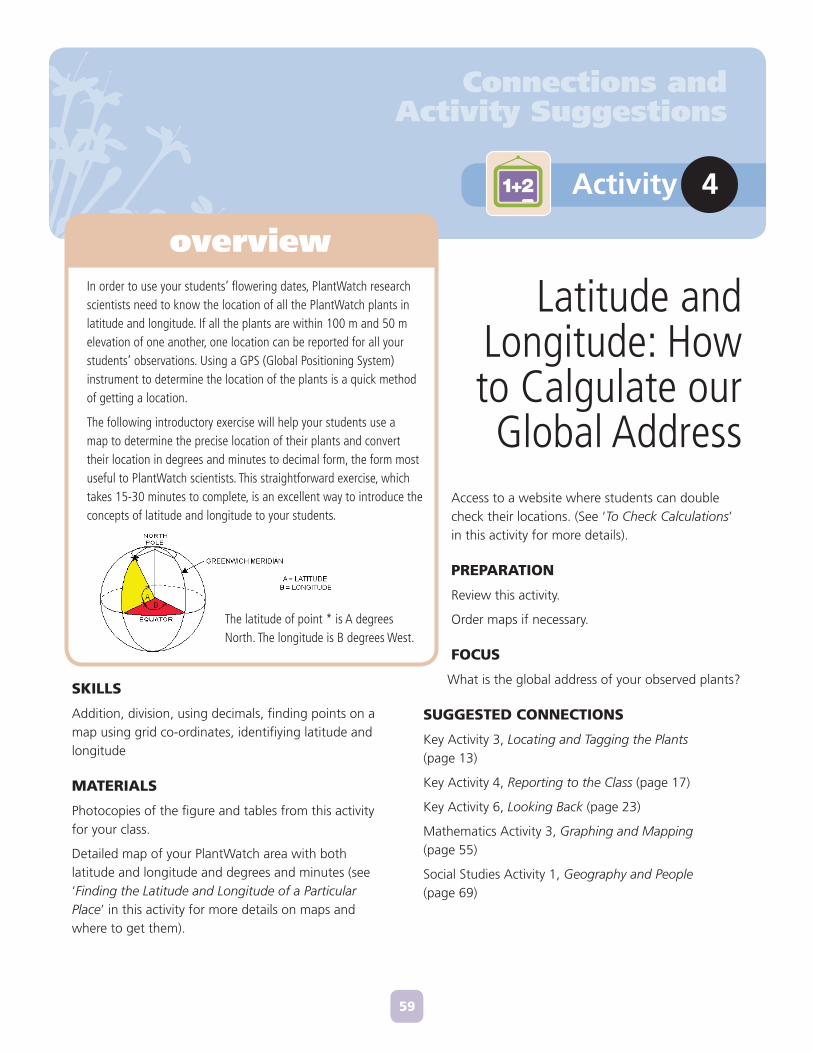
The latitude of point * is A degrees North. The longitude is B degrees West.
CONNECTIONS AND ACTIVITY SUGGESTIONS
60
PROCEDURE
1. Find the Latitude and Longitude of a particular place.
2. Using the fi gure and instructions in this activity, have your students complete the latitude and longitude exercise.
3. Check Calculations.
BACKGROUND INFORMATION
What is Latitude and Longitude?
A simple activity, using an orange to represent the Earth, is available at Orange Globe <http://octopus.gma.org/space1/orange.html>. In the same way that a street and an avenue specify a particular intersection in a city or town, latitude and longitude can be used as grid coordinates to locate any point on Earth. By using degrees and minutes of latitude and longitude, your students can describe the location of their plants within about 1.5 kilometres, or about 1 mile.
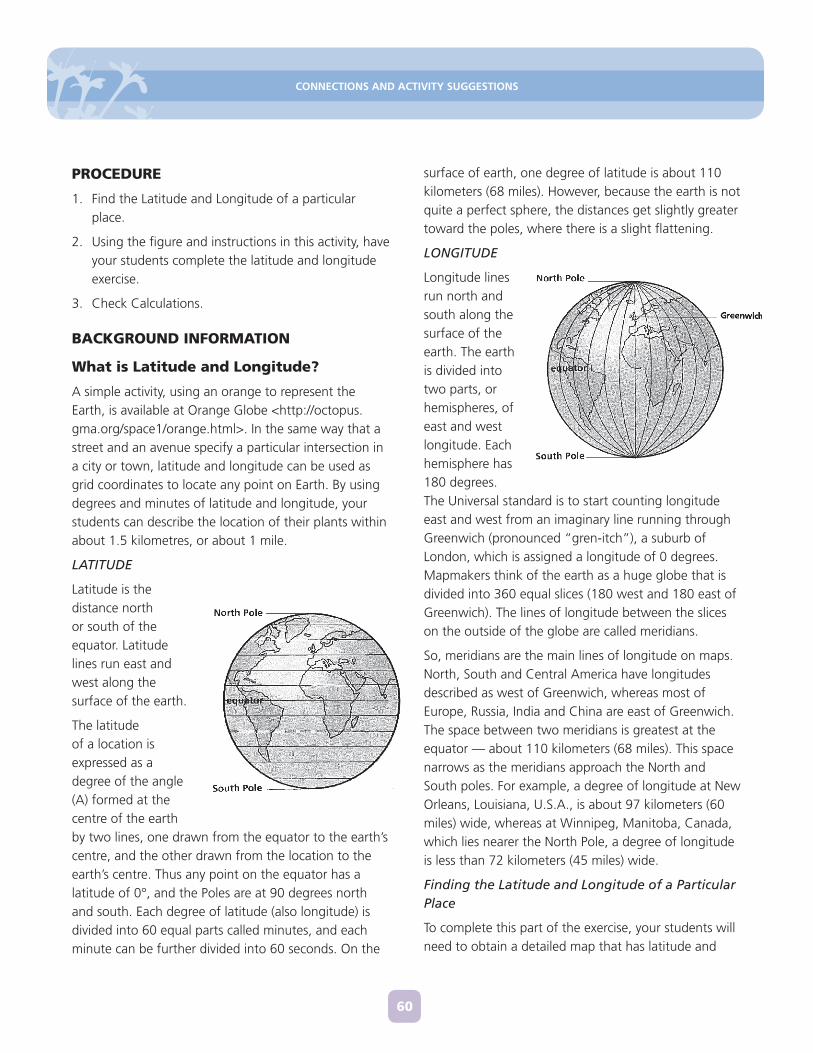
LATITUDE
Latitude is the distance north or south of the equator. Latitude lines run east and west along the surface of the earth.
The latitude of a location is expressed as a degree of the angle (A) formed at the centre of the earth by two lines, one drawn from the equator to the earth’s centre, and the other drawn from the location to the earth’s centre. Thus any point on the equator has a latitude of 0°, and the Poles are at 90 degrees north and south. Each degree of latitude (also longitude) is divided into 60 equal parts called minutes, and each minute can be further divided into 60 seconds. On the
surface of earth, one degree of latitude is about 110 kilometers (68 miles). However, because the earth is not quite a perfect sphere, the distances get slightly greater toward the poles, where there is a slight fl attening.
LONGITUDE
Longitude lines run north and south along the surface of the earth. The earth is divided into two parts, or hemispheres, of east and west longitude. Each hemisphere has 180 degrees. The Universal standard is to start counting longitude east and west from an imaginary line running through Greenwich (pronounced “gren-itch”), a suburb of London, which is assigned a longitude of 0 degrees. Mapmakers think of the earth as a huge globe that is divided into 360 equal slices (180 west and 180 east of Greenwich). The lines of longitude between the slices on the outside of the globe are called meridians.
So, meridians are the main lines of longitude on maps. North, South and Central America have longitudes described as west of Greenwich, whereas most of Europe, Russia, India and China are east of Greenwich. The space between two meridians is greatest at the equator — about 110 kilometers (68 miles). This space narrows as the meridians approach the North and South poles. For example, a degree of longitude at New Orleans, Louisiana, U.S.A., is about 97 kilometers (60 miles) wide, whereas at Winnipeg, Manitoba, Canada, which lies nearer the North Pole, a degree of longitude is less than 72 kilometers (45 miles) wide.
Finding the Latitude and Longitude of a Particular Place
To complete this part of the exercise, your students will need to obtain a detailed map that has latitude and
CONNECTIONS AND ACTIVITY SUGGESTIONS
61
longitude in both degrees and minutes. On a small-scale map (like those found in many atlases, where the scale may be 1:1,000,000), which covers a large area of the Northern Hemisphere, too much detail is lost to provide enough accuracy for this work. 1:50,000 maps are available from provincial or federal map offi ces and private map retailers. See Appendix 3 for the website to locate these offi ces and businesses. Most universities also maintain an extensive map library.
1. Have your students see what is already marked on their maps:
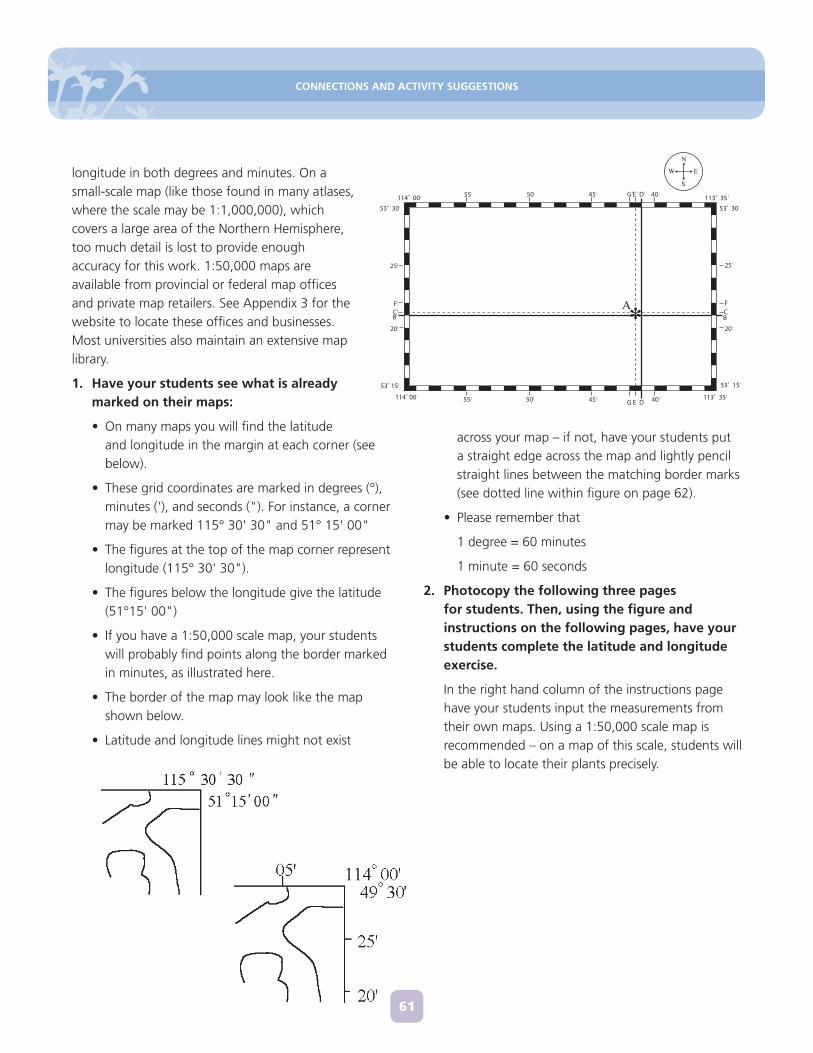
• On many maps you will fi nd the latitude and longitude in the margin at each corner (see below).
• These grid coordinates are marked in degrees (°), minutes ('), and seconds ("). For instance, a corner may be marked 115° 30' 30" and 51° 15' 00"
• The fi gures at the top of the map corner represent longitude (115° 30' 30").
• The fi gures below the longitude give the latitude (51°15' 00")
• If you have a 1:50,000 scale map, your students will probably fi nd points along the border marked in minutes, as illustrated here.
• The border of the map may look like the map shown below.
• Latitude and longitude lines might not exist
across your map – if not, have your students put a straight edge across the map and lightly pencil straight lines between the matching border marks (see dotted line within fi gure on page 62).
• Please remember that
1 degree = 60 minutes
1 minute = 60 seconds
2. Photocopy the following three pages for students. Then, using the fi gure and instructions on the following pages, have your students complete the latitude and longitude exercise.
In the right hand column of the instructions page have your students input the measurements from their own maps. Using a 1:50,000 scale map is recommended – on a map of this scale, students will be able to locate their plants precisely.
25
113˚ 35
53˚ 30
114˚ 00
53˚ 30
53˚ 15
113˚ 35
20
F
BC
25
20
F
BC
40455055
40455055
114˚ 00
53˚ 15
G E D
G E D
*A
N
S
W E
CONNECTIONS AND ACTIVITY SUGGESTIONS
62
25
113˚
35
53˚
30
114˚
00
53˚
30
53˚
15
113˚
3520F BC
25 20F BC
4045
5055
4045
5055
114˚
00
53˚ 1
5
GE
D
GE
D*A
N S
WE
CONNECTIONS AND ACTIVITY SUGGESTIONS
63
EXAMPLE INPUT YOUR VALUES HERE
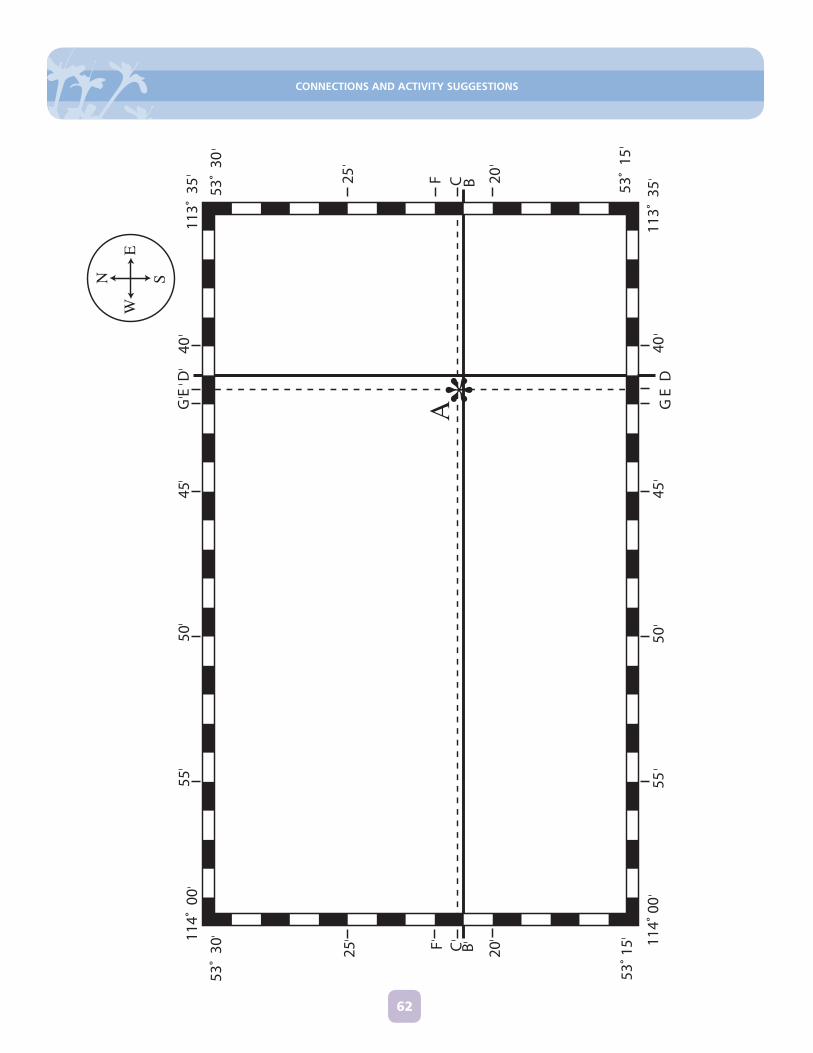
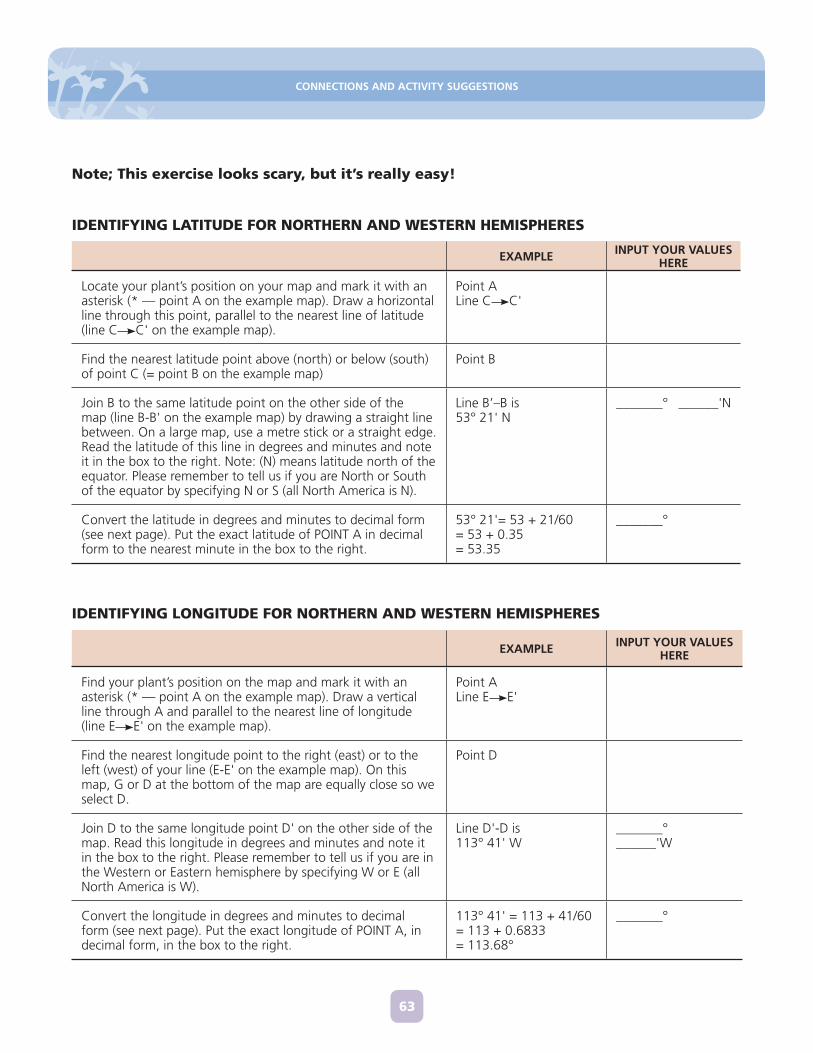
Locate your plant’s position on your map and mark it with an asterisk (* — point A on the example map). Draw a horizontal line through this point, parallel to the nearest line of latitude (line C C' on the example map).
Point ALine C C'
Find the nearest latitude point above (north) or below (south) of point C (= point B on the example map)
Point B
Join B to the same latitude point on the other side of the map (line B-B' on the example map) by drawing a straight line between. On a large map, use a metre stick or a straight edge. Read the latitude of this line in degrees and minutes and note it in the box to the right. Note: (N) means latitude north of the equator. Please remember to tell us if you are North or South of the equator by specifying N or S (all North America is N).
Line B’–B is53° 21' N
_______° ______'N
Convert the latitude in degrees and minutes to decimal form (see next page). Put the exact latitude of POINT A in decimal form to the nearest minute in the box to the right.
53° 21'= 53 + 21/60= 53 + 0.35= 53.35
_______°
Note; This exercise looks scary, but it’s really easy!
IDENTIFYING LATITUDE FOR NORTHERN AND WESTERN HEMISPHERES
EXAMPLE INPUT YOUR VALUES HERE
Find your plant’s position on the map and mark it with an asterisk (* — point A on the example map). Draw a vertical line through A and parallel to the nearest line of longitude (line E E' on the example map).
Point ALine E E'
Find the nearest longitude point to the right (east) or to the left (west) of your line (E-E' on the example map). On this map, G or D at the bottom of the map are equally close so we select D.
Point D
Join D to the same longitude point D' on the other side of the map. Read this longitude in degrees and minutes and note it in the box to the right. Please remember to tell us if you are in the Western or Eastern hemisphere by specifying W or E (all North America is W).
Line D'-D is113° 41' W
_______° ______'W
Convert the longitude in degrees and minutes to decimal form (see next page). Put the exact longitude of POINT A, in decimal form, in the box to the right.
113° 41' = 113 + 41/60= 113 + 0.6833= 113.68°
_______°
IDENTIFYING LONGITUDE FOR NORTHERN AND WESTERN HEMISPHERES
CONNECTIONS AND ACTIVITY SUGGESTIONS
64
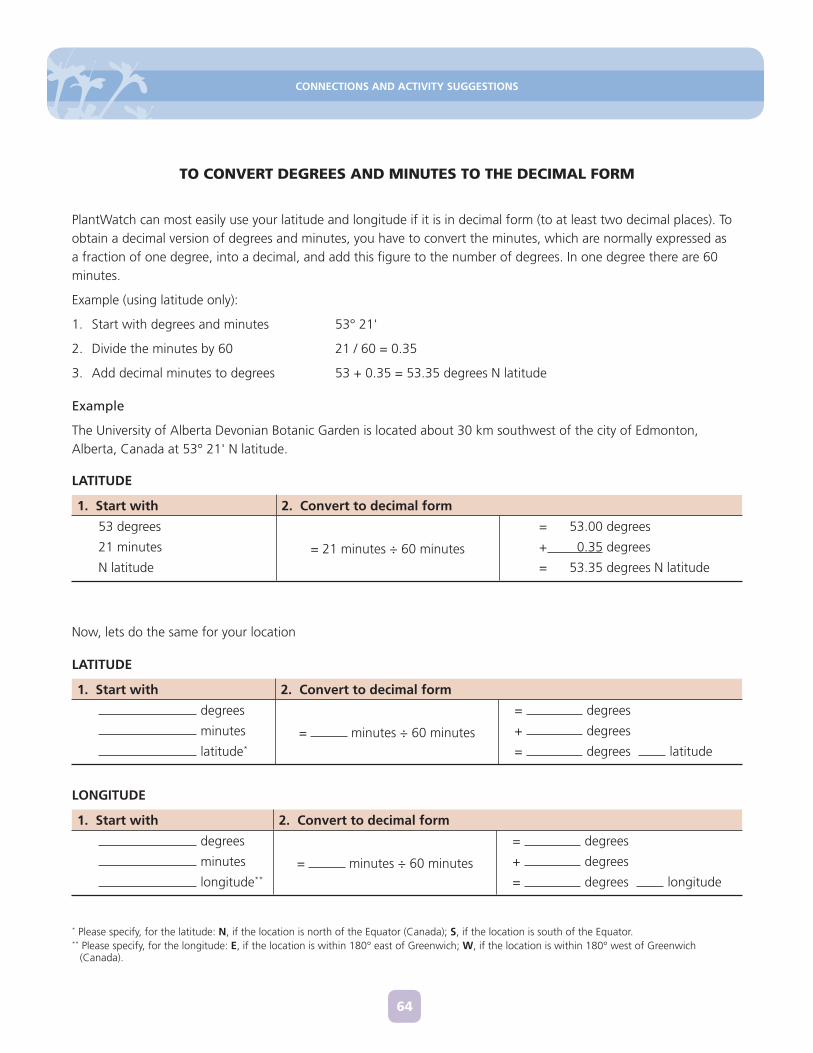
PlantWatch can most easily use your latitude and longitude if it is in decimal form (to at least two decimal places). To obtain a decimal version of degrees and minutes, you have to convert the minutes, which are normally expressed as a fraction of one degree, into a decimal, and add this fi gure to the number of degrees. In one degree there are 60 minutes.
Example (using latitude only):
1. Start with degrees and minutes 53° 21'
2. Divide the minutes by 60 21 / 60 = 0.35
3. Add decimal minutes to degrees 53 + 0.35 = 53.35 degrees N latitude
Example
The University of Alberta Devonian Botanic Garden is located about 30 km southwest of the city of Edmonton, Alberta, Canada at 53° 21' N latitude.
TO CONVERT DEGREES AND MINUTES TO THE DECIMAL FORM
* Please specify, for the latitude: N, if the location is north of the Equator (Canada); S, if the location is south of the Equator.** Please specify, for the longitude: E, if the location is within 180° east of Greenwich; W, if the location is within 180° west of Greenwich
(Canada).
LATITUDE
LATITUDE
LONGITUDE
1. Start with 2. Convert to decimal form
53 degrees
21 minutes
N latitude= 21 minutes ÷ 60 minutes
= 53.00 degrees
+ 0.35 degrees
= 53.35 degrees N latitude
1. Start with 2. Convert to decimal form
degrees
minutes
latitude*
= minutes ÷ 60 minutes
= degrees
+ degrees
= degrees latitude
1. Start with 2. Convert to decimal form
degrees
minutes
longitude**
= minutes ÷ 60 minutes
= degrees
+ degrees
= degrees longitude
Now, lets do the same for your location
CONNECTIONS AND ACTIVITY SUGGESTIONS
65
3. To Check Calculations
There are many references and websites where students may be able to fi nd their locations. If possible fi nd the locations using degrees, minutes and seconds, or decimal degrees with 2-4 decimal places.
Try some of the following websites to check your students’ calculations.
• Google Earth: http://earth.google.com/
• Lat/long look up tool in PlantWatch “submit observations page” (see instructions in Key Activity 5)
• Query Canadian Geographical Names — search tool provided by Natural Resources Canada to identify lat/longs for Canadian towns and cities http://geonames.nrcan.gc.ca/index_e.php
When you get the results of the search, click on “info” to see more information including latitude and longitude.
USING A GLOBAL POSITIONING SYSTEM
A description of GPS and how they work can be found at www.ec.gc.ca/geocache/default.asp?lang=en&n=1BC7DC7B. This is an excellent site on Geocaching which invites schools to participate. High schools throughout Canada are encouraged to research their watershed and develop reports or stories to build geocaches. The students then hide these for the “geocacher" community to discover – passing along their knowledge for others to fi nd.
CONGRATULATIONS!
Students now can send PlantWatch research scientists their plant locations. They can use the location form (see ‘register a new location’ once logged in) on the webpage www.plantwatch.ca.

CONNECTIONS AND ACTIVITY SUGGESTIONS
66
Notes